
Near-Infrared Hyperspectral Imaging (NIR-HSI) for Nondestructive Prediction of Anthocyanins Content in Black Rice Seeds

 , ,
, ,  ,
, 
 and
and 
Abstract
1. Introduction
2. Materials and Methods
2.1. Rice Sample
2.2. NIR Hyperspectral Imaging System
2.3. NIR-HSI Data Acquisition and Extraction
2.4. Data Pre-Processing
2.5. High-Performance Liquid Chromatography (HPLC) Test for Reference Analysis
2.6. Model Development
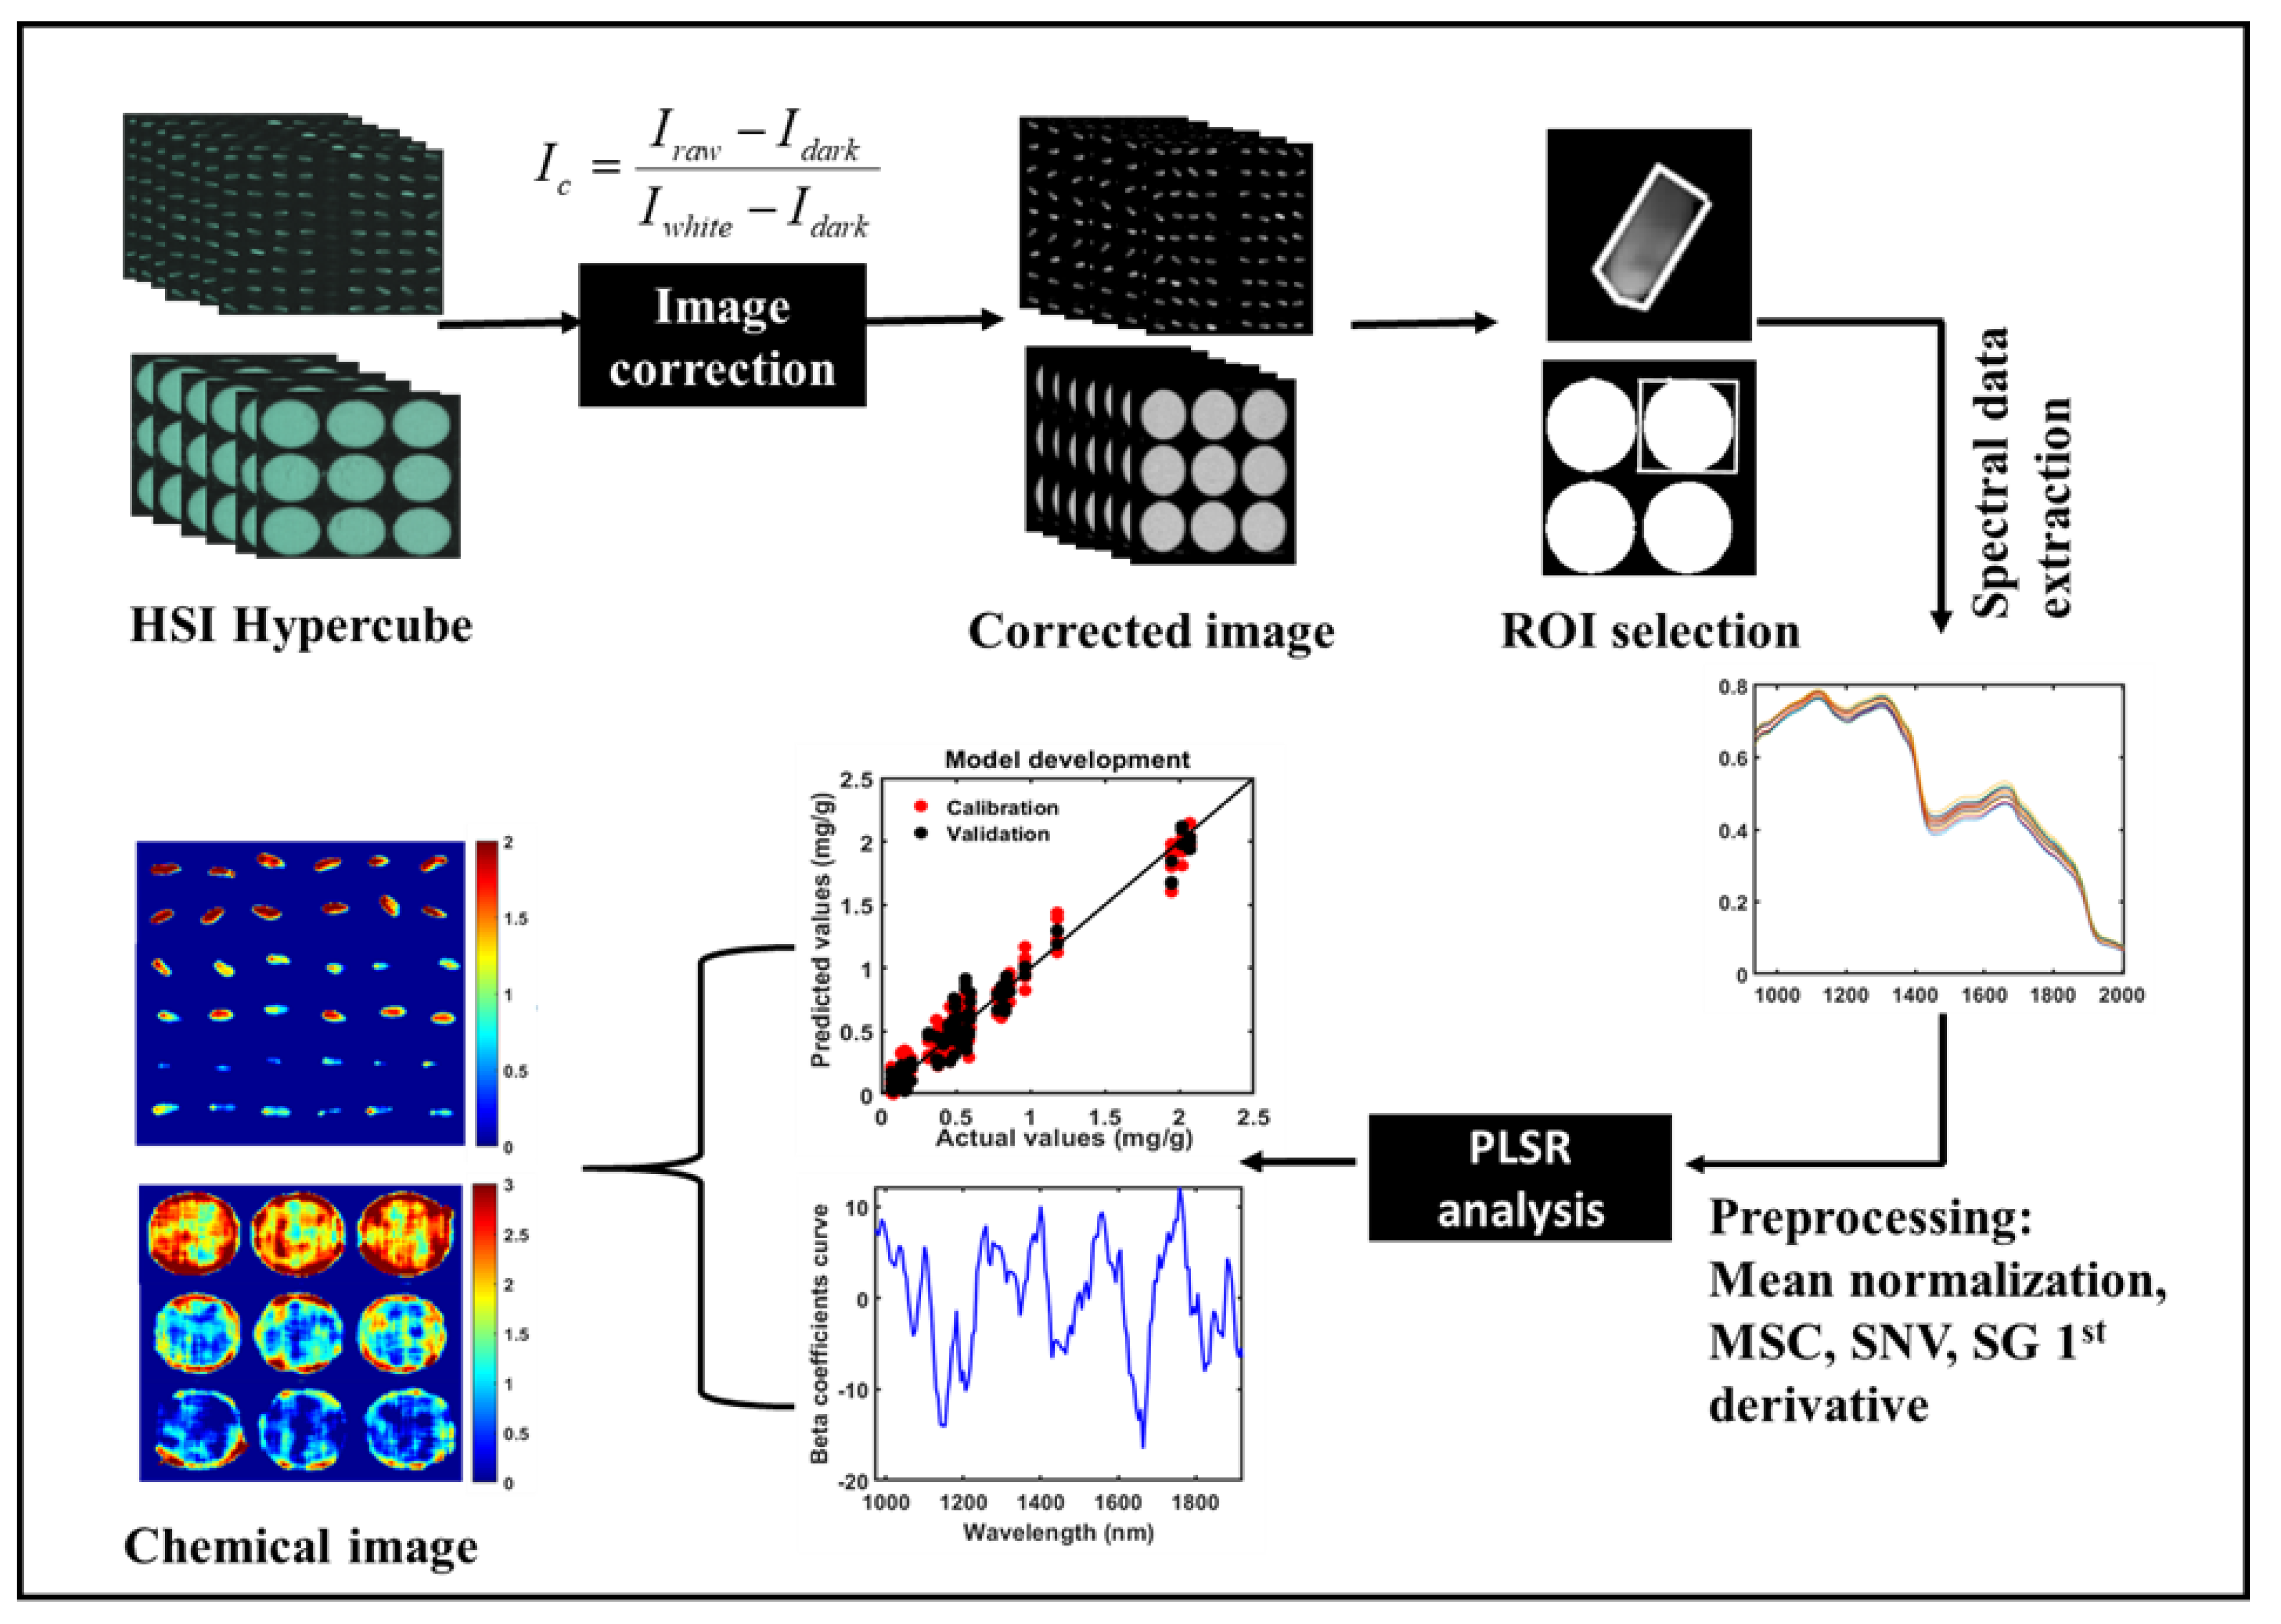
2.7. Image Processing
3. Results and Discussion
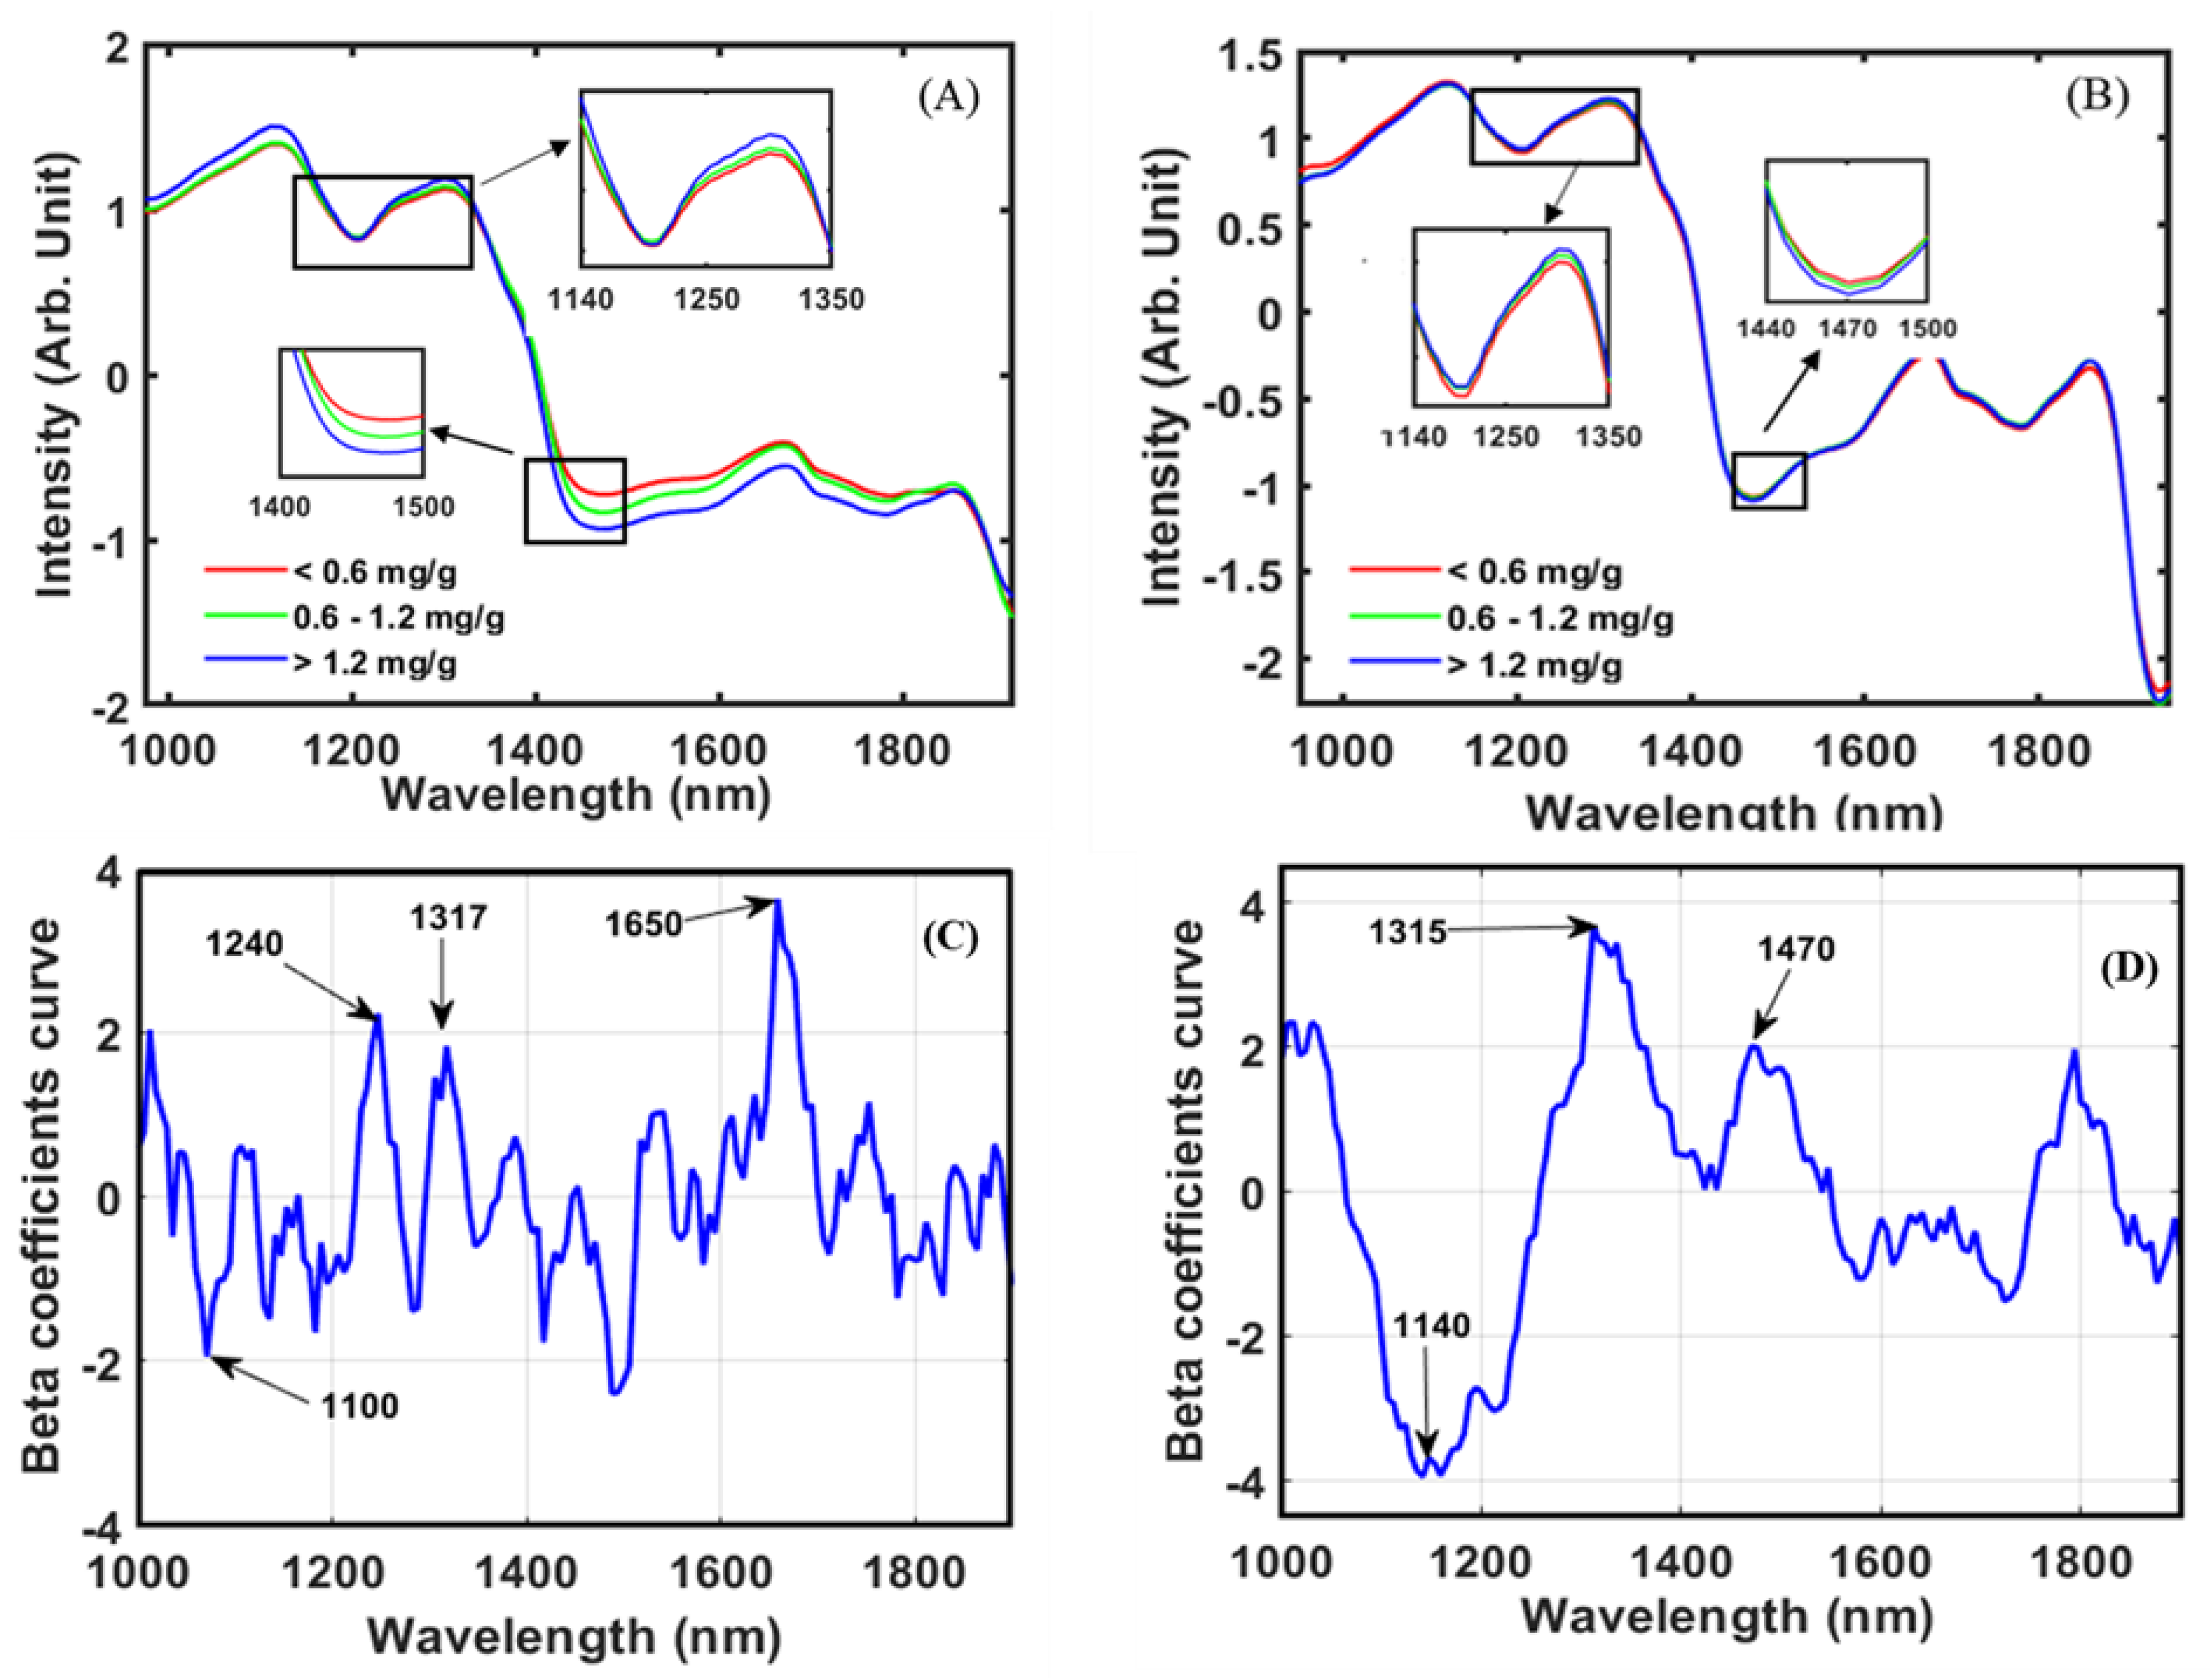
3.1. The Spectral Characteristic of Black Rice
3.2. High-Performance Liquid Chromatography (HPLC) Result
3.3. Partial Least Square Regression (PLSR)
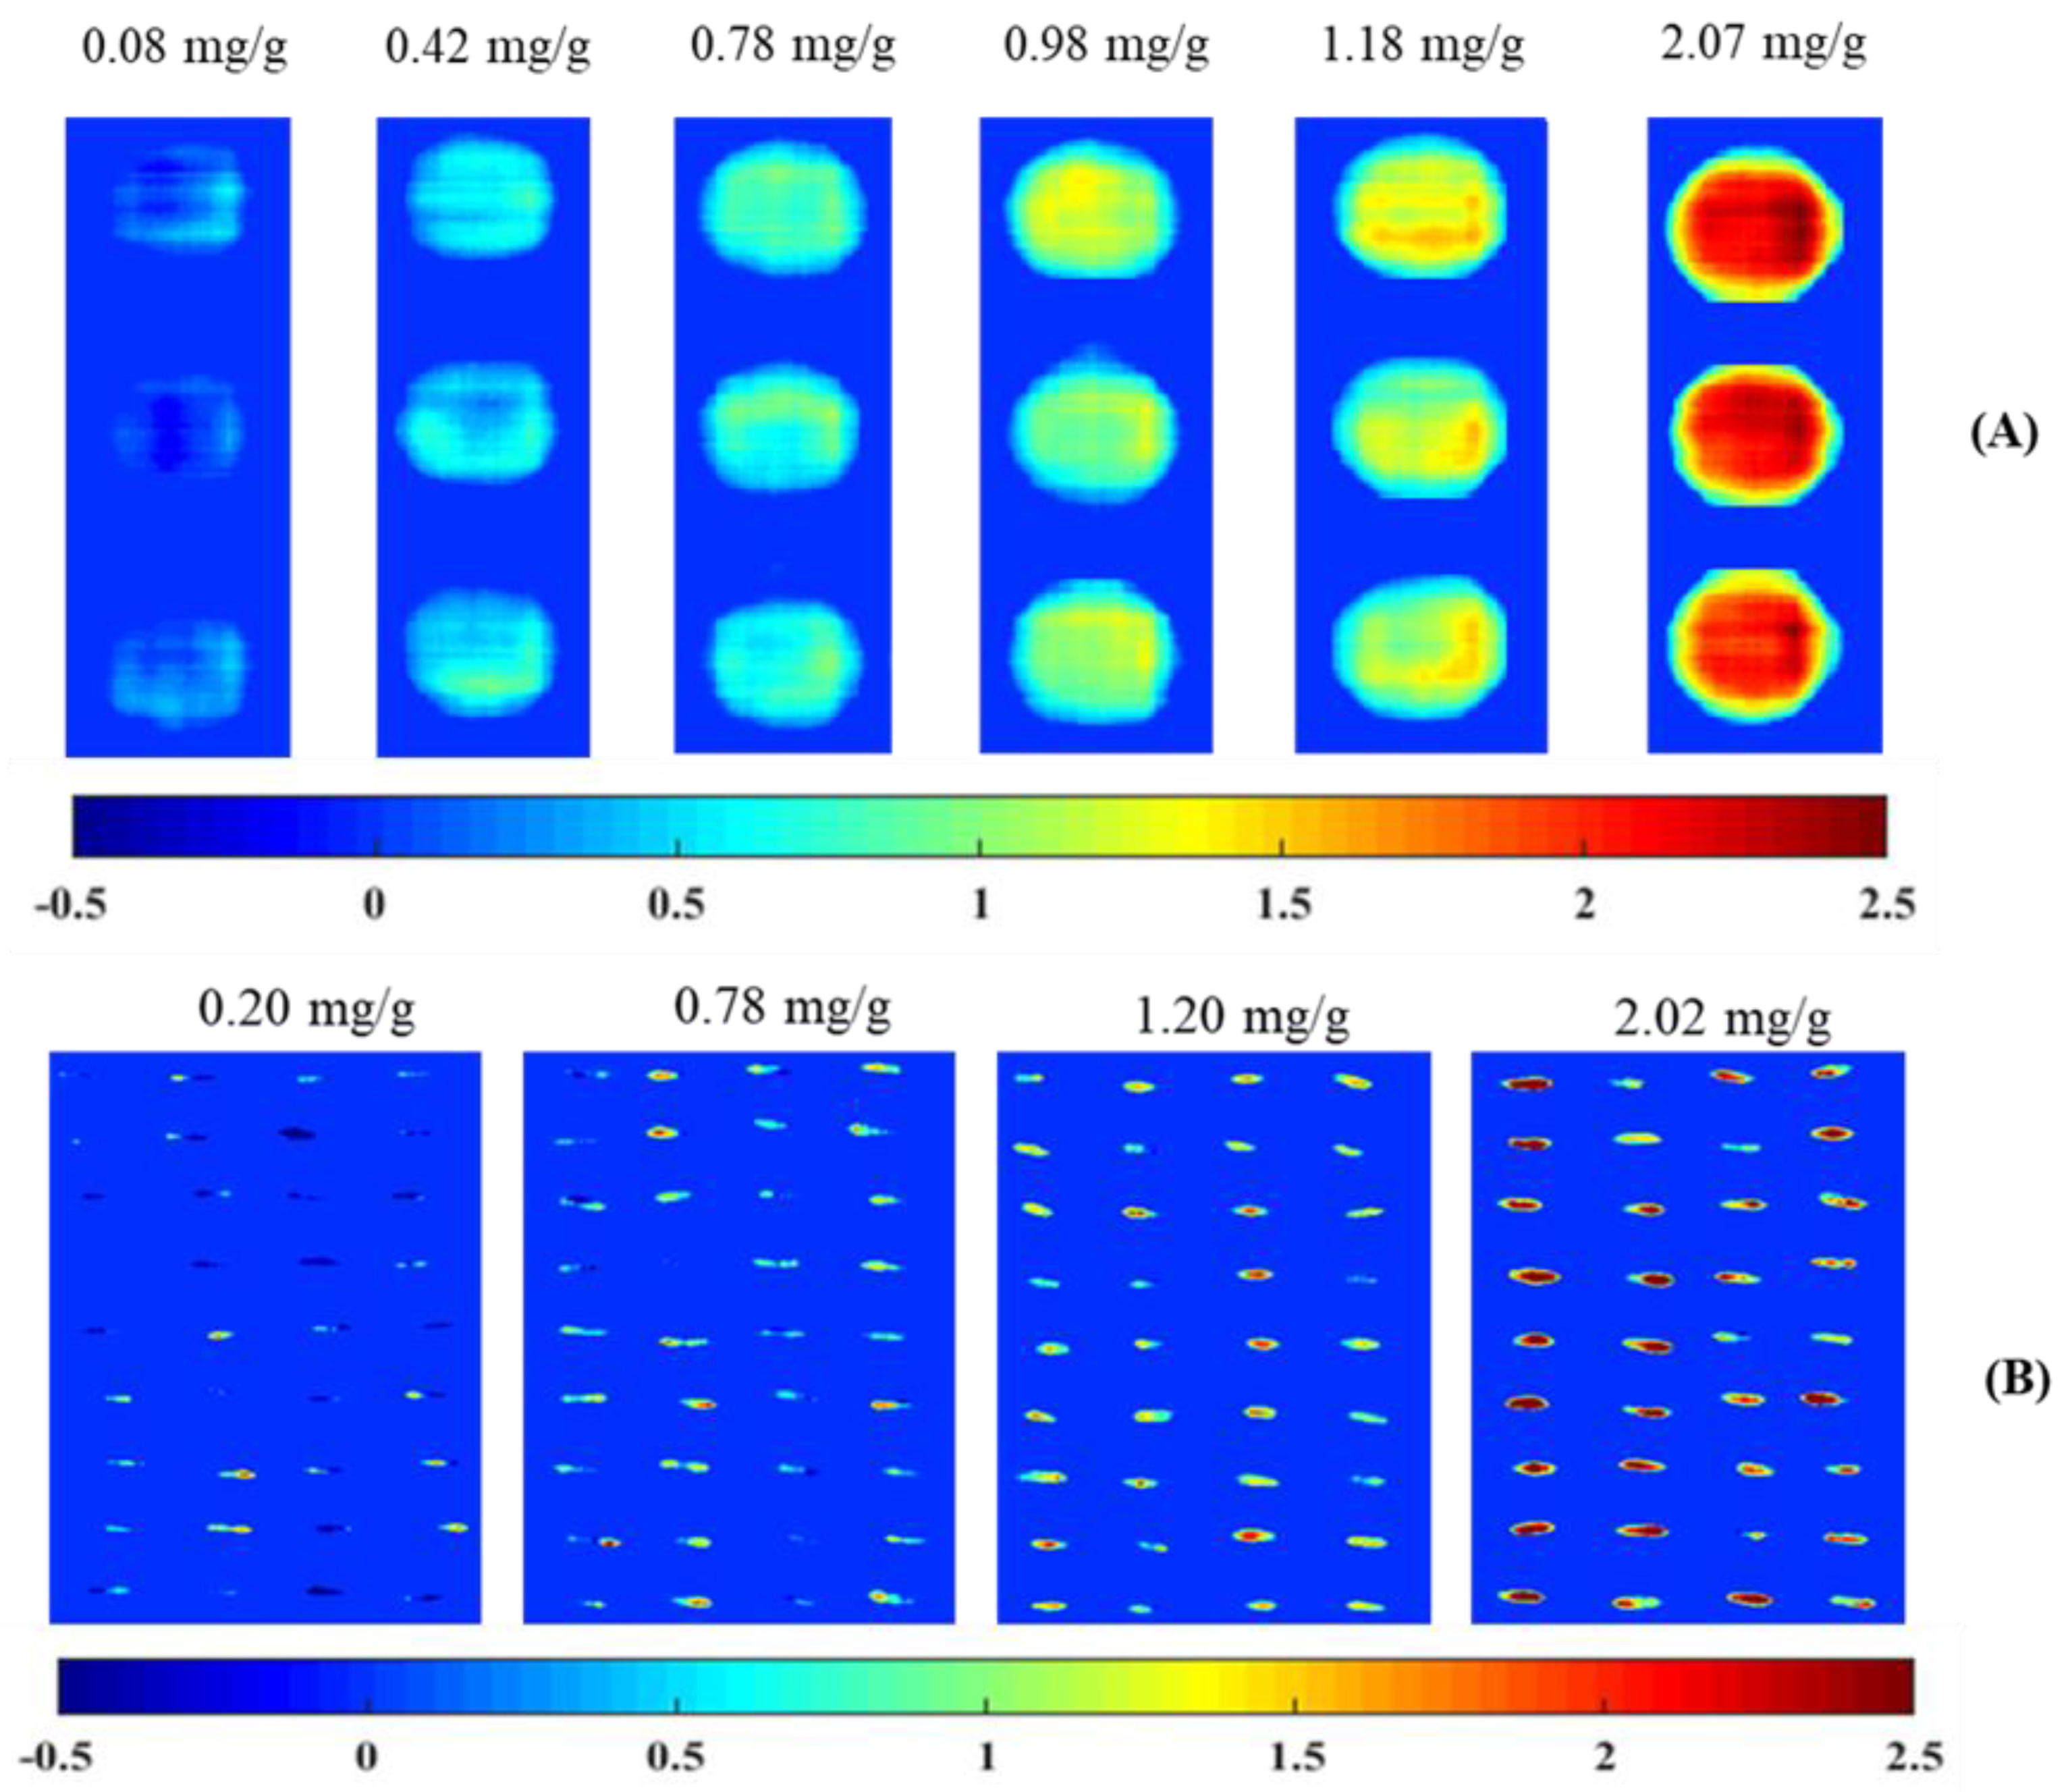
3.4. Visualization Image Based on Anthocyanins Content in Rice
4. Conclusions
Author Contributions
Funding
Conflicts of Interest
References
- Muthayya, S.; Sugimoto, J.D.; Montgomery, S.; Maberly, G.F. An overview of global rice production, supply, trade, and consumption. Ann. N. Y. Acad. Sci. 2014, 1324, 7–14. [Google Scholar] [CrossRef] [PubMed]
- Juliano, B.O.; Tuaño, A.P.P. Gross structure and composition of the rice grain. In Rice; Elsevier: Amsterdam, The Netherlands, 2019; pp. 31–53. ISBN 9780128115084. [Google Scholar]
- Zhang, M.W.; Guo, B.J.; Peng, Z.M. Genetic Effects on Grain Characteristics of indica Black Rice and their Useson Indirect Selections for some Mineral Element Contents in Grains. Genet. Resour. Crop Evol. 2005, 52, 1121–1128. [Google Scholar] [CrossRef]
- Min, B.; Gu, L.; McClung, A.M.; Bergman, C.J.; Chen, M.-H. Free and bound total phenolic concentrations, antioxidant capacities, and profiles of proanthocyanidins and anthocyanins in whole grain rice (Oryza sativa L.) of different bran colours. Food Chem. 2012, 133, 715–722. [Google Scholar] [CrossRef]
- Tang, B.; He, Y.; Liu, J.; Zhang, J.; Li, J.; Zhou, J.; Ye, Y.; Wang, J.; Wang, X. Kinetic investigation into pH-dependent color of anthocyanin and its sensing performance. Dye. Pigment. 2019, 170, 107643. [Google Scholar] [CrossRef]
- Zhao, S.; Park, C.H.; Yang, J.; Yeo, H.J.; Kim, T.J.; Kim, J.K.; Park, S.U. Molecular characterization of anthocyanin and betulinic acid biosynthesis in red and white mulberry fruits using high-throughput sequencing. Food Chem. 2019, 279, 364–372. [Google Scholar] [CrossRef] [PubMed]
- Konczak, I.; Zhang, W. Anthocyanins—More Than Nature’s Colours. J. Biomed. Biotechnol. 2004, 2004, 239–240. [Google Scholar] [CrossRef] [PubMed]
- Kong, J.-M.; Chia, L.-S.; Goh, N.-K.; Chia, T.-F.; Brouillard, R. Analysis and biological activities of anthocyanins. Phytochemistry 2003, 64, 923–933. [Google Scholar] [CrossRef]
- Yao, S.-L.; Xu, Y.; Zhang, Y.-Y.; Lu, Y.-H. Black rice and anthocyanins induce inhibition of cholesterol absorption in vitro. Food Funct. 2013, 4, 1602–1608. [Google Scholar] [CrossRef]
- Somsana, P.; Wattana, P.; Suriharn, B.; Sanitchon, J. Stability and genotype by environment interactions for grain anthocyanin content of thai black glutinous upland rice (Oryza sativa). Sabrao J. Breed. Genet. 2013, 45, 523–532. [Google Scholar]
- Lee, J.H. Identification and quantification of anthocyanins from the grains of black rice (Oryza sativa L.) varieties. Food Sci. Biotechnol. 2010, 19, 391–397. [Google Scholar] [CrossRef]
- Hou, Z.; Qin, P.; Zhang, Y.; Cui, S.; Ren, G. Identification of anthocyanins isolated from black rice (Oryza sativa L.) and their degradation kinetics. Food Res. Int. 2013, 50, 691–697. [Google Scholar] [CrossRef]
- Bordiga, M.; Gomez-Alonso, S.; Locatelli, M.; Travaglia, F.; Coïsson, J.D.; Hermosin-Gutierrez, I.; Arlorio, M. Phenolics characterization and antioxidant activity of six different pigmented Oryza sativa L. cultivars grown in Piedmont (Italy). Food Res. Int. 2014, 65, 282–290. [Google Scholar] [CrossRef]
- Zhang, M.W.; Zhang, R.F.; Zhang, F.X.; Liu, R.H. Phenolic Profiles and Antioxidant Activity of Black Rice Bran of Different Commercially Available Varieties. J. Agric. Food Chem. 2010, 58, 7580–7587. [Google Scholar] [CrossRef] [PubMed]
- Yoshimura, Y.; Zaima, N.; Moriyama, T.; Kawamura, Y. Different Localization Patterns of Anthocyanin Species in the Pericarp of Black Rice Revealed by Imaging Mass Spectrometry. PLoS ONE 2012, 7, e31285. [Google Scholar] [CrossRef]
- Shao, Y.; Xu, F.; Sun, X.; Bao, J.; Beta, T. Phenolic acids, anthocyanins, and antioxidant capacity in rice (Oryza sativa L.) grains at four stages of development after flowering. Food Chem. 2014, 143, 90–96. [Google Scholar] [CrossRef] [PubMed]
- López-Fernández, O.; Domínguez, R.; Pateiro, M.; Munekata, P.E.S.; Rocchetti, G.; Lorenzo, J.M. Determination of Polyphenols Using Liquid Chromatography–Tandem Mass Spectrometry Technique (LC–MS/MS): A Review. Antioxidants 2020, 9, 479. [Google Scholar] [CrossRef]
- Kim, Y.; Ahn, H.; Lee, E.; Kim, H. Development of Prediction Model by NIRS for Anthocyanin Contents in Black Colored Soybean. Korean J. Crop Sci. 2008, 53, 15–20. [Google Scholar]
- Xiaowei, H.; Xiaobo, Z.; Jiewen, Z.; Jiyong, S.; Xiaolei, Z.; Holmes, M. Measurement of total anthocyanins content in flowering tea using near infrared spectroscopy combined with ant colony optimization models. Food Chem. 2014, 164, 536–543. [Google Scholar] [CrossRef]
- Pullanagari, R.R.; Li, M. Uncertainty assessment for firmness and total soluble solids of sweet cherries using hyperspectral imaging and multivariate statistics. J. Food Eng. 2021, 289, 110177. [Google Scholar] [CrossRef]
- Amanah, H.Z.; Joshi, R.; Masithoh, R.E.; Choung, M.-G.; Kim, K.-H.; Kim, G.; Cho, B.-K. Non-destructive measurement of anthocyanin in intact soybean seed using Fourier Transform Near-Infrared (FT-NIR) and Fourier Transform Infrared (FT-IR) spectroscopy. Infrared Phys. Technol. 2020, 111, 103477. [Google Scholar] [CrossRef]
- Wang, Q.; Liu, Y.; Gao, X.; Xie, A.; Yu, H. Potential of hyperspectral imaging for non-destructive determination of chlorogenic acid content in Flos Lonicerae. J. Food Meas. Charact. 2019, 13, 2603–2612. [Google Scholar] [CrossRef]
- Liang, K.; Liu, Q.X.; Xu, J.H.; Wang, Y.Q.; Okinda, C.S.; Shena, M.X. Determination and Visualization of Different Levels of Deoxynivalenol in Bulk Wheat Kernels by Hyperspectral Imaging. J. Appl. Spectrosc. 2018, 85, 953–961. [Google Scholar] [CrossRef]
- Weng, S.; Yu, S.; Dong, R.; Pan, F.; Liang, D. Non-destructive detection of storage time of strawberries using visible/near-infrared hyperspectral imaging. Int. J. Food Prop. 2020, 23, 269–281. [Google Scholar] [CrossRef]
- Liu, C.; Huang, W.; Yang, G.; Wang, Q.; Li, J.; Chen, L. Determination of starch content in single kernel using near-infrared hyperspectral images from two sides of corn seeds. Infrared Phys. Technol. 2020, 110, 103462. [Google Scholar] [CrossRef]
- Caporaso, N.; Whitworth, M.B.; Fisk, I.D. Protein content prediction in single wheat kernels using hyperspectral imaging. Food Chem. 2018, 240, 32–42. [Google Scholar] [CrossRef]
- Liu, Y.; Sun, Y.; Xie, A.; Yu, H.; Yin, Y.; Li, X.; Duan, X. Potential of Hyperspectral Imaging for Rapid Prediction of Anthocyanin Content of Purple-Fleshed Sweet Potato Slices During Drying Process. Food Anal. Methods 2017, 10, 3836–3846. [Google Scholar] [CrossRef]
- Tian, X.; Aheto, J.H.; Bai, J.; Dai, C.; Ren, Y.; Chang, X. Quantitative analysis and visualization of moisture and anthocyanins content in purple sweet potato by Vis–NIR hyperspectral imaging. J. Food Process. Preserv. 2020. [Google Scholar] [CrossRef]
- Yang, Y.-C.; Sun, D.-W.; Pu, H.; Wang, N.-N.; Zhu, Z. Rapid detection of anthocyanin content in lychee pericarp during storage using hyperspectral imaging coupled with model fusion. Postharvest Biol. Technol. 2015, 103, 55–65. [Google Scholar] [CrossRef]
- Zhang, C.; Wu, W.; Zhou, L.; Cheng, H.; Ye, X.; He, Y. Developing deep learning based regression approaches for determination of chemical compositions in dry black goji berries (Lycium ruthenicum Murr.) using near-infrared hyperspectral imaging. Food Chem. 2020, 319, 126536. [Google Scholar] [CrossRef]
- Candolfi, A.; De Maesschalck, R.; Jouan-Rimbaud, D.; Hailey, P.A.; Massart, D.L. The influence of data pre-processing in the pattern recognition of excipients near-infrared spectra. J. Pharm. Biomed. Anal. 1999, 21, 115–132. [Google Scholar] [CrossRef]
- Osborne, B.G.; Fearn, T.; Hindle, P.H. Practical NIR spectroscopy with applications in food and beverage analysis. Longman Sci. Tech. 1993, 4, 12. [Google Scholar]
- Kresta, J.V.; Marlin, T.E.; MacGregor, J.F. Development of inferential process models using PLS. Comput. Chem. Eng. 1994, 18, 597–611. [Google Scholar] [CrossRef]
- Choi, Y.M.; Yoon, H.; Lee, S.; Ko, H.C.; Shin, M.J.; Lee, M.C.; Hur, O.S.; Ro, N.Y.; Desta, K.T. Isoflavones, anthocyanins, phenolic content, and antioxidant activities of black soybeans (Glycine max (L.) Merrill) as affected by seed weight. Sci. Rep. 2020, 10, 1–13. [Google Scholar] [CrossRef]
- Masithoh, R.E.; Lohumi, S.; Yoon, W.-S.; Amanah, H.Z.; Cho, B.-K. Development of multi-product calibration models of various root and tuber powders by fourier transform near infra-red (FT-NIR) spectroscopy for the quantification of polysaccharide contents. Heliyon 2020, 6, e05099. [Google Scholar] [CrossRef]
- Aenugu, H.P.R.; Sathis Kumar, D.; Srisudharson; Parthiban, N.; Ghosh, S.S.; Banji, D. Near infra red spectroscopy—An overview. Int. J. ChemTech Res. 2011, 3, 825–836. [Google Scholar]
- Jing, P.; Bomser, J.A.; Schwartz, S.J.; He, J.; Magnuson, B.A.; Giusti, M.M. Structure-function relationships of anthocyanins from various anthocyanin-rich extracts on the inhibition of colon cancer cell growth. J. Agric. Food Chem. 2008, 56, 9391–9398. [Google Scholar] [CrossRef]
- Park, Y.S.; Kim, S.-J.; Chang, H.-I. Isolation of Anthocyanin from Black Rice (Heugjinjubyeo) and Screening of its Antioxidant Activities. Kor. J. Microbiol. Biotechnol. 2008, 36, 55–60. [Google Scholar]
- Huang, L.; Zhou, Y.; Meng, L.; Wu, D.; He, Y. Comparison of different CCD detectors and chemometrics for predicting total anthocyanin content and antioxidant activity of mulberry fruit using visible and near infrared hyperspectral imaging technique. Food Chem. 2017, 224, 1–10. [Google Scholar] [CrossRef]
- Chen, S.; Zhang, F.; Ning, J.; Liu, X.; Zhang, Z.; Yang, S. Predicting the anthocyanin content of wine grapes by NIR hyperspectral imaging. Food Chem. 2015, 172, 788–793. [Google Scholar] [CrossRef]
- Mariani, N.C.T.; De Almeida Teixeira, G.H.; De Lima, K.M.G.; Morgenstern, T.B.; Nardini, V.; Júnior, L.C.C. NIRS and iSPA-PLS for predicting total anthocyanin content in jaboticaba fruit. Food Chem. 2015, 174, 643–648. [Google Scholar] [CrossRef]
- Verardo, V.; Cevoli, C.; Pasini, F.; Gómez-Caravaca, A.M.; Marconi, E.; Fabbri, A.; Caboni, M.F. Analysis of oligomer proanthocyanidins in different barley genotypes using high-performance liquid chromatography-fluorescence detection-mass spectrometry and near-infrared methodologies. J. Agric. Food Chem. 2015, 63, 4130–4137. [Google Scholar] [CrossRef] [PubMed]
- Faqeerzada, M.A.; Lohumi, S.; Kim, G.; Joshi, R.; Lee, H.; Kim, M.S.; Cho, B.K. Hyperspectral shortwave infrared image analysis for detection of adulterants in almond powder with one-class classification method. Sensors 2020, 20, 5855. [Google Scholar] [CrossRef] [PubMed]
- Zhao, X.; Wang, W.; Ni, X.; Chu, X.; Li, Y.F.; Sun, C. Evaluation of near-infrared hyperspectral imaging for detection of peanut and walnut powders in whole wheat flour. Appl. Sci. 2018, 8, 1076. [Google Scholar] [CrossRef]


| No | Harvesting Time | |
|---|---|---|
| 2019 | 2020 | |
| 1 | Jejubukjeju-2002-561 | Jejubukjeju-2002-561 |
| 2 | Heugjinju Byeo | Gancheok Byeo |
| 3 | Heugnam Byeo | Heugnam Byeo |
| 4 | Heugkwang Byeo | Heugkwang Byeo |
| 5 | Sinmyungheugchal | Sinmyungheugchal |
| 6 | Heugseol | Heugseol |
| 7 | Seonhyangheukmi | Seonhyangheukmi |
| 8 | Boseogheugchal | Boseogheugchal |
| 9 | Sinnongheugchal | Sinnongheugchal |
| 10 | Josaengheugchal | Josaengheugchal |
| 11 | Cheongpungheugchal | Chungnam 2 ho |
| 12 | Chungnam 2 ho | Heugsujeong |
| 13 | Heugsujeong | Jeughyangchal 1 ho |
| 14 | Heughyangchal 1 ho | Jahyangna 861 |
| 15 | Jahyangna 861 | Seonhyangheugmi |
| 16 | Seonhyangheugmi | Cheonghaejinmi |
| Year | Component | Number of Rice Varieties | Mean ± SD | Max | Min | Range |
|---|---|---|---|---|---|---|
| 2019 | Total anthocyanins | 16 | 0.41 ± 0.32 | 1.18 | 0.07 | 1.11 |
| Cyanidin-3-glucoside | 16 | 0.38 ± 0.29 | 1.07 | 0.07 | 1.00 | |
| Peonidin-3-glucoside | 9 | 0.07 ± 0.02 | 0.11 | 0.05 | 0.06 | |
| 2020 | Total anthocyanins | 16 | 0.91 ± 0.59 | 2.07 | 0.32 | 1.75 |
| Cyanidin-3-glucoside | 16 | 0.81 ± 0.56 | 1.89 | 0.26 | 1.63 | |
| Peonidin-3-glucoside | 16 | 0.10 ± 0.03 | 0.18 | 0.06 | 0.12 | |
| 2019–2020 | Total anthocyanins | 32 | 0.66 ± 0.53 | 2.07 | 0.07 | 0.12 |
| Cyanidin-3-glucoside | 32 | 0.59 ± 0.49 | 1.89 | 0.07 | 1.82 | |
| Peonidin-3-glucoside | 25 | 0.09 ± 0.03 | 0.18 | 0.05 | 0.13 |
| Year | Pre-Processing | Seed Sample | Powder Sample | ||||||
|---|---|---|---|---|---|---|---|---|---|
| Rc2 | SEC | Rv2 | SEP | Rc2 | SEC | Rv2 | SEP | ||
| 2019 | Raw | 0.85 | 0.12 | 0.81 | 0.13 | 0.95 | 0.07 | 0.93 | 0.09 |
| Mean Normalization | 0.88 | 0.11 | 0.77 | 0.14 | 0.95 | 0.07 | 0.92 | 0.09 | |
| MSC | 0.92 | 0.09 | 0.80 | 0.13 | 0.96 | 0.06 | 0.92 | 0.10 | |
| SNV | 0.87 | 0.12 | 0.85 | 0.11 | 0.95 | 0.07 | 0.92 | 0.09 | |
| SG first derivative | 0.94 | 0.07 | 0.79 | 0.13 | 0.95 | 0.06 | 0.88 | 0.11 | |
| 2020 | Raw | 0.95 | 0.13 | 0.88 | 0.21 | 0.95 | 0.13 | 0.93 | 0.16 |
| Mean Normalization | 0.93 | 0.15 | 0.89 | 0.19 | 0.96 | 0.12 | 0.93 | 0.16 | |
| MSC | 0.95 | 0.13 | 0.92 | 0.17 | 0.96 | 0.12 | 0.93 | 0.17 | |
| SNV | 0.95 | 0.12 | 0.92 | 0.17 | 0.96 | 0.12 | 0.95 | 0.14 | |
| SG first derivative | 0.91 | 0.17 | 0.80 | 0.26 | 0.95 | 0.13 | 0.81 | 0.28 | |
| Mixed data | Raw | 0.87 | 0.19 | 0.79 | 0.24 | 0.94 | 0.13 | 0.91 | 0.17 |
| Mean Normalization | 0.91 | 0.15 | 0.79 | 0.23 | 0.94 | 0.13 | 0.90 | 0.17 | |
| MSC | 0.89 | 0.17 | 0.85 | 0.20 | 0.94 | 0.13 | 0.92 | 0.16 | |
| SNV | 0.93 | 0.14 | 0.90 | 0.16 | 0.94 | 0.13 | 0.92 | 0.15 | |
| SG first derivative | 0.85 | 0.20 | 0.75 | 0.26 | 0.93 | 0.14 | 0.84 | 0.22 | |
Publisher’s Note: MDPI stays neutral with regard to jurisdictional claims in published maps and institutional affiliations. |
© 2021 by the authors. Licensee MDPI, Basel, Switzerland. This article is an open access article distributed under the terms and conditions of the Creative Commons Attribution (CC BY) license (https://creativecommons.org/licenses/by/4.0/).
Share and Cite
Amanah, H.Z.; Wakholi, C.; Perez, M.; Faqeerzada, M.A.; Tunny, S.S.; Masithoh, R.E.; Choung, M.-G.; Kim, K.-H.; Lee, W.-H.; Cho, B.-K. Near-Infrared Hyperspectral Imaging (NIR-HSI) for Nondestructive Prediction of Anthocyanins Content in Black Rice Seeds. Appl. Sci. 2021, 11, 4841. https://doi.org/10.3390/app11114841
Amanah HZ, Wakholi C, Perez M, Faqeerzada MA, Tunny SS, Masithoh RE, Choung M-G, Kim K-H, Lee W-H, Cho B-K. Near-Infrared Hyperspectral Imaging (NIR-HSI) for Nondestructive Prediction of Anthocyanins Content in Black Rice Seeds. Applied Sciences. 2021; 11(11):4841. https://doi.org/10.3390/app11114841
Chicago/Turabian StyleAmanah, Hanim Z., Collins Wakholi, Mukasa Perez, Mohammad Akbar Faqeerzada, Salma Sultana Tunny, Rudiati Evi Masithoh, Myoung-Gun Choung, Kyung-Hwan Kim, Wang-Hee Lee, and Byoung-Kwan Cho. 2021. "Near-Infrared Hyperspectral Imaging (NIR-HSI) for Nondestructive Prediction of Anthocyanins Content in Black Rice Seeds" Applied Sciences 11, no. 11: 4841. https://doi.org/10.3390/app11114841
APA StyleAmanah, H. Z., Wakholi, C., Perez, M., Faqeerzada, M. A., Tunny, S. S., Masithoh, R. E., Choung, M.-G., Kim, K.-H., Lee, W.-H., & Cho, B.-K. (2021). Near-Infrared Hyperspectral Imaging (NIR-HSI) for Nondestructive Prediction of Anthocyanins Content in Black Rice Seeds. Applied Sciences, 11(11), 4841. https://doi.org/10.3390/app11114841