1. Introduction
Traffic management in urban areas is focused on reducing the time losses of private and public transport vehicles caused by inadequate phase changing or phase duration at signalized intersections. To minimize time losses, traffic light management uses priority assignment techniques. The aim of this study was to examine in simulation tool the possibilities of reducing the travel time of tram vehicles by giving priority at signalized intersections under the conditions of sharing the traffic lane with personal vehicles and strong conflict flows with private transport. It also aimed to enable the running of private transportation by adjusting the weight factor priorities of public transport compared to the number of passengers in tram and cars during peak periods at intersections.
The aim of using the simulation tool was to test several variant solutions for prioritizing PT at intersections in the central part of the city in an economically acceptable and time-effective way. Direct application of PT priorities at intersections without prior simulation of different variant solutions could lead to heavy congestion, increased PT travel times and rejecting this type of traffic management. Direct implementation of traffic policy measures without prior testing in simulation models could lead to unnecessary additional costs for city authorities. PTV EPICS was chosen as a prioritization method because it uses weight factors to allow variable prioritizations of different traffic flows and vehicle types.
According to Sunkari et al. [
1], priorities are divided into two groups: passive and active priorities. Passive priority techniques do not explicitly recognize the actual presence of public transport (PT) vehicles. Predetermined timing plans are used to provide some benefit to PT movements but do not require the presence of the PT vehicle to be active [
1]. Active priority occurs when the detection of a PT causes the activation of a new signal timing pattern which overrides the existing pattern. In general, the improvement in active priority compared to the passive priority concept is that, in the former, priority is given only when the bus is present [
1]. Passive priority methods are financially cheaper [
2] and are conducted using cycle length adjustment, splitting phases, areawide timing plans and vehicle metering [
1,
3,
4]. Passive priority, although beneficial for public transport (PT), through signal coordination that favors PT vehicles, can consequently have a negative impact on other modes of traffic and cause delays, additional stops and user frustration [
5]. Sunari et al. in [
1] divided active priority approaches into two strategies: unconditional (absolute) and conditional (relative) priority. Both strategies use four methods of active prioritization: phase extension, earlier start [
6], special phase [
6,
7] and phase suppression [
6]. Absolute priority strategies are manifested through unconditional vehicle passing and are intended to give priority to emergency services, whereas relative priority strategies are formalized by giving higher priority to PT vehicles [
1,
3,
4], while still considering other modes of transportation. Liu et al. in [
8] noted potential shortcomings in applying active priority due to the required pedestrian and inter-green times at large intersections. Similar findings were made by Chandler and Hoel [
9], who noted the negative effects of active priority on individual motorized traffic.
Modern methods use simulation models to reduce time and enable cost-effective and safe testing of the results of the proposed solutions. Simulation models have often been used as tools in applied research related to modeling, planning, development and optimization of traffic, traffic networks or traffic systems [
10]. Therefore, testing the effects of prioritization in simulation tools has emerged as a standard in recent decades. Anderson and Daganzo [
11] proposed the PT priority method using a mathematical model based on the Brownian motion concept. Using this concept, they developed an improved TSP (Transit Signal Priority) with a relative priority assigned to buses. The concept reduces the number of priority requests by about 50% and increases the reliability of the TSP system. In their research, Ghaffari et al. [
12] proposed a methodology for addressing PT priority at the network level under variable demand conditions. Using this methodology, the system can recognize the temporal–spatial priority lane at times of reduced demand and mathematically formulate demand as a bi-level non-linear problem. The mathematical model was coded in MATLAB and combined with the VISUM simulation tool and showed the importance of considering hourly variations in demand when planning PT priority. Haitao et al. in [
13] proposed methods for PT priority in bi-modal urban networks (urban networks with two intertwined modes of transport). Using mathematical models and the Three-Dimensional Macroscopic Fundamental Diagram (3D-MFD), the authors assigned weight factors to trams and cars based on the average vehicle occupancy. The results obtained from the macrosimulation suggest a possible increase in total passenger capacity through the application of different strategies depending on the situation. Ji et al. in [
14] presented the results of an improved approach to tram priority assignment via an offline signal time scheduler and an online tram progression controller. The offline planner optimizes the progress of the tram through the network by synchronizing the green times depending on feedback about the progress of the tram while considering other vehicles. The results of the simulation, which was conducted in TransModeler, indicated the possibility of reducing the travel time of trams via recommended stop times at the station, recommended speeds while driving between stations, and extension of green times in the priority phases. Zhou et al. in [
15] presented the results of research based on a proposed mathematical model that aimed to improve the functioning of the entire system by considering tram and car traffic. Through the goal function of minimizing the delay time for both types of traffic, and assigning higher weight factors for tram traffic, a balance between the total delay time in both observed traffic modes was achieved.
De Keyser et al. in [
16] presented a comparison of the simulation tools used in PT prioritization. Scenarios from various countries (Croatia, Belgium, USA, Poland, Sweden, China, Egypt, etc.) covered various areas including signalized intersections and corridors to the entire network. Of the seven comparable studies, five used the VISSIM microsimulation tool [
16,
17,
18,
19,
20], one study used ExtendSim [
21] and one used FLEXSYT [
22]. VISSIM is widely applied to the testing of assigned PT priority methods due to the variety of features it offers. In addition to the possibility of assigning priorities using a built-in algorithm module (the VisVap module built into the VISSIM program interface), it also provides the ability to connect to user-designed priority algorithms. Ou et al. in [
23] presented VISSIM simulation model results in which the optimization method of prioritization was integrated using the COM interface. The optimization method was based on the spatiotemporal model of complex switch area operations. Conflicts of all tram lines and conflicts of tram lines with motorized traffic were considered in the presented mathematical method. The simulation results indicated a 26.6% reduction in delay time compared to the non-priority scenario and a 13% reduction in the delay time if the first-come-first-served (FCFS) priority strategy was considered. Stevanovic et al. in [
24] presented the possibility of optimizing signal plans and TSP by integrating a genetic algorithm into the VISSIM evaluation environment. The results of the simulation of 12 signalized intersections indicated a reduction in the delay time for individual vehicles and PT compared to the simulations of the initial state.
In addition to research based on simulations, in many cities, after obtaining simulated results, researchers have also implemented the methods of PT prioritization at real city intersections and corridors. The implementation of relative priority based on simulated data was carried out in Krakow, Poland, on four corridors with a total length of 19 km and 30 intersections [
25]. The results on the usage of an adaptive traffic management module called BALANCE [
26] in combination with a module for public transport priority of PT called EPICS [
27] indicated the possibility of reductions in PT travel time by an average of 10%, which caused an increase in motorized traffic by an average of 9% in the morning peak period but a decrease of 10% in the afternoon peak period. In addition to Krakow, successful implementation has been carried out in three other cities in Poland—Gdansk, Gdynia and Sopot—at a total of 150 intersections. According to [
28], the implementation resulted in an overall reduction in travel time of private vehicles by 18% and PT by 9%. Klanac et al. in [
29] presented a comparison of local and coordinated management via EPICS with the actuated-coordinated Ring Control Barrier (RBC). The results of local management without coordination indicated traffic time reductions of more than 10%, whereas comparison of the results with coordinated management indicated a reduction of up to 5%, confirming better efficiency of EPICS when using it for local optimization.
The above literature review shows that the usage of microsimulation tools to test proposed traffic solutions is common in related research. Even though various micro and macrosimulation tools are used to evaluate the proposed optimization and prioritization solutions, VISSIM is notable among the many simulation tools. Many studies refer to the improvement of existing priorities resulting from areawide timing plans by designing signal offsets in a coordinated signal system using PT travel times. These methods are limited to lengthening or shortening phases depending on the announcement of priority vehicles within the time frame provided by the PT timetable. Some of the studies considered only the results of PT improvement, whereas others considered prioritized and non-prioritized traffic. According to case studies mentioned in the literature review, using the network-level optimization module (BALANCE) and the local intersection-level prioritization module (EPICS) it is possible to achieve optimal solutions and reduce the average waiting time by giving priority to PT without major impacts on individual motorized traffic. Even though a study presented in the literature review showed that EPICS has a greater impact on local optimization than on coordinated optimization, this cannot be confirmed due to the lack of available literature. To our knowledge, with the exception of the cases presented in the literature, EPICS has not been used elsewhere and the results presented in this article are based on one of the largest microsimulation models, giving priority to trams, to date. Based on data collected in the City of Zagreb, Croatia, from a traffic network of 49 intersections, a VISSIM microsimulation model was designed. Using EPICS for the priority model and a mathematical model to determine the PT weight factors, the conditional PT priority was conducted for 29 simulated intersections.
2. Methodology
2.1. Study Area
The analyzed area represents the transport network and public transport areas in the central part of the City of Zagreb, Croatia (
Figure 1). A total of 14 of the 15 tram lines pass through this area, and largely share the road with private motorized transport. The study area has 49 signalized intersections and pedestrian crossings, and trams pass through 29 signalized intersections. Passenger transport by trams largely takes place on streets on which the network of tram lines coexists with road motor traffic. Thus, over time, the traffic volume has increased in limited spatial areas.
About 40% of tram lines in the City of Zagreb are not physically separated from individual traffic, so the speed and accuracy of the given timetable of tram lines largely depend on the density of individual traffic. The fact that trams do not have an announcement or a priority of passing through signalized intersections is also important for the low speed and regularity of tram traffic.
There have been no significant conceptual changes in public urban passenger transport for many years, with the exception that, during the past ten years, the tram and bus fleet has been largely renewed with modern low-floor vehicles. In the current traffic situation, the regulation of conflict points on the main tram corridors is achieved by a traffic light system that does not recognize the priority of tram traffic. As a result, the tram speed on some tram sections is reduced to such an extent that the quality of tram traffic is significantly impacted, thus affecting the choice of this form of transport for the daily commute of citizens (
Figure 2).
A system of special lanes (not physically separated from private vehicles) to achieve the priorities of public urban passenger transport is not fully functioning because traffic police have not been able to implement it efficiently. As a result, in general, the expected effects of this measure to improve public transport have not materialized.
2.2. Data Collection
Three types of counting were performed during September and October in 2019 in the analyzed area: (1) counting of vehicles at intersections; (2) counting of passengers in trams; and (3) counting of passengers in private vehicles. This provided a complete (objective) picture of the relationship of traffic flows, both in terms of their number (vehicles in space and time) and quantity, i.e., the number of passengers.
Traffic counting was performed at all approaches from 49 signalized intersections. Regardless of the timetables, the tram trains were counted. This approach was necessary because systematic traffic counts are not conducted in Zagreb, nor does the existing installed equipment enable vehicle counting and classification.
An objective picture regarding the justification of the implementation, and the necessary level, of public transport priorities in the central part of the city best describes the relations between passenger flows in public and individual transport. As automatic passenger traffic counting is still not performed in public transport vehicles, for the purposes of this research, three goals of the tram passenger counting methodology were set: (1) the most accurate assessment of passengers on tram lines should be achieved; (2) the counting process should have a minimal impact on passenger behavior and comfort; and (3) counting should be cost-effective.
The counting of passengers in public transport vehicles was carried out simultaneously with the counting of passengers in individual transport. The counting of passengers in personal vehicles was undertaken by counters in a stationary position at the approaches; using a quick visual inspection of the sampled number of vehicles, the average number of passengers in the vehicle was able to be determined.
The aim of counting passengers in public transport was to obtain basic parameters that characterize the movement of passengers on each route of the network, for all lines, such as: entrances and exits of passengers along the line, number of passengers between two stops, passenger flow, the mean length of travel and boarding and alighting of passengers at stops. For the purposes of this research, the counting of public transport passengers was performed by pre-trained counters that counted the passengers in the trams.
2.3. Public Transport Priority
The microsimulation model of the current and future state was created using the VISSIM software tool, and the simulation of public transport vehicle priorities was performed using the EPICS software module, as part of VISSIM.
To address the problem of increasing transport demand at signalized intersections, an increasing number of intersections are subject to traffic-dependent signal plan management. The traditional variant of these systems is based on the principle of impulse (detector) reaction, i.e., control algorithms consist of highly complex elements (if–then queries), especially regarding prioritizing public transport vehicles. A more modern approach to adaptive optimization, such as EPICS, is based on an iterative approach. EPICS was first intended to replace existing priority measures of public transport vehicles [
31]. Initially, it focused only on public transport vehicles, but with further developments it became a control method providing real-time optimization of traffic control parameters for all users [
29]. EPICS allows special attention to be paid to the time of arrival of public transport vehicles from the moment of the first announcement on the sensor (check-in detector) to the passage of the stop line (check-out detector). Unlike private transport flows, PT vehicles usually appear discretely at intersections. Therefore, due to the desired possibility of prioritization, the vehicles must be considered as single events. Differences in the arrival time of vehicles that occur due to occasional disturbances are respected by considering them to have a trapezoidal probability distribution, rather than treating them as a point (
Figure 3) [
27]. To obtain the probability density function, it was necessary to determine the ranges of PT vehicle time arrivals to the stop line for each intersection. That was accomplished by measuring arrivals in the field and entering the time values P1, P2, P3 and P4 in the EPICS program, where P1 represents fastest, P2 typical, P3 typical slow and P4 slowest travel times to the stop line.
If the public transport vehicle uses a common lane with private transport, EPICS gives priority to the PT vehicle by extending the duration of the green light or switching on the signal group to clear the queue and allow unobstructed passage of the public transport vehicle. The relevant quantities entering the target function of the optimization of EPICS are the total delay and the number of stops of vehicles, which are calculated by summing up all detected traffic flows, each with a configurable weight. Additionally, there is the possibility to compare with a reference signal plan to guarantee coordination of the local control with the surrounding network as good as possible. It can be provided offline by a traffic engineer or generated online by means of a suitable network control such as BALANCE [
27].
Based on the input data, the efficiency models calculate different variant process optimization scenarios using the Performance Index (PI) shown in Formula (1) [
27].
where:
| SG | = set of signal groups |
| sp | = signal plan to be evaluated |
| ref | = reference signal plan |
| αsg | = weighting of the signal group sg |
| Dsg | = sum of delay at signal group sg over time horizon considered |
| Δ | = deviation of control alternative sp from ref |
| β | = weighting of deviation from ref |
From this formula, the waiting times of each vehicle are calculated depending on the management scenario, and the scenario with the lowest total waiting time of all vehicles is selected as the optimal one. The only element in the EPICS module that can influence the priority of individual signal groups is the weight factor α
sg. In [
27], it is stated that a value between 50 and 100 is recommended in the case of PT prioritization. By assigning a higher value of the weight factor α
sg to the signal group in which the public transport is defined, the model strives to reduce the delay time of that signal group to achieve the minimum PI factor. The method of determining the weight factor α
sg is explained in
Section 3.1. If BALANCE is not used for network coordination, the second part of Formula 1. can be excluded.
An attempt to minimize PI is made through the control model, which is an integral part of EPICS. EPICS is stage and interstage based. The control model calculates, for the given time horizon T, a stage sequence that minimizes the PI. The signal plan with the lowest PI is accepted and transferred to the traffic light control. The operation of the mentioned optimization is performed in two steps. In the first step, the time horizon is split into a grid with a width of 5 s. Here, the stage sequence in principle is set. In the second step the fine tuning takes place, i.e., the starting times of the inter-stages are optimized with one second precision. The first step uses a (slightly modified) branch-and-bound algorithm and the second one an ordinary hill-climbing algorithm [
27].
2.4. Comparison of Public and Individual Transport
One of the key problems of traffic flows in the central part of Zagreb is the inseparability of tram and individual traffic. The use of dedicated PT lanes by car drivers is common, and the coordination of traffic light devices is mostly adapted to individual rather than public transport. This results in a constant decline in the competitiveness of public transport. Even though private transportation is favored at signalized intersections, the modal split in favor of cars exceeds the existing capacity of signalized intersections. Due to the excess transport demand of private transport, a level of service F was determined at 75% of the analyzed intersections in the peak periods. The clear solution is to change the transport policy in favor of public transport and increase its competitiveness using various measures, with special emphasis on the application of priorities for trams at intersections. In addition to the general assessment of traffic in the central area of the City of Zagreb, it is necessary to determine the relationship between individual and public transport in terms of the number of transported passengers.
Even though it is of key importance for the implementation of a certain transport policy, this aspect has not generally been considered in the traffic studies and research conducted to date in the City of Zagreb. As the function of the entire transport system is to meet the needs of people who use different transport modes, traffic planning and modeling should, at its core, address passengers rather than vehicles. To assess the current relationships between individual and public transport, additional research was conducted.
In terms of individual and public transport, 29 key intersections in the central part of the City of Zagreb were analyzed in detail. The total car volume in two-hour peak intervals (morning and afternoon) is approximately 91,000 Passenger Car Units (PCUs). The total traffic volumes during the peak periods are approximately the same, i.e., the afternoon peak interval is slightly higher (by 0.5%). Given the high levels of saturation and the dominant F level of services, prioritizing public transport at signalized intersections should be preceded by proposals for alternative management of individual traffic flows (rerouting), in addition to a campaign to encourage the use of public transport, for which the quality of service will be raised due to being given priority at intersections.
A comparison of individual and public transport in terms of the number of passengers was carried out at all intersections on the corridors where public and private transport intersect. If the total number of passengers recorded in the two peak periods (7–9 h and 15–17 h) is considered, almost the same number of passengers use individual and public transport. Similarly, the difference in passenger numbers between the morning and afternoon peak periods is negligible.
Figure 4 shows ratios of passenger flows in private vehicles and public transport on five most saturated intersections in study area.
For the future strategy of traffic light system management in the center of the City of Zagreb, it is extremely important to determine the intensity of the proposed changes. Even though it is clear that public tram traffic should be given priority at intersections (which does not currently exist), the question about the extent to which this should be done so that individual traffic is not congested and causes additional delays in tram traffic.
An important guideline in determining this measure should be the number of flows of passengers in private and public transport intersecting at a particular intersection, rather than simply the number of approaching vehicles. As an example, the following
Figure 5 shows the relationships of “conflicting” passenger flows in passenger cars (passenger/hour) and trams (passenger/hour) at the five most saturated intersections in the morning peak period from 7 AM to 9 AM. “Conflicting” flows represent flows of passengers in cars and trams that cannot pass through intersections at the same signal stage. The ratios of these flows show that there is a significantly higher number of passengers in public tram transport waiting for their green light than in passenger cars on the five most saturated intersections.
For traffic light control management in the central area of the City of Zagreb, the previously presented relationships will be one of the main guiding principles for measuring the level of priorities to be given to public transport in relation to the current situation of dominant individual transport. The aim is to determine the weight factors that determine the priority level of PT based on the relationship of conflicting flows of passengers in private transport and PT.
5. Discussion
The aim of this study was to enable traffic flow in cases where PT is not physically separated from individual traffic and uses a common traffic lane. VISSIM, with its EPICS module, was used as a simulation tool. EPICS enables the assignment of weighting coefficients to individual signal groups, and direct implementation at real intersections is possible.
The basic problem addressed in this study was determination of the weight coefficients of the signal groups used by PT vehicles. The methodology was based on the counting of passengers in each of PT and individual vehicles. In further research, it is proposed to automate passenger counting and estimation. In the case of individual vehicles, cameras can be used at the intersections and, using video processing, the number of passengers in individual vehicles can be determined. For PT vehicles, video processing of recordings from cameras located in the vehicles themselves is proposed. Cameras placed at intersections can be also used to determine trapezoidal probability density function of PT arrival time to stop line.
Even though the EPICS module is user friendly, it should enable changing of several parameters and be more easily adapted to local conditions. In particular, it is especially necessary to work on its functioning at complex intersections where several signal groups contain PT lines. In addition, the methodology proposed in this paper addresses the gap that existed in the definition of the weight coefficient of signal groups.
In further research, it will be necessary to develop a methodology for the dynamic change in the weight factors, depending on the current ratio of the number of passengers at intersections.
In addition, the further development of EPICS should strive to allow it to work at a network level, rather than the local level in microsimulation tool. Even though BALANCE is intended for network optimization of signal plans, its development is extremely complex and first requires defining a macrosimulation model with origin-destination matrices in VISUM prior to exporting to VISSIM.
6. Conclusions
Compared to previous studies, a novelty is using the actual relationship between passenger flows in PT and individual vehicles and the adjustment of signal plans at each intersection depending on that relationship. Developing a methodology for determining the weight factors of particular signal groups at intersections has enabled individual traffic movement in conditions of PT priority. This methodology has proven successful on an extensive and congested network. Furthermore, the proposed methodology addresses the gap that existed in the definition of the weight coefficients of signal groups in EPICS.
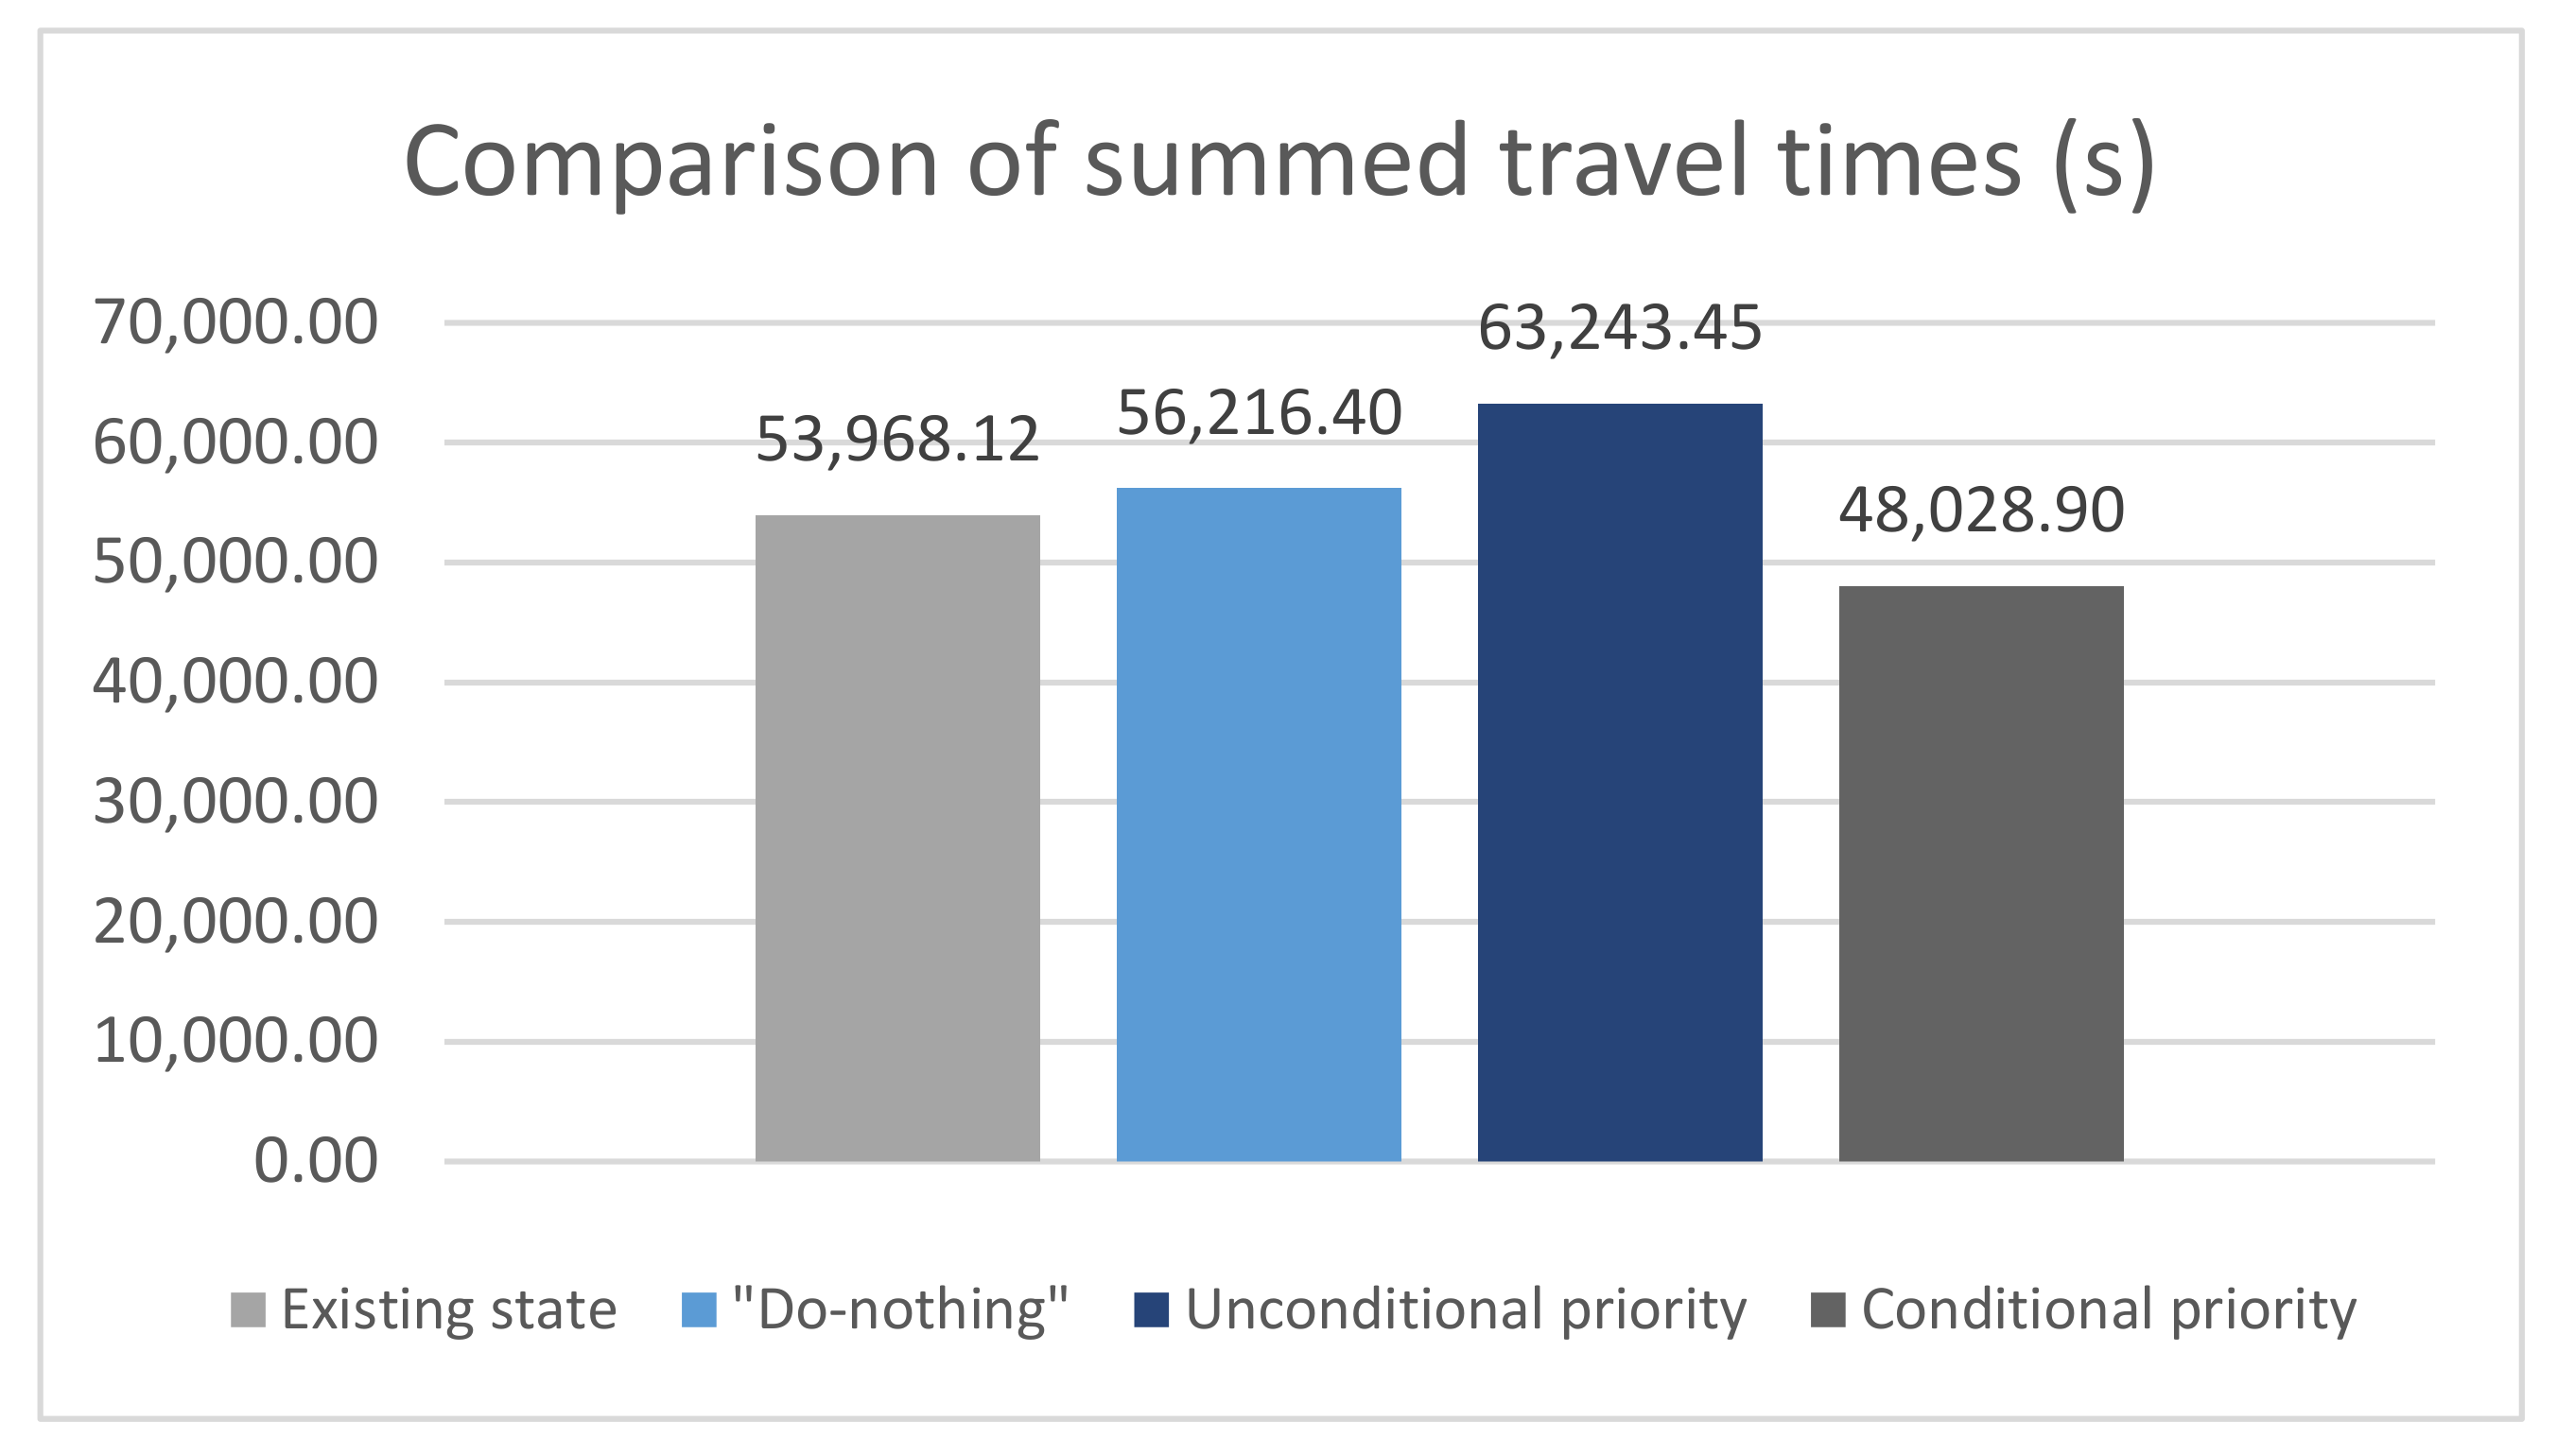
As a result of the research conducted in this study, it was possible to develop a methodology for the conditional priority of PT vehicles that simultaneously enables the flow of individual traffic, but with an increase in its waiting time. After the establishment of unconditional priority, there was a complete blockade of personal and public transport due to the high frequency of trams and frequent minimal green times on opposite directions. To enable movement of private and public transport, conditional priority, based on the weighting coefficients of conflicting passenger flows in personal vehicles and public transport, was approached. The results of conditional priority showed average reduction in travel time in the morning peak period from 7.64% to 18.76% and in the afternoon peak period, improvements ranged from 5.60% to 22.50%, compared to “do nothing” scenario. These results are comparable to the results in other cities where EPICS was used. Still, they depend on the PT traffic management (mixed or dedicated lanes), road capacity, traffic volumes and frequency of PT lines.
The measurement of the effects of prioritizing PT vehicles must be undertaken in conjunction with a change in the city’s transport policy, to encourage PT transport and discourage mass travel by car to the city center.


