Article

A Case Study: Simulation Traffic Model as a Tool to Assess One-Way vs. Two-Way Traffic on Urban Roads around the City Center

1
Faculty of Mining, Ecology, Process Control and Geotechnologies, Technical University of Kosice, Letna 9, 04200 Kosice, Slovakia
2
Faculty of Organization and Management, Silesian University of Technology, 44-100 Gliwice, Poland
3
Faculty of Mining, Safety Engineering and Industrial Automation, Silesian University of Technology, 44-100 Gliwice, Poland
*
Author to whom correspondence should be addressed.
Appl. Sci. 2021, 11(11), 5018; https://doi.org/10.3390/app11115018
Submission received: 23 April 2021 / Revised: 23 May 2021 / Accepted: 26 May 2021 / Published: 28 May 2021
(This article belongs to the Special Issue Urban Transport Systems Efficiency, Network Planning and Safety)

Abstract

:
This article evaluates changes in the organization of transport on urban roads through the transport model in the OmniTRANS program. The selected location for the case study in this article is the internal traffic circuit of Kosice, which borders the historic core of the city. Currently, the proposal is being prepared to change the organization of transport in the town’s monument reserve and its protection zone. The transition to a one-way road around the historic center is being considered. Before introducing the new proposed change in traffic, it is necessary to test this proposed change and determine how it will affect the traffic situation. The aim of this article is to compare the current transport organization with the proposed change in transport organization in terms of traffic intensity. The use of transport models in the world is not a new concept, but it is often not used in the conditions of the Slovak Republic. However, traffic and simulation models can save money and time and avoid possible unexpected problems before putting the proposed changes into practice. Solving the given problem is an excellent benefit for transport planning and traffic engineering for Kosice and other places with a similar arrangement of the historical center and a similar number of inhabitants. The proposed changes can be tested by modelling traffic and then to adjust them when the cons are identified. Thanks to the traffic simulation model, it is possible to compare the capacity load of the inner traffic circuit of the city before and after the introduction of the one-way circuit.

1. Introduction

The development of cities, the increase in the number of inhabitants and their transport and the increasing attractiveness of activities in the town lead to higher demands on transport itself [1]. Especially during peak times, traffic congestion is created due to the lack of capacity on urban roads. Because urban areas are denser and more congested, they could be expected to experience more significant induced demand effects than suburban, exurban, or rural settings [2]. With the improvement in transportation and communication under globalization, the urban population continues increasing, while the rural population has been dwindling [3,4]. This fact is also confirmed by the projection of the development of the population in the book “Cities of the world: regional patterns and urban developments” [5,6]. Authors point out that the rural population will decrease in the next few decades and on the opposite side, by the 2050s, almost 62% of the global population will live in cities.
Any change in the traffic organization must be carefully considered as it can also have a negative impact on traffic. The aim of this study is to compare traffic intensities and road capacities before and after conversion to one-way traffic around the city center.
In the current trends in transport, it is not enough to increase the capacity of local roads just by expanding lanes. The extension of lanes is practically impossible and not desirable in cities with surrounding buildings. There is an opinion that widening roads at the level of the town will not solve congestion but will make the situation worse [7].
Organizing transport in cities is not an easy task at all. It is practically impossible to find a universal solution for optimal transport organization because each city has its unique dimensions and features [8].
Is a two-way road or a one-way system better? Many studies focusing on urban roads are struggling with these questions, but so far, there is no consensus on the optimal organization of transport aimed at improving urban mobility. Some publications deal with the change from a bidirectional to unidirectional circuit [9,10,11,12], while others address the change from reverse to one-way to two-way [13,14,15,16,17,18]. Especially in the U.S.A., there has been a noticeable trend in recent years when there is a conversion from one-way traffic to two-way traffic [19]. Recently, urban decision makers and transportation planners resort to a one-way traffic system as an effective traffic management strategy, which profoundly affects traffic congestion and improves traffic flow, leading to urban sustainability [11]. One-way streets undoubtedly have an advantage in static traffic, i.e., when parking, due to the unification of the street, it is possible to increase the number of parking spaces. In contrast, the negative impact of unidirectional on collisions, crime and the community are addressed in the study [12]. One-way streets can simplify crossings for pedestrians, who must look for traffic in only one direction. While studies have shown that the conversion of two-way streets to one-way generally reduces pedestrian crashes, one-way streets tend to have higher speeds, which creates new problems [20]. As a system, one-way streets can increase the travel distances of motorists and create some confusion, especially for non-local residents.
Other publications deal with the comparison of one-way vs. two-way communications from different perspectives. Examples are studies by Ortigosa and Yasuda et al. [21,22,23,24,25]. Ortigosa, who focuses on various arrangements of road infrastructure in the urban environment, states that “The design of urban street networks is a subject of much controversy because there is no consensus on the best way to organize streets to maximize mobility”. Quite often, publications deal with the ecological aspect of unidirectional vs. bidirectional; examples are included in the publications [26,27,28].
The transport model can be understood as an idealized imitation of a part of the real world [29,30,31,32,33]. The role of transport models is to model and subsequently predict transport behavior as a function of various inputs; finally, the models also appraise alternative scenarios to help policymakers choose the best solution from selecting alternatives [34,35]. There can be detected changes, e.g., situations that occur, such as changing the organization of transport or introducing traffic restrictions by using the transport model. Combining the principles of model construction and mathematical sets shows how some parts of a particular system react to changes in other parts of this system. The transport model is thus an attempt to imitate the actual transport process based on known laws. Traffic models are processed only for one specific territory. The term processing means creating a model structure, while the actual processing consists of calibration and validation. Usually, this is performed by a simulation of the developed model. Therefore, this model is sometimes called the traffic simulation model.
Transport models have a wide range of applications. Traffic models are used to optimize the design of proposed projects and produce critical input data for environmental impact assessments and cost–benefit analyses, such as expected time savings, safety effects, and changes in pollution and noise levels [36].
There are several software products on the market for traffic modelling. For microsimulation models, the most used program appears to be VISSIM, which is used in many studies [37,38,39,40,41,42,43,44,45,46,47,48] and the AIMSUN program [27,49,50,51,52,53,54]. Other studies, in turn, focus on comparing different software products. For example, in publication [55], the authors compare Aimsun and OmniTRANS software when assessing junction capacity. More comparative studies [50,56,57,58,59,60] and research mostly do not point to significant differences between simulation tools. Although the results obtained by the simulation are slightly different from the measured values, the simulation models have an irreplaceable position in traffic planning and forecasting.
This article uses the OmniTRANS modelling tool. The OmniTRANS program enables the modelling of rail, road and urban public transport.
Perhaps the most critical point in traffic modelling is the data entering the traffic model. OmniTRANS works with the so-called OD matrix (Origin-Destination Matrix), representing the mutual transport relations between the individual areas in the created model. According to mathematical procedures and models, data in the OD matrix are traditionally obtained by extensive and precise traffic research in the solved area or by estimating the OD matrix. It is the latter option that is often used in practice, as traffic research is costly and time consuming. Until they are evaluated, the data are already so often outdated; thus, in the end, it is still necessary to estimate the matrix.
According to Bera and Rao, “The estimation of the up-to-date origin–destination matrix (ODM) from an obsolete trip data, using currently available information is essential in transportation planning, traffic management and operations.” [61]. Many authors have been dealing with OD matrix estimation since 1970, and this trend continues to the present day when models for matrix estimation are constantly supplemented and improved, as is evident from the publications [15,61,62,63]. According to Smits [62], OmniTRANS can use the following four types of data to estimate a matrix: traffic counts, screenlines, blocks and trip ends. A traffic count is located on a network link and contains information on the number of vehicles that pass that position. A screenline contains information on the total number of vehicles that pass several count locations. A block contains information on the total demand for a set of O-D pairs. A trip end is a particular case of a block; it contains information on a specific zone’s total production or attraction. The accuracy of this estimated matrix depends on the estimation model used, the input data errors, and on the set of links with collected traffic counts [61].

2. Research Design and Methods

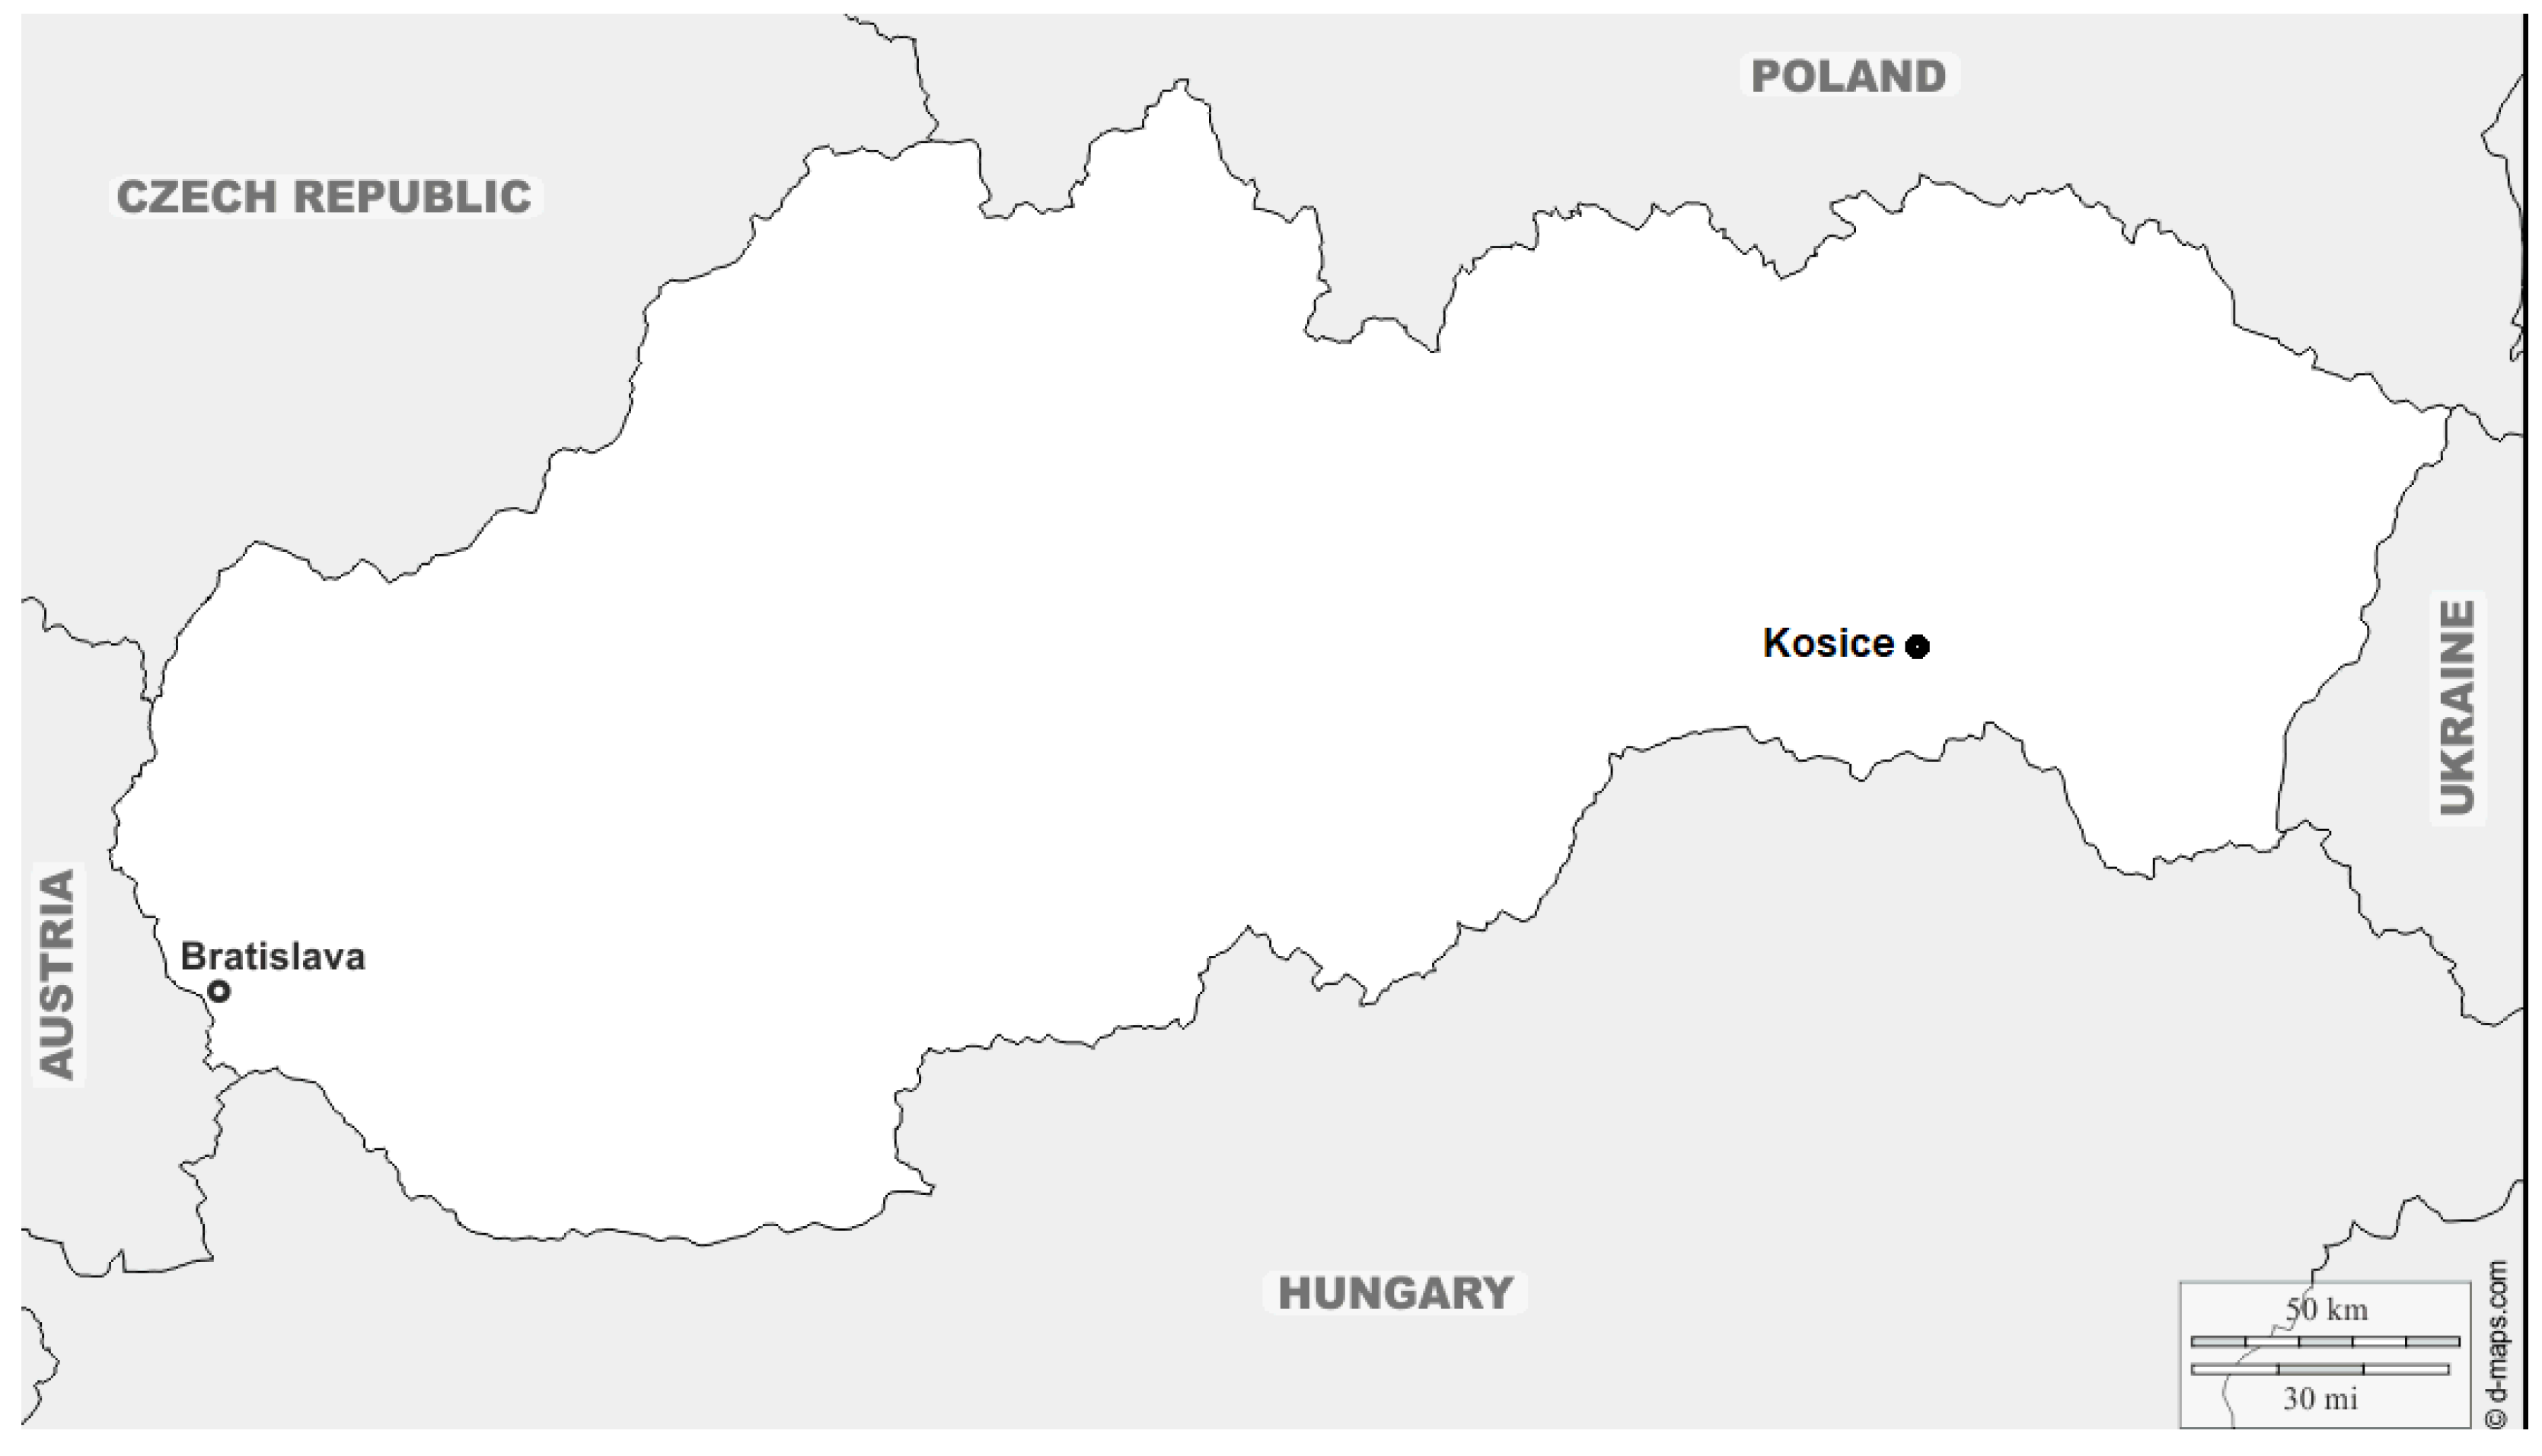
The transport system in the center of Kosice faces an increasing number of means of transport and emerging congestion, so Kosice has come up with a suggestion to streamline traffic on the town’s inner ring road, which serves the central city zone (CMZ). The town of Kosice is located in the eastern part of the Slovak Republic (Figure 1) and is the second-largest city with approximately 250,000 inhabitants. For modelling, the simulation transport model is presented in this article.
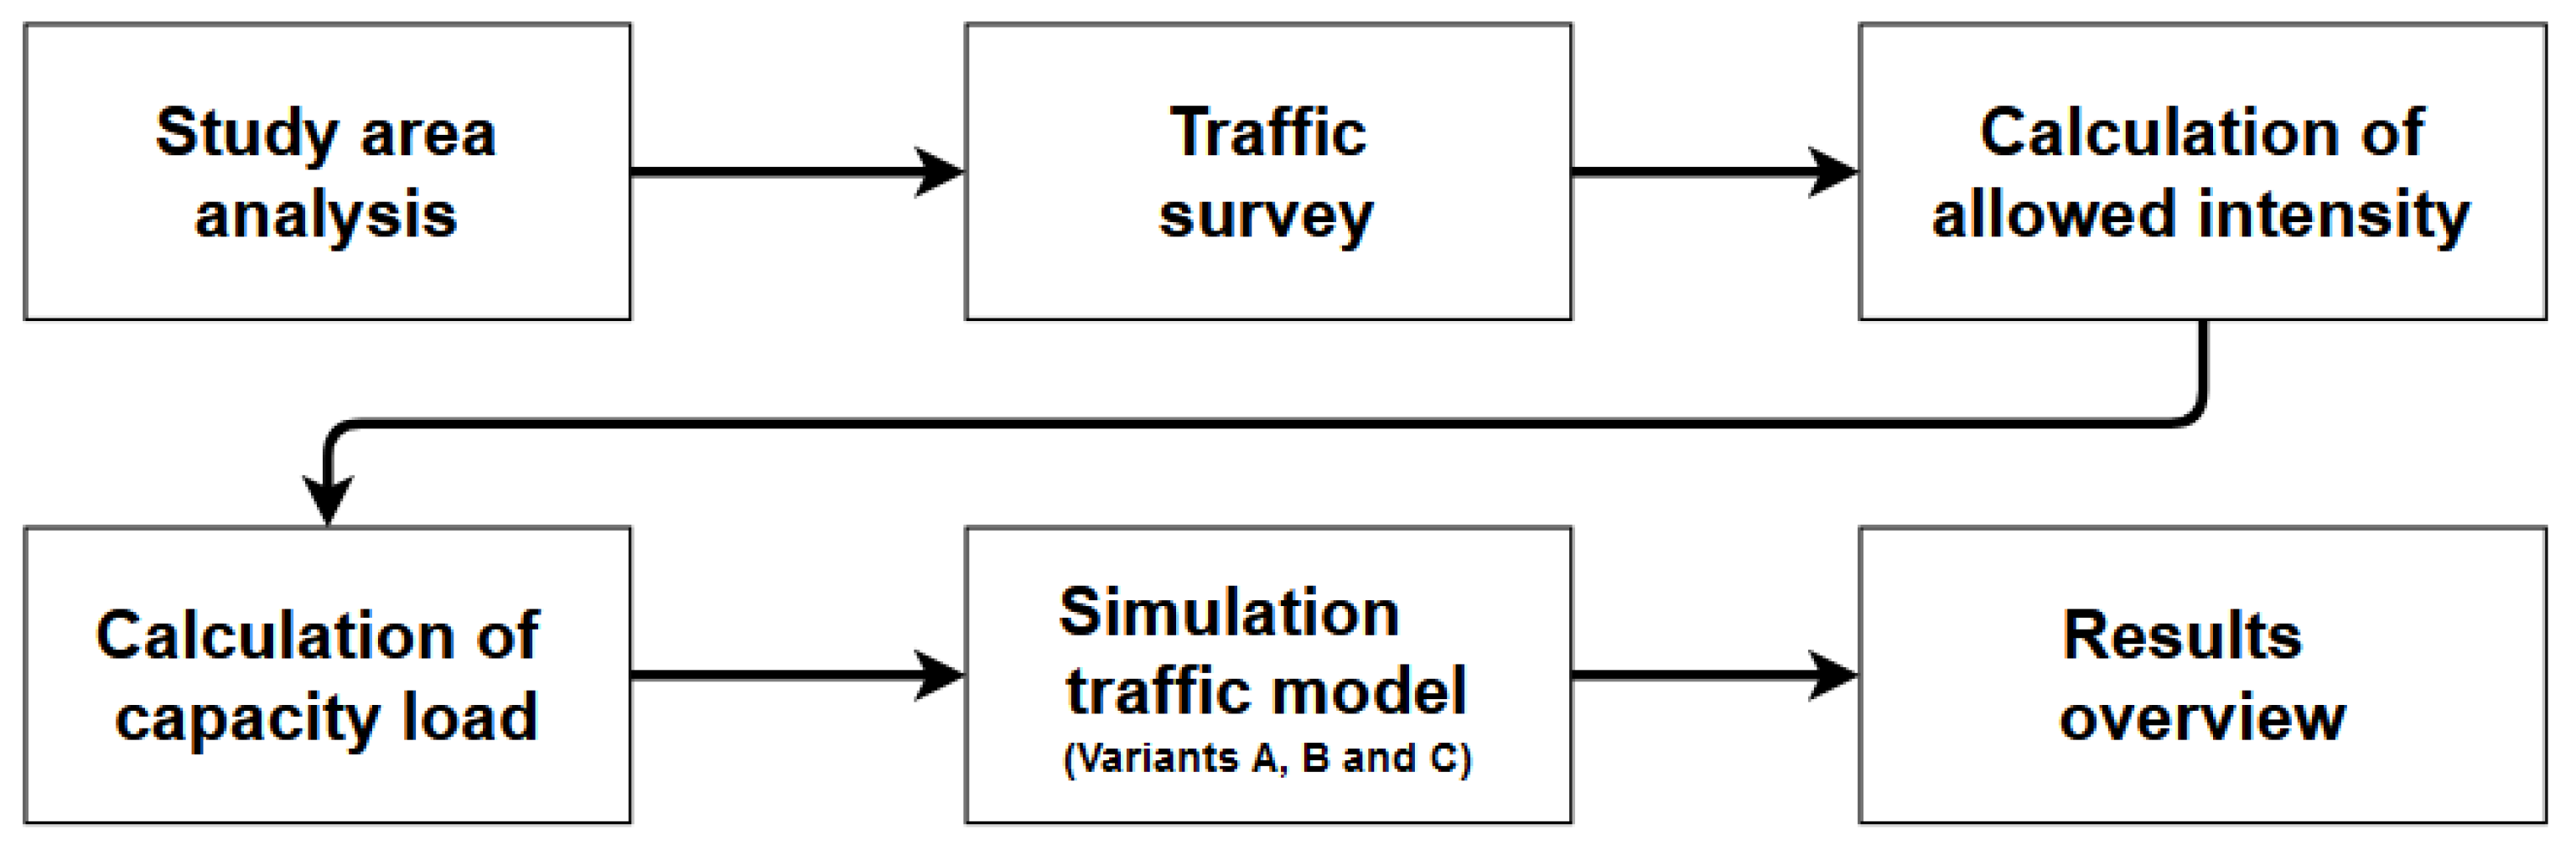
The principle of this research is based on the comparison of traffic intensity on the monitored sections before and after the introduction of changes. Traffic intensity is defined as a measure of the average occupancy of an urban road during a specified period of time, normally a busy or peak hour. It is calculated as the ratio of the time during which a road is occupied to the time this road is available for occupancy. The aim is to reduce traffic congestion and the load on junctions due to introducing a one-way road. Load on junctions represents the number of vehicles on a junction road during the specified period of time. The methodology of the solution is shown in Figure 2.

2.1. Study Area

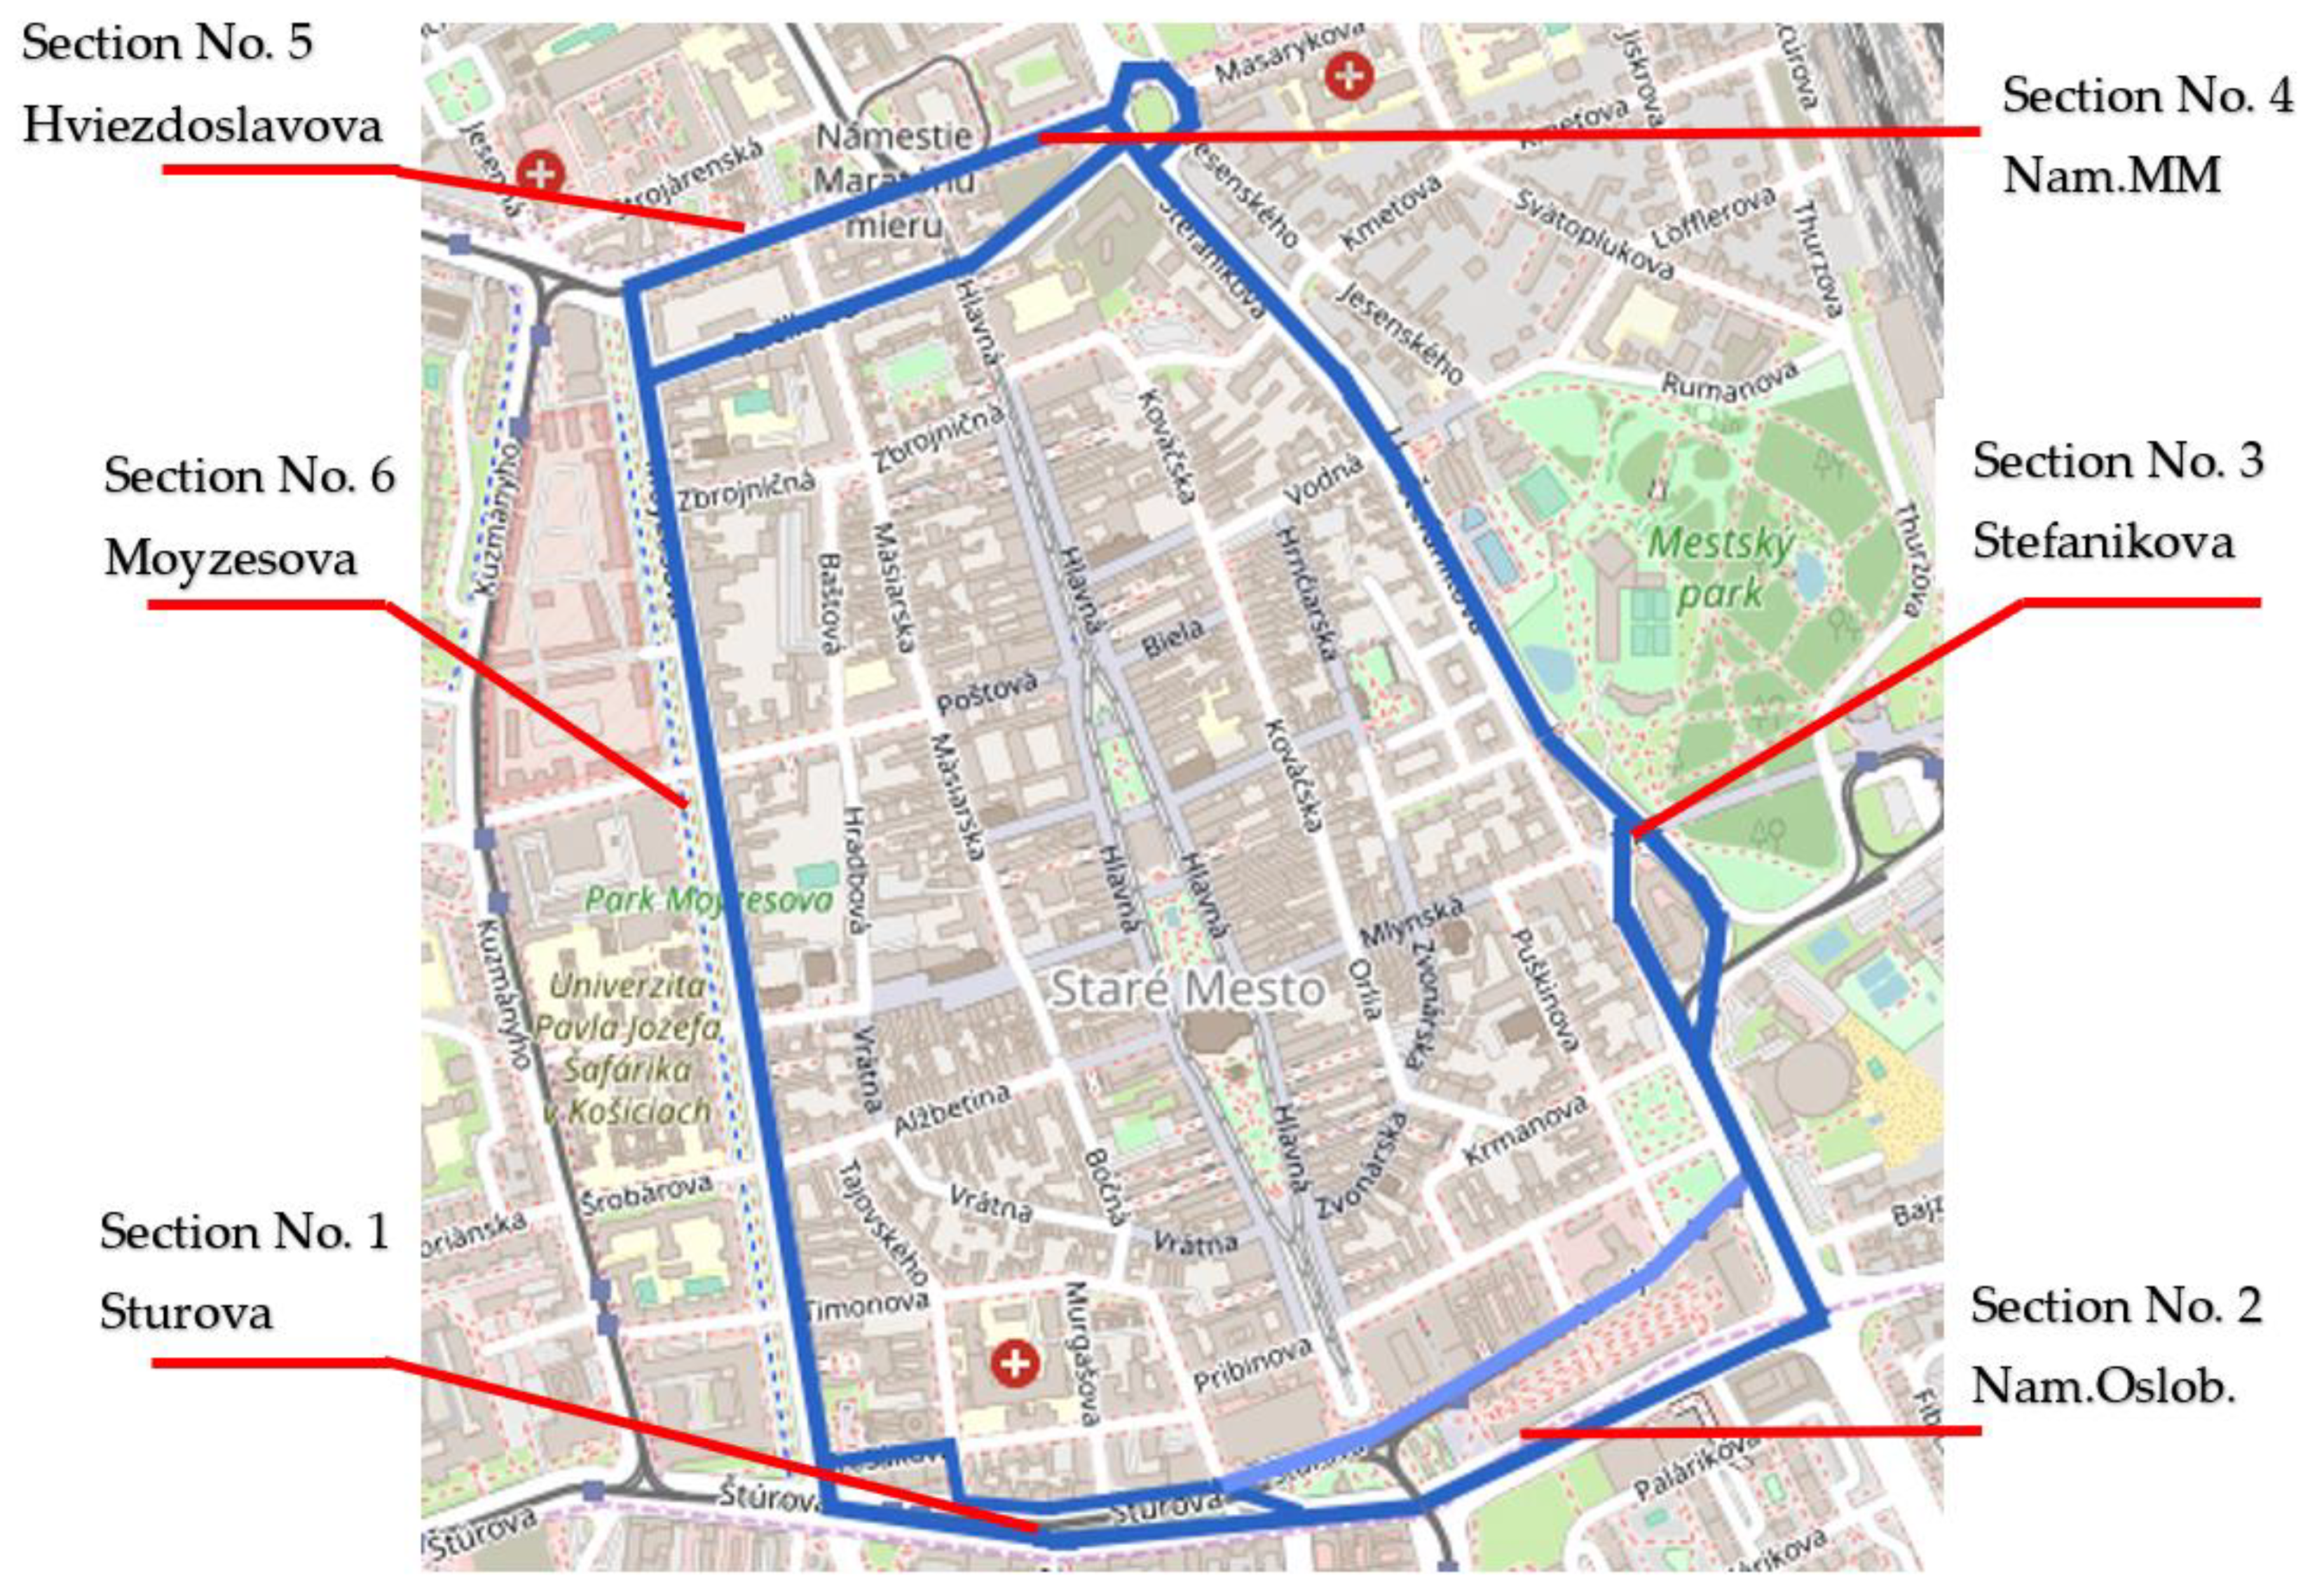
The area of research focuses on the internal traffic circuit of Kosice (Figure 3), which borders the historical zone of the city. The circuit provides mainly transport services to the central city zone (CMZ). CMZ in each city is characterized by a high density of buildings, increased mobility of pedestrians, traffic congestion and often the impossibility of widening lanes. Therefore, the possibilities for improving the traffic situation are minimal and, in principle, are reduced only to changes in the organization of transport or its appropriate management or eliminating the number of cars in city centers.
Currently, there is two-way traffic on the internal traffic circuit. This article aims to assess whether the proposed change from two-way to one-way traffic will positively affect the traffic situation in this inner ring road of the town. The suggestion assumes that some lanes used so far for two-way traffic would be available only for public transport, which would increase the attractiveness of public transport as an alternative to private transport.

The Traffic Research on Sturova Street

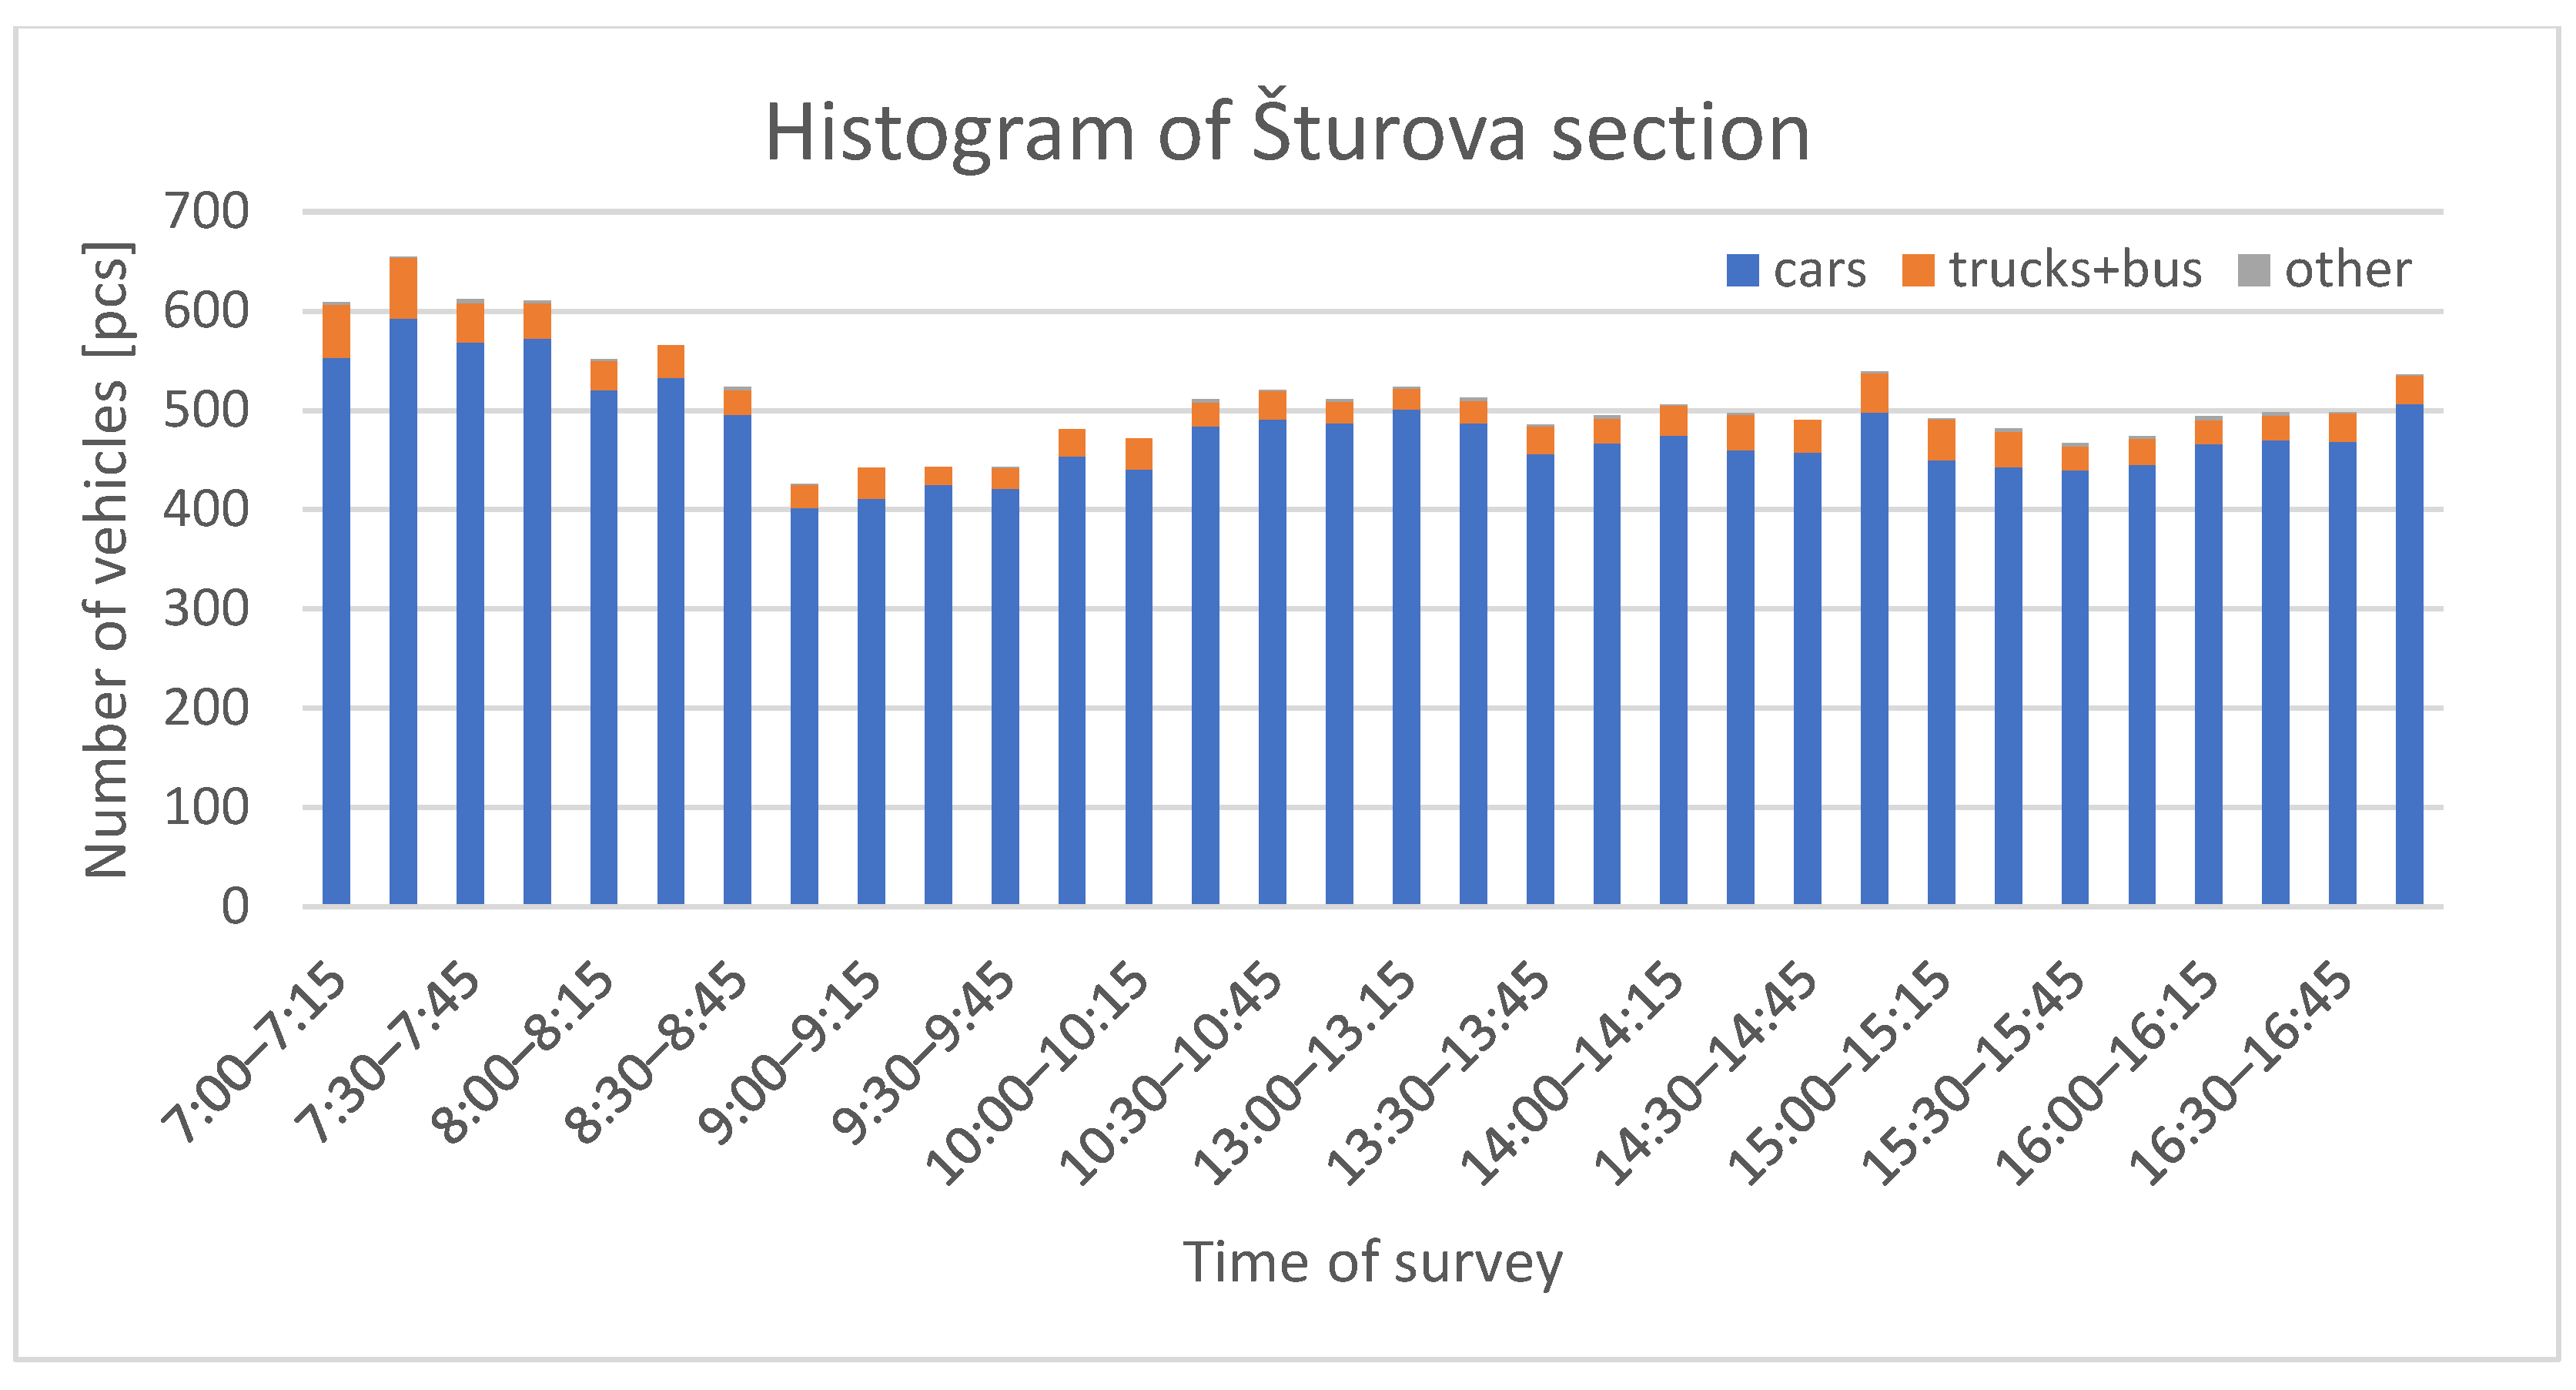
The indicative traffic research in the Sturova section (Figure 4) revealed that the most critical time as of the number of cars passed is the hour between 7:00 and 8:00. It is the morning rush hour, so the study is focused only on the slot between 7:00 and 8:00. The research was performed at 15 min intervals from 7:00 to 17:00 during a regular working day.

2.2. The Calculation of Permissible Intensities on the Internal Circuit

The permissible traffic flow intensity Ip of the overall urban roads is calculated according to the relation (1) [65]:
I p = I z · k k · k s · k m · k b   [ vehicle / h ]
where
Ip
permissible traffic flow [vehicle/h];
Iz
the basic value of the permissible traffic flow intensity [vehicle/h];
kk
coefficient of influence of a light-controlled junction [-];
ks
width factor [-];
km
maneuvering factor [-];
kb
factor of very slow vehicle [-].
The basic values of the permissible traffic flow intensity Iz depend on the required speed, the proportion of slow vehicles and the longitudinal angle of the road. For a two-lane road, the values of Iz are in Table 1, for a four-lane road in Table 2 [65].
The coefficient of influence of a light-controlled intersection kk (Table 3) depends on the ratio of the green phases at a given intersection and the distance in the intersection section.
The width factor ks (Table 4) expresses the influence of the width arrangement of the cross-section and the width of the lane on the permissible intensity of the traffic flow. In our case, all lanes on the inner circuit are 3.5 m wide. On some sections of the inner circuit road, there is a directionally divided road; on others, there is not.
The maneuvering factor km (Table 5) expresses the effect of deceleration (stopping) of maneuvering vehicles in the urban road lane at:
-
Turning or entering vehicles from the lane for parking or service on the associated lanes, on the stop lane, from adjacent buildings and less traffic-controlled intersections, etc.
-
Standing on the lanes of vehicles operating adjacent objects, traffic lanes in front of pedestrian crossings and non-rail public transport vehicles.
The maneuvering factor is determined from the range of maneuvers of vehicles affecting the traffic conditions of the traffic flow in the evaluated sub-section of the intersection section. Maneuvers in the previous and next sub-section and starting from longitudinal parking and secondary urban road are not considered. The most unfavorable turning or stopping maneuvering factor is used to determine the permissible intensity.
The influence of very slow vehicles kb in the traffic flow applies to the urban road with a proven regular occurrence of these vehicles. In our case, it is up to 2%, so the value of kb is equal to 1 (Table 6).
The values of the primary permissible intensities (Table 1, Table 2, Table 3, Table 4, Table 5 and Table 6) and the factors can be linearly interpolated.

2.3. The Simulation Transport Model

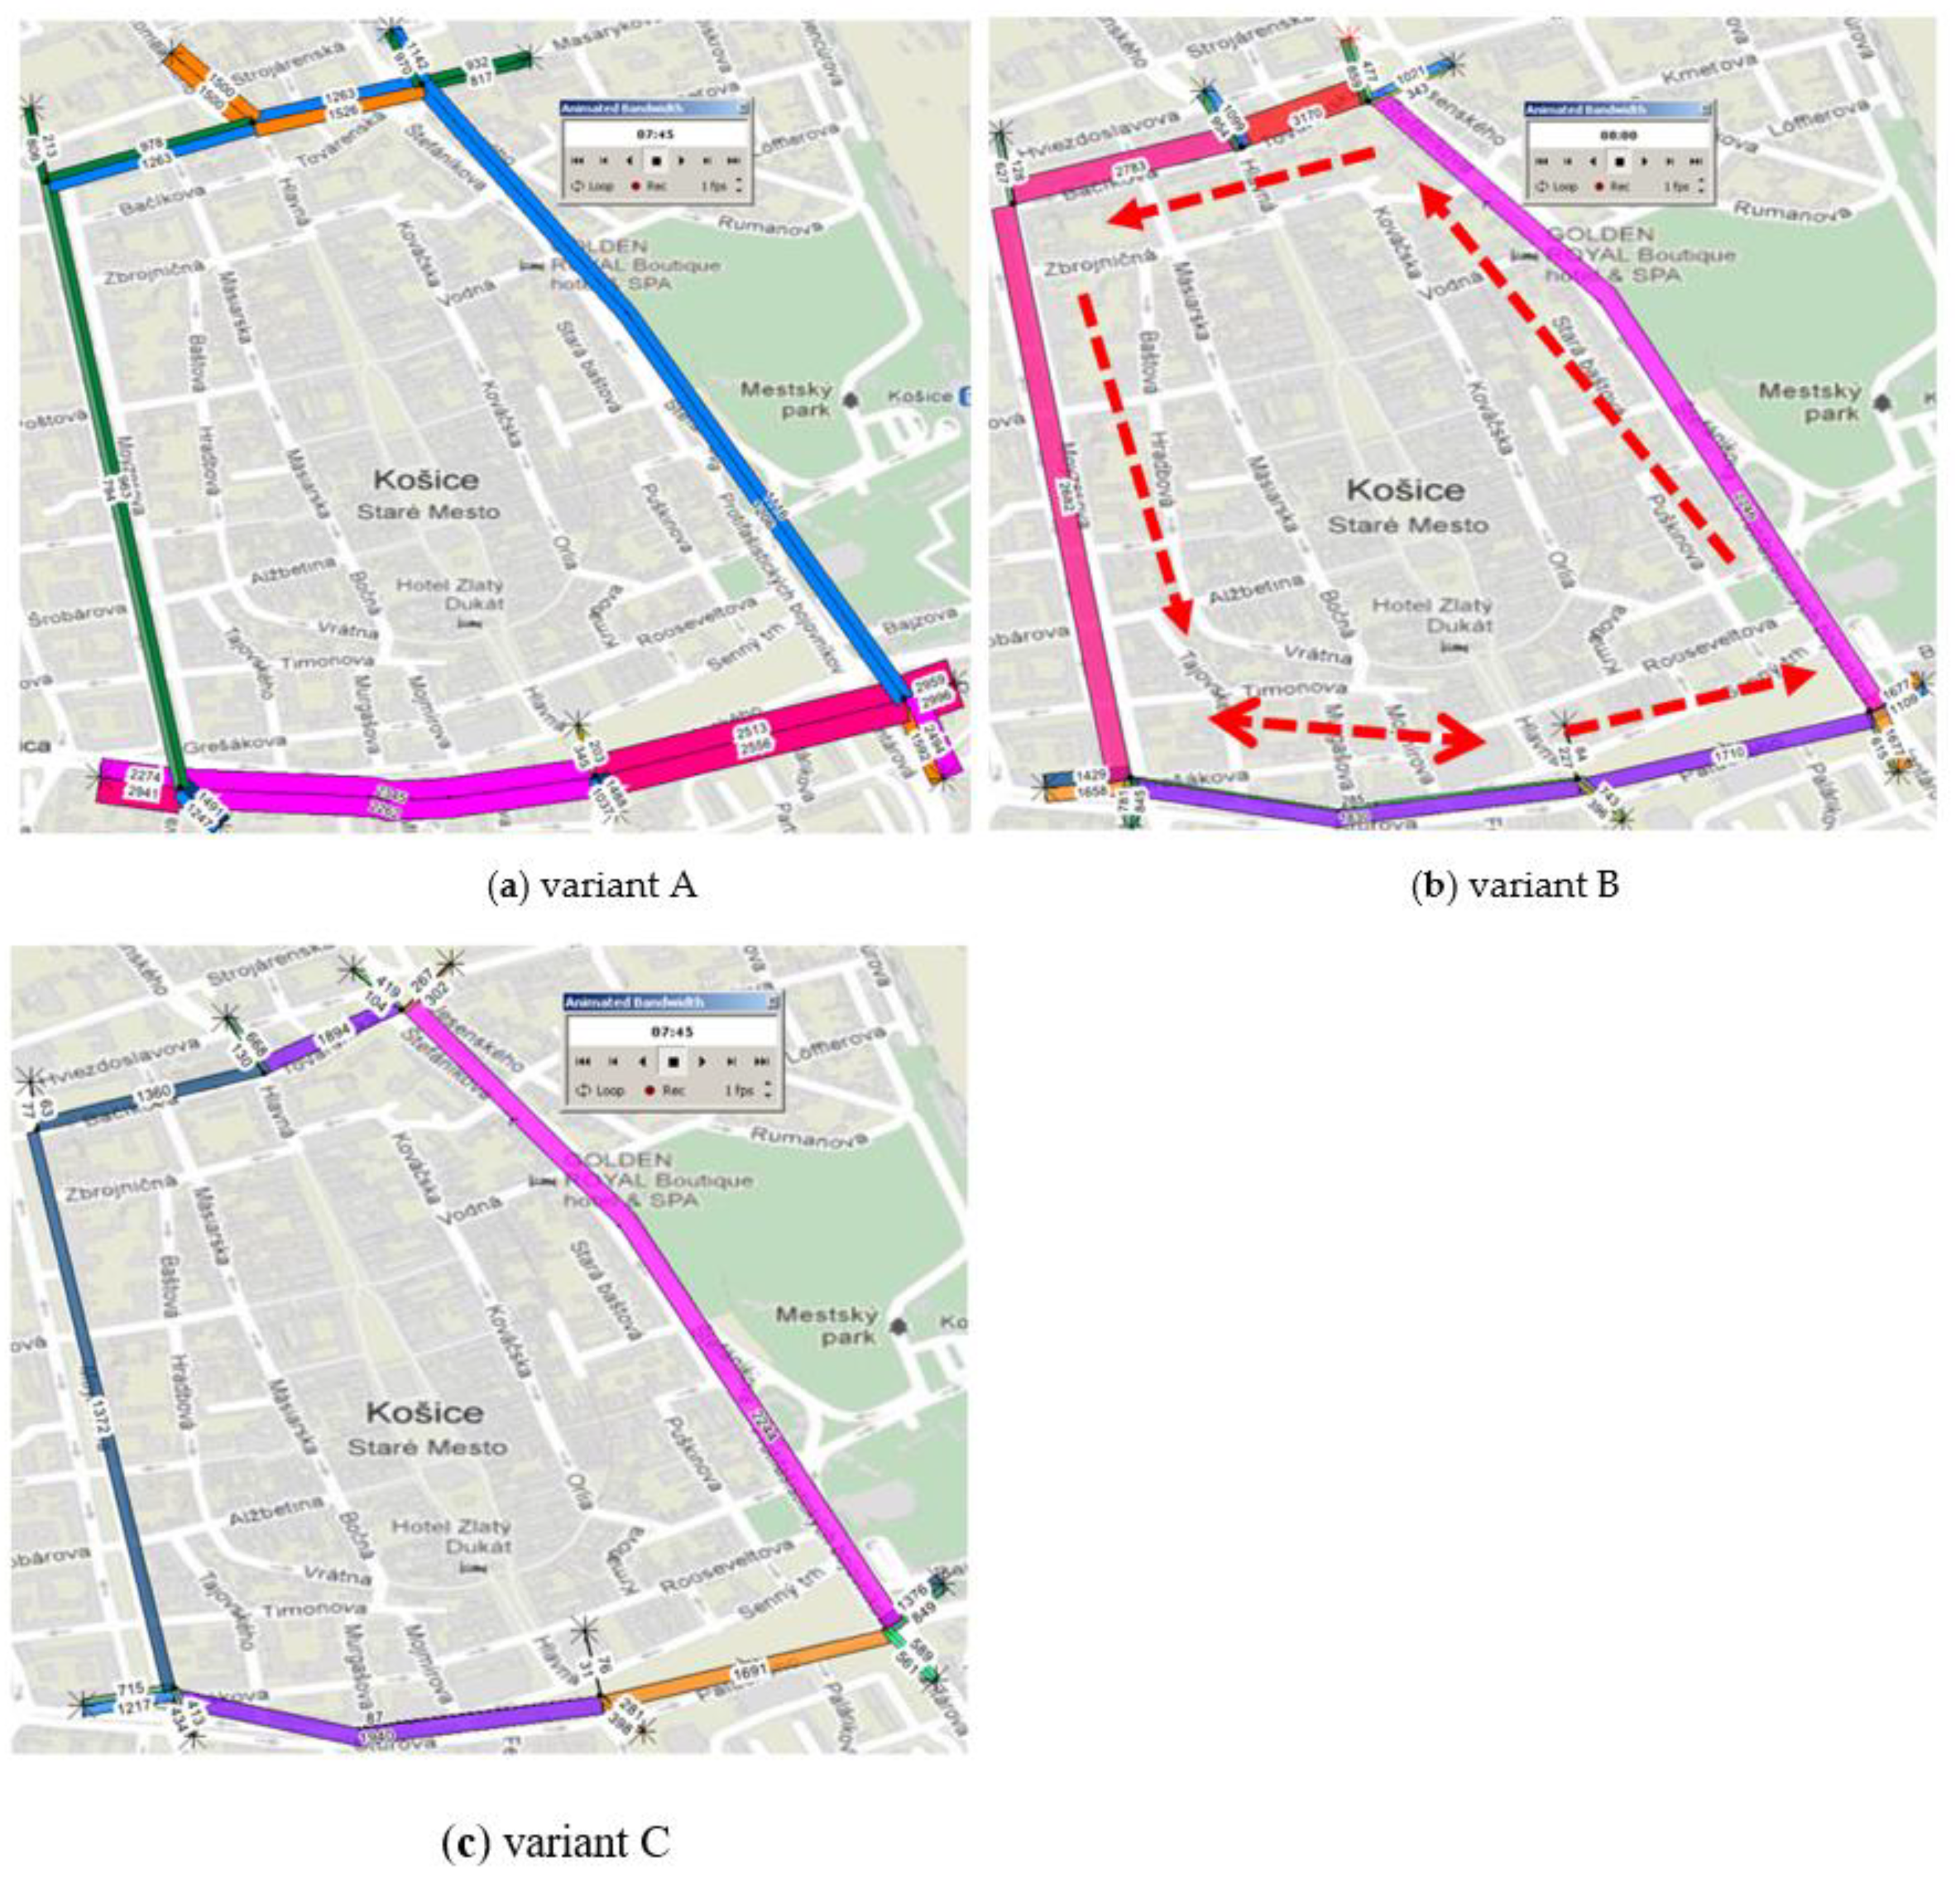
The simulation traffic model is created to monitor and assess changes in the internal traffic circuit. It is made in the following three variants:
Variant A—the model of the current state of the internal traffic circuit with the two-way road;
Variant B—the model of the proposed change of the internal traffic circuit with consideration of one-way traffic;
Variant C—the model of the proposed change of the internal traffic circuit with the assumption of reducing the number of vehicles by 10%. In this variant, a reduction in the number of private cars by 10% is expected due to the greater use of public transport. The estimate of 10% is based on a short research among motorists, where 10% of the total number of 200 were in favor of the use of public transport after the unification of the inner circuit road of the city.
OmniTRANS traffic modelling program is used to create the model and simulate the three variants mentioned above. The traffic model can be in static or dynamic form. The second mentioned dynamic model is used in this article.
The output is a graphical representation of, e.g., traffic intensity, traffic network load in the static model. The output of the dynamic model is the load of the transport network in time intervals with the respective traffic volumes.
The program uses the OJL programming language to create traffic models. The OJL programming language works with simple and more complex scripts as needed, containing a group of simple commands. Separate scripts are divided into nine groups of modelling classes according to the type of modelling. The MADAM method is used for dynamic modelling in OmniTRANS [66,67].
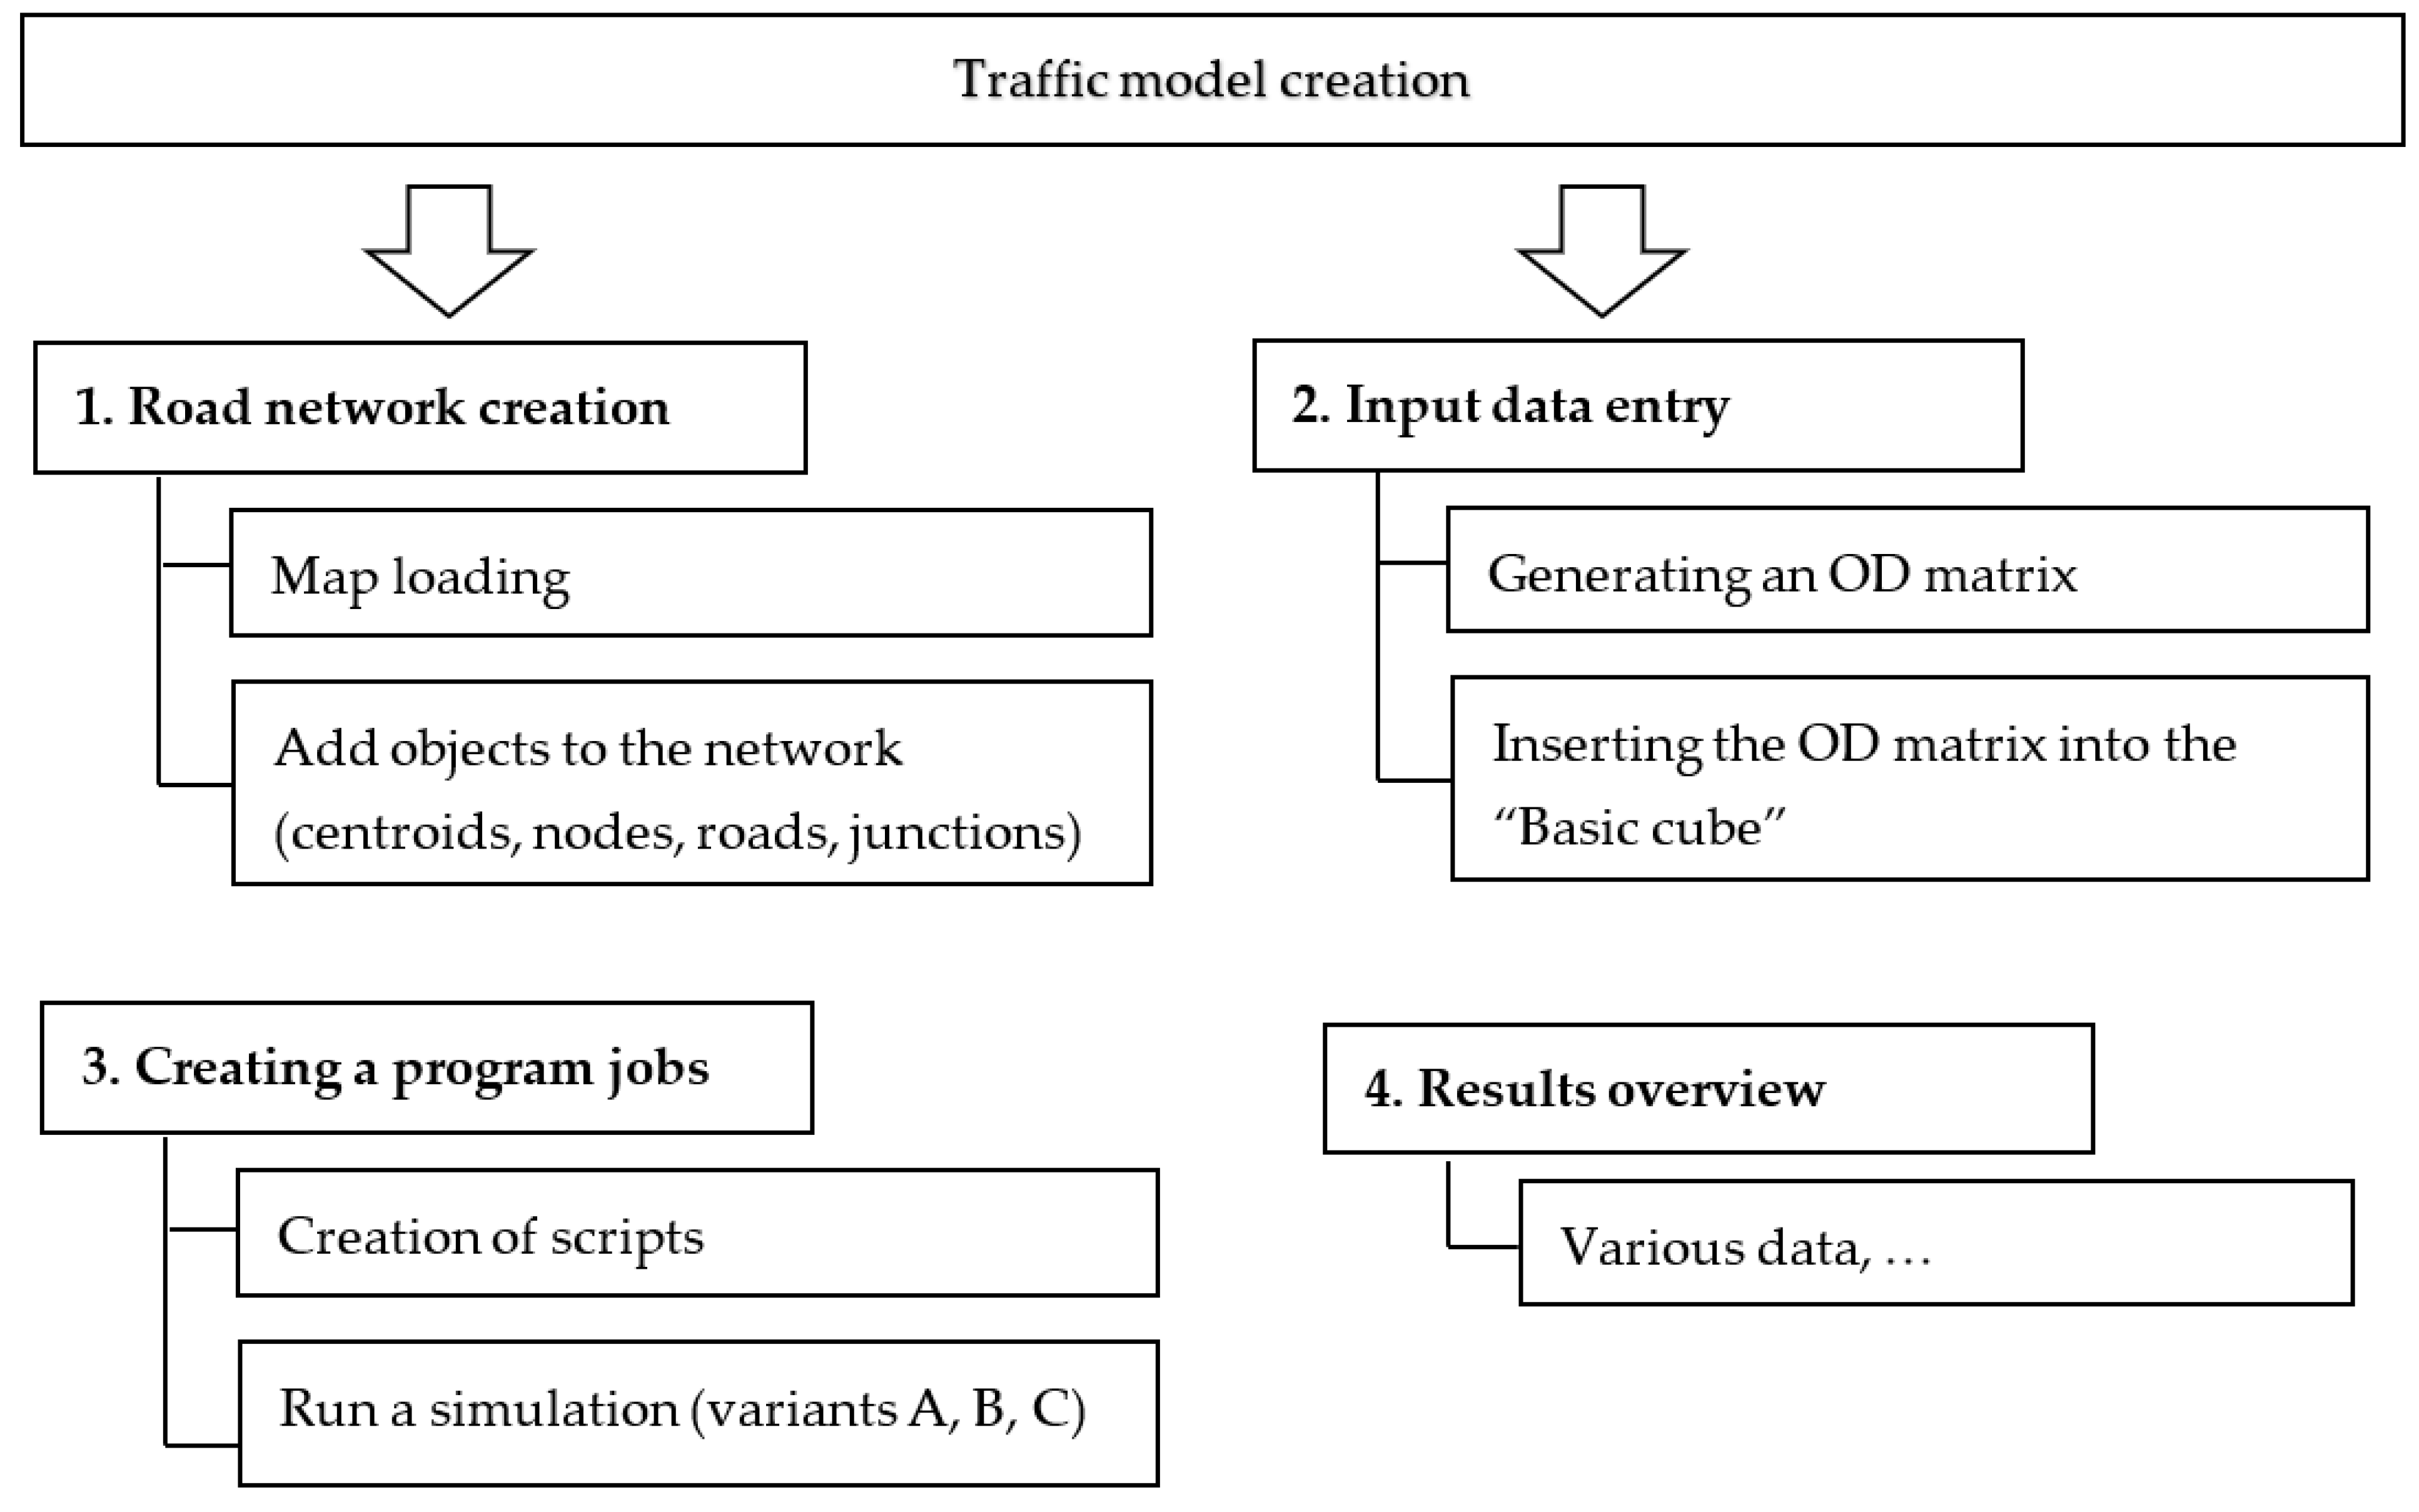
All variants of the traffic model are created for the morning rush hour, i.e., between 7:00 and 8:00. The procedure for creating a simulation model is shown in Figure 5.

2.3.1. Road Network Creation

The transport network of the internal transport circuit consists of 10 centroids, 6 nodes and 6 road sections (Table 7).
Figure 6 shows a transport network with defined centroids, nodes and links. For Option B, the network consists of the equal number of districts, nodes and road sections. The change exists in the road section settings. Only one two-way road will remain from the current six two-way roads and the remaining five sections will be one-way roads with two lanes for private transport. The lane for buses in the transport model is not included. The layout changes when road traffic is redirected from Hviezdoslavova Street to Tovarenska and Bacikova Streets (Figure 6b).
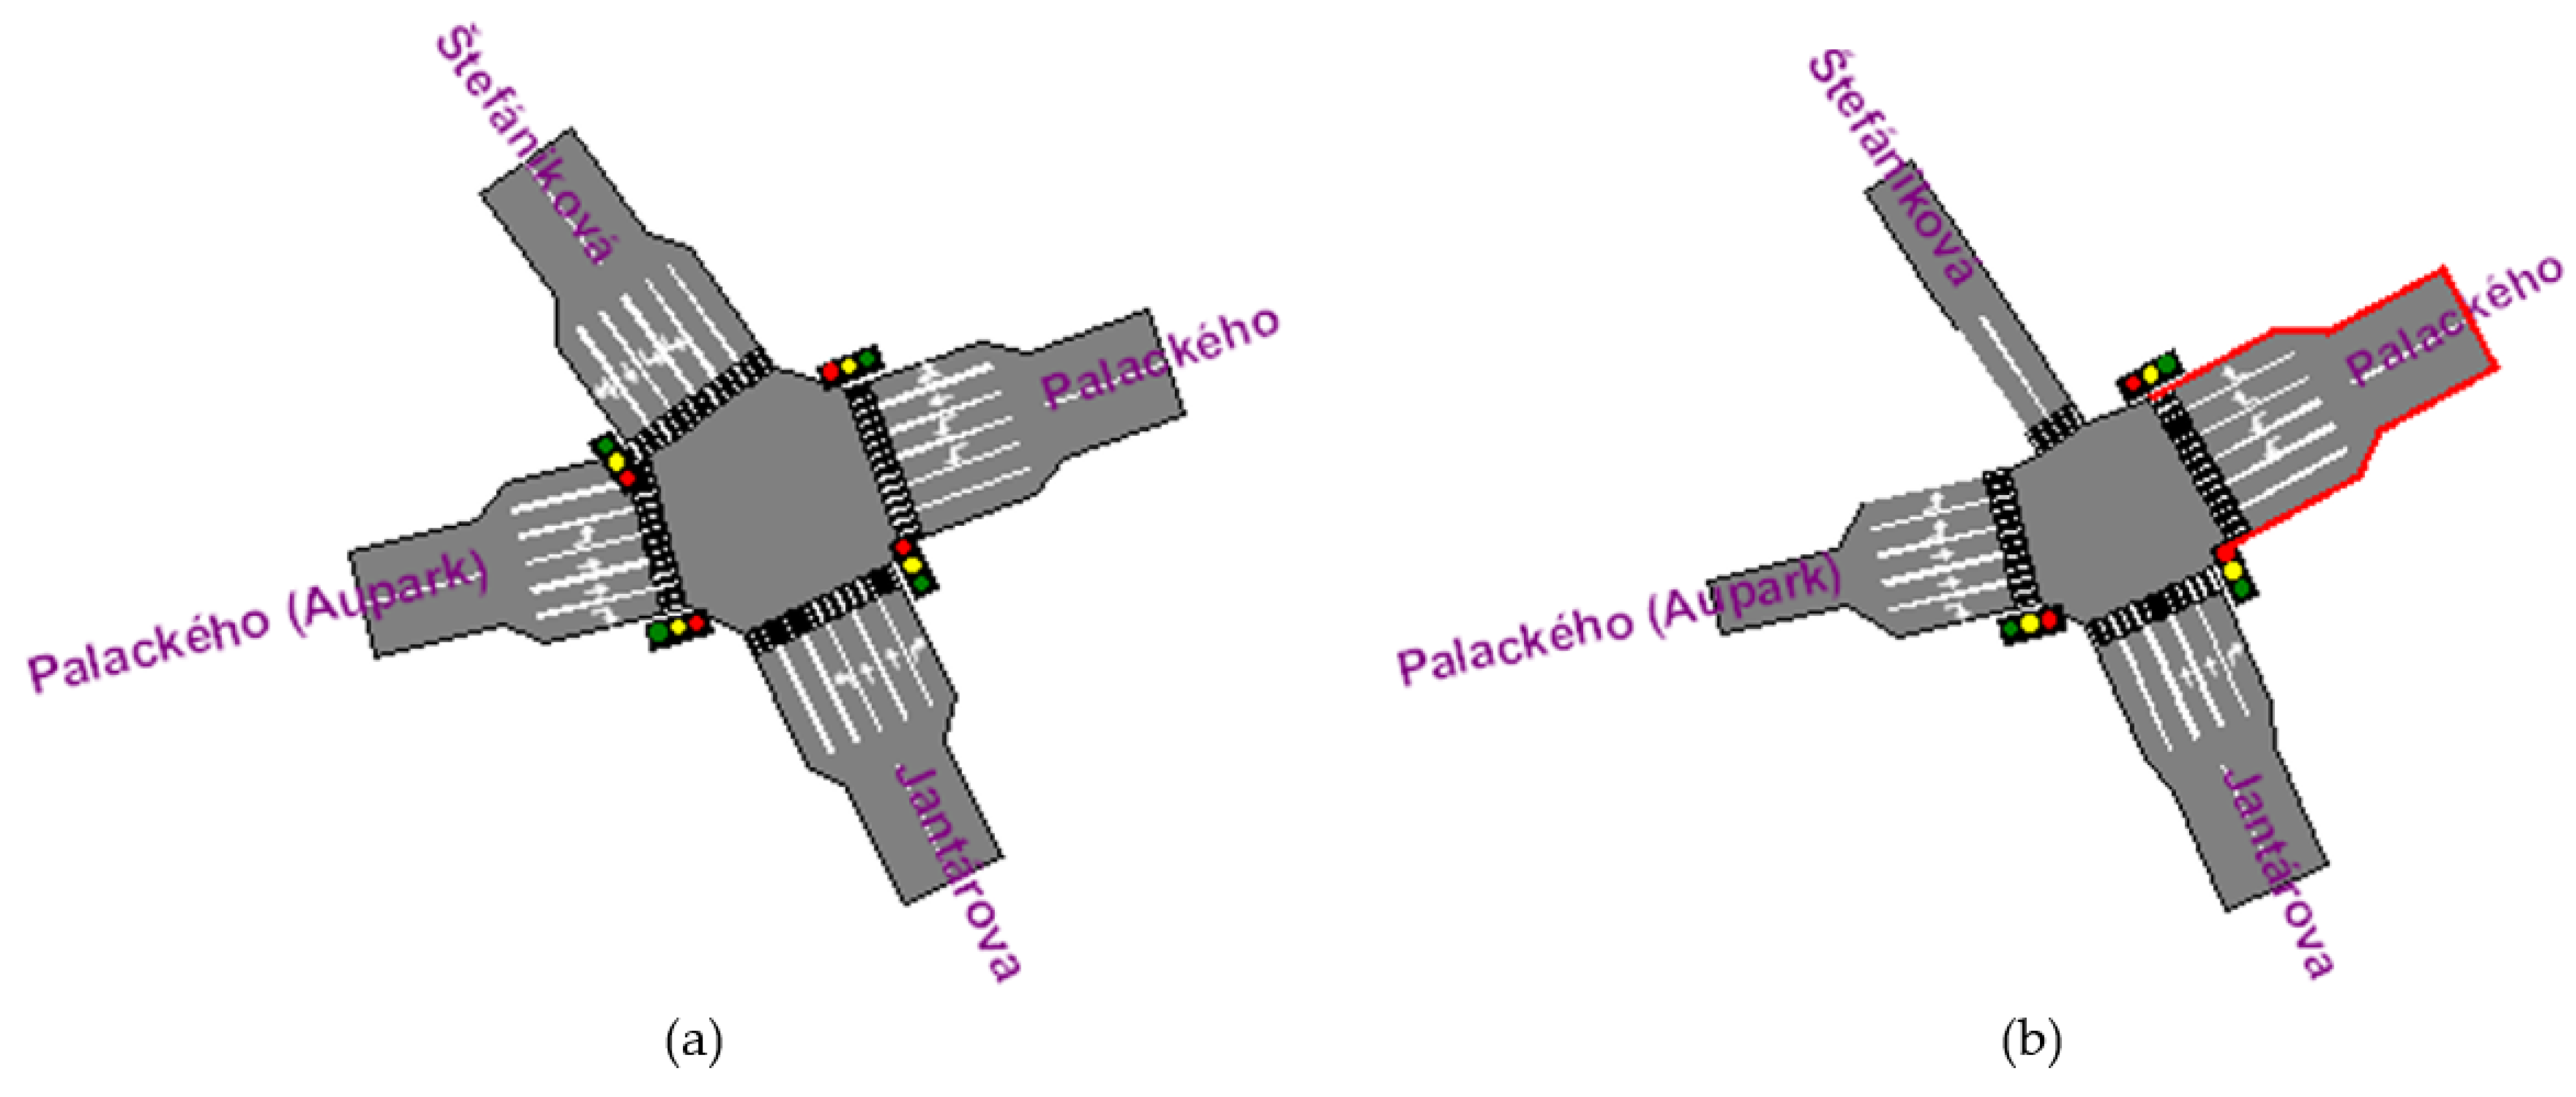
The nodes are placed where at least two road sections are connected. So, they are practically intersections. There are 5 light-controlled intersections and one roundabout intersection on the transport network. Two versions for each intersection were created, one for Variant A and one for Variants B and C. An illustrative example can be seen in Figure 7a, which shows the light-controlled intersection of Palackeho (Aupark)–Jantarova for Variant A and Figure 7b is the model of the intersection after the change to a one-way road (Variant B, C). A noticeable change is introducing a one-way road Stefanikova in the direction from the shown node to the northern sections of the internal traffic circuit.
The signal plan is set in the mode for morning rush hour “10: AM” and a cycle of 90 s. Figure 8a shows the signal plan setting of the above light-controlled junction. An organizational change (one way) in the transport node also changes the signal plan (Figure 8b). This means that, when the traffic organization is changed on the internal traffic circuit, changes in the settings of the signal plan will occur at all traffic nodes, while the cycle is not changed, but remains at 90 s.

2.3.2. Input Data to the Simulation Model

The OD matrix, which contains mutual transport relations between centroids, is needed to perform the simulation on the model created above. As mentioned above in this article, traditional methods for constructing an OD matrix involve extensive traffic research, which is done only once in a while, and it is very expensive and time-consuming [61]. There are also situations where such research cannot be carried out due to financial or pandemic reasons. An example is a current situation where research could not be carried out as a result of the various restrictions caused by the COVID-19 pandemic, such as curfews, ordered work from home, etc. As a result, we could not provide accurate results due to reduced mobility.
Fortunately, OmniTRANS allows for estimating the OD matrix from old research. In our case, research conducted in 2015 can estimate the OD matrix [68]. The methodology and algorithm for estimating the OD matrix are solved by several authors in their studies and are not interested in this article.
To estimate the OD matrix, we will use studies conducted in 2015 as part of the last national traffic census. The values of traffic intensity at all entrances and exits to/from the town’s internal traffic circuit were subtracted from the traffic survey provided in 2015. Based on these data, the so-called historical OD matrix for both Variant A and Variant B. Table 8 shows the historical matrix for the current state, i.e., bidirectional traffic on the inner circuit (Variant A) and in Table 9, the historical matrix for Variant B is compiled. The OD matrix for variant C is created from the historical source–target matrix for Variant B, with the number of vehicles reduced by 10%. The numbers of vehicles in the source–target matrices are rounded up to integers. The number of vehicles and the number of public transport funds was recorded.
Individual simulation experiments, conducted separately for each variant, were performed based on these input values. The simulation results are presented in the following chapter.

3. Results and Discussion

This chapter presents simulation experiments for three variants (variant A, variant B, variant C). All experiments are set up during the morning rush hour, i.e., between 7:00 and 8:00. Considering the evaluation of the results, we monitor—for all three variants—the inter-district traffic relations, the intensities at the intersections and the intensities of the intersection sections.

3.1. Display of Inter-District Traffic Relations

Figure 9 shows the inter-district relationships for Variant A, Variant B and Variant C. There can be found a decrease in the direction of traffic flows between the Narodna trieda–Sturova and Narodna trieda–Palackeho districts by comparing the results between Variant A and Variant B. On the other hand, there is an evident increase in traffic flows in the Jantarova–Palackeho district. With the expected decrease in the number of vehicles of 10% in Variant C, this negative phenomenon is eliminated to the values corresponding to Variant A, i.e., the current state. Traffic flow in Figure 9 represents vehicles per hour, specifically between 7:00–8:00.

3.2. Illustration of Traffic Intensities at Intersections

A comparison of the junction cartograms for Variants A, B and C is shown in Figure 10. In this view, we can compare the current transport intensities for each modelled variant. The highest intensity of transport flow is in the direction from Palackeho to Palackeho (Aupark). The numbers show the number of vehicles passed through the individual branches of the intersection, e.g., in the direction from Palackeho to Palackeho (Aupark), 583 vehicles/h will pass at Variant A. This straight direction will be cancelled at Variant B, which will lead to a rapid increase in intensity in the direction from Palackeho to Stefanikova Street (right) to 1233 vehicles/h.

3.3. Illustration of Intensities of Intersection Sections

Figure 11 shows the traffic intensity at 7:45. The expansion of the morning rush hour can be observed at this time. As can be seen from the figure that there is a change in the introduction of one-way traffic in the inner traffic circuit in Variant B. Red arrows indicate the direction of the one-way circuit. Sturova Street (Section 1) remains the only two-way section. The obtained results of the model for Variant B show that 75% of the sections of the internal traffic circuit are over capacity. The busiest section is Tovarenska Street (Section 4). The least-loaded section for Variant B is the Sturova section (Section 1). In the previous Variant A, the Sturova section was the busiest. The cancellation of road traffic causes this significant change from all directions in the junction Palackeho (Aupark)–Jantarova–Palackeho–Stefanikova towards the western part of the city of Kosice. The detour in this direction begins on Stefanikova Street. This change also harms the direction of traffic flows at the light-controlled intersection of the relevant transport hub. The majority of the traffic flows are directed at Stefanikova Street. Up to 110% of the load belongs to the arm of a light-controlled intersection in the direction from Palackeho to Stefanikova. A similar effect occurs on Moyzesova Street, which serves as the only gateway to the districts of Sturova and Rastislavova. This road is used by all vehicles heading from up to six districts of Jantarova, Palackeho, Masarykova, Narodna trieda, Komenskeho and Ceskoslovenskej armady. On the contrary, the reduction in congestion at the entrances to the internal traffic circuit from the Palackeho and Sturova districts will have a positive effect, making this section one-way only.
The local roads have to be classified at first according to the percentage load for the overall evaluation of individual simulation experiments in terms of our goal, which was set up to assess the capacity load of road sections before and after introducing a one-way circuit. This classification is inspired by the approach presented in the publication [69]. In Table 10, the roads are divided into four groups according to their capacity utilization.
The percentage load of the road is calculated as the ratio of the actual intensity Im obtained from the simulation model and the permissible intensity on the given section calculated according to formula (1).
a s = I m I p · 100   [ % ]
where:
Im
current traffic flow intensity from model [vehicles/h];
Ip
permissible traffic flow intensity [vehicles/h].
The following table shows the results of simulation experiments in the inner traffic circuit of the city for each modeled variant. From the results, we can assess the suitability of each option, especially in terms of the capacity of local roads.
Thanks to the transport simulation model of the town’s internal transport circuit in three variants, we can compare and assess which of the variants best meets the capacity requirements of local roads. A comparison of the results of the simulation experiments for Variant A and Variant B in Table 11 reveals the following findings:
  • Creating a one-way circuit of the inner ring road in Kosice will increase the capacity load of the road on all sections, which is approaching or even exceeding the calculated permissible values of intensity.
  • Section 1: The number of vehicles passing through this section will be reduced from 1524 vehicles/h to 1403 vehicles/h, but the capacity load of the road will increase from 40% to 99%, so the quality of the section according to Table 10 will decrease from group B to group C.
  • Section 2: Even in this section, the number of vehicles will decrease from 1527 vehicles/h to 1130 vehicles/h, but the capacity load will increase to 84% and the quality of the section will decrease from group B to group C.
  • Section 3: Probably the most affected section will be section No. 3 Stefanikova, in this locality due to the creation of one-way communication of the inner circuit, the number of cars will increase from 1043 vehicles/h to 1491 vehicles/h., these values being 4% higher than the permissible capacity of this road. During two-way road traffic (Variant A), this local road is used by vehicles heading from the Jantarova and Palackeho junctions to the Aupark, Juzna trieda, Rastislavova and Sturova junctions. Option B is not valid anymore due to the introduction of one-way traffic on the Palackeho (Aupark) section. The vehicles are redirected to the Stefanikova street. The quality of the section will deteriorate to grade D, where traffic jams and congestions are likely to occur.
  • Section 4: Even in this section, there will be a slight change from group C to group D, even though the number of vehicles will increase slightly.
  • Section 5: In this section, although there will be a slight decrease in vehicles during the morning rush hour, the capacity load of the road will worsen while increasing to 96%. This level is close to the allowed intensity of this road, which will thus worsen to group D.
  • Section 6: This section is least affected by the planned changes. The capacity load of this road will increase from 22% to 67%, which is group C, but there is still some space.

4. Conclusions

In this article, we have focused on the study of one-way traffic effects of the internal traffic circuit in the city of Kosice. The aim is to determine whether the change in the organization of transport, from two-way to one-way traffic, will have an impact on the change in its quality. For this purpose, we have used a traffic simulation model with three variants: Variant A represents the current situation, i.e., two-way traffic; Variant B represents the proposal of one-way traffic; Variant C represents one-way traffic with an expected decrease in the number of passenger cars of 10%.
We have assessed every variant in terms of the load percentage of each road section. To this end, we have adapted the traffic quality evaluation system shown in Table 10, which is inspired by the LOS (Level of Service).
In general, the study reveals that the one-way nature of the traffic will not have any positive effect on the traffic situation on the internal traffic circuit of the city. The most advantageous variant in terms of the established system of transport quality level (Table 11) is Variant A, which is the current state of transport organization. Regarding Variant B, the traffic quality level is reduced in all cases, with the exception of level D “unstable”. As can be seen in Table 11, Variant C also results in quality-level reduction in each road section. In addition, if we consider other negative impacts of one-way traffic, such as a higher accident rate in the publication [13], higher distance traveled or economic impacts [14], then Variant A appears to be the most suitable alternative. On the other hand, there are cases in which one-way traffic can effectively reduce the total travel time of travelers in a certain congested urban area. Thus, as the results of the study [11] show, the solution could be an introduction of one-way traffic only in some sections of the road. Additionally, the authors Chiu, Zhou and Hernandez [15] state that one-way traffic may have advantages over two-way traffic under certain circumstances, so this topic requires further research.
The city of Kosice based its design of one-way traffic on the inner traffic circuit on experience with some new one-way streets in the city center, that brought an improvement in traffic flow, which resulted in an increase in the number of parking spaces. As this study has shown, the introduction of one-way traffic may not always be advantageous but definitely depends on many other factors, such as the need of creating new parking spaces, the presence of traffic lights, the number of vehicles in transit and others.
The uniqueness of the study lies in the fact that we have used a completely new approach to assess the suitability of two-way vs. one-way traffic by means of a load percentage on urban roads. None of the published studies known to us use this methodology. According to our literature research, most similar studies work with criteria such as Traffic intensity, Signal timing, Vehicle distance traveled, Average move time, Average speed or Fuel consumption. These are undoubtedly important criteria for the selection of road configuration but our study reveals that, when assessing the advantage of particular variant, we should focus not only on monitoring the intensities or time traveled by vehicles but also on the load percentage of the road section. As evident from the results in Table 11, for Variant A, the ratio of urban road intensities with capacities is the most favorable. The load percentage on the roads here reaches excellent values when most of the sections are in quality grade A, B and only 2 sections are in quality grade C, which is still sufficient. With Variant B, we have only two lanes available for one-way traffic of passenger cars. This situation causes an increased load on the inner traffic circuit roads and a shift to grade D and, in one case, grade C.
In comparison with the available literature sources, the methodology used in this article brings a certain progressive element. The scientific and professional contributions of this study are as follows:
-
Creating a traffic simulation model of the inner traffic circuit for the city of Kosice on which various traffic scenarios can be tested. The importance of traffic simulation models for traffic planning and forecasting in cities is enormous and allows traffic engineers to parametrically examine possible changes in traffic before these changes are made and thus optimize the traffic situation. Without a detailed traffic impact study approach, the traffic planners may always have to hold their breath on what may actually happen after the conversion.
-
Proposal of a methodology for assessing the capacity of urban roads based on a traffic simulation model.
-
Creating a categorization of road quality that can be acquired by other cities.
Most of the available studies use simulation models created in Vissim or Aimsun programs, but only a few publications deal with the simulation model in the OmniTRANS program, which is more affordable. Among the shortcomings and limitations of simulation models belong a risk that modeling assumptions become invalid for later applications of the model, or urban roads are subject to a variety of random disruptions that cannot be included in the model.
We would like to focus our future research on parametric study under the changing conditions of the created model. Here, we present an interesting alternative of two-way streets with prohibited left turns. We have not considered such an alternative yet, but the results of the study by Ortigosa [21] indicate that this is the best compromise between distance traveled and capacity at intersections. Other questions remain open, such as studying congested vs. non-congested roads or finding a suitable combination of two-way traffic sections with one-way traffic sections.

Author Contributions

Each author (P.B., J.S., M.S., P.K., J.B., M.T.) has equally contributed to this publication. Conceptualization, J.B. and P.B.; methodology, J.S. and M.T.; validation, J.S. and M.S.; formal analysis, J.S. and M.T.; resources, J.S. and J.B.; data curation, P.K. and P.B.; writing—original draft preparation, J.S. and P.B.; writing—review and editing, J.S. and P.B.; visualization, J.S. and P.K.; supervision, J.B. and M.S.; project administration, P.B. and M.S.; funding acquisition, J.S. and M.S. All authors have read and agreed to the published version of the manuscript.

Funding

This work is supported by the Scientific Grant Agency of the Ministry of Education, Science, Research, and Sport of the Slovak Republic and the Slovak Academy Sciences as part of the research project VEGA 1/0588/21; is supported by the Cultural and Educational Grant Agency of the Ministry of Education, Science, Research and Sport of the Slovak Republic and the Slovak Academy of Sciences as part of the research project KEGA 006TUKE-4/2019.

Institutional Review Board Statement

Not applicable.

Informed Consent Statement

Not applicable.

Data Availability Statement

The data presented in this article are available on request from the corresponding author.

Acknowledgments

The authors would like to thank the anonymous referees for their valuable comments that improved the quality of the manuscript.

Conflicts of Interest

The authors declare no conflict of interest.

References

  1. Kiba-Janiak, M.; Witkowski, J. Sustainable Urban Mobility Plans: How Do They Work? Sustainability 2019, 11, 4605. [Google Scholar] [CrossRef] [Green Version]
  2. Cervero, R. Induced Demand: An Urban Metropolitan Perspective; University of California Transportation Center: Berkeley, CA, USA, 2001; Working Papers. [Google Scholar]
  3. Bhattarai, K.; Conway, D. Urban Growth. In Advances in Asian Human-Environmental Research; Springer: Berlin/Heidelberg, Germany, 2021; pp. 201–334. [Google Scholar]
  4. Siroky, J.; Nachtigall, P.; Tischer, E.; Gasparik, J. Simulation of Railway Lines with a Simplified Interlocking System. Sustainability 2021, 13, 1394. [Google Scholar] [CrossRef]
  5. Brunn, S.D.; Hays-Mitchell, M.; Zeigler, D.J.; Graybill, J.K. Cities of the World: Regional Patters and Urban Develpments; Rowman & Littlefield Publishers: Lanham, MD, USA, 2020. [Google Scholar]
  6. Rybar, R.; Kudelas, D.; Beer, M.; Horodnikova, J. Elimination of Thermal Bridges in the Construction of a Flat Low-Pressure Solar Collector by Means of a Vacuum Thermal Insulation Bushing. J. Sol. Energy Eng. 2015, 137, 054501. [Google Scholar] [CrossRef]
  7. Papageorgiou, G.; Damianou, P.; Pitsillides, A.; Aphamis, T.; Charalambous, D.; Ioannou, P. Modelling and simulation of transportation systems: A scenario planning approach. Automatika 2009, 50, 39–50. [Google Scholar]
  8. Kiba-Janiak, M. Urban freight transport in city strategic planning. Res. Transp. Bus. Manag. 2017, 24, 4–16. [Google Scholar] [CrossRef]
  9. Zhang, J.; Zhang, X.; Yang, Y.; Zhou, B. Study on the influence of one-way street optimization design on traffic operation system. Meas. Control 2020, 53, 1107–1115. [Google Scholar] [CrossRef]
  10. Gilham, J. Reviewing Potential One-Way Street Conversions in Established Neighbourhoods. In Proceedings of the Transforming Infrastructure of the Past to Accommodate Traffic of the Future Session, Conference of the Transportation Association of Canada, Montreal, QC, Canada, 15 July 2014; p. 16. [Google Scholar]
  11. Karimi, H.; Ghadirifaraz, B.; Boushehri, S.N.S.; Hosseininasab, S.-M.; Rafiei, N. Reducing traffic congestion and increasing sustainability in special urban areas through one-way traffic reconfiguration. Transportation 2021, 1–24. [Google Scholar] [CrossRef]
  12. Riggs, W.; Gilderbloom, J.I.H. How multi-lane, one-way street design shapes neighbourhood life: Collisions, crime and community. Local Environ. 2017, 22, 917–933. [Google Scholar] [CrossRef]
  13. Riggs, W.; Gilderbloom, J. Two-Way Street Conversion. J. Plan. Educ. Res. 2016, 36, 105–118. [Google Scholar] [CrossRef]
  14. Riggs, W.; Appleyard, B. The economic impact of one to two-way street conversions: Advancing a context-sensitive framework. J. Urban. Int. Res. Placemak. Urban Sustain. 2018, 11, 129–148. [Google Scholar] [CrossRef]
  15. Chiu, Y.-C.; Zhou, X.; Hernandez, J. Evaluating Urban Downtown One-Way to Two-Way Street Conversion Using Multiple Resolution Simulation and Assignment Approach. J. Urban Plan. Dev. 2007, 133, 222–232. [Google Scholar] [CrossRef] [Green Version]
  16. Baco, M. One-Way to Two-Way Street Conversions as a Preservation and Downtown Revitalization Tool: The Case Study of Upper King Street, Charleston, South Carolina; Clemson University: Charleston, SC, USA, 2009. [Google Scholar]
  17. Missoula Redevelopment Agency. Front Street/Main Street Two-Way Conversion; Missoula Redevelopment Agency: Missoula, MT, USA; Feasibility Study: Missoula, MT, USA, 2015. [Google Scholar]
  18. Lyles, R.; Faulkner, C.; Syed, A. Conversion of Streets from One-Way to Two-Way Operation. Final Report; Michigan Department of Transportation: Lansing, MI, USA, 2000. [Google Scholar]
  19. Krajnak, M. Posúdenie Ciest a Miestnych Komunikácii v Meste Košice Podľa ich Priepustnej Výkonnosti. Master’s Thesis, Technical University of Kosice, Kosice, Slovakia, 2010. [Google Scholar]
  20. Road Design 13. One-Way/Two-Way Street Conversions. Available online: https://safety.fhwa.dot.gov/saferjourney1/Library/countermeasures/13.htm (accessed on 30 January 2021).
  21. Ortigosa, J.; Gayah, V.V.; Menendez, M. Analysis of one-way and two-way street configurations on urban grid networks. Transp. B Transp. Dyn. 2017, 7, 61–81. [Google Scholar] [CrossRef] [Green Version]
  22. Başkan, Ö.; Ozan, C. Determining Optimum Configuration of One-Way and Two-Way Streets Using Shortest Path Travel Costs Based on Results of Traffic Assignment. Pamukkale Univ. J. Eng. Sci. 2018, 24, 1087–1092. [Google Scholar] [CrossRef] [Green Version]
  23. Kesavareddy, S.; Haleem, K.; Doustmohammadi, M.; Anderson, M. Comparison of Crash Severity Risk Factors at Signalized and Stop-Controlled Intersections in Urban and Rural Areas in Alabama. Int. J. Stat. Probab. 2018, 7, 50. [Google Scholar] [CrossRef] [Green Version]
  24. Yasuda, R.; Miyajima, T.; Yoshida, A. Numerical simulation of turbulent dispersion on a two-way facing traffic road. Int. J. Environ. Pollut. 2011, 44, 164. [Google Scholar] [CrossRef]
  25. Yu, Z.; Gayah, V.V. Resilience of Urban Street Network Configurations under Low Demands. Transp. Res. Rec. J. Transp. Res. Board 2020, 2674, 982–994. [Google Scholar] [CrossRef]
  26. Fan, J.; Gao, K.; Xing, Y.; Lu, J. Evaluating the Effects of One-Way Traffic Management on Different Vehicle Exhaust Emissions Using an Integrated Approach. J. Adv. Transp. 2019, 2019, 1–11. [Google Scholar] [CrossRef]
  27. Mintsis, E.; Belibassakis, M.; Basbas, S.; Pitsiava-Latinopoulou, M. The use of a transport simulation system (AIMSUN) to determine the environmental effects of pedestrianization and traffic management in the center of Thessaloniki. Eur. J. Environ. Sci. 2016, 6, 25–29. [Google Scholar] [CrossRef] [Green Version]
  28. Jinghui, W.; Yu, L.; QIAO, F. Micro Traffic Simulation Approach to the Evaluation of Vehicle Emissions on One-way vs. Two-way Streets: A Case Study in Houston Downtown. In Proceedings of the 92nd annual meeting of the Transportation Research Board, Washington, DC, USA, 13–17 January 2013; pp. 11–16. [Google Scholar]
  29. Straka, M.; Khouri, S.; Rosova, A.; Caganova, D.; Culkova, K. Utilization of Computer Simulation for Waste Separation Design as a Logistics System. Int. J. Simul. Model. 2018, 17, 583–596. [Google Scholar] [CrossRef]
  30. Straka, M.; Lenort, R.; Khouri, S.; Feliks, J. Design of Large-Scale Logistics Systems Using Computer Simulation Hierarchic Structure. Int. J. Simul. Model. 2018, 17, 105–118. [Google Scholar] [CrossRef]
  31. Marasova, D.; Saderova, J.; Ambrisko, L. Simulation of the Use of the Material Handling Equipment in the Operation Process. Open Eng. 2020, 10, 216–223. [Google Scholar] [CrossRef]
  32. Kliment, M.; Trebuna, P.; Pekarcikova, M.; Straka, M.; Trojan, J.; Duda, R. Production Efficiency Evaluation and Products’ Quality Improvement Using Simulation. Int. J. Simul. Model. 2020, 19, 470–481. [Google Scholar] [CrossRef]
  33. Pekarcikova, M.; Trebuna, P.; Kliment, M.; Rosocha, L. Material Flow Optimization through E-Kanban System Simulation. Int. J. Simul. Model. 2020, 19, 243–254. [Google Scholar] [CrossRef]
  34. Saderova, J.; Rosova, A.; Kacmary, P.; Sofranko, M.; Bindzar, P.; Malkus, T. Modelling as a Tool for the Planning of the Transport System Performance in the Conditions of a Raw Material Mining. Sustainability 2020, 12, 8051. [Google Scholar] [CrossRef]
  35. Rich, J. Transport Models—From Theory to Practise; Department of Transport, Technical University of Denmark: Lyngby, Denmark, 2015. [Google Scholar] [CrossRef]
  36. Næss, P.; Andersen, J.; Nicolaisen, M.; Strand, A. Transport modelling in the context of the “predict and provide” paradigm. Eur. J. Transp. Infrastruct. Res. 2014, 14, 102–121. [Google Scholar]
  37. Yao, R.; Zhou, H.; Ge, Y.-E. Optimizing signal phase plan, green splits and lane length for isolated signalized intersections. Transportaion 2017, 33, 520–535. [Google Scholar] [CrossRef] [Green Version]
  38. Chen, K.; Yu, L. Microscopic Traffic-Emission Simulation and Case Study for Evaluation of Traffic Control Strategies. J. Transp. Syst. Eng. Inf. Technol. 2007, 7, 93–99. [Google Scholar] [CrossRef]
  39. Delgado, A. Design of a 3D control system using PTV-VISSIM to manage Vehicle traffic. Int. J. Emerg. Trends Eng. Res. 2020, 8, 1819–1823. [Google Scholar] [CrossRef]
  40. Khurana, N.; Thakur, R. Integrated Simulation of Pacemaker and Heart Model with VISSIM. Int. J. Recent Technol. Eng. 2019, 8, 1387–1391. [Google Scholar] [CrossRef]
  41. Song, Z.; Wang, H.; Sun, J.; Tian, Y. Experimental Findings with VISSIM and TransModeler for Evaluating Environmental and Safety Impacts using Micro-Simulations. Transp. Res. Rec. J. Transp. Res. Board 2020, 2674, 566–580. [Google Scholar] [CrossRef]
  42. Wu, J.; Radwan, E.; Abou-Senna, H. Determination if VISSIM and SSAM could estimate pedestrian-vehicle conflicts at signalized intersections. J. Transp. Saf. Secur. 2017, 10, 572–585. [Google Scholar] [CrossRef]
  43. Arafat, M.; Nafis, S.R.; Sadeghvaziri, E.; Tousif, F. A data-driven approach to calibrate microsimulation models based on the degree of saturation at signalized intersections. Transp. Res. Interdiscip. Perspect. 2020, 8, 100231. [Google Scholar] [CrossRef]
  44. Al-Ahmadi, H.M.; Jamal, A.; Reza, I.; Assi, K.J.; Ahmed, S.A. Using Microscopic Simulation-Based Analysis to Model Driving Behavior: A Case Study of Khobar-Dammam in Saudi Arabia. Sustainability 2019, 11, 3018. [Google Scholar] [CrossRef] [Green Version]
  45. Bulla-Cruz, L.A.; Laureshyn, A.; Lyons, L. Event-based road safety assessment: A novel approach towards risk microsimulation in roundabouts. Measurement 2020, 165, 108192. [Google Scholar] [CrossRef]
  46. Maduranga, K.L.D.; Yasamali, R.G.N.; Sathyaprasad, I.M.S.; Weerakoon, H.U. Selection of Optimum Junction Operation Strategy for Gatambe Intersection Using VISSIM Simulation. In Proceedings of the SECON’19, Kerala, India, 15–16 May 2019; Metzler, J.B., Ed.; pp. 22–35. [Google Scholar]
  47. Fabianova, J.; Michalik, P.; Janekova, J.; Fabian, M. Design and evaluation of a new intersection model to minimize congestions using VISSIM software. Open Eng. 2020, 10, 48–56. [Google Scholar] [CrossRef] [Green Version]
  48. Suthanaya, P.A.; Upadiana, N. Traffic management of Udayana University Sudirman campus intersection using Vissim software. MATEC Web Conf. 2019, 276, 03006. [Google Scholar] [CrossRef] [Green Version]
  49. Nickkar, A.; Lee, Y.J. Evaluation of dedicated lanes for automated vehicles at roundabouts with various flow patterns. In Proceedings of the Transportation Research Board 98th TRB Annual Meeting 2019, Washington, DC, USA, 13–17 January; The National Academies of Sciences, Engineering, and Medicine: Washington, DC, USA, 2019; p. 11. [Google Scholar]
  50. Vilarinho, C.; Soares, G.; Macedo, J.; Tavares, J.P.; Rossetti, R.J. Capability-enhanced AIMSUN with Real-time Signal Timing Control. Procedia Soc. Behav. Sci. 2014, 111, 262–271. [Google Scholar] [CrossRef] [Green Version]
  51. Shabaniverki, H.; Karimian, Z.; Arbab, A. Evaluation of Safety Performance Functions by AIMSUN Micro-Simulation Model. J. Geotech. Transp. Eng. 2015, 1, 19–24. [Google Scholar]
  52. Ciuffo, B.; Casas, J.; Montanino, M.; Perarnau, J.; Punzo, V. Theory to practice: Global sensitivity analysis of the Aimsun meso model. Traffic Eng. Control 2014, 55, 9–17. [Google Scholar]
  53. Rahimov, K.; Motamadnia, A.; Samadi, S. Technical and Economic Evaluation of Pinavia Interchange in Comparison with Roundabout Intersection by AIMSUN. Civ. Eng. J. 2016, 2, 102–112. [Google Scholar] [CrossRef]
  54. Bature, A.S.; Georgakis, P. Evaluation of the Effect of VMS In Reducing Congestion Using Aimsun Tool: A Case Study Of Arterial Road Networks Within the CBD of Kaduna. Int. J. Traffic Transp. Eng. 2016, 6, 222–230. [Google Scholar] [CrossRef]
  55. Cernicky, L.; Kalasova, A.; Kapusta, J. Signal Controlled Junctions Calculations in Traffic-Capacity Assessment-Aimsun, Omnitrans, Webster and TP 10/2010 Results Comparison. Transp. Probl. 2016, 11, 121–130. [Google Scholar] [CrossRef] [Green Version]
  56. Gao, Y. Calibration and Comparison of the VISSIM and INTEGRATION Microscopic Traffic Simulation Models. Master’s Thesis, Faculty of the Virginia Polytechnic Institute and State University, Blacksburg, VA, USA, 2008. [Google Scholar]
  57. Hidas, P. A functional evaluation of the AIMSUN, PARAMICS and VISSIM microsimulation models. Road Transp. Res. 2005, 14, 45–59. [Google Scholar]
  58. Mitroi, I.-S.; Ciobîcă, A.-M.; Popa, M. Car-following models comparison between models used by VISSIM and AIMSUN. UPB Sci. Bull. Ser. D 2016, 78, 71–82. [Google Scholar]
  59. Shaaban, K.; Kim, I. Comparison of SimTraffic and VISSIM Microscopic Traffic Simulation Tools in Modeling Roundabouts. Procedia Comput. Sci. 2015, 52, 43–50. [Google Scholar] [CrossRef] [Green Version]
  60. Tianzi, C.; ShaoChen, J.; Hongxu, Y. Comparative Study of VISSIM and SIDRA on Signalized Intersection. Procedia-Soc. Behav. Sci. 2013, 96, 2004–2010. [Google Scholar] [CrossRef] [Green Version]
  61. Bera, S.; Rao, K.V.K. Estimation of origin-destination matrix from traffic counts: The state of the art. Eur. Transp. Trasp. Eur. 2011, 2–23. [Google Scholar]
  62. Smits, E.-S. Origin-Destination Matrix Estimation in Omnitrans. Master’s Thesis, Utrecht University, Utrecht, The Netherlands, 2011. [Google Scholar]
  63. Queiroz, W.J.; Capretz, M.A.M.; Dantas, M.A.R. A MapReduce Approach for Traffic Matrix Estimation in SDN. IEEE Access 2020, 8, 149065–149076. [Google Scholar] [CrossRef]
  64. Map Slovakia. Available online: https://d-maps.com/carte.php?num_car=470&lang=en (accessed on 3 March 2021).
  65. STN 73 6110/Z2: Design of Urban Roads; Slovak Institute of Technical Standardization: Bratislava, Slovakia, 2015.
  66. Gogola, M. Dopravné plánovanie v Omnitrans-Návody na Cvičenia; EDIS: Zilina, Slovakia, 2008; ISBN 978-80-8070-917-4.
  67. Gogola, M. Železničná Doprava a Logistika; Zilina: Zilina, Slovakia, 2009. [Google Scholar]
  68. National Traffic Census Slovakia 2015. Available online: https://www.ssc.sk/files/documents/dopravne-inzinierstvo/csd_2015/ke/scitanie_kosice_2015.pdf (accessed on 15 February 2021).
  69. Marasova, D.; Andrejiova, M. Transport Service Quality Assessment. In Qual Access to Success; Romanian Society for Quality Assurance: Bucharest, Romania, 2018. [Google Scholar]
Figure 1. Location of the Slovak Republic and the town of Kosice [64].
Applsci 11 05018 g001
Figure 2. Research methodology (source elaborated by authors).
Applsci 11 05018 g002
Figure 3. Illustration of the inner traffic circuit of the city of Košice (source elaborated by authors).
Applsci 11 05018 g003
Figure 4. Histogram of Sturova section (source elaborated by authors).
Applsci 11 05018 g004
Figure 5. Scheme of traffic model creation, (source elaborated by authors).
Applsci 11 05018 g005
Figure 6. Transport network for Variant A (a) and Variants B and C (b) in OmniTRANS program (source elaborated by authors).
Applsci 11 05018 g006
Figure 7. Model of intersection Palackeho–Jantarova for Variant A (a) and Variants B and C (b), (source elaborated by authors).
Applsci 11 05018 g007
Figure 8. Illustration of the signal plan of the Palackeho–Stefanikova intersection for Variant A (a) and Variants B and C (b) (source elaborated by authors).
Applsci 11 05018 g008
Figure 9. Illustration of inter-district relationships for Variant A (a), Variant B (b) and Variant C (c) (source elaborated by authors).
Applsci 11 05018 g009
Figure 10. Illustration of traffic flow intensity at a light-controlled junction Palackého–Jantárová (source elaborated by authors).
Applsci 11 05018 g010
Figure 11. Traffic intensities of areas between the particular intersection (source elaborated by authors).
Applsci 11 05018 g011
Table 1. Basic values of permissible traffic flow intensities Iz on double-lane urban road [vehicle/h] [65].
Longitudinal Angle [%]Length of the Angle Slope [m]Required Speed [km/h]
+504030
Share of Slow Vehicles [%]
0~1.50~5515305051530505153050
12501150100085014501350200100065015003501150
3725012501150100085014501350120010001650150013501150
50012501150100085014501350120010001650150013501150
100012001100100080014501350120010001650150013501150
1500115010008506501400125011009001550140012501000
5not applicable25012501150100085014501350120010001650150013501150
50012501150100085014501350120010001650150013501150
1000120010509007001400125011009001650150013501150
150010509007004501300115095070015001350200950
7not applicable100125011501000850145013501200100016501500350150
2501200110095080014501250105090016501500350150
500115010008506001350120010007501600145013001050
1000900750550300115095075045015501400200900
150070055040015095075055025014001200950650
Table 2. Basic values of permissible traffic flow intensities Iz on four-lane urban road [vehicle/h] [65].
Longitudinal Angle [%]Length of the Angle Slope [m]Required Speed [km/h]
+605040
Share of Slow Vehicles [%]
0~1.50~5515305051530505153050
200018501700150025002350220020002900280026502500
3725020001850170015005002350220020002900280026502500
50020001850170015002500235022002000900280026502500
1000190017501600135024002250210019502900280026502500
150018501650145012002350220020001750280026502500300
5not applicable25020001850170015002500235022002000290028002650500
5002000180016501400250023502200200029002 002650500
10001 90017501550 2400225020501800290027502600400
1500175015501350 22502050185015002750255023502000
7not applicable100200018501700150025002350220020002900280026502500
250200018501700150025002350220020002900280026502500
500190017501600 23002150195017502850270025502300
10001 7501600 21001800160014502600245022502000
150015501400 1900160014503002400215019001650
Table 3. Values of the influence factor of a light-controlled intersection kk [65].
Share of Green Phases in the Cycle
Z1:Z2; Z1:(Z2 + Z3)
Distance from a Traffic Light Intersection [m]
200 m500 m100 m1500 m
1:20.550.650.750.90
1:1.50.60.700.800.90
1:20.650.700.850.90
1:0.750.70.800.850.90
1:0.50.750.830.900.90
1:0.350.800.850.900.90
1:0.250.850.900.900.90
Z1—sum of green phases in the direct traffic direction, Z2 (Z3)—sum of green phases in the secondary driving direction.
Table 4. Width factor ks for two- to eight-lane urban road arrangement [65].
Road TypeDriving LanesWidth of the Driving Lane [m]Width Factor ks [-]
Directionally undivided23.000.7
3.500.8
Directionally divided43.001.8
3.501.9
Table 5. Maneuvering factor values km [65].
Number of Lanes in the Traffic DirectionManeuver Type in One Hour
Number of Turns from One LaneNumber of Stops in One Lane
0255010002550100
11.000.960.900.801.000.850.650.40
21.000.980.960.921.000.950.840.70
31.001.000.980.951.000.950.900.80
41.001.000.980.961.000.960.900.85
Table 6. The factor of the impact of very slow vehicles kb [65].
Share of Very Slow Vehicles Out of the Number of Slow VehiclesThe Factor of the Impact of Slow Vehicles
0.2–2%1.00
2%0.95
5%0.90
10 and more %0.80
Table 7. Input data for road network creation (source elaborated by authors).
ObjectNumber of Objects [pcs]
Centroids10
Nodes6
Links6
Table 8. Historical matrix for Variant A, (source elaborated by authors).
Centroids1.2.3.4.5.6.7.8.9.10.Total
1. Sturova0773112315446108936215709
2. Rastislavova610145468204841277340
3. Juzna trieda22120202571715102130
4. Jantarova744116082255749338385
5. Palackeho188105421670631461258421941
6. Masarykova33187303702622154192
7. Nar.trieda2514622288017113134
8. Komenskeho1583141751207283
9. Csl.armady5128114557170403406442
10. Aupark321341321020
Total472305131478472345457398250683376
Table 9. Historical matrix for Variant B, (source elaborated by authors).
Centroids1.2.3.4.5.6.7.8.9.10.Total
1. Sturova074301214844103895915574
2. Rastislavova590135366204639267329
3. Juzna trieda22120202571715102130
4. Jantarova714016079245648328374
5. Palackeho183102411630611421228120915
6. Masarykova32187293602522144187
7. Nar.trieda2011518237016142116
8. Komenskeho1583131751207282
9. Csl.armady512811455717403406289
10. Aupark321341321020
Total456295127356455186444387244663016
Table 10. Classification of local roads according to capacity load (source elaborated by authors).
Level of QualityQuality of TransportTransport Flow PropertiesRoad Capacity Utilization [%]
AExcellentRoad drivers are rarely mutually influenced. Transport flow is fluent.<30
BGoodVehicles in the choice of speed and driving lane are in the small range of mutual influence. The negligible delays imply that. Transport flow is almost fluent.31–60
CSatisfactoryThe presence of other road users is noticeable. There is no longer the unlimited freedom of movement given. The flow of traffic is stable. In the case of undesirable events, the area decreases on the level of quality D.61–80
DUnstableAll of the road users have to keep in mind a possible presence of barriers. Congestion or a complete stop of vehicles occurs>81
Table 11. Results of the capacity load of local roads in the internal traffic circuit (source elaborated by authors).
No.Section NameVariant AVariant BVariant C
Ip 1Im 2as 3Ip 1Im 2as 3Ip 1Im 2as 3
1Sturova381015244014171403991417126589
2Nam.Oslob381815274013451130841345102276
3Stefanikova3477104330143414911041434135394
4Nam.MM1900139073140514001001405135296
5Hviezdoslavova223114286414051349961405121987
6Moyzesova324571422142595567142584659
1 Ip—the permissible intensity calculated according to the formula (1) [vehicles/h]; 2 Im—the intensity obtained by simulation in the model [vehicles/h]; 3 as—the percentage load of the road during the morning rush hour [%].
Publisher’s Note: MDPI stays neutral with regard to jurisdictional claims in published maps and institutional affiliations.

