Article

Dynamic Test Measurements and Simulation on a Series Wound DC Motor

1
Faculty of Engineering, University of Debrecen, H-4028 Debrecen, Hungary
2
Debrecen Centre of Vocational Training, H-4030 Debrecen, Hungary
*
Author to whom correspondence should be addressed.
Appl. Sci. 2021, 11(10), 4542; https://doi.org/10.3390/app11104542
Submission received: 19 April 2021 / Revised: 7 May 2021 / Accepted: 12 May 2021 / Published: 17 May 2021

Abstract

:
Previously, a dynamic model and a simulation program for series wound DC motors (SWDCM) were developed in MATLAB/Simulink for modelling them in electric vehicles and mechatronic systems. The electromagnetic characteristics of the motor (electric resistances, dynamic inductances), which serve as input parameters of the program, were also measured. Additionally, locked rotor response measurements were performed to test the accuracy of the measured electromagnetic characteristics. This paper presents the experimental procedure and the results of dynamics test measurements that were performed on the same motor, including the procedure for the determination of the necessary input dynamic parameters for the simulation. While the motor spins up from rest, the intensity of the electric current and the angular speed of the rotor are measured. Finally, the simulation and dynamic test results are compared to check the proper operation of the simulation program.

1. Introduction

The different types of electric- and hybrid-powered vehicles have a rapidly increasing role in modern road transport. Thus, research on electric powertrains applied in them is becoming more and more important, not only in vehicle industry but also in research institutes and universities [1,2,3]. In Reference [1], a general review of modern vehicle powertrains and their modelling and simulation in MATLAB/Simulink is presented, while in References [2,3], a comprehensive review is given on hybrid electric vehicles and electric vehicle drives. In the framework of the Thematic Excellence Programme—launched by the Hungarian Ministry of Innovation and Technology in 2019—a research group was established in the field of automotive industry.
The research group has long-term experience in vehicle dynamics, modeling, and the simulation of prototype race cars designed and constructed by student teams at the University of Debrecen Faculty of Engineering [4,5,6]. In Reference [4], the dynamic model and simulation program for a pneumobile is presented, while in References [5,6], an electric race car is presented, driven by a series wound DC motor (SWDCM) [5] and a brushless DC motor (BLDCM) [6], respectively. These teams participate in different competitions for vehicles with alternative (usually pneumatic or electric) drives (Pneumobile Race, Shell Eco-marathon, Széchenyi Race, MVM Energy Race) [5,7,8]. In reference [5,7], information about the MVM Energy Race and Shell Eco-marathon is presented respectively, while in reference [8], a review about the participation of our Faculty in the Pneumobile competitions is presented. As a part of the above activity, a program for vehicle dynamics simulation has been realised in MATLAB/Simulink [5] which is applicable for calculating the driving dynamics functions (e.g., covered distance-, velocity- and acceleration-time functions) of a vehicle from its technical data and characteristics, including the ones of its powertrain. Applying the above simulation program—complementing it with an optimising procedure—the optimal technical parameters and characteristics of a vehicle can be computed for a given task [9].
An important part of the program above is the modelling and simulation of the electric (or pneumatic) motor. In references [1,10], a general review of the modelling and simulation of different types of electric motors (SWDCM, BLDCM, IM, SM, SRM) is presented. In References [11,12,13,14,15] and [16], examples are given for the modelling and simulation of series wound DC motors.
In the last few years, models and simulation programs have been developed by us for different electric motor types [6,11,17]. In References [6,11,16], models and simulation programs for a SWDC motor, while in reference [6] for a BLDC motor, is presented. One of the analysed motors was a 4 kW SWDC motor [11] which was applied in the drive system of the prototype race car that was the winner of the MVM race in 2015 [5]. For this motor, a dynamic model and simulation program had been developed in MATLAB/Simulink, seen in [11]. Our motor simulation program for SWDC motors can calculate the torque and angular speed of the motor, as well as the intensity of electric current through it, from its dynamic and electromagnetic characteristics (moment of inertia of the rotor, loading torque on the rotor, bearing friction, electric resistances and inductances of the windings, brush voltage) as a function of time. The electromagnetic characteristics of the motor (electric resistances, self- and mutual-dynamic inductances of the windings, brush voltage), which serve as the input characteristics of the simulation program were also measured [11]. Additionally, locked rotor response measurements were performed on the motor [11] to test the accuracy of the determined electromagnetic characteristics and the appropriate operation of the program in the given static situation.
The main scientific goal of the recent study is to check the proper operation and accuracy of the above-mentioned simulation program for series wound DC motors by dynamic test measurements (i.e., under dynamic conditions) and to determine the necessary dynamic parameters (moments of inertia of the rotor, bearing and brush friction torques on the rotor) for the simulation.
The experimental details and results of the dynamic test measurements, together with the experimental procedure that was applied for the determination of the dynamic parameters, which serve as the input of the simulation program, are presented here. During the dynamic test measurements, the motor spins up from rest to a given revolutions per minute (RPM) while the intensity of electric current through the motor and the angular speed of the rotor are measured. Finally, the results of test measurements and simulations are compared to check the proper operation of the simulation program under dynamic conditions. The tested and approved motor simulation program can be built into our vehicle dynamics simulation program [5] as a module, enabling the accurate and precise simulation, and the prediction of the vehicle’s performance in different race situations.

2. Modelling and Simulation of the SWDCM

The nominal values of the tested and modelled SWDCM were as follows: type: DC/T4-48; power: 4 kW; torque: 14.7 Nm; RPM: 2800 1/min; voltage: 48 V; current: 104 A. The latest version of our model for SWDCMs is shown in Figure 1.
Bases of the model are the differential equations below [11,16]:
U t á p ( R a + R g ) · I ( L a ( I ) + L g ( I ) ) · d I d t L g a ( I ) · ω · I = 0
L g a ( I ) · I 2 M t e r h ( ω ) M e l l ( ω ) = J m · d ω d t
In the equations, V a c c u is the terminal voltage of the battery during the test, U b r u s h is the brush voltage, R r and R s are the electric resistances of the rotor and stator windings, while the resultant electric resistance of the wires, connecting the battery to the motor, is denoted by R w i r e . Characteristics L a ( I ) L g ( I ) L s ( I ) and L r ( I ) are the self-dynamic inductances of the stator and rotor windings, and L g a ( I ) is their mutual-dynamic inductance [11,16]. The characteristics above depend on the intensity of current flowing through the windings. The friction (bearing plus brush friction) and loading torques on the rotor of the motor are denoted by M l o a d ( ω ) M e l l ( ω ) M r e s and M l o a d respectively, and J m denotes the rotor’s moment of inertia. The value of J r sometimes can be found in the catalogue of the motor, while characteristics L s ( I ) , L r ( I ) , L s r ( I ) , and M r e s have to be measured. In this research, both J r and M r e s were measured. The block diagram of our simulation program is presented in Figure 2. The program is based on differential Equations (1) and (2).
Electric resistances R a R g , R r , R w i r e , brush voltage U b r u s h , and torques M l o a d , and M r e s are defined in the simulation program as constants, while dynamic inductances L s ( I ) , L r ( I ) , L s r ( I ) , and battery voltage U b a t t ( t ) are given in the form of “Lookup Tables”. In the following, dynamic test measurements on the SWDCM will be presented as well as the experimental procedure for the determination of dynamic parameters M r e s and J r .

3. Measurements

Considering the motor simulation program in Figure 2, the following input parameters and characteristics need to be measured for a complete simulation: R a , R g , R w i r e , L r ( I ) , L s ( I ) , L s r ( I ) , U b r u s h , U b a t t ( t ) , J r , M r e s , and M l o a d . Electromagnetic parameters R a , R g , R w i r e , L r ( I ) , L s ( I ) , L s r ( I ) , and U b r u s h were measured previously (Section 3 in reference [11]), while the measurement procedure of the dynamic ones J r and M r e s , together with U b a t t ( t ) , are presented here in Section 3.2.

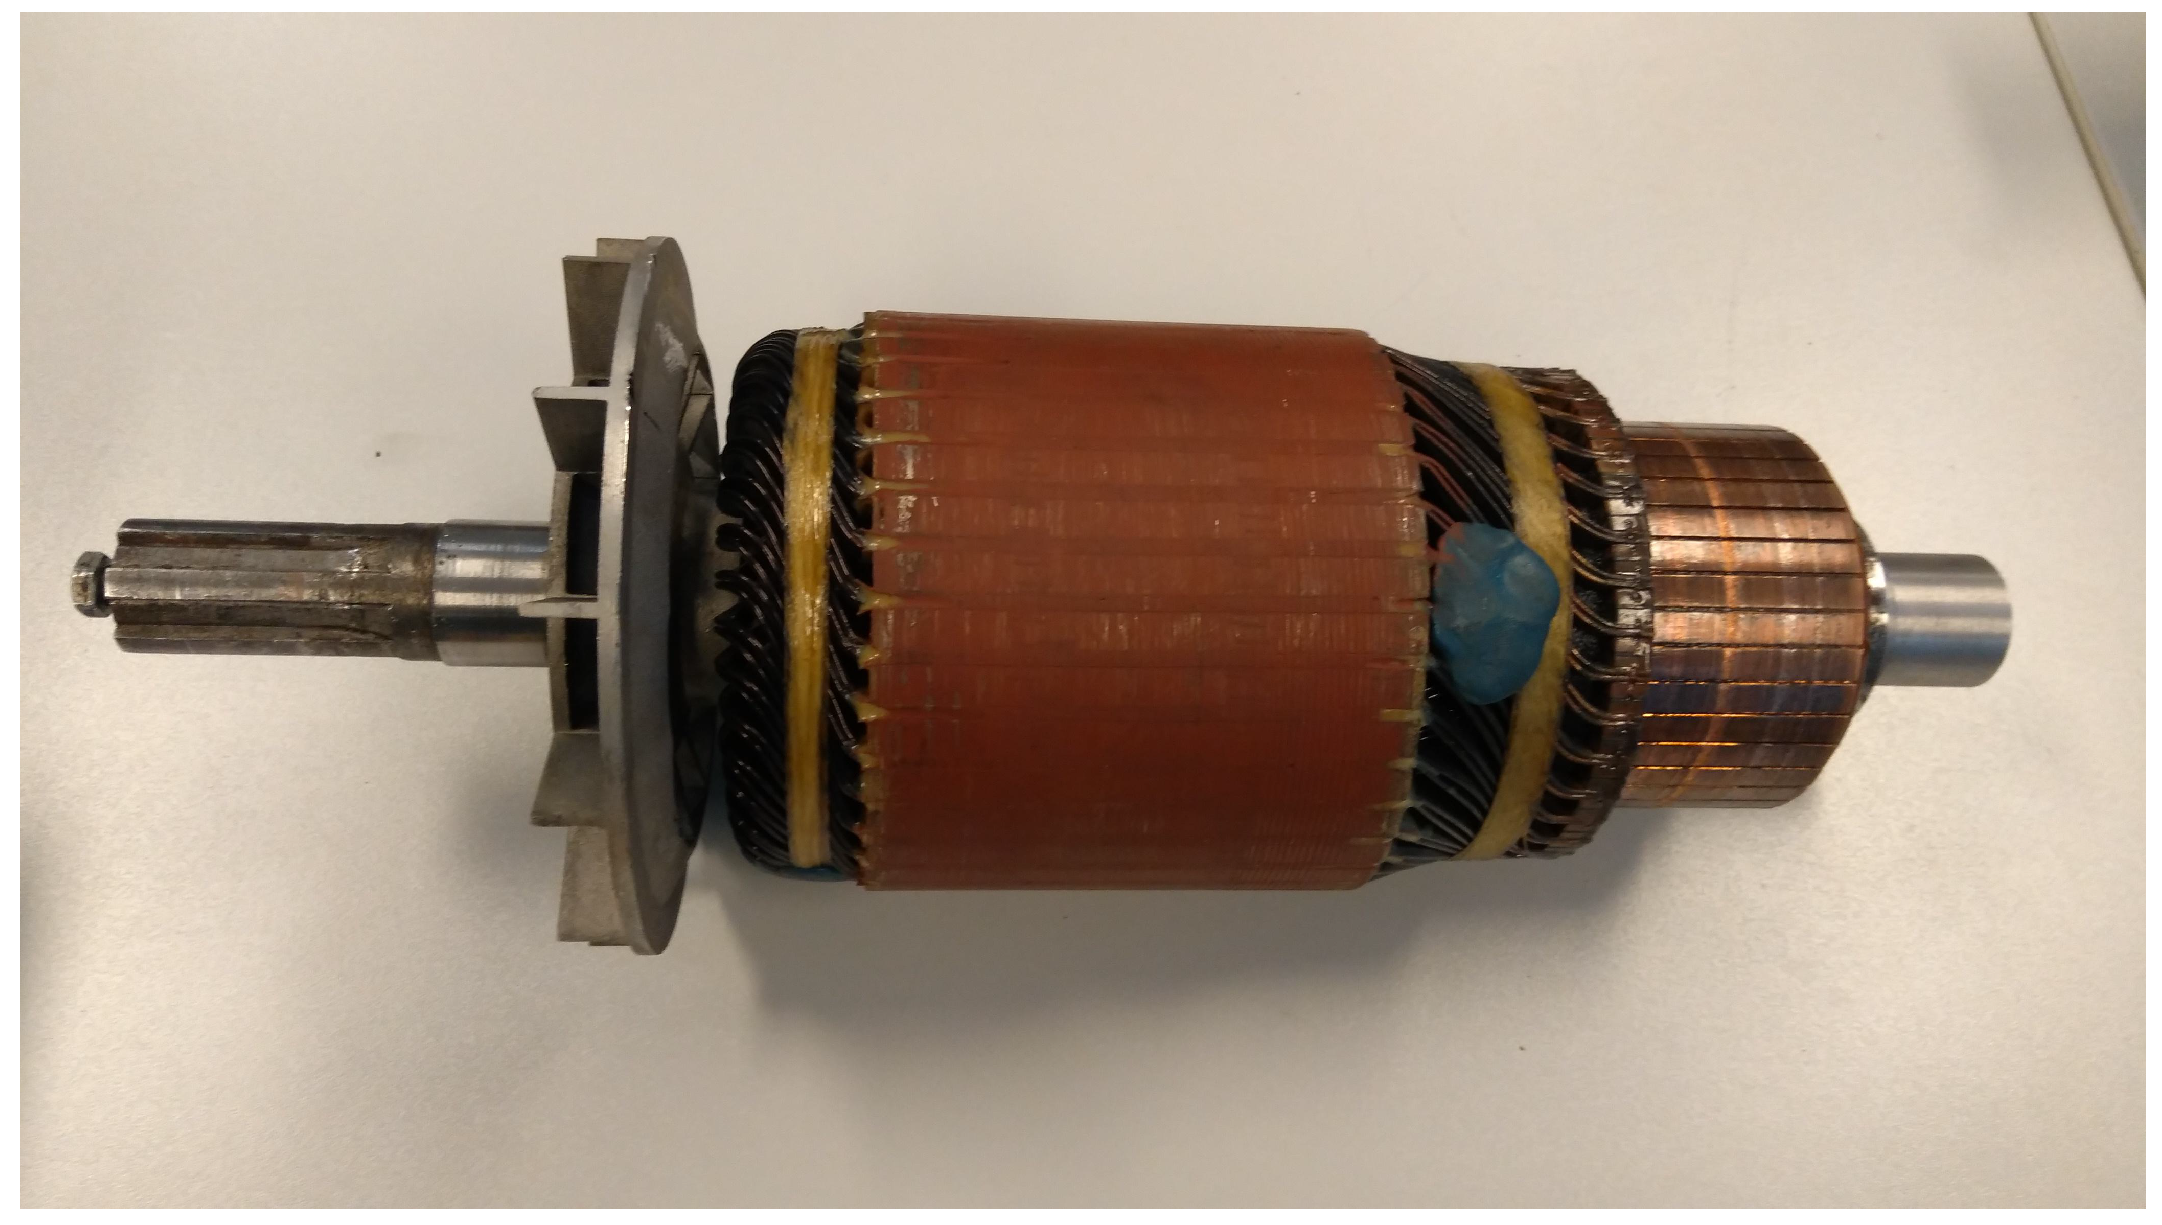
3.1. The Experimental Set-Up

The applied experimental set-up and its wiring diagram are shown in Figure 3.
The speed of the rotor is measured by a remote optical led sensor (Model: ROS-P, Monarch Instrument) which has 6 or 0 V output voltage sign, depending on if there is a reflected light from the target into the ROS or not. The intensity of electric current flowing through the motor’s windings is measured as a voltage drop on a shunt resistor with an electric resistance of 0.0006 Ω (accuracy class 0.5). The terminal voltage of the battery—since it is bigger than the maximum allowed input voltage of the NI 9239 module—is measured applying a voltage divider with a ratio of 1:11. All the obtained voltage signs are fed into an NI 9239 voltage input module, which is connected to a PC through a Compact DAQ Chassis.

3.2. Dynamic Test Measurements

During the dynamic test measurements, the rotor spins up from rest to a given RPM, while the intensity of electric current flowing through the motor’s windings and the angular speed of the rotor are measured. After that, the voltage is switched off, thus the rotor runs out until it stops; meanwhile, its angular speed is measured. The dynamic test measurements were performed applying different mechanical loads on the rotor in the form of stainless-steel discs with precisely known moments of inertia. Figure 4 shows the results of a dynamic test measurement that was performed on the analysed SWDCM. The applied mechanical load ( J l o a d ) on the rotor was 0.0001576 kg·m2.

3.2.1. Determination of Dynamic Input Parameters

Several different methods [16,18,19,20] exist for the determination of the moment of inertia of the rotor ( J r ). A well-known method is when an additional point-like load with precisely known mass is attached to the rotor at a given distance from its axis of rotation [18]. If the obtained system is deflected from its equilibrium position, it will be swinging. The unknown moment of inertia of the rotor can be calculated from the measured time period. In our case, because of the relatively high value of friction torque, the above method could not be applied.
Without removing the rotor from the motor, the value of J r can also be determined from the second stage of the run-out experiments [16,19,20].
Figure 5 shows the results of the second stage of the run-out experiments.
The slope of the measured angular speed-time function gives the angular acceleration ( ε ) of the rotor. Table 1 shows the magnitude of angular accelerations at different mechanical loads.
Equation (3) gives the connection between friction torque M r e s (bearing plus brush friction) and angular acceleration ε :
( J r + J l o a d ) · ε = M r e s
It can be seen that both J r and M r e s are unknown in Equation (3). Thus, the results of two independent run-out experiments, applying different mechanical loads (load pair), can be compared and then the values of J r and M r e s can be calculated from the obtained system of equations, providing that M r e s has the same value in both cases. The main drawback of this method is the above assumption which can introduce systematic error in the calculated value of J r .
The results obtained applying the above method with different load pairs are shown in Table 2.
In the scientific literature, there are advised methods to eliminate the above drawback [18]. However, for their application, the realisation/production of an additional experimental set-up is necessary.
Another accurate method can be realised by removing the rotor from the motor (Figure 6) and measuring J r with an independent procedure.
Following that, perform a run-out experiment, and then calculate the value of M r e s from Equation (3). In our case, the above independent procedure was a roll-down experiment (Figure 7) on an incline made of aluminium.
The mass of the rotor (m), the rolling radius (r), the incline angle (α), and the position of the centre of mass of the rotor (s) as a function of time were precisely measured. The s(t) function was derived from a video record made by a high-resolution camera. From the position-time function, the velocity-time function, and then the acceleration of the centre of mass of the rotor (ac) was determined.
Since rolling friction between the rotor and the incline is not negligible, two independent roll-down experiments are necessary in applying different incline angles ( α 1 and α 2 ). From the two experiments come two equations with two unknowns. One of them is the moment of inertia of the rotor ( J r ), and the other one is the arm of rolling friction (k). Comparing the two equations, the moment of inertia of the rotor can be calculated by the following formula:
J r = m r 2 ( g tan α 2 tan α 1 a c 2 cos α 2 a c 1 cos α 1 1 )
Table 3 shows the experimental data at the roll-down experiment together with the calculated moment of inertia of the rotor. The uncertainty of the moment of inertia was calculated applying Gauss’ Law of Error Propagation.
Table 4 shows the values of friction torque obtained from the run-out experiments applying different mechanical loads (moment of inertias) on the rotor and using the value of J r obtained from the roll-down experiment.
From the data in Table 4, it can be clearly seen that the value of friction torque depends on the applied mechanical load on the rotor.
To gain information about the accuracy of the measured value of moment of inertia in Table 3, two independent roll-down experiments were performed with a homogeneous stainless-steel cylinder with a precisely known moment of inertia. The experimental data is shown in Table 5.
The percentage of accuracy of the experimentally determined moment of inertia relative to the theoretical value is 97.5%.

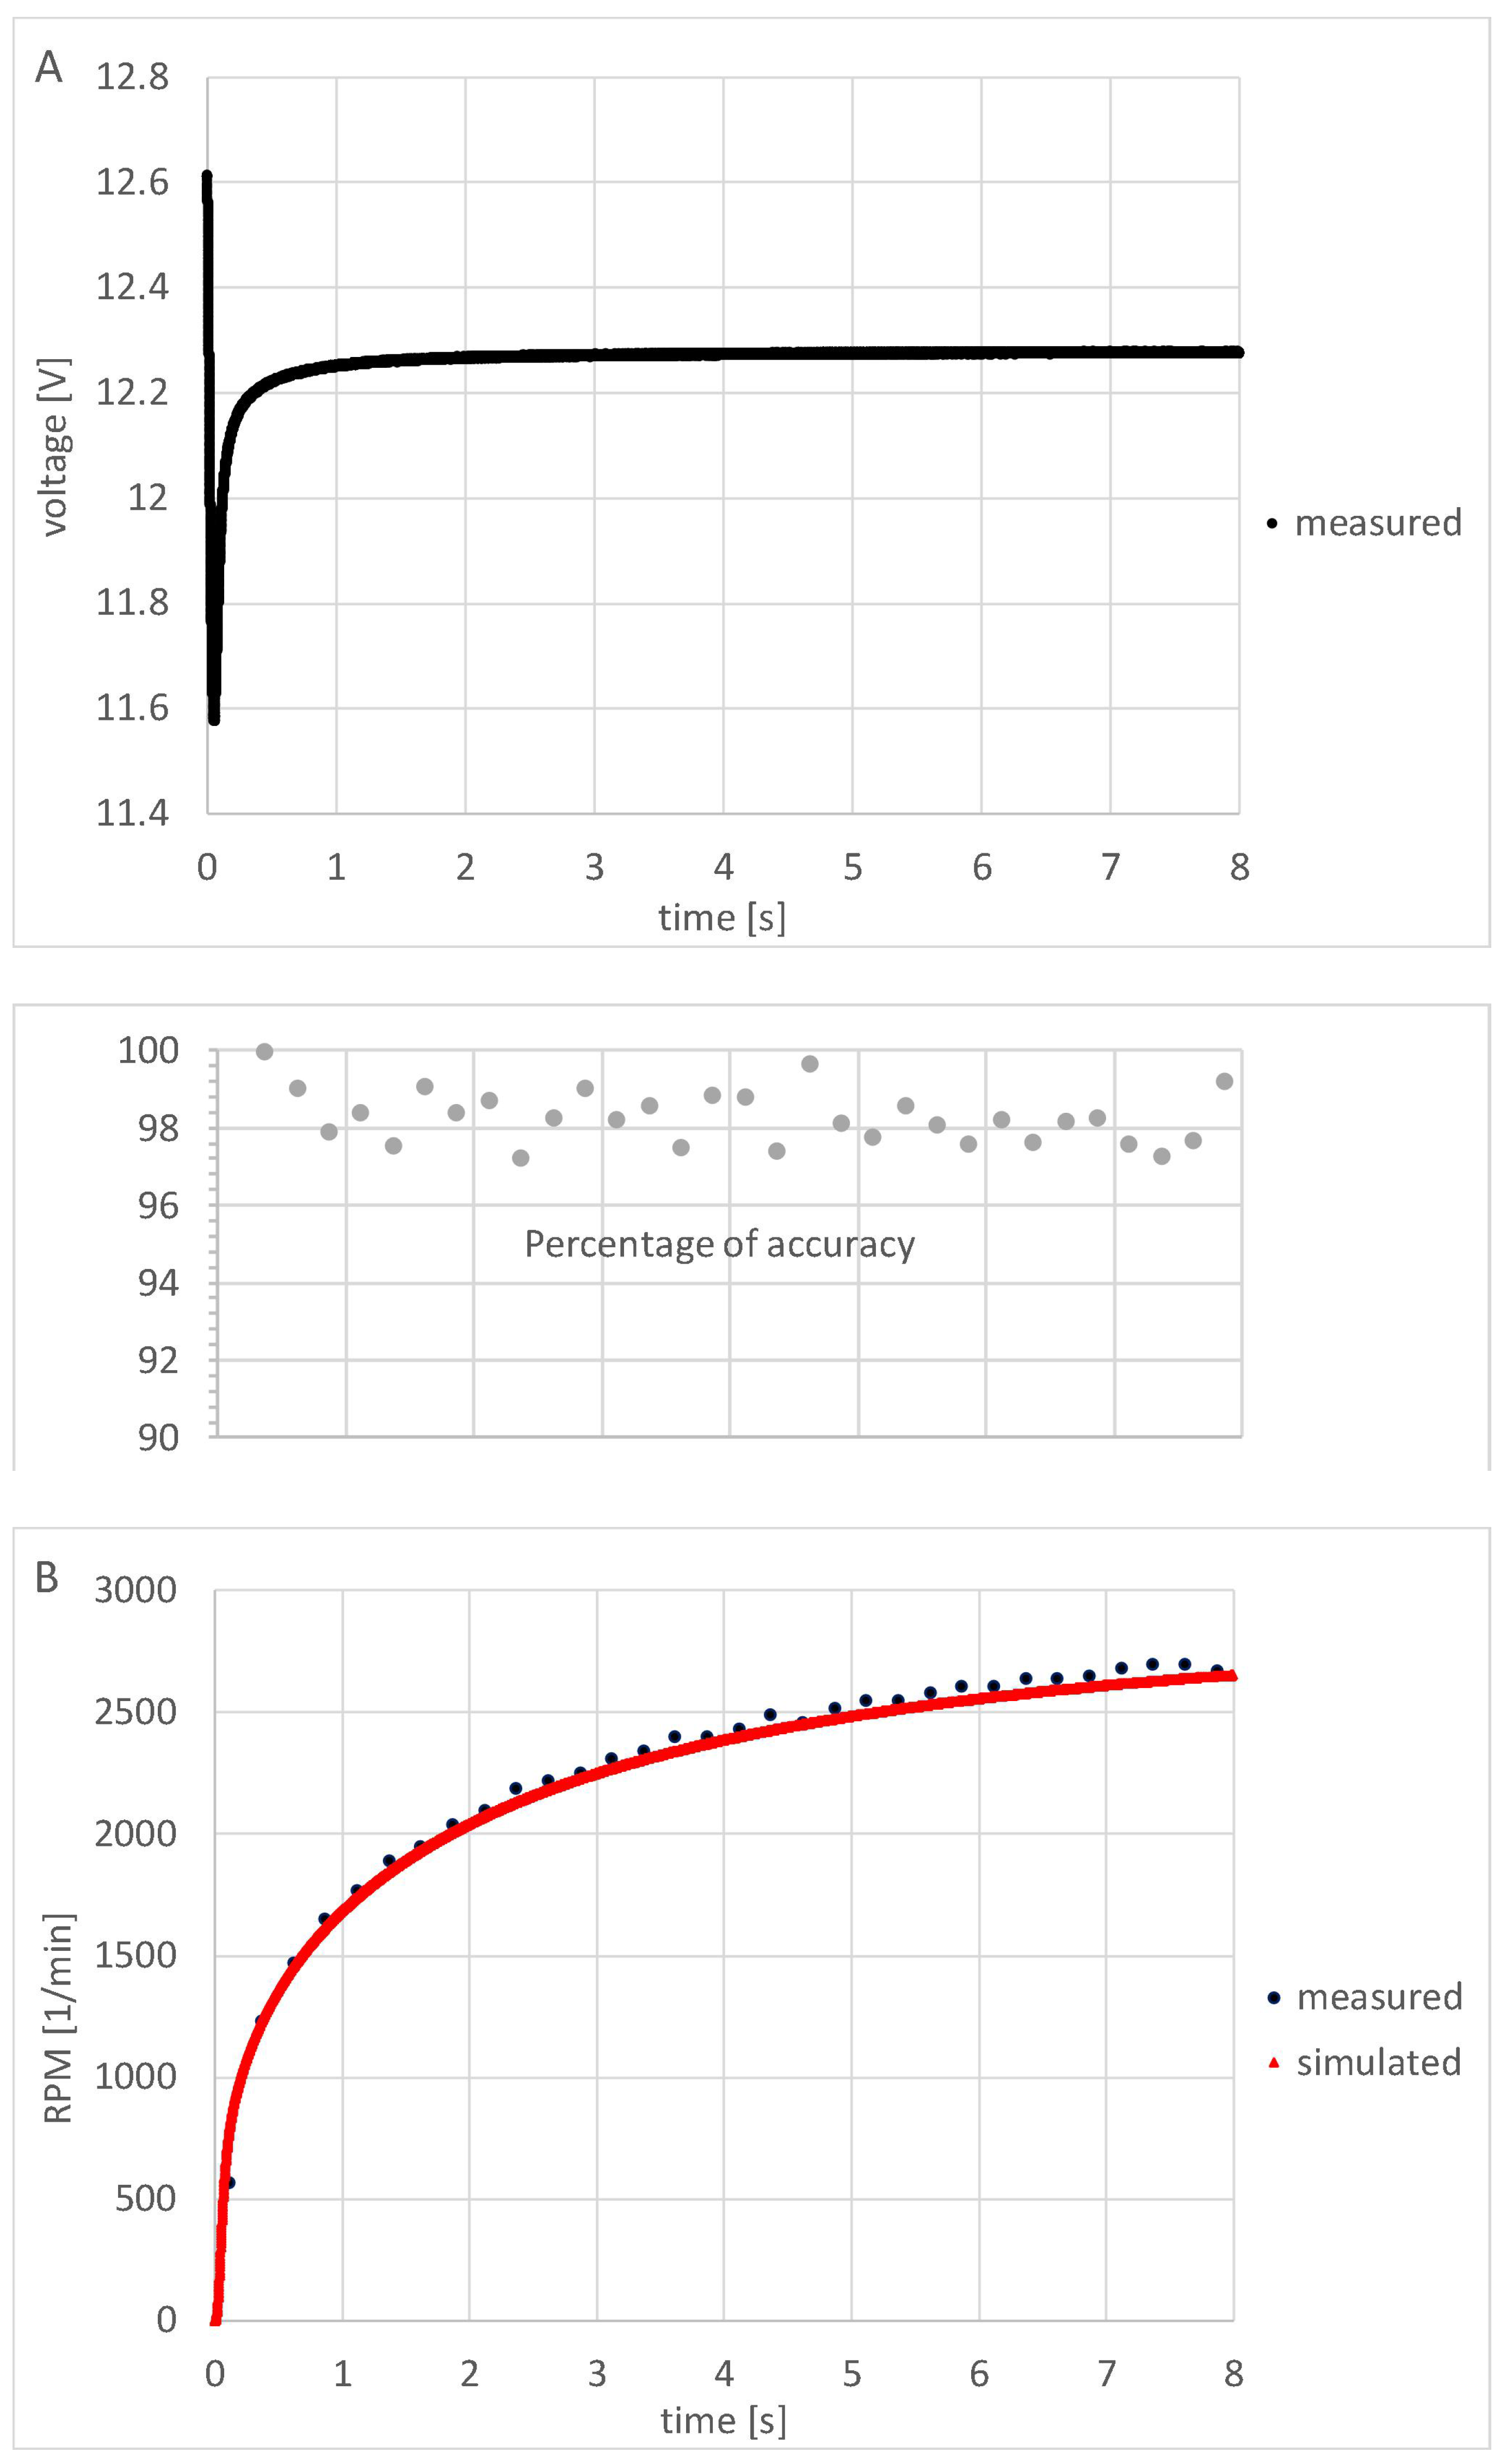
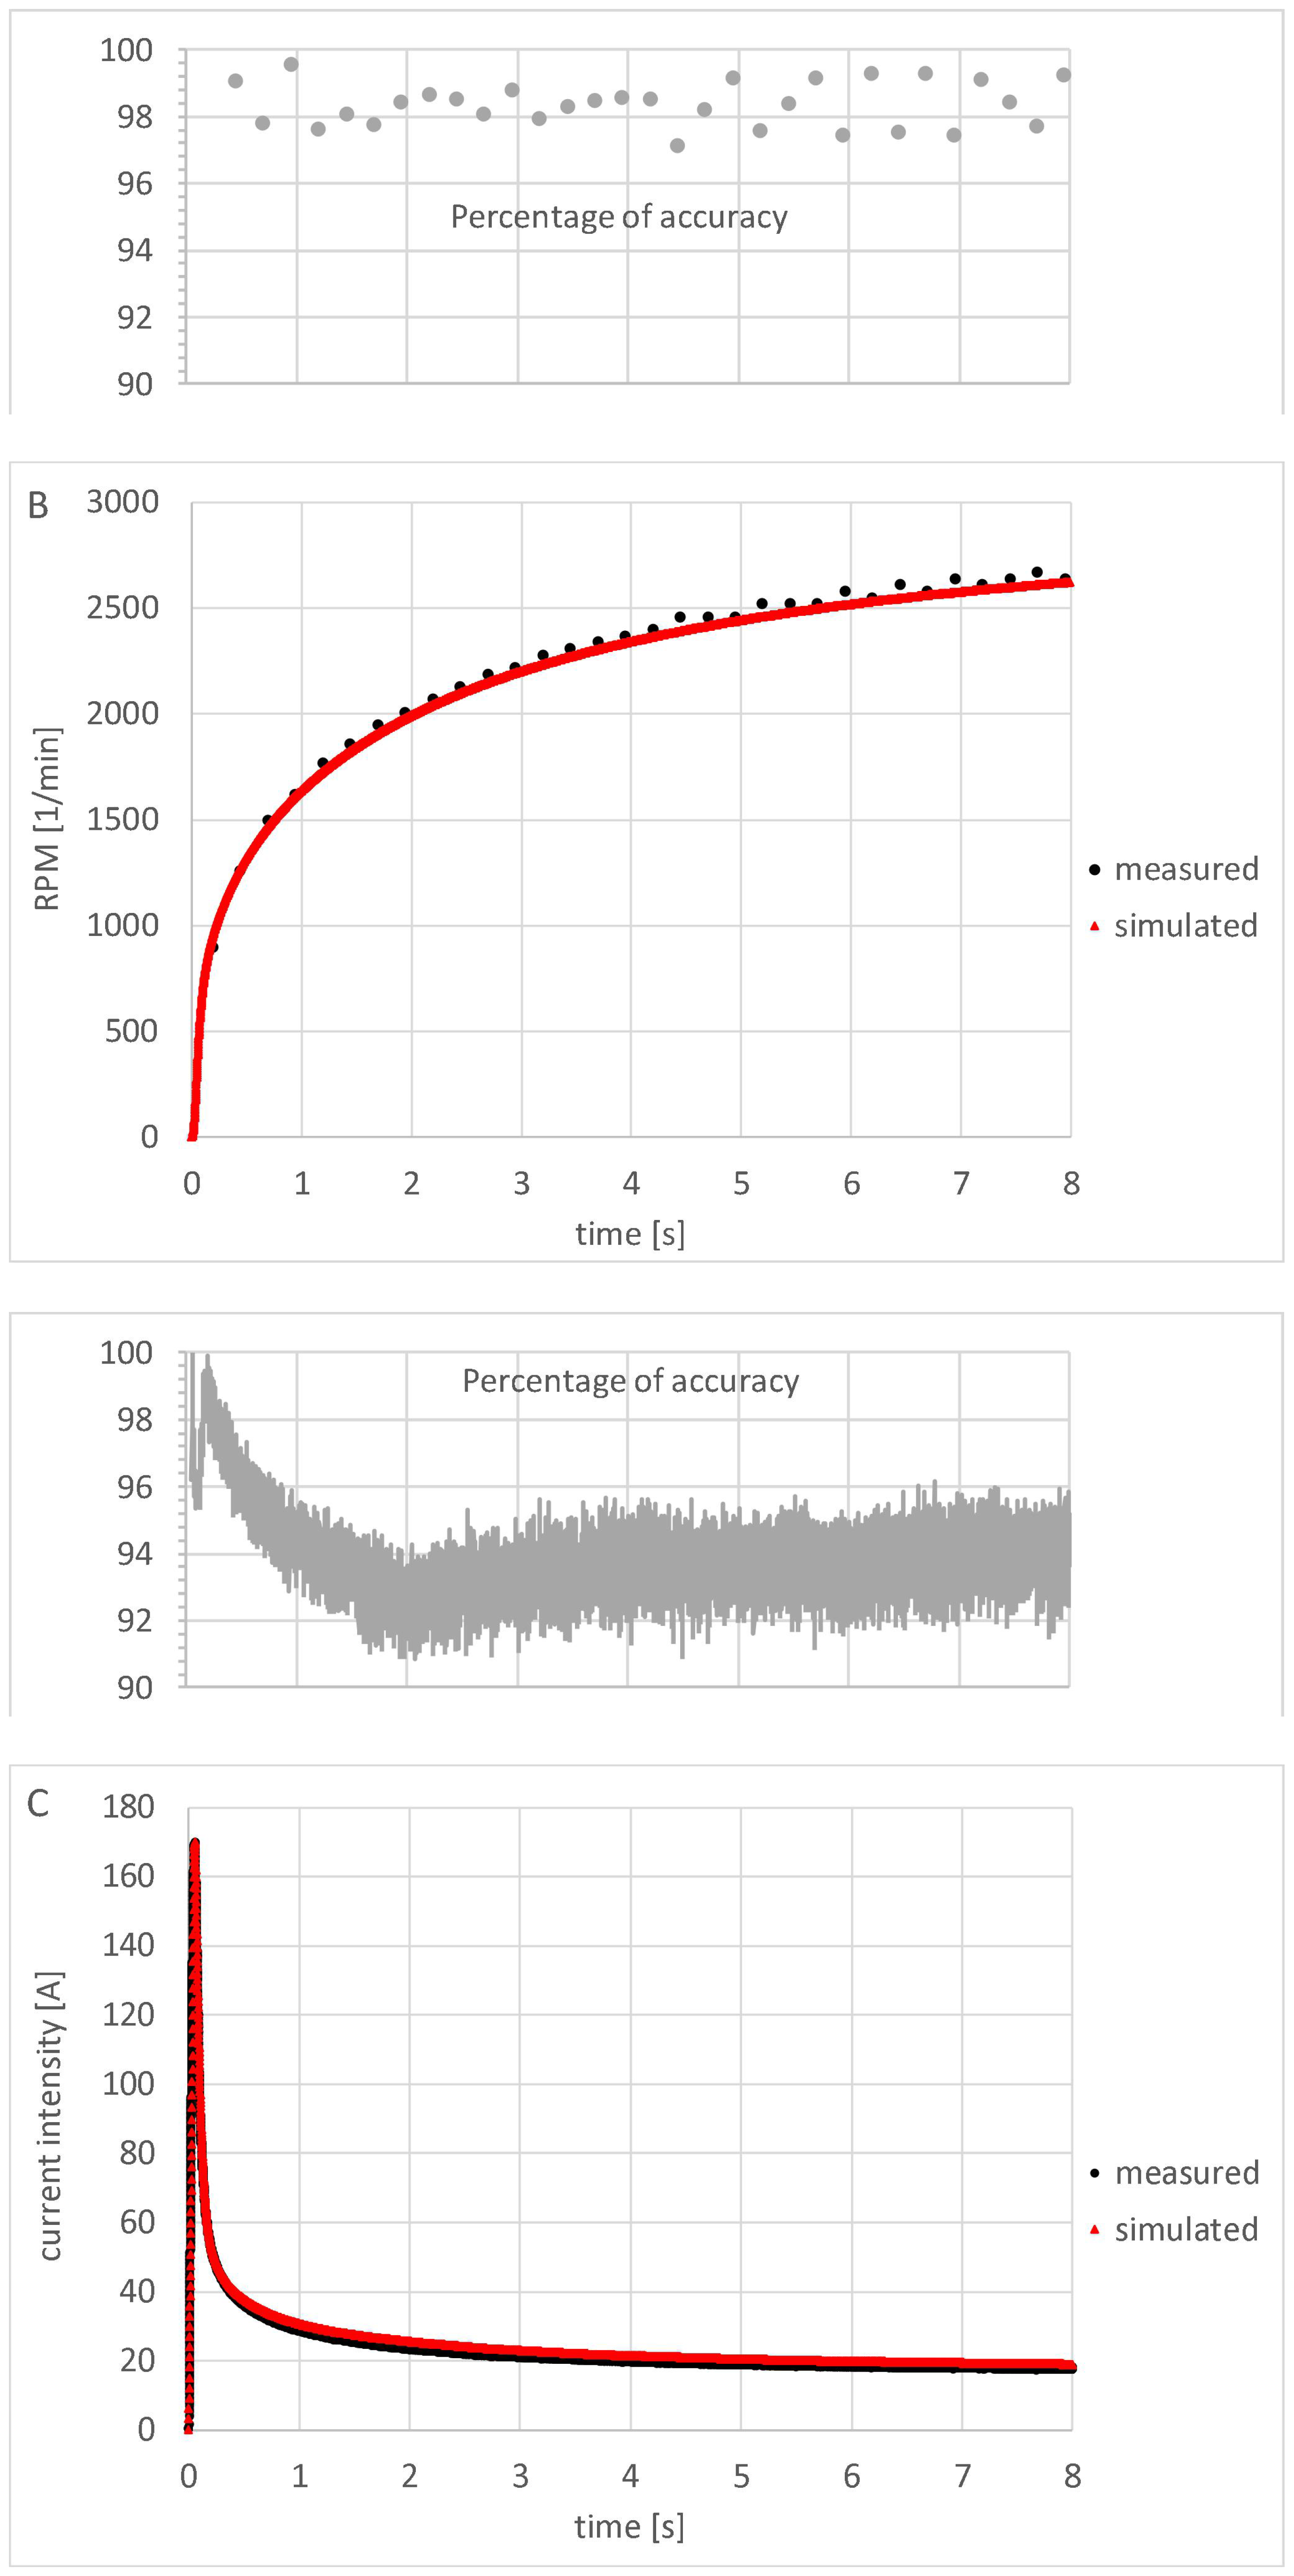
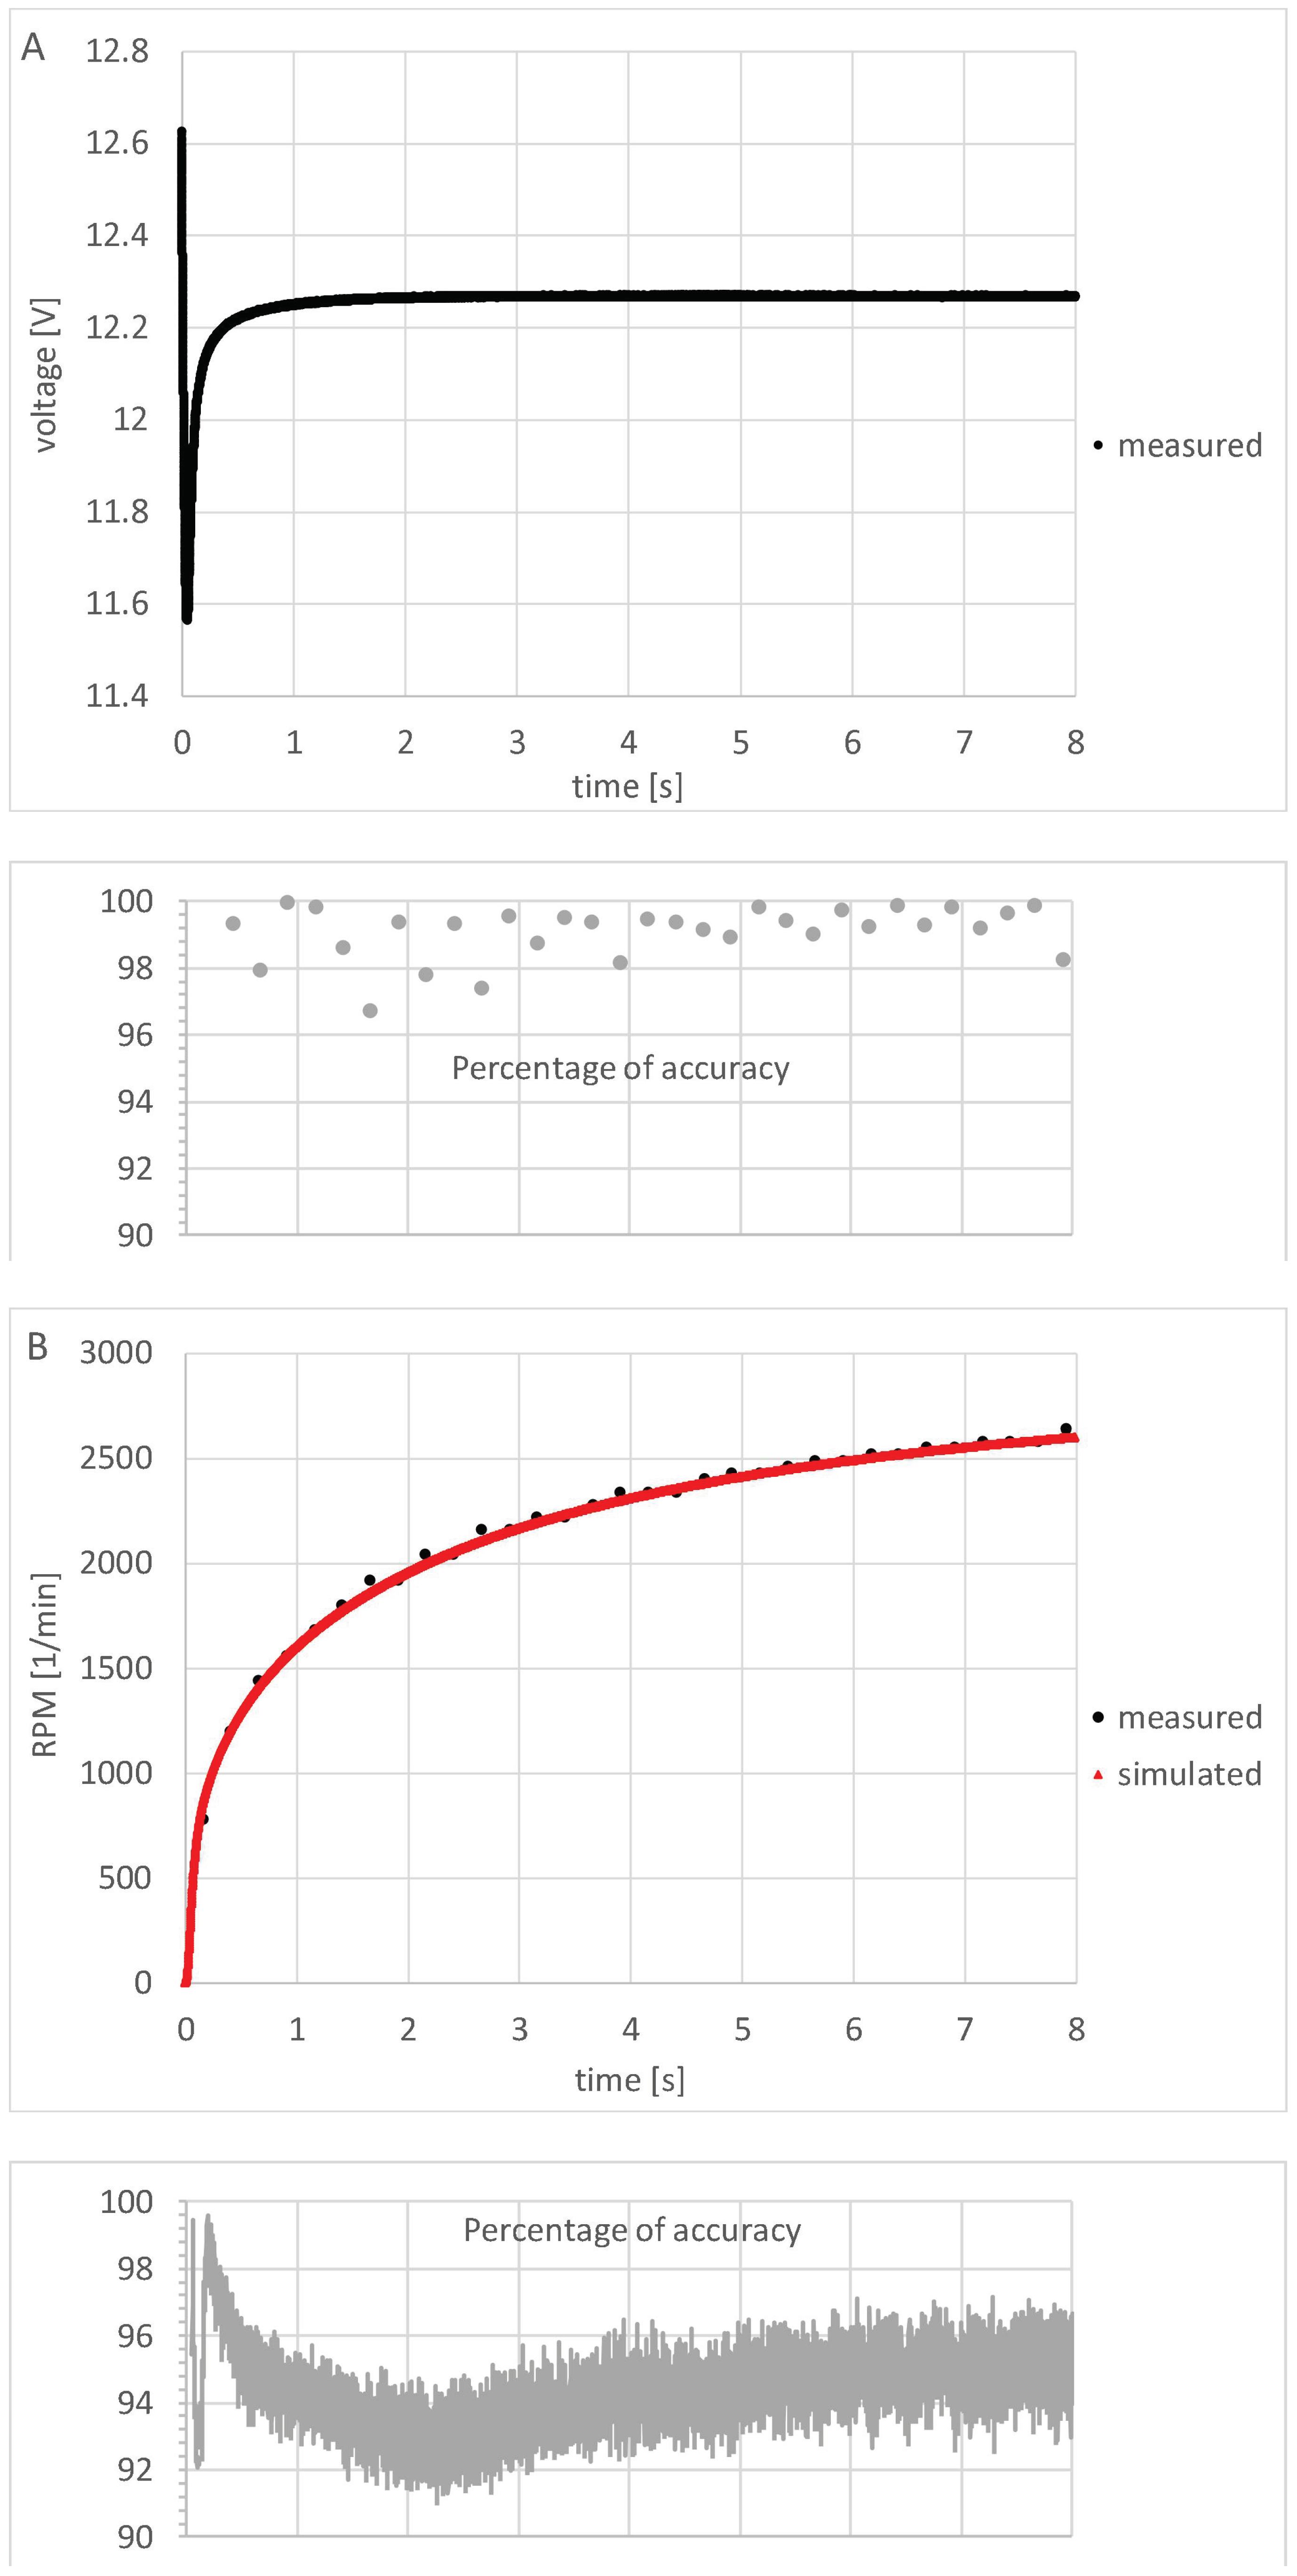
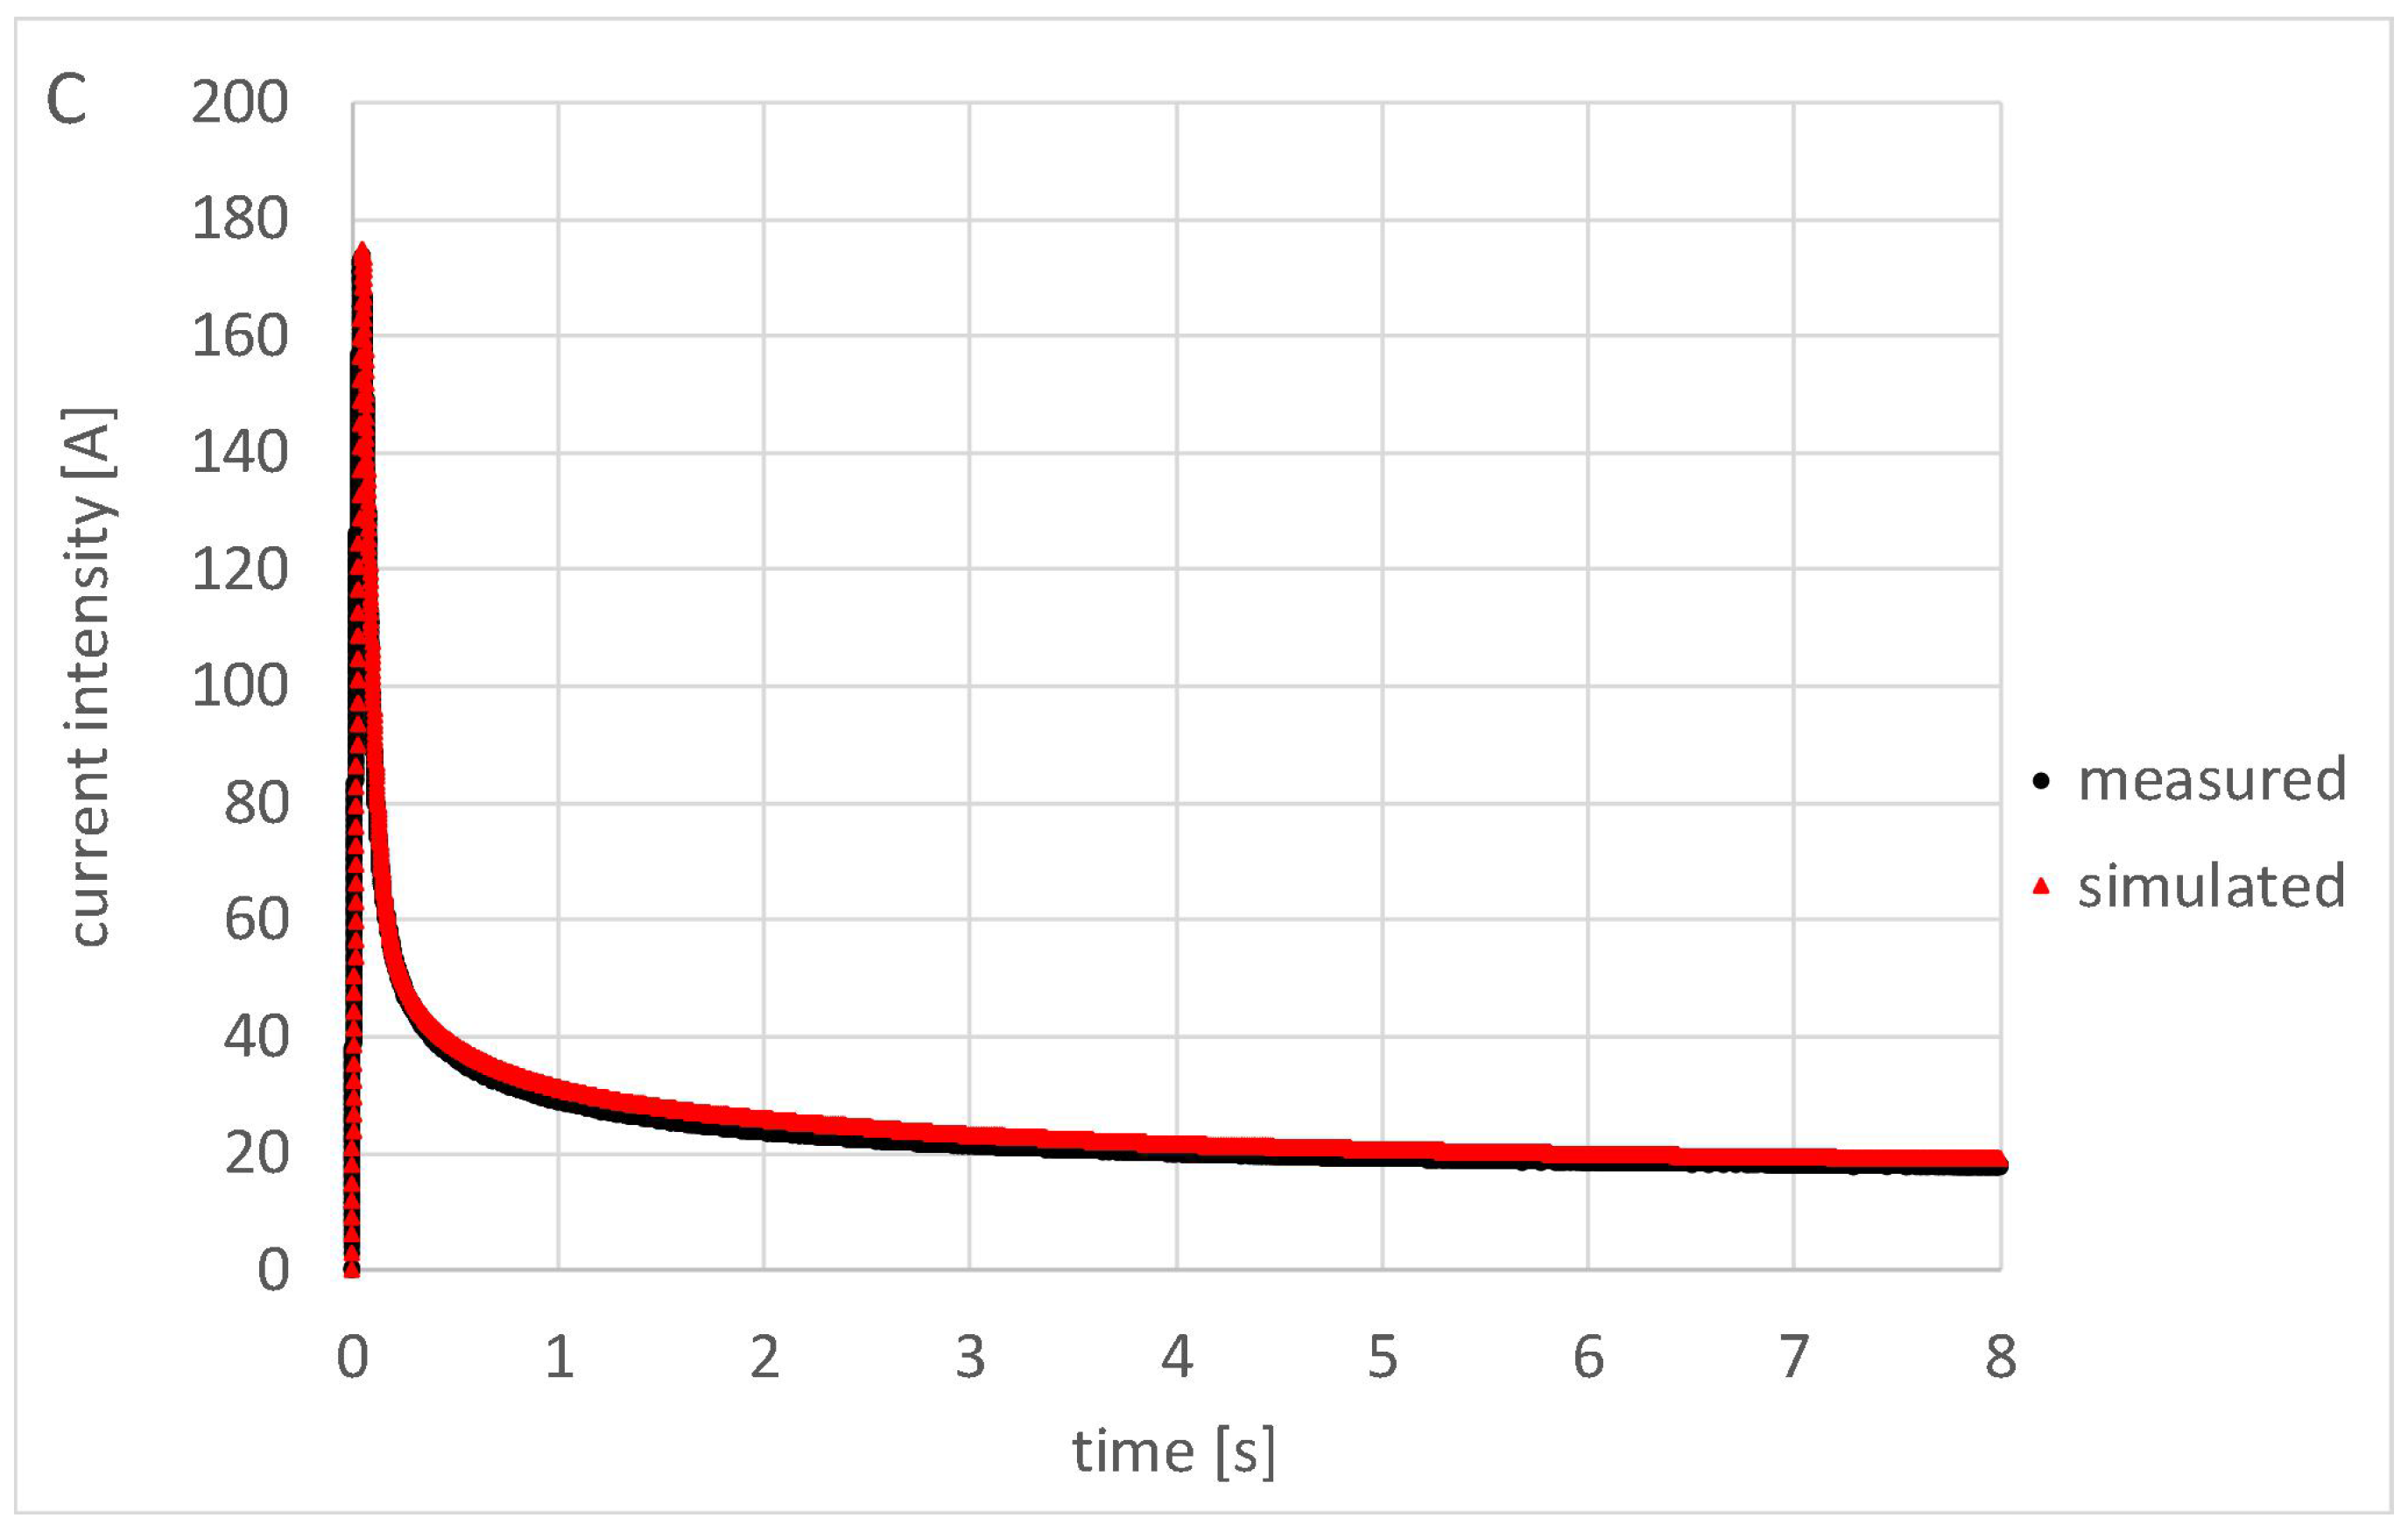
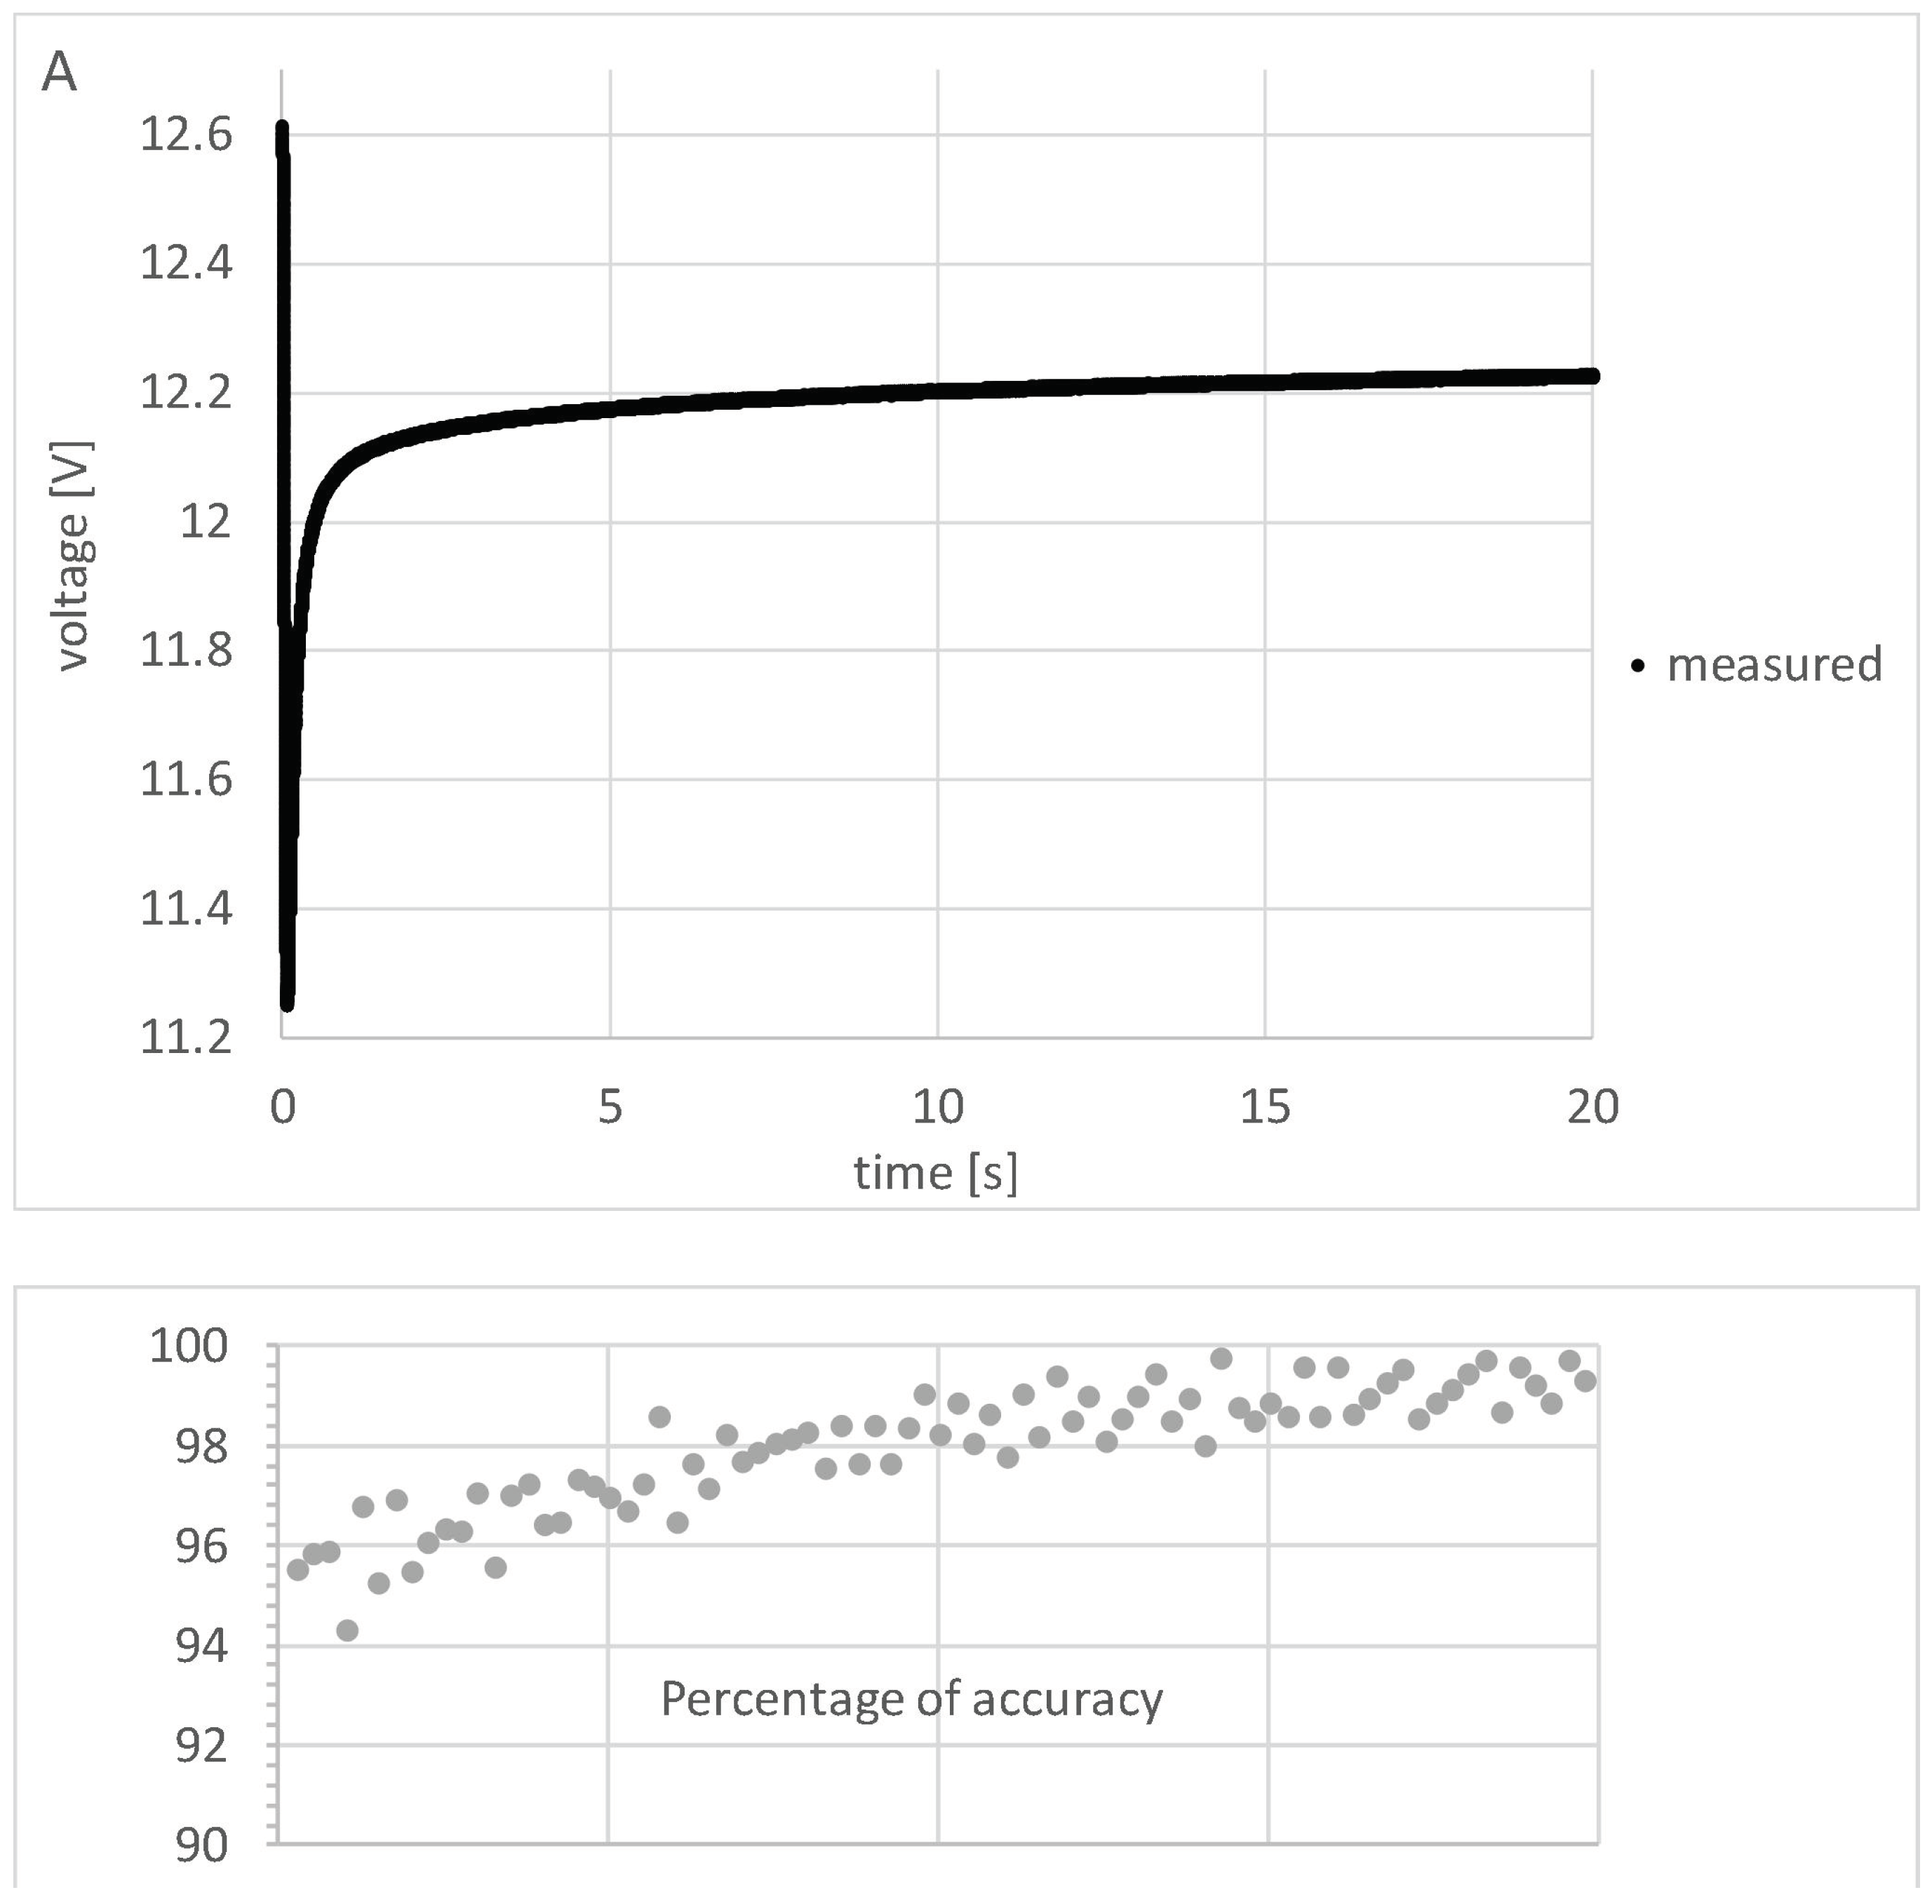
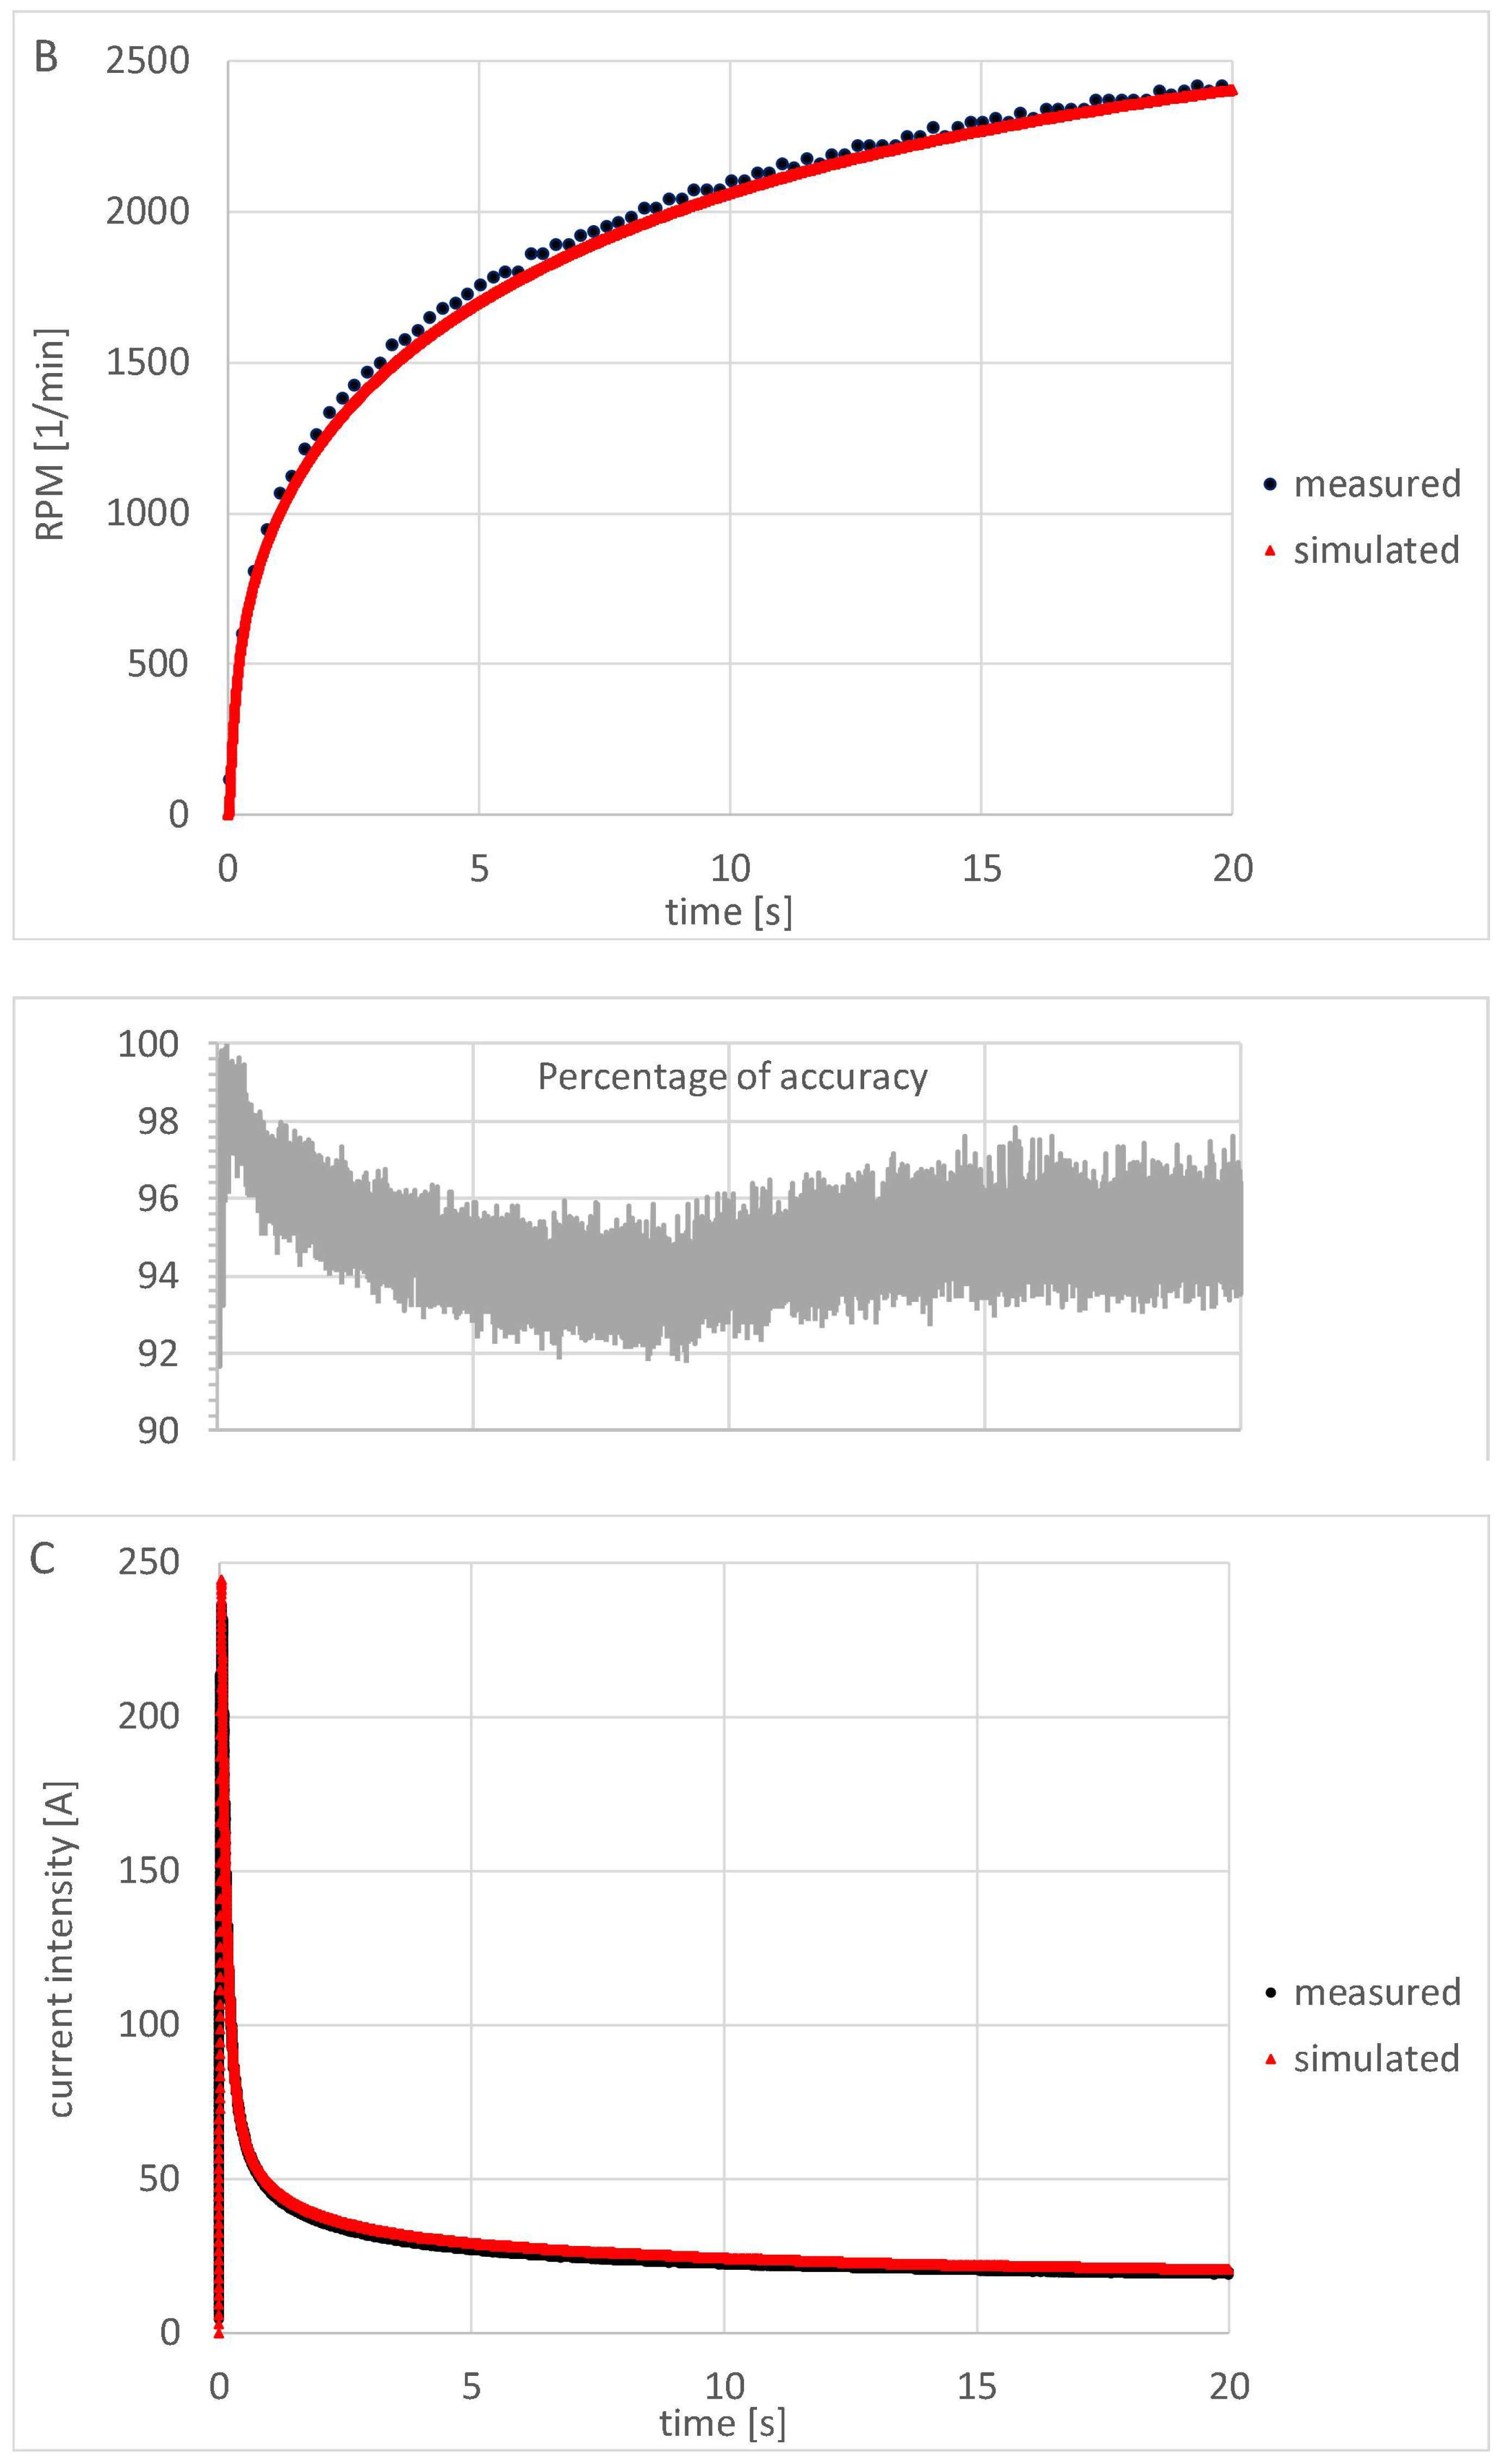
3.2.2. Comparison of Measured and Simulated Results

In Reference [11] and Section 3.2.1, all the input parameters and characteristics were determined that are necessary to run the simulation for the SWDCM (Figure 2). The value of loading torque ( M l o a d ) was zero during the test measurements, thus it was also chosen to be zero in the simulation program. In Figure 8, Figure 9, Figure 10 and Figure 11, the results of the first stage (when the rotor is spinning up from rest) of the test measurements and simulations are compared at different mechanical loads applied on the rotor.
On the basis of Figure 8, Figure 9, Figure 10 and Figure 11, it can be stated that in the initial short time period, the values of angular speed and current intensity are increasing rapidly. After that, the current intensity reaches its maximum value (between 170–250 A depending on the loading moment of inertia on the rotor) in the form of a sharp peak and then approaching a constant value of about 20 A. After the initial intensive increase, the angular speed of the rotor gradually approaching its top speed, at higher values of loading moment of inertia, this process is significantly more slowly than at lower ones.
Considering the percentage error of the electric resistance of the shunt resistor (0.5%) and the one of the measured voltage by the NI 9239 module (0.3%), the estimated percentage error of the measured electric current intensities and angular speeds is less than 1%. It must be emphasised that wire heating can introduce additional error in the measured values of current intensity.
The measured and simulated functions are in a good agreement, which confirms that our simulation program works properly, and the dynamic and electromagnetic parameters of the motor were measured accurately. At lower loading moment of inertia (0.000158–0.003549 kg·m2), the percentage of accuracy of the simulated angular speeds relative to the measured one is varied between 98–99% while at higher moment of inertia (0.06785 kg·m2) is between 96–99%. In case of the current intensities, at lower loading moment of inertia (0.000158–0.003549 kg·m2), the percentage of accuracy of the simulated current intensity relative to the measured one is varied between 93–98% while at higher moment of inertia (0.06785 kg·m2) is between 94–99%.

4. Summary

In the recent study, the proper operation and accuracy of our simulation program for series wound DC motors were checked by dynamic test measurements. Additionally, the necessary dynamic parameters (moments of inertia of the rotor, bearing and brush friction torques on the rotor) for the simulation were measured, applying a novel procedure. The percentage of accuracy of the simulated current intensities related to the measured ones is varied between 93–99%, in all cases, while regarding the angular speed between 96–99%, which validate our simulation program.
The motor simulation program block can be built into our vehicle dynamic simulation program, enabling the precise dynamic simulation of vehicles driven by a series wound DC motor. Our vehicle dynamic simulation program is a useful tool for prototype race car developers to predict the performance of a car in a given race situation. Moreover, applying our program—complementing it with an optimising procedure—the optimal technical parameters and characteristics of a vehicle can be computed for a given task in a competition.
The results of the recent study in details are as follows:
An experimental set-up was developed for dynamic test measurements on electric motors. Applying the set-up, the intensity of electric current through the motor, the speed of the rotor, and the terminal voltage of the battery can be measured in real time, while the rotor is spinning up from rest and then slowing down after the voltage is switched off from it.
Our simulation program for series wound DC motors was upgraded by taking the time dependence of the terminal voltage of the battery into account. Experimental procedures were developed for the measurement of the dynamic parameters of the motor, which serve as input parameters of the simulation program. Namely, two different experimental methods were developed for the measurement of the moments of inertia and friction torque of the rotor, and then their advantages and drawbacks were discussed.
Dynamic test measurements were performed applying different mechanical loads (moment of inertia) on the rotor. During the measurements, voltage was switched on the motor, and the electric current intensity through the motor and the speed of the rotor were measured as a function of time. Following that, simulations were performed applying the same input parameters, and then the results of the test measurements and simulations were compared. The measured and simulated functions are in a good agreement, which confirms that our simulation program works properly, and the dynamic and electromagnetic parameters of the motor were measured accurately.
Previously, a program for BLDC motor simulation had been developed [6]. To determine the input parameters of this program, we intend to measure the electromagnetic and dynamic parameters of a given BLDC motor in the near future with our recently developed measurement system. Following that, we plan to perform dynamic test measurements on the motor and compare their results with the ones of the simulation.
Previously, we applied our vehicle dynamic simulation program for the simulation of the race car which was the winner of the MVM Energy Race in 2015 [5]. In the near future, we intend to measure the vehicle dynamic functions (position-, velocity-, and acceleration-time functions of the vehicle, angular velocity- and acceleration-time functions of the driven wheels) of the same car and compare the results of the measurements and simulations. This way, we intend to check the proper operation and accuracy of our simulation program.
Determination of dynamic parameters using deterministic artificial intelligence applied to DC motors [21] can be also an interesting follow-on research. The authors of this article recommend it to the experts in the above field as an interesting research topic.

Author Contributions

Conceptualization, G.Á.S.; methodology, J.K., A.S., G.Á.S.; software, A.S.; validation, J.K., G.Á.S.; formal analysis, A.S., G.Á.S.; investigation, J.K., A.S., G.Á.S.; resources, J.K., T.M., A.S., G.Á.S.; data curation, A.S.; writing—original draft preparation, A.S., G.Á.S.; writing—review and editing, T.M.; visualization, A.S., G.Á.S.; supervision, G.Á.S.; project administration, T.M.; funding acquisition, T.M. All authors have read and agreed to the published version of the manuscript.

Funding

Thematic Excellence Programme (TKP2020-NKA-04) of the Ministry for Innovation and Technology in Hungary and the University of Debrecen.

Institutional Review Board Statement

Not applicable.

Informed Consent Statement

Not applicable.

Acknowledgments

The research was supported by the Thematic Excellence Programme (TKP2020-NKA-04) of the Ministry for Innovation and Technology in Hungary. Supported by the ÚNKP-20-3 New National Excellence Program of the Ministry for Innovation and Technology from the source of the National Research, Development and Innovation Fund.

Conflicts of Interest

The authors declare no conflict of interest.

Abbreviations

AbbreviationMeaning
ACalternating current
BLDCMbrushless DC motor
DCdirect current
e.g.,for example
MVMHungarian Electrical Works Ltd.
NInational instruments
PCpersonal computer
RPMrevolutions per minute
SWDCMseries wound DC motor
IMinduction motor
SMsynchronous motor
SRMswitched reluctance motor

Nomenclature

SymbolDefinitionSI unit
αincline angle[°]
ε angular deceleration[rad/s2]
Icurrentampere [A]
Jloadmoment of inertia of the mechanical loading[kg·m2]
Jrmoment of inertia of the rotor[kg·m2]
karm of rolling friction[m]
Lrself dynamic inductance of the rotor windinghenry [H]
Lsself dynamic inductance of the stator windinghenry [H]
Lsrmutual dynamic inductancehenry [H]
mmass of the rotor[kg]
Mloadloading torque on the rotor of the motornewton [N]
Mresbearing plus brush friction torque on the rotor of the motornewton [N]
ωangular velocityradian per second [rad/s]
rrolling radius[m]
Rbattinternal resistance of the batteryohm [Ω]
Rrelectric resistance of the rotor windingohm [Ω]
Rselectric resistance of the stator windingohm [Ω]
Rshuntresistance of the shunt resistorohm [Ω]
Rwireresultant resistance of the wires connecting the motor to the batteryohm [Ω]
scovered distance by the centre of mass of the rotor[m]
ttime of rolling[s]
Ubattelectromotive force of the batteryvolt [V]
Ubrushvoltage drop on the carbon brushesvolt [V]

References

  1. Szántó, A.; Szíki, G.Á. Review of Modern Vehicle Powertrains and Their Modelling and Simulation in MATLAB/Simulink. Int. J. Eng. Manag. Sci. 2020, 5, 232–250. [Google Scholar] [CrossRef]
  2. Singh, K.V.; Bansal, H.O.; Singh, D. A comprehensive review on hybrid electric vehicles: Architectures and components. J. Mod. Transport. 2019, 27, 77–107. [Google Scholar] [CrossRef] [Green Version]
  3. Lulhe, A.M.; Date, T.N. A Technology Review Paper for Drives used in Electrical Vehicle (EV) & Hybrid Electrical Vehicles (HEV). In Proceedings of the 2015 International Conference on Control, Instrumentation, Communication and Computational Technologies (ICCICCT), Kumaracoil, India, 18–19 December 2015. [Google Scholar]
  4. Szíki, G.Á.; Juhász, G.; Nagyné Kondor, R.; Juhász, B. Determination and Solution of the Motion of Equation of a Pneumatic Drive Vehicle. In Proceedings of the 1st Agria Conference on Innovative Pneumatic Vehicles–ACIPV 2017 Budapest, Eger, Hungary, 5 May 2017; pp. 55–58. [Google Scholar]
  5. Szántó, A.; Szíki, G.Á.; Hajdu, S. Dynamics simulation of a prototype race car driven by series wound DC motor in Matlab-Simulink. Acta Polytech. Hung. 2020, 17, 103–122. [Google Scholar] [CrossRef]
  6. Szíki, G.Á.; Szántó, A.; Mankovits, T. Dynamic modelling and simulation of a prototype race car in MATLAB/Simulink applying different types of electric motors. Int. Rev. Appl. Sci. Eng. 2020, 12, 57–63. [Google Scholar]
  7. András, G.; Attila, M.; Lajos, M.; József, V.K.; Dániel, N.; Dávid, B.; Péter, P.H.; Balázs, S.K.; Attila, S.; Áron, S.G.; et al. Prototype and urban concept battery electric car development for Shell ECO-Marathon competition. In Proceedings of the 26th International Conference on Mechanical Engineering (OGÉT), Marosvásárhely, Romania, 26–29 April 2018; Volume 544, pp. 139–142. [Google Scholar]
  8. Juhász, G. Technical competitions for the education. In Proceedings of the 1st International Scientific Conference on Advances in Mechanical Engineering (ISCAME), Debrecen, Hungary, 10–11 October 2013; Volume 229, pp. 74–78. [Google Scholar]
  9. Attila, S.; Áron, S.G.; Sándor, H.; András, G.; Balázs, S.K. Vehicle dynamics simulation and optimization. Pap. Tech. Sci. 2018, 9, 219–222. [Google Scholar]
  10. Salem, F.A. Dynamic Modeling, Simulation and Control of Electric Machines for Mechatronics Applications. Int. J. Control Autom. Syst. 2013, 1, 30–42. [Google Scholar]
  11. Sziki, G.Á.; Sarvajcz, K.; Kiss, J.; Gál, T.; Szántó, A.; Gábora, A.; Husi, G. Experimental investigation of a series wound dc motor for modeling purpose in electric vehicles and mechatronics systems. Measurement 2017, 109, 111–118. [Google Scholar]
  12. Szántó, A.; Szántó, A.; Sziki G, Á. Review of the modelling methods of series wound DC motors. Műszaki Tudományos Közlemények 2020, 13, 166–169. [Google Scholar]
  13. Záskalický, P. Modelling of a serial wound DC motor supplied by a semi controlled rectifier. Adv. Electr. Electron. Eng. 2006, 5, 110–113. [Google Scholar]
  14. Bitara, Z.; Al Jabia, S.; Khamisb, I. Modeling and Simulation of Series DC Motors in Electric Car. Energy Procedia 2014, 50, 460–470. [Google Scholar] [CrossRef] [Green Version]
  15. Barna, G. Simulation Model of a Series DC Motor for Traction Rail Vehicles; IEEE: Piscataway, NJ, USA, 2016; ISBN 978-1-5090-1866-6. [Google Scholar]
  16. Hadžiselimović, M.; Blaznik, M.; Štumberger, B.; Zagradišnik, I. Magnetically Nonlinear Dynamic Model of a Series Wound DC Motor. Prz. Elektrotechniczny 2011, 87, 60–64. [Google Scholar]
  17. Áron, S.G.; Kornél, S.; Attila, S.; Tamás, M. Series Wound DC Motor Simulation Applying Matlab Simulink and Labview Control Design and Simulation Module. Period. Polytech. Transp. Eng. 2020, 48, 65–69. [Google Scholar]
  18. Kaššay, P.; Grega, R. Measuring Mass Moment of Inertia of a Rotor—Two Simple Methods Using No Special Equipment. Current Methods of Construction Design; Lecture Notes in Mechanical Engineering; Springer: Cham, Switzerland, 2020; pp. 303–315. [Google Scholar] [CrossRef]
  19. Egorov, A.V.; Kozlov, K.; Belogusev, V. Experimental identification of the electric motor moment of inertia and its efficiency using the additional inertia. ARPN J. Eng. Appl. Sci. 2016, 11, 10582. [Google Scholar]
  20. Rahul, A.; Lekurwale, S.G. Tarnekar: Determination of Moment of Inertia of Electrical Machines Using MATLAB. Int. J. Eng. Res. Technol. 2012, 1. [Google Scholar]
  21. Sands, T. Control of DC Motors to Guide Unmanned Underwater Vehicles. Appl. Sci. 2021, 11, 2144. [Google Scholar] [CrossRef]
Figure 1. The applied model for the simulation of SWDCMs [6,11].
Applsci 11 04542 g001
Figure 2. The simulation program created in MATLAB/Simulink [11].
Applsci 11 04542 g002
Figure 3. The applied experimental set-up and its wiring diagram.
Applsci 11 04542 g003
Figure 4. Results of a dynamic test measurement performed on the analysed SWDCM. ( J l o a d = 0.0001576   kg · m 2 ). (A) Battery terminal voltage, (B) motor speed, and (C) current intensity.
Applsci 11 04542 g004
Figure 5. Results of the second stage of the run-out experiments.
Applsci 11 04542 g005
Figure 6. The rotor of the motor.
Applsci 11 04542 g006
Figure 7. Parameters of the roll-down experiment.
Applsci 11 04542 g007
Figure 8. Results of dynamic test measurement and simulation performed on the analysed SWDCM. ( J l o a d = 0.0001576   kg · m 2 ). (A) Battery terminal voltage, (B) motor speed, and (C) current intensity.
Applsci 11 04542 g008aApplsci 11 04542 g008b
Figure 9. Results of dynamic test measurement and simulation performed on the analysed SWDCM. ( J l o a d = 0.0018561   kg · m 2 ). (A) Battery terminal voltage, (B) motor speed, and (C) current intensity.
Applsci 11 04542 g009aApplsci 11 04542 g009b
Figure 10. Results of dynamic test measurement and simulation performed on the analysed SWDCM. ( J l o a d = 0.0035496   kg · m 2 ). (A) Battery terminal voltage, (B) motor speed, and (C) current intensity.
Applsci 11 04542 g010aApplsci 11 04542 g010b
Figure 11. Results of dynamic test measurement and simulation performed on the analysed SWDCM. ( J l o a d = 0.06785   kg · m 2 ). (A) Battery terminal voltage, (B) motor speed, and (C) current intensity.
Applsci 11 04542 g011aApplsci 11 04542 g011b
Table 1. Magnitude of the rotor’s angular acceleration at different mechanical loads.
Load J l o a d   [ kg · m 2 ] | ε |   [ rad / s 2 ]
Disc 10.000157630.331
Disc 20.001856127.273
Disc 30.003549625.516
Disc 40.067856.5519
Table 2. Moment of inertia ( J r ) and friction torque ( M r e s ) of the rotor obtained from two independent run-out experiments.
Load Pairs J r   [ kg · m 2 ] M r e s   [ Nm ]
Disc 1–Disc 40.018220.5574
Disc 2–Disc 40.018670.5603
Disc 3–Disc 40.01830.5575
Table 3. Experimental data and calculated moment of inertia of the rotor at the roll-down experiment.
m
[kg]
r
[m]
α 1
[°]
α 2
[°]
12.350 ± 0.0010.0151.063 ± 0.00321.539 ± 0.0046
a c 1
[ m / s 2 ]
a c 2
[ m / s 2 ]
J r
[kg·m2]
0.0215 ± 0.00010.0315 ± 0.00020.01987 ± 0.0006
Table 4. Friction torques obtained from the run-out experiments ( J r = 0.01987   kg · m 2 ).
Load M r e s   [ Nm ]
Disc 10.6075
Disc 20.5925
Disc 30.5976
Disc 40.5747
Table 5. Experimental data and experimentally and theoretically determined moment of inertia of the homogeneous stainless-steel cylinder.
m
[kg]
r
[m]
α 1
[°]
α 2
[°]
2.304 ± 0.0010.0250.4797 ± 0.00141.2021 ± 0.0036
a c 1
[ m / s 2 ]
a c 2
[ m / s 2 ]
J r   ( experimental )
[kg·m2]
J r   ( theoretical )
[kg·m2]
0.0485 ± 0.00030.1316 ± 0.00070.000702 ± 0.0000230.00072
Publisher’s Note: MDPI stays neutral with regard to jurisdictional claims in published maps and institutional affiliations.

