Article

Effect of Lactobacillus paracasei HII01 Supplementation on Total Cholesterol, and on the Parameters of Lipid and Carbohydrate Metabolism, Oxidative Stress, Inflammation and Digestion in Thai Hypercholesterolemic Subjects

by
Chaiyavat Chaiyasut
1,*,
Yaowalak Tirawat
1,
Bhagavathi Sundaram Sivamaruthi
1,
Periyanaina Kesika
1,
Subramanian Thangaleela
1,2,
Suchanat Khongtan
1,
Nanticha Khampithum
1,
Sartjin Peerajan
3,
Khontaros Chaiyasut
4,
Sasithorn Sirilun
1 and
Phakkharawat Sittiprapaporn
5,*
1
Innovation Center for Holistic Health, Nutraceuticals, and Cosmeceuticals, Faculty of Pharmacy, Chiang Mai University, Chiang Mai 50200, Thailand
2
Vaels Ravindra Bharathi Global School, Tambaram, Chennai 600048, India
3
Health Innovation Institute, Chiangmai 50200, Thailand
4
Institute of Research and Development, Chiang Mai Rajabhat University, Chiangmai 50300, Thailand
5
Neuropsychological Research Laboratory, Department of Anti-Aging and Regenerative Science, School of Anti-Aging and Regenerative Medicine, Mae Fah Luang University, Bangkok 11120, Thailand
*
Authors to whom correspondence should be addressed.
Appl. Sci. 2021, 11(10), 4333; https://doi.org/10.3390/app11104333
Submission received: 19 February 2021 / Revised: 1 May 2021 / Accepted: 6 May 2021 / Published: 11 May 2021
(This article belongs to the Special Issue Effects of Probiotics on Host Health)

Abstract

:
Hypercholesterolemia is one of the leading causes of cardiovascular disease. Probiotics can help to improve high blood lipid levels in hypercholesterolemia patients. Lactobacillus paracasei has been reported to have beneficial effects in several subjects; however, there is a lack of studies on Thai hypercholesterolemic subjects. Thus, this study was conducted in order to investigate the effect of L. paracasei HII01 on cholesterol, oxidative stress, and other biomarkers. Fifty-two subjects were randomized into two groups: the L. paracasei treatment group and the placebo group. The study was conducted over an intervention period of 12 weeks of supplementation. The results show that L. paracasei HII01 significantly reduced the total cholesterol (TCH), triglycerides (TGs), tumor necrosis factor (TNF)-α and lipopolysaccharide (LPS) of the patients, and increased their HDL, total antioxidant capacity (TAC) and propionic acid compared to the placebo group. Moreover, the supplementation of L. paracasei HII01 significantly increased lactic acid, IL-10 and IFN-γ, and substantially decreased malondialdehyde (MDA) at the end of the treatment. The results suggest that L. paracasei HII01 improves the blood lipid profile, reduces oxidative stress, and is beneficial for health among Thai hypercholesterolemic subjects.

1. Introduction

Nowadays, cardiovascular diseases have become life-threatening worldwide. There are many causes of cardiovascular events, such as hypercholesterolemia. Hypercholesterolemia is the state of having a high level of lipids in the bloodstream due to increased total cholesterol, triglycerides, and low-density lipoprotein (LDL) levels. According to the Department of Mental Health, Thailand, the number of hypercholesterolemia patients has increased annually, due to the higher rate of a high-fat diets, lack of exercise, and unhealthy eating behavior. The excessive consumption of fatty foods leads to high blood lipid levels, which further develop into cardiovascular disease [1]. In patients with mild hypercholesterolemia, there are many effective ways to manage and prevent high lipid levels in the bloodstream, such as changing dietary behavior, doing more exercise, or even taking supplement products [2]. It is suggested that soy, red yeast, vitamin C, and probiotics can help to improve blood lipid profiles [3,4,5].
Oxidative stress has been defined as the imbalance between reactive oxygen species (free radicals) and antioxidant defenses, which leads to tissue damage because of the oxidation reaction [6]. A previous study [7] reported that high LDL levels are associated with the oxidative stress state caused by lipid peroxidation. The oxidant LDL will lead to foam cell generation, and will become further atherosclerosis.
Probiotics are live microorganisms that, when administered in adequate amounts, provide a health benefit to the host. L. paracasei displays probiotic properties, including acid and bile tolerance, adhesion to mucosal and epithelial surfaces, antimicrobial activity, and bile salt hydrolase activity. L. paracasei can lower cholesterol levels both in humans and animal models. There are several pathways involved in cholesterol-lowering; for example, deconjugating bile salts into bile acids and excreting them out of the body via feces to promote the use of cholesterol as a substrate in order to synthesize more bile acids [8]. The antioxidant effects of L. paracasei have been reported by many processes, including up-regulating antioxidative activity, promoting the production of glutathione (GSH), and down-regulating the production of malondialdehyde (MDA), which is a reactive oxygen species (ROS) [9]. Moreover, probiotics can stimulate an immune response by increasing immunoglobulin production, and through the enhancement of macrophages and lymphocyte activity, the stimulation of the γ-interferon output, and the stimulation of both the acquired and innate immune response via immunoglobulin A (IgA) secretion and phagocytosis induction [10]. Moreover, they provide assistance in detoxification and the removal of toxins such as lipopolysaccharide from the body [11].
L. paracasei HII01 was isolated from northern Thai pickles and was reported for its beneficial effects on fatigued, obese, and diabetic subjects [12]. However, there is a limited number of studies on hypercholesterolemic Thai subjects. Therefore, the current study was conducted to investigate the effect of L. paracasei HII01 supplementation on cholesterol and oxidative stress levels in Thai subjects with hypercholesterolemia.

2. Materials and Methods

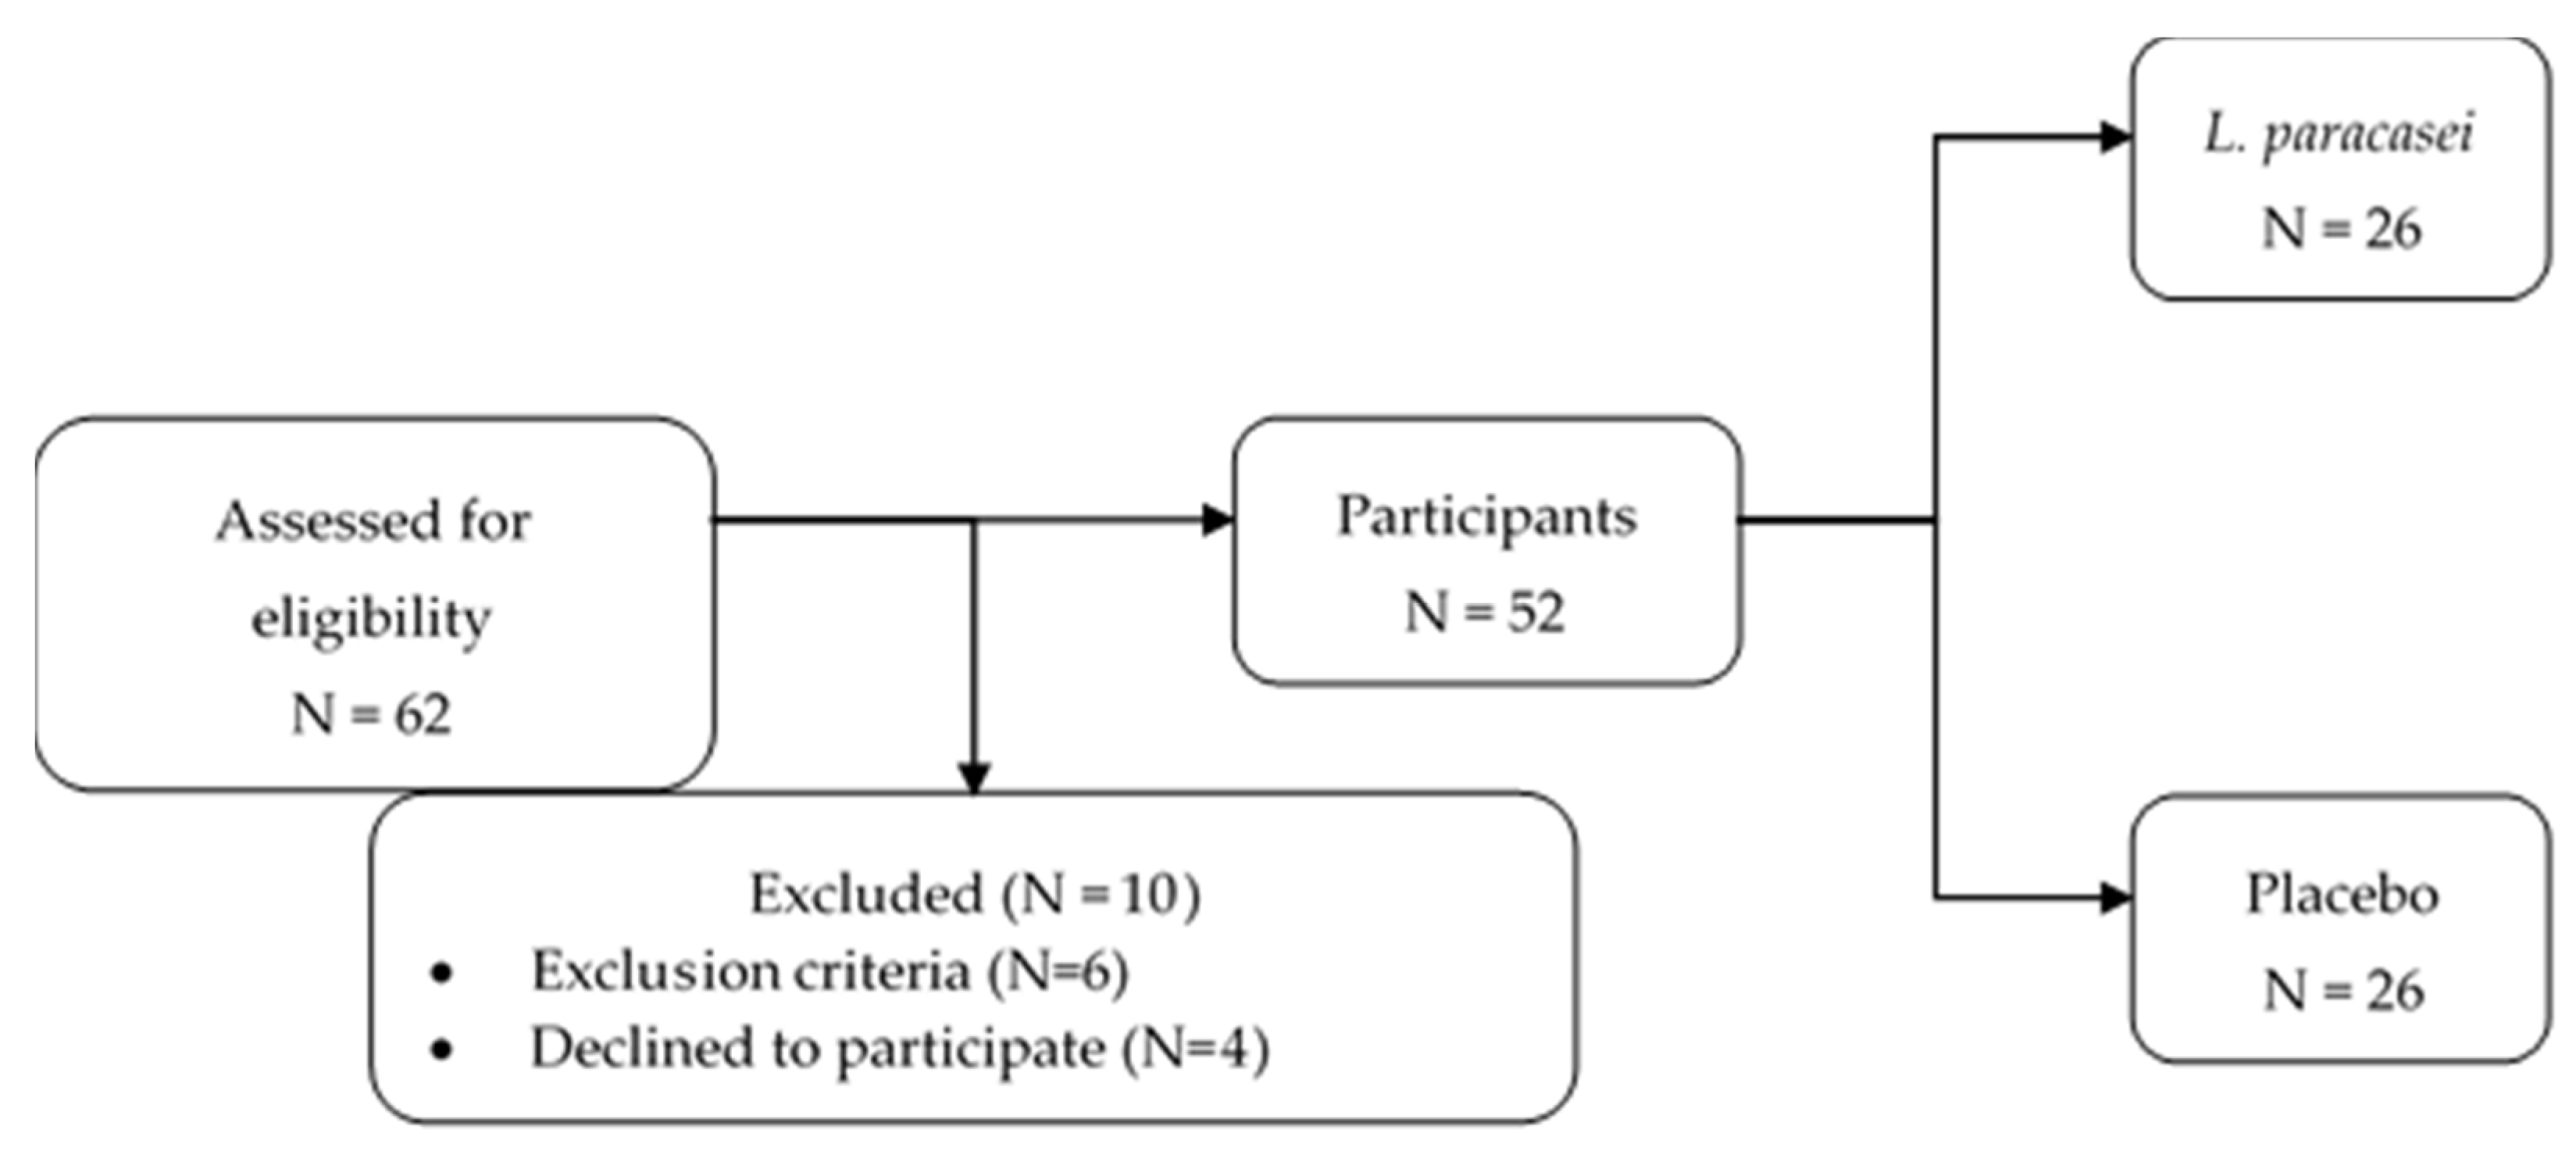
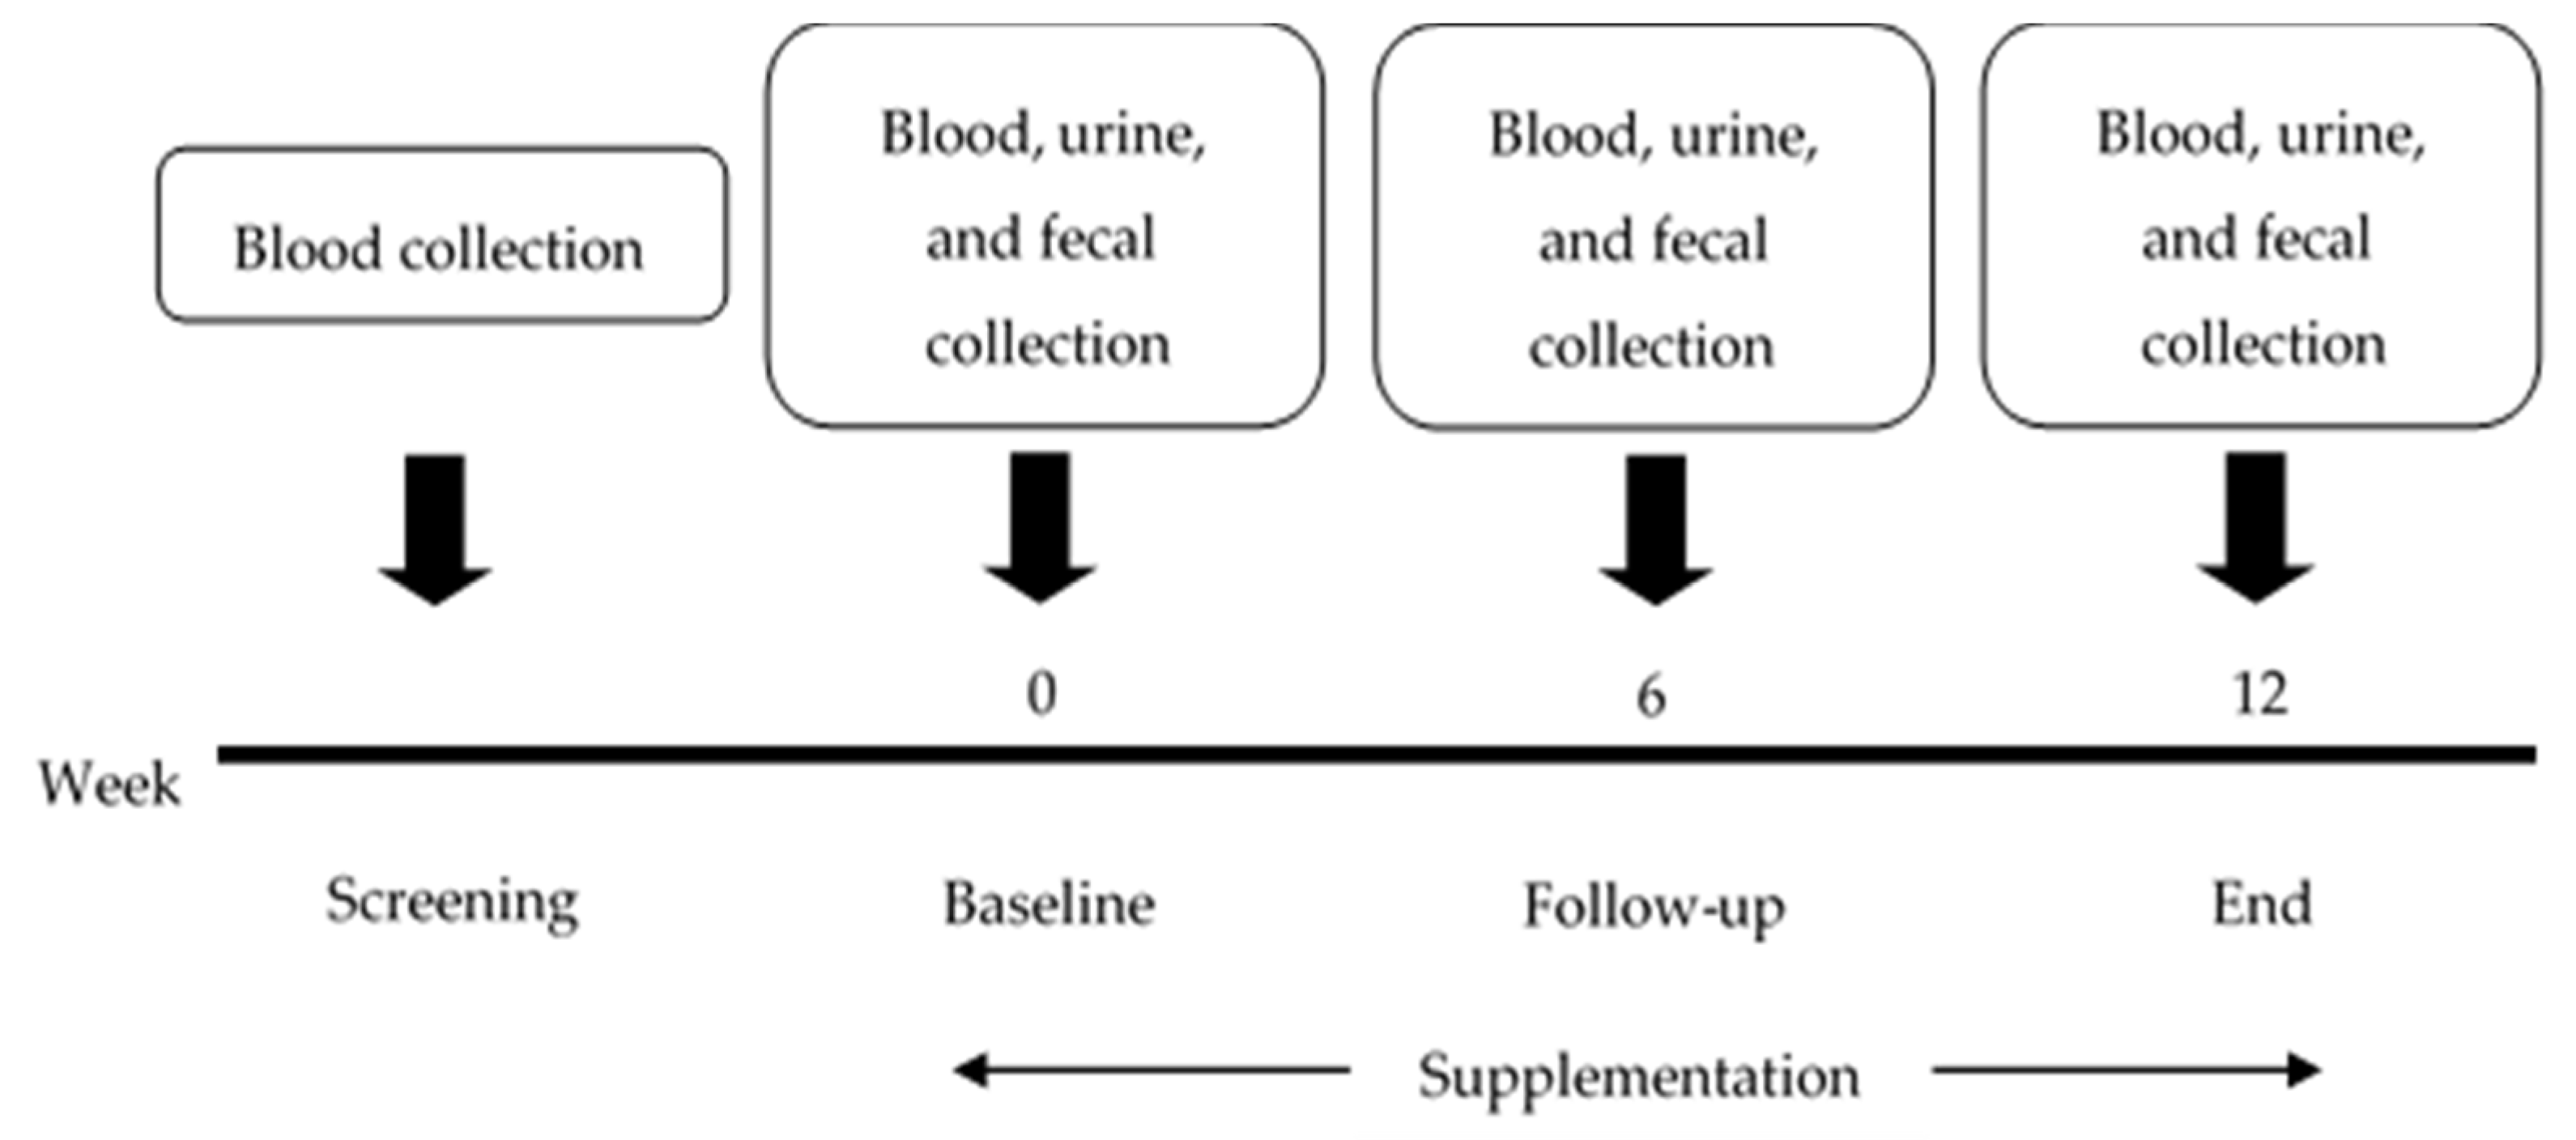
2.1. Study Design and Participants

All of the subjects gave their informed consent for participation in the study. The study was conducted following the Good Clinical Practices, fully complied with the ethical guidelines of a clinical trial, and was conducted according to the Declaration of Helsinki; the Ethics Committee approved the protocol of Mae Fah Luang University (Code: REH-62151).
The effect of probiotic supplementation on cholesterol, intestinal permeability, and selected biomarkers was studied in Thai subjects with moderate hypercholesterolemia, as per the ATP III guideline of the National Cholesterol Education Program (NCEP) [13].
For the screening of the subjects for enrollment, venous blood samples were obtained after an 8 h overnight fast, and the total cholesterol (TCH), HDL-cholesterol (HDL-C), LDL-cholesterol (LDL-C), and triglyceride (TG) levels were determined at the AMS Clinical Service Center, Faculty of Associated Medical Sciences, Chiang Mai University, Thailand. The participants were required to be aged 18–60 years with moderate–high levels of TCH (TCH ≥ 200 mg/dL and ≤ 239 mg/dL), triglycerides (TGs ≥ 150 mg/dL and ≤ 199 mg/dL), LDL-C (LDL-C ≥ 130 mg/dL and ≤ 159 mg/dL), or HDL-C (HDL-C < 40 mg/dL), and could not be using lipid-lowering drugs. The exclusion criteria included previous cardiovascular events, suffering from kidney disease and gouty arthritis, having gastrointestinal tract disorders, and having been treated with prebiotic and/or probiotic and/or antibiotic drugs or any other drugs which were potentially able to affect the lipid metabolism in the previous 14 days.
The randomization was performed by computer-generated codes using Random Allocation Software. The study staff and the investigators were blinded to the group assignment as well as the subjects. The participants were randomized to receive either the probiotic L. paracasei HII01 supplement or a placebo for 12-week treatments. The participants were asked to return for follow-up visits every 6 weeks after starting the supplementation. The study flowchart and enrollment are shown in Figure 1.

2.2. Treatment

During the visit at the beginning of the supplementation, the enrolled subjects in the probiotic group were provided with aluminum foil sachets containing 1.25 × 10¹⁰ CFU of the L. paracasei HII01 strain, which was received from Lactomason Co., Ltd., Jinju-si, South Korea, and the placebo group were provided with aluminum foil sachets containing 10 g corn starch.
For the 12-week study, the subjects in the treatment group were instructed to regularly take the supplementation by dissolving one sachet in a glass of water every day before breakfast. The subjects in the control group took a placebo sachet once daily for 12 weeks, as in the probiotic group. The subjects received the sachet weekly, and the daily intake of the sample was recorded during the follow-up.

2.3. Assessments

2.3.1. Clinical Data

The subjects’ personal histories were evaluated, including smoking habits, alcohol drinking habits, congenital diseases, physical activities, and pharmacological treatments.
Demographic characteristics—including age, sex, weight, body mass index (BMI), and blood pressure—were recorded. Weight and BMI were measured using an electronic scale (Picooc®, Model S1 Pro, Beijing, China).

2.3.2. Laboratory Data

Blood, urine and fecal samples were collected in the screening process, at the baseline, in the follow-up, and at the end of the study (Figure 2). The biochemical results—including those of the total cholesterol (TC), HDL-cholesterol (HDL-C), LDL-cholesterol (LDL-C), triglycerides (TGs) and fasting blood sugar (FBS) levels—were determined from the blood using the automated machine at the AMS Clinical Service Center, Chiang Mai University, Chiang Mai, Thailand. Other biomarkers in the blood, such as immunoglobulin A (IgA), lipopolysaccharide (LPS), and inflammatory chemokines/cytokines, were determined using an ELISA commercial kit (MyBioSource®, San Diego, CA, USA for LPS, Elabscience®, Houston, TX, USA for IgA, MyBioSource®, San Diego, CA, USA for IL-10, MyBioSource®, San Diego, CA, USA for IFN-γ, MyBioSource®, San Diego, CA, USA for TNF-α). The plasma TAC was determined with a 2,2′-azinobis (3-ethylbenzothiazoline-6-sulfonic acid) (ABTS) radical scavenging capacity assay [14,15]. The determination of MDA was achieved by the TBARS method, using 50 µL of the sample reacted with TBA and TCA heated at 100 °C for 30 min, and with the tube cooled in cold water. The colored complex of MDA-(TBA)2 that occurred was measured using a spectrophotometer at 532 nm [16,17], and the reduced GSH in the plasma was determined using a recycling assay of DTNB [18].
Urine samples were collected from the subjects in order to determine their intestinal permeability. The subjects were given mannitol and lactulose at a ratio of 1:2 dissolved in water. The subjects were required to collect urine within six hours after taking the mannitol and lactulose [19]. The volume of total urine from each subject was measured, and the intestinal permeability was analyzed using an ELISA commercial kit (EnzyChromTM, BioAssay, Hayward, CA, USA).
Fecal samples were collected in order to determine the short-chain fatty acids using high-performance liquid chromatography (HPLC) with the following conditions: Shodex SH1011 as a column, 5 mM sulfuric acid (H2SO4) as a mobile phase, a flow rate of 0.6 mL/min at 210 nm and 75 °C [20,21].

2.3.3. Statistical Analyses

The sample sizes were calculated for the total cholesterol change at the end of the study in the control group and treatment group as 254.8 and 241.1 mg/dL, respectively. A dropout rate of 18% with a total of 52 enrolled subjects was calculated when considering the expected variances of 19.2 and 10.3 in the control group and treatment group [22], respectively; an error of 0.05 and a power of 0.80 was used.
The data were analyzed using the paired t-test of means using STATA version 15.1 (StataCorp, College Station, TX, USA) for windows licensed to the Faculty of Pharmacy, Chiang Mai University.
The descriptive analysis of the collected parameters was expressed as an absolute number and percentage. The continuous variables were expressed as the mean ± standard deviation (SD) or standard error of the mean (SEM), depending on their statistical distribution. The group’s data were calculated using the t-test and Gaussian regression, and within-group at a different time using ANOVA. The differences between the time and group were compared using repeated measurement analysis.
The minimum level of statistical significance was set to p < 0.05 two-tailed.

3. Results

3.1. Participant Characteristics

A total of 62 volunteers were screened, and 52 subjects underwent randomization. Four volunteers declined to participate in the study due to personal reasons. All of the enrolled subjects (men: 17; women: 35) completed the trial according to the study design. The subjects’ characteristics in this study are summarized in Table 1.
The two treatment groups were well matched for age, sex, weight, height, and BMI at the baseline. The final distribution between men and women did not show any significant differences (p > 0.05). All of the volunteers of this study were from the same village. The meal pattern of the volunteers was recorded. Mainly, they consumed rice, chili paste, vegetables, dairy products and meat. There were no changes observed in the eating behavior of the volunteers.

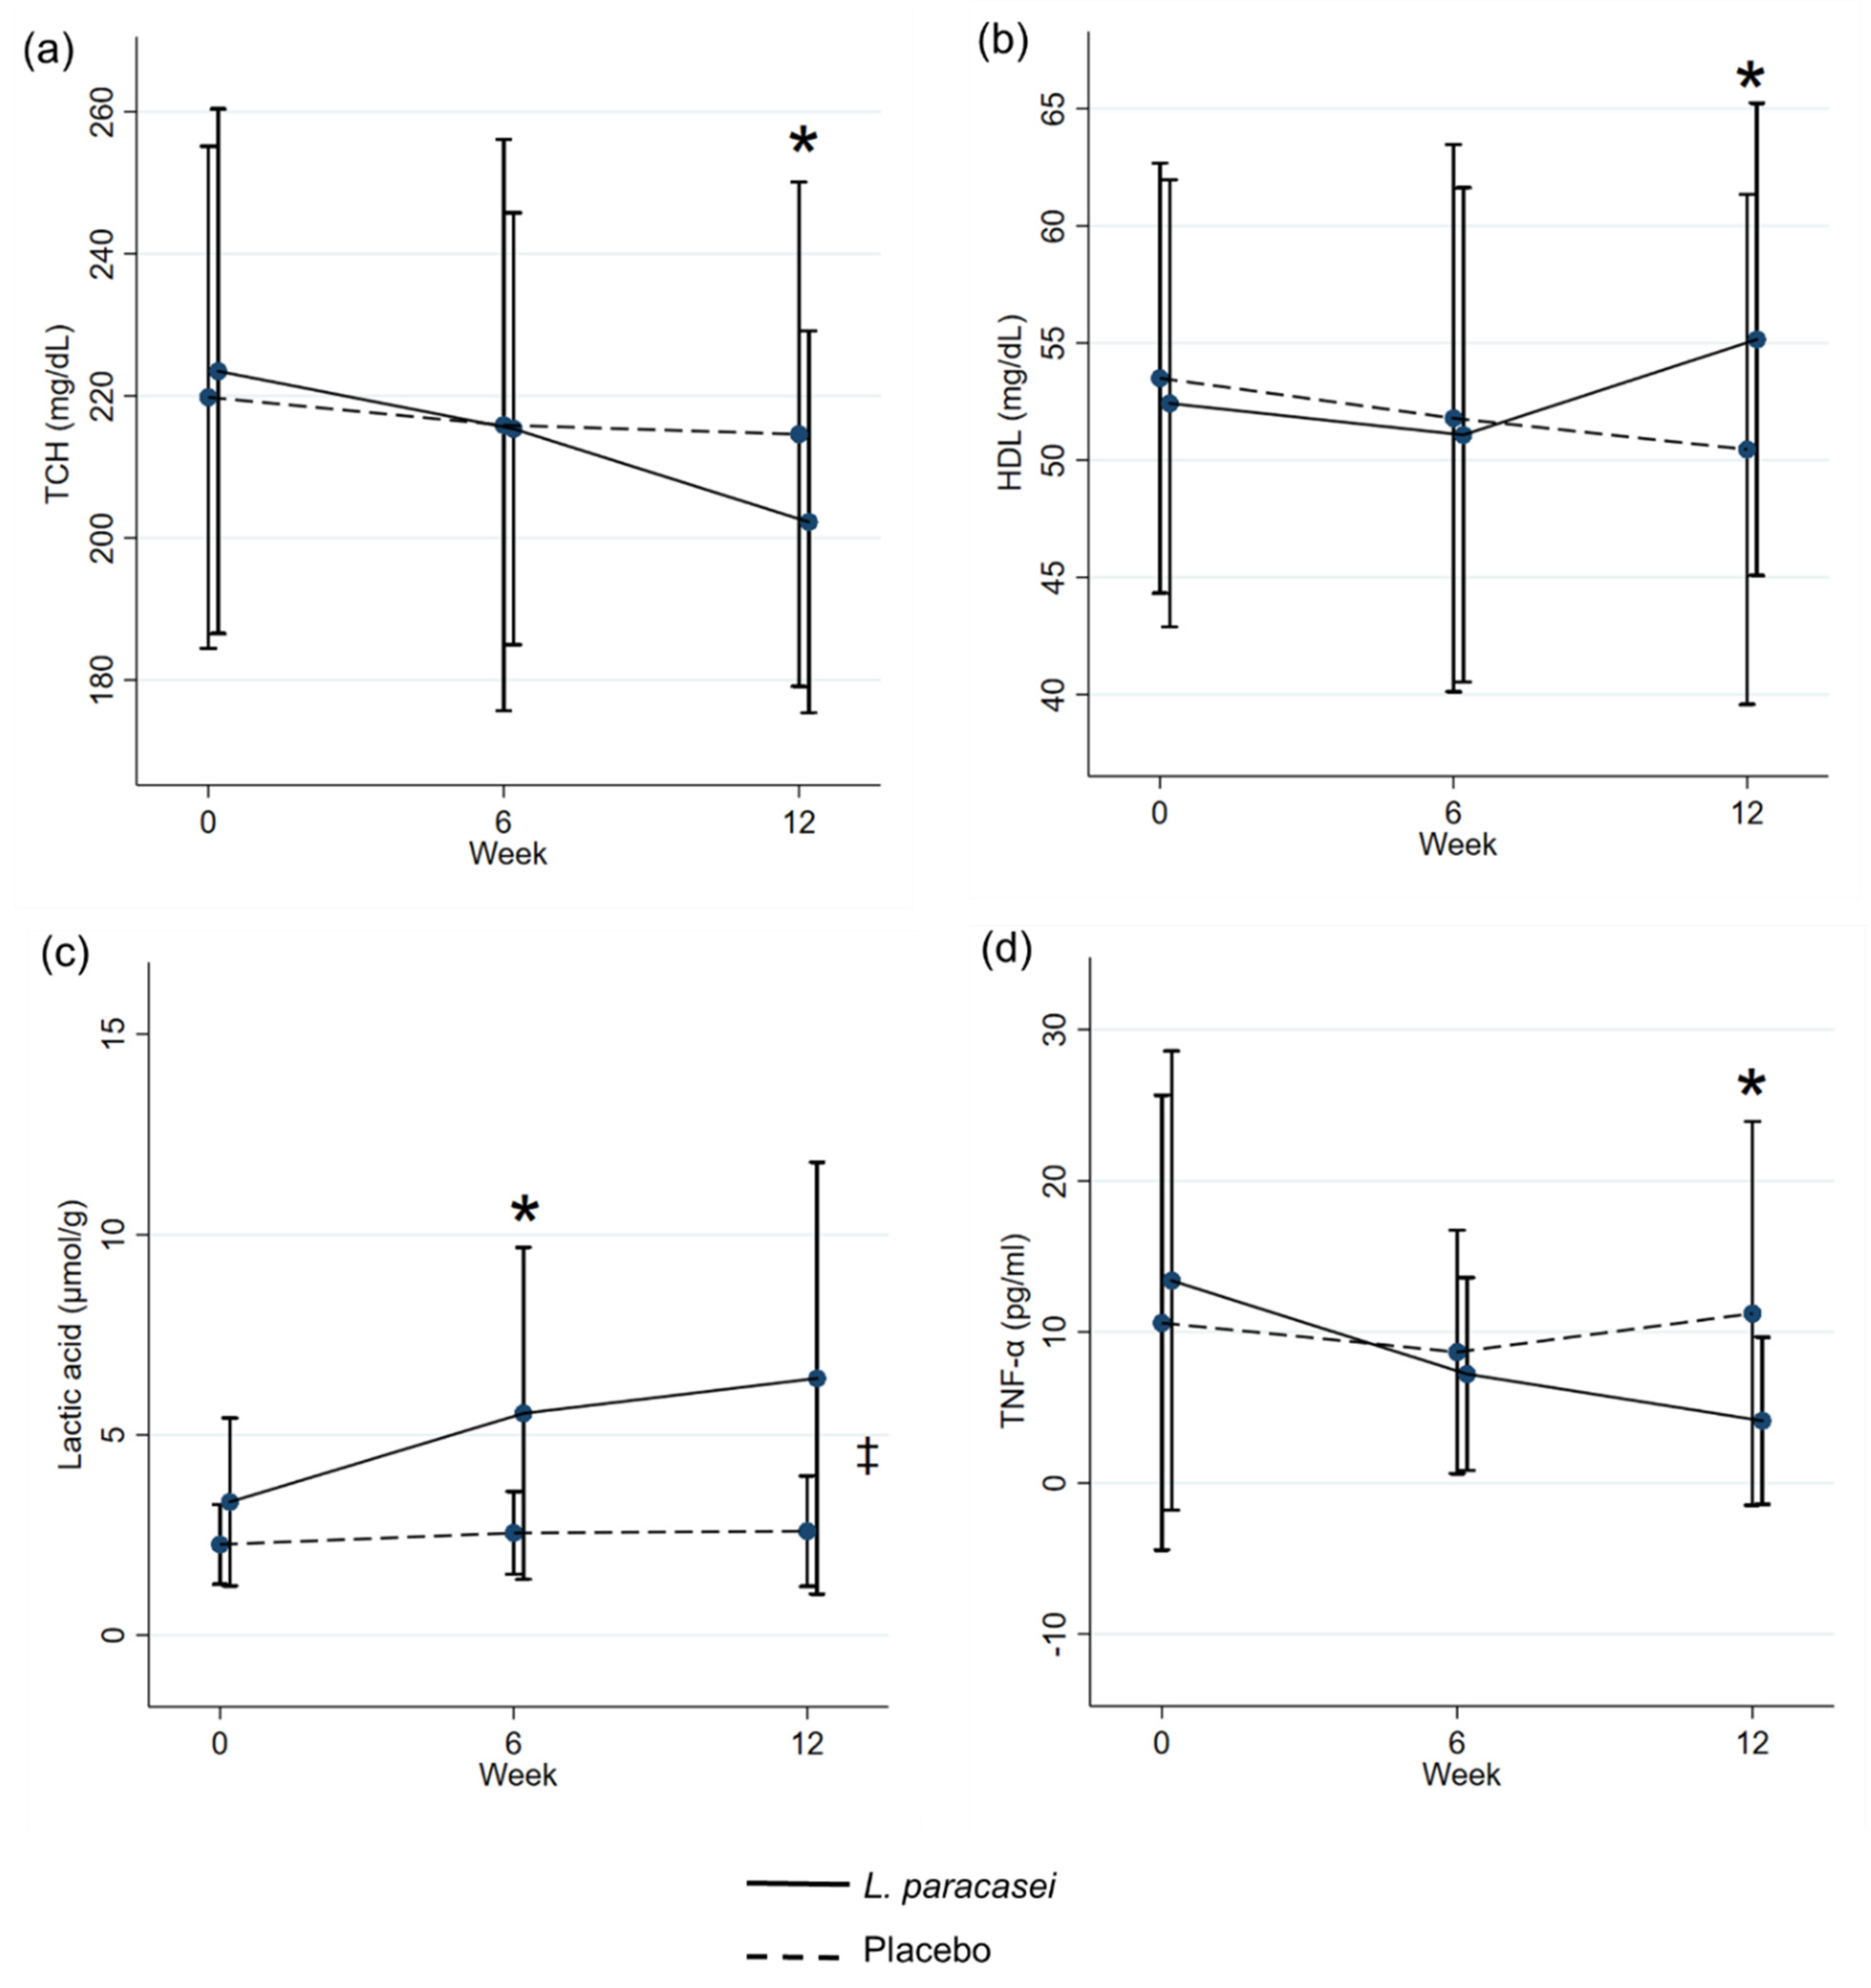
3.2. Effect of L. paracasei Supplementation on Cholesterol, Oxidative Stress, and Biomarkers at Baseline, 6 Weeks, and 12 Weeks

There were no adverse effects seen in the study subjects. In the L. paracasei supplementation group, there were significant differences within the group in terms of MDA, lactic acid, IL-10 and IFN-γ after 12 weeks of supplementation compared to the baseline. MDA was found to significantly decrease (from 0.54 ± 0.02 to 0.41 ± 0.02 µmol/mL) at the end of treatment, whereas lactic acid, IL-10 and IFN-γ were found to significantly increase (from 3.33 ± 0.41 to 6.41 ± 1.06 µmol/g; 1.11 ± 0.28 to 48.40 ± 15.09 pg/mL; and 40.52 ± 8.54 to 153.16 ± 29.92 pg/mL (p < 0.05), respectively). However, there were no significant differences in the placebo group at a different time. The changes in the within-group study parameters at different times are summarized in Table 2.
From the baseline to 6 weeks, the L. paracasei supplementation group and the placebo group showed significantly different FBS (−0.85 vs. 8.58 mg/dL; p = 0.031) and lactic acid (2.21 µmol/g vs. 0.29 µmol/g; p = 0.009) levels. From the baseline to 12 weeks of supplementation, the L. paracasei group and the placebo group showed significantly different TCH (−21.23 vs. −5.21 mg/dL; p = 0.037), HDL-C (2.73 vs. −3.04 mg/dL; p = 0.001), FBS (−4.38 vs. 6.71 mg/dL; p = 0.046) and lactic acid (3.09 vs. 0.33 µmol/g; p = 0.009) levels with 95% CI, while TAC (9.76 vs. −1.77 µmol/mL; p = 0.052), MDA (−0.13 vs. −0.07 µmol/mL; p = 0.055), and tumor necrosis factor (TNF)-α (−9.28 vs. 0.62 pg/mL; p = 0.082) were significantly different, with 90% CI. Moreover, between 6 and 12 weeks, the L. paracasei group and the placebo group showed significantly different TCH (−13.12 vs. −1.29 mg/dL; p = 0.047), HDL-C (4.08 vs. −1.33 mg/dL; p = 0.003), LDL-C (−9.92 vs. 0.16 mg/dL; p = 0.021), lactic acid (0.88 vs. 0.04 µmol/g; p = 0.013) and TNF-α (−3.10 vs. 2.55 pg/mL; p = 0.014) levels with 95% CI, whereas TAC (5.29 vs. −3.54 µmol/mL; p = 0.085), MDA (−0.06 vs. −0.03 µmol/mL; p = 0.063), LPS (−17.32 vs. −7.36 png/mL; p = 0.092), and IgA (80.69 vs. 21.62 ng/mL; p = 0.069) were significantly different with 90% CI. The changes in the study parameters between the groups at different times are summarized in Table 3.
After 6 weeks of L. paracasei, the supplementation group and the placebo group showed a significant difference in their propionic acid and LPS with 95% CI, using Gaussian regression analysis to control the independent variables, including sex, age, height, body weight, smoking, alcohol drinking, diabetes status, and the baseline of the dependent variables. The increases in propionic acid were observed with a coefficient of 3.85 (95% CI: 1.07 to 6.63). There were no significantly different LDL-C, FBS, MDA, TNF-α, and L/M ratio trends, but there were decreasing trends at 6 weeks in the L. paracasei supplementation group when compared with the placebo group. There were increasing trends in the following parameters: TAC, GSH, lactic acid, acetic acid, butyric acid, IL-10 and IgA. However, there were no significant differences in the placebo group at 6 weeks of treatment. A summary of the Gaussian regression at 6 weeks of therapy for the L. paracasei group is provided in Table 4. The LPS load was significantly (p = 0.015) varied after the probiotic intervention.
Moreover, after 12 weeks, the L. paracasei supplementation group and placebo group showed significantly different TCH, TGs, HDL-C, TAC, propionic acid, TNF-α, and LPS levels with 95% CI using Gaussian regression analysis. TCH, TGs, LPS, and TNF-α showed decreases with a coefficient of −14.41 (95% CI: −28.52 to −0.31), −28.19 (95% CI: −54.04 to −2.34), −28.32 (95% CI: −48.68 to −7.95), and −10.94 (95% CI: −21.17 to −0.71), respectively. Furthermore, HDL-C, TAC, and propionic acid displayed increases with a coefficient of 4.45 (95% CI: 0.86 to 8.05), 14.39 (95% CI: 2.04 to 26.75), and 5.45 (95% CI: 1.41 to 9.49), respectively. There were no significantly different LDL-C, FBS, MDA, TNF-α, and L/M ratio trends, but there were decreasing trends after 12 weeks of L. paracasei supplementation when compared with the placebo group. There were increasing trends in the following parameters: GSH, lactic acid, acetic acid, butyric acid, IL-10, IFN-γ, and IgA. However, there were no significant differences observed in the placebo group at the end of the treatment. A summary of the Gaussian regression analysis at the end of treatment for the L. paracasei group is provided in Table 5.
The analysis of the repeated measure mixed model regression showed significant differences between the groups in terms of lactic acid levels after 12 weeks of L. paracasei supplementation (p < 0.05). TCH, HDL, lactic acid, and TNF-α showed a significant difference between the groups at the visit. HDL and lactic acid tended to increase at the end of treatment, whereas TCH and TNF-α tended to decrease after a 12-week supplementation of L. paracasei (Figure 3).

4. Discussion

A meta-analysis of probiotic supplementation showed that hypercholesterolemia, TC, and LDL-C decreased after probiotic supplementation [23]. Similarly, the authors of [24] also reported that probiotic Lactobacilli consumption for 12 weeks reduced serum lipid levels, especially for LDL-C, and increased HDL-C significantly. The current study results of the double-blind, placebo-controlled randomized clinical trial with 1.25 × 10¹⁰ CFU/day of L. paracasei HII01 also support the notion that probiotic supplementation reduces TC, TGs, and LDL-C in adult subjects characterized by moderate hypercholesterolemia. Furthermore, their HDL-C levels significantly increased at the end of treatment compared with the placebo group. Some of the probiotics have bile salt hydrolase activity, with synthesized bile salt enzymes used to deconjugate bile salts into bile acids that are excreted with feces. The increase in bile salt synthesis results in more cholesterol as a substrate to synthesize bile salt [25].
The supplementation of L. paracasei HII01 also showed a significant decrease in MDA, a decomposition product of peroxidized polyunsaturated fatty acid involved with the decreasing of LDL. Oxidant LDL, due to the high LDL levels in the bloodstream, leads to inflammation by the release of TNF-α, the generation of foam cells to develop atherosclerosis, and cholesterol efflux [7]. Moreover, L. paracasei significantly increases GSH, the critical antioxidant in protecting the cell from oxidative stress damage [26]. According to [9], probiotics have a role in oxidative defense by scavenging hydroxyl radicals via the stimulation of various antioxidant enzymes and the production of metabolites with antioxidant capacity such as GSH. Moreover, the total antioxidant capacity (TAC) increased after the supplementation of L. paracasei HII01 compared with the baseline. The chelating of the metal ions of probiotics also affects the increase in TAC. The chelating of metal ions also assists in reducing the lipid peroxidation involved in lowering inflammation, although it is unclear what factors are responsible for this process.
Lactobacillus and Bifidobacterium are the major microorganisms that produce short-chain fatty acids (SCFAs) through the fermentation process [27]. SCFAs benefit the host by regulating colonic pH, ion transport, gene expression, the improvement of the epithelial barrier, and potent inflammatory action. The supplementation of Lactobacillus strains significantly increases the formation of butyrate and propionate [28]. Furthermore, the increase in short-chain fatty acid production is related to decreasing blood cholesterol due to disturbed reverse cholesterol transport (RCT) [29]. There are significant differences in the fecal SCFAs between the two groups of the study (receiving probiotics and receiving the placebo), i.e., acetate content was dominant over the others [30]. However, in the current study, the propionic acids showed significant differences between the two groups, whereas the lactic acids showed substantial increase after L. paracasei supplementation, as well as showing significant differences between the groups.
Probiotics produce an immunomodulatory effect by stimulating the release of cytokines—including interleukins (ILs), tumor necrosis factors (TNFs), interferons (IFNs), and chemokines—from the immune cells of the host. In an earlier study, the administration of Lactobacillus and Bifidobacterium species led to a significant increase in the modulation and regulation of immune responses through IL-10 (an anti-inflammatory cytokine) upregulation and TNF-α (a proinflammatory cytokine) downregulation [31]. There are some adverse effects of probiotics on cytokines; according to [32], after 4 weeks of supplementation of yogurt containing probiotic strains, proinflammatory IFN-γ was observed to increase. There was an increase in TNF-α and a decrease in IL-10 significantly in the yogurt supplementation group, but there were no statistical differences between the two study groups. However, the current study found that after 12 weeks of probiotic L. paracasei HII01 supplementation, IFN-γ and IL-10 increased, whereas TNF-α decreased, which is similar to the results of other studies on cytokine production.
Another immunomodulatory property of probiotics is the regulation of toxin LPS production from intestinal bacteria. A previous study demonstrated that probiotic strain administration significantly reduced the LPS concentrations in plasma [33]. Moreover, [34] reported that probiotic consumption reduced plasma LPS and inflammatory responses induced by Gram-negative bacteria. Likewise, in the current study, after 12 weeks of the supplementation of L. paracasei HII01, the LPS concentration in plasma appeared to decrease at the end of treatment, and a significant difference between the two groups was observed. Probiotics support gut microbiota to stimulate dendritic cells in order to produce proinflammatory cytokines, and they then promote macrophage/NK cells to neutralize LPS and eliminate pathogenic bacteria [35].
The health-related effects of probiotics, including the increase in IgA production and reduced chances of having a leaky gut, were observed in the current study. Immunoglobulin A has a vital role in encouraging adherence in the intestines and the survival of beneficial microorganisms. The study of probiotic Lactobacillus in a rat model on the immune system’s modulation by increasing the IgA levels in saliva showed that the IgA levels in the Lactobacillus supplementation group were significantly higher than those in the control group [36]. Likewise, [37] also reported that probiotics enhanced the body’s immune system by inducing IgA formation, macrophage activation, proinflammatory cytokines, and antioxidants. In humans, probiotics can stimulate and enhance secretory IgA production on mucosal surfaces or serum IgA in the circulation. In a probiotic consumption study of IgA concentrations, it was reported that IgA increased by approximately 10% after consuming the probiotic strains. It also supports the findings of the current research that suggest that the supplementation of probiotics increases IgA production. IgA was observed to increase after the supplementation of L. paracasei, and was significantly different to that of the placebo group.
The human intestine’s primary abilities are as follows: nutrient absorption, the provision of a barrier function, and the prevention of antigens and pathogens from entering the mucosal tissues, leading to inflammation and causing diseases. Some chronic inflammatory diseases can affect intestinal permeability, characterized by a leaky intestinal barrier, resulting in intestinal permeability. Tight junctions (TJ) are responsible for intestinal integrity [38]. Furthermore, a recent study reported that the imbalance of microbiota, especially high Gram-negative pathogenic bacteria in the intestines, could cause inflammation and induce increased intestinal permeability [39]. Lactulose mannitol ratio tests are clinically used to detect gut permeability changes due to the difference in the quantity of excreted lactulose and mannitol.
The authors of [40] reported that the L/M ratios in the treatment group were lower than those in the control group, which suggests that the treatment group’s intestinal permeability was lower than that of the control group after probiotic supplementation. Probiotics can effectively protect the intestinal barrier by reducing L/M ratios [41].
The current study also found that after 12 weeks of probiotic supplementation, the L/M ratio in the treatment group was lower than that of the control group at the end of treatment, and was decreased after the supplementation of L. paracasei when compared with the baseline.
All of the possible mechanisms of probiotics’ effects on cholesterol, oxidative stress, and biomarkers are shown in Figure 4.
The current study has some relevant limitations. The findings that the TG and LDL-C levels in the control group increased and HDL-C decreased at the end of the study may be explained by the study groups’ lack of diet control. For this reason, further diet control clinical studies are needed in order to maintain the observed positive effect of probiotic supplementation.
However, the L. paracasei HII01 study is interesting because the effect on several parameters related to hypercholesterolemia has shown positive results. Moreover, the observation that L. paracasei HII01 exerts the ability to reduce blood lipids suggests that further use to improve blood lipids might be useful.

5. Conclusions

In conclusion, L. paracasei HII01 supplementation increases HDL-C, TAC, GSH, IL-10, IFN-γ, SCFAs and IgA. It reduces TCH, LDL-C, TGs, FBS, MDA, LPS, TNF-α, and the L/M ratio, and alters the microbiota composition in moderately hypercholesterolemic Thai subjects. The present study was conducted only on 52 patients and the research results cannot to be transferred to the general population of Thai hypercholesterolemic subjects. As such, further in-depth research is required, which may aid in the development of probiotic-based food supplements to manage the hypercholesterolemic condition.

Author Contributions

Conceptualization, C.C., B.S.S., P.K. and S.S.; methodology, Y.T., N.K., S.K. and S.S.; formal analysis, Y.T., N.K., S.K., S.P., K.C. and S.S.; investigation, C.C., B.S.S., S.S. and P.S.; writing—original draft preparation, Y.T.; writing—review and editing, C.C., B.S.S., P.K.; S.S.; S.T.; K.C. and P.S.; project administration, C.C. All authors have read and agreed to the published version of the manuscript.

Funding

The Center of Excellence on Medical Biotechnology (CEMB) and Chiangmai University.

Institutional Review Board Statement

The study was conducted following the Good Clinical Practices, fully complied with the ethical guidelines of a clinical trial, and was conducted according to the Declaration of Helsinki; the Ethics Committee approved the protocol of Mae Fah Luang University (Code: REH-62151).

Informed Consent Statement

Informed consent was obtained from all of the subjects involved in the study.

Data Availability Statement

The data presented in this study are available within the article.

Acknowledgments

The authors gratefully acknowledge the Center of Excellence on Medical Biotechnology (CEMB) for the research funding support, Chiang Mai University for the research funding support, and the Brain Science and Engineering Innovation Research Group (BSEI), Mae Fah Luang University.

Conflicts of Interest

The authors declare no conflict of interest.

References

  1. Yu, X.-H.; Zhang, D.-W.; Zheng, X.-L.; Tang, C.-K. Cholesterol transport system: An integrated cholesterol transport model involved in atherosclerosis. Prog. Lipid Res. 2019, 73, 65–91. [Google Scholar] [CrossRef] [PubMed]
  2. Kumar, M.; Nagpal, R.; Kumar, R.; Hemalatha, R.; Verma, V.; Kumar, A.; Yadav, H. Cholesterol-lowering probiotics as potential biotherapeutics for metabolic diseases. Exp. Diabetes Res. 2012, 2012, 902917. [Google Scholar] [CrossRef] [PubMed] [Green Version]
  3. Houston, M. The role of nutraceutical supplements in the treatment of dyslipidemia. J. Clin. Hypertens. (Greenwich) 2012, 14, 121–132. [Google Scholar] [CrossRef]
  4. El Mashad, G.M.; ElSayed, H.M.; Nosair, N.A. Effect of vitamin C supplementation on lipid profile, serum uric acid, and ascorbic acid in children on hemodialysis. Saudi J. Kidney Dis. Transplant. 2016, 27, 1148–1154. [Google Scholar] [CrossRef] [PubMed]
  5. He, J.; Zhang, F.; Han, Y. Effect of probiotics on lipid profiles and blood pressure in patients with type 2 diabetes: A meta-analysis of RCTs. Medicine 2017, 96, e9166. [Google Scholar] [CrossRef] [PubMed]
  6. Yoshikawa, T.; Naito, Y. What is oxidative stress? Jpn. Med. Assoc. J. 2002, 45, 271–276. [Google Scholar]
  7. Balkan, J.; Öztezcan, S.; Küçük, M.; Çevikbaş, U.; Koçak-Toker, N.; Uysal, M. The effect of betaine treatment on triglyceride levels and oxidative stress in the liver of ethanol-treated guinea pigs. Exp. Toxicol. Pathol. 2004, 55, 505–509. [Google Scholar] [CrossRef]
  8. Pereira DI, A.; Gibson, G.R. Effects of Consumption of Probiotics and Prebiotics on Serum Lipid Levels in Humans. Crit. Rev. Biochem. Mol. Biol. 2002, 37, 259–281. [Google Scholar] [CrossRef]
  9. Wang, Y.; Wu, Y.; Wang, Y.; Xu, H.; Mei, X.; Yu, D.; Li, W. Antioxidant Properties of Probiotic Bacteria. Nutrients 2017, 9, 521. [Google Scholar] [CrossRef] [PubMed]
  10. Kechagia, M.; Basoulis, D.; Konstantopoulou, S.; Dimitriadi, D.; Gyftopoulou, K.; Skarmoutsou, N.; Fakiri, E.M. Health benefits of probiotics: A review. ISRN Nutr. 2013, 2013, 481651. [Google Scholar] [CrossRef] [Green Version]
  11. George Kerry, R.; Patra, J.K.; Gouda, S.; Park, Y.; Shin, H.-S.; Das, G. Benefaction of probiotics for human health: A review. J. Food Drug Anal. 2018, 26, 927–939. [Google Scholar] [CrossRef] [PubMed] [Green Version]
  12. Lalitsuradej, E.; Sirilun, S.; Chaiyasut, C.; Sittiprapaporn, P. A preliminary study on effect of lactobacillus paracasei hii01 on cortisol in fatigue subjects. In Proceedings of the 16th International Conference on Electrical Engineering/Electronics, Computer, Telecommunications and Information Technology (ECTI-CON 2019), Pattaya, Thailand, 10–13 July 2019. [Google Scholar]
  13. National Heart, Lung, and Blood Institute (NHLBI). Available online: https://www.nhlbi.nih.gov/files/docs/guidelines/atglance.pdf (accessed on 15 September 2020).
  14. Sang Gil, L.; Taoran, W.; Terrence, M.V.; Patrice, H.; Dae-Ok, K.; Sung, I.K. Validation of Analytical Methods for Plasma Total Antioxidant Capacity by Comparing with Urinary 8-Isoprostane Level. J. Microbiol. Biotechnol. 2017, 27, 388–394. [Google Scholar] [CrossRef] [Green Version]
  15. Kambayashi, Y.; Binh, N.T.; WAsakura, H.; Hibino, Y.; Hitomi, Y.; Nakamura, H.; Ogino, K. Efficient assay for total antioxidant capacity in human plasma using a 96-well microplate. J. Clin. Biochem. Nutr. 2009, 44, 46–51. [Google Scholar] [CrossRef] [PubMed] [Green Version]
  16. Zeb, A.; Ullah, F. A Simple Spectrophotometric Method for the Determination of Thiobarbituric Acid Reactive Substances in Fried Fast Foods. J. Anal. Methods Chem. 2016, 2016, 9412767. [Google Scholar] [CrossRef] [Green Version]
  17. Atasayar, S.; Orhan, H. Malondialdehyde quantification in blood plasma of tobacco smokers and non-smokers. FABAD J. Pharm. Sci. 2004, 29, 15–19. [Google Scholar]
  18. Rahman, I.; Kode, A.; Biswas, S.K. Assay for quantitative determination of glutathione and glutathione disulfide levels using enzymatic recycling method. Nat. Protoc. 2006, 1, 3159–3165. [Google Scholar] [CrossRef]
  19. Sequeira, I.R.; Lentle, R.G.; Kruger, M.C.; Hurst, R.D. Standardising the Lactulose Mannitol Test of Gut Permeability to Minimise Error and Promote Comparability. PLoS ONE 2014, 9, e99256. [Google Scholar] [CrossRef] [Green Version]
  20. Kotani, A.; Miyaguchi, Y.; Kohama, M.; Ohtsuka, T.; Shiratori, T.; Kusu, F. Determination of Short-chain Fatty Acids in Rat and Human Feces by High-Performance Liquid Chromatography with Electrochemical Detection. Anal. Sci. 2009, 25, 1007–1011. [Google Scholar] [CrossRef] [Green Version]
  21. Torii, T.; Kanemitsu, K.; Wada, T.; Itoh, S.; Kinugawa, K.; Hagiwara, A. Measurement of short-chain fatty acids in human faeces using high-performance liquid chromatography: Specimen stability. Ann. Clin. Biochem. 2010, 47, 447–452. [Google Scholar] [CrossRef]
  22. Xiao, J.Z.; Kondo, S.; Takahashi, N.; Miyaji, K.; Oshida, K.; Hiramatsu, A.; Hosono, A. Effects of Milk Products Fermented by Bifidobacterium longum on Blood Lipids in Rats and Healthy Adult Male Volunteers. J. Dairy Sci. 2003, 86, 2452–2461. [Google Scholar] [CrossRef]
  23. Agerholm-Larsen, L.; Bell, M.L.; Grunwald, G.K.; Astrup, A. The effect of a probiotic milk product on plasma cholesterol: A meta-analysis of short-term intervention studies. Eur. J. Clin. Nutr. 2000, 54, 856–860. [Google Scholar] [CrossRef] [Green Version]
  24. Rajkumar, H.; Mahmood, N.; Kumar, M.; Varikuti, S.R.; Challa, H.R.; Myakala, S.P. Effect of probiotic (VSL#3) and omega-3 on lipid profile, insulin sensitivity, inflammatory markers, and gut colonization in overweight adults: A randomized, controlled trial. Mediat. Inflamm. 2014, 2014, 348959. [Google Scholar] [CrossRef] [Green Version]
  25. Homayouni, A.; Payahoo, L.; Azizi, A. Effects of Probiotics on Lipid Profile: A Review. Am. J. Food Technol. 2012, 7, 251–265. [Google Scholar] [CrossRef]
  26. Ngamchuea, K.; Batchelor-McAuley, C.; Compton, R.G. Rapid Method for the Quantification of Reduced and Oxidized Glutathione in Human Plasma and Saliva. Anal. Chem. 2017, 89, 2901–2908. [Google Scholar] [CrossRef] [PubMed]
  27. Dayangaç, A.; Erdem, B. The Metabolic Relationships between Probiotics and Fatty Acids. Acta Phys. Pol. A 2017, 132, 816–818. [Google Scholar] [CrossRef]
  28. LeBlanc, J.G.; Chain, F.; Martín, R.; Bermúdez-Humarán, L.G.; Courau, S.; Langella, P. Beneficial effects on host energy metabolism of short-chain fatty acids and vitamins produced by commensal and probiotic bacteria. Microb. Cell Fact. 2017, 16, 79. [Google Scholar] [CrossRef] [Green Version]
  29. Granado-Serrano, A.B.; Martín-Garí, M.; Sánchez, V.; Riart Solans, M.; Berdún, R.; Ludwig, I.A.; Serrano, J.C.E. Faecal bacterial and short-chain fatty acids signature in hypercholesterolemia. Sci. Rep. 2019, 9, 1772. [Google Scholar] [CrossRef]
  30. Underwood, M.A.; Salzman, N.H.; Bennett, S.H.; Barman, M.; Mills, D.A.; Marcobal, A.; Sherman, M.P. A randomized placebo-controlled comparison of 2 prebiotic/probiotic combinations in preterm infants: Impact on weight gain, intestinal microbiota, and fecal short-chain fatty acids. J. Pediatr. Gastroenterol. Nutr. 2009, 48, 216–225. [Google Scholar] [CrossRef] [PubMed] [Green Version]
  31. Karamese, M.; Aydin, H.; Sengul, E.; Gelen, V.; Sevim, Ç.; Ustek, D.; Karakus, E. The Immunostimulatory Effect of Lactic Acid Bacteria in a Rat Model. Iran. J. Immunol. 2016, 13, 220–228. [Google Scholar]
  32. Meyer, A.; Elmadfa, I.; Herbacek, I.; Micksche, M. Probiotic, as well as conventional yogurt, can enhance the stimulated production of proinflammatory cytokines. J. Hum. Nutr. Diet. Off. J. Br. Diet. Assoc. 2007, 20, 590–598. [Google Scholar] [CrossRef]
  33. Rodes, L.; Khan, A.; Paul, A.; Coussa-Charley, M.; Marinescu, D.; Tomaro-Duchesneau, C.; Prakash, S. Effect of Probiotics Lactobacillus and Bifidobacterium on Gut-Derived Lipopolysaccharides and Inflammatory Cytokines: An In Vitro Study Using a Human Colonic Microbiota Model. J. Microbiol. Biotechnol. 2013, 23, 518–526. [Google Scholar] [CrossRef] [PubMed] [Green Version]
  34. Szulińska, M.; Łoniewski, I.; van Hemert, S.; Sobieska, M.; Bogdański, P. Dose-Dependent Effects of Multispecies Probiotic Supplementation on the Lipopolysaccharide (LPS) Level and Cardiometabolic Profile in Obese Postmenopausal Women: A 12-Week Randomized Clinical Trial. Nutrients 2018, 10, 773. [Google Scholar] [CrossRef] [PubMed] [Green Version]
  35. do Carmo, M.S.; itapary dos Santos, C.; Araújo, M.C.; Girón, J.A.; Fernandes, E.S.; Monteiro-Neto, V. Probiotics, mechanisms of action, and clinical perspectives for diarrhea management in children. Food Funct. 2018, 9, 5074–5095. [Google Scholar] [CrossRef]
  36. Hayati, M.; Herman, H.; Rezano, A. The effect of probiotic Lactobacillus casei supplementation on the secretory immunoglobulin A level in the saliva of wistar rats. Bali Med. J. 2018, 7, 727–731. [Google Scholar] [CrossRef]
  37. Wold, A.E. Immune effects of probiotics. Food Nutr. Res. 2001, 45, 76–85. [Google Scholar] [CrossRef]
  38. Ulluwishewa, D.; Anderson, R.C.; McNabb, W.C.; Moughan, P.J.; Wells, J.M.; Roy, N.C. Regulation of Tight Junction Permeability by Intestinal Bacteria and Dietary Components. J. Nutr. 2011, 141, 769–776. [Google Scholar] [CrossRef] [Green Version]
  39. Kelly, J.R.; Kennedy, P.J.; Cryan, J.F.; Dinan, T.G.; Clarke, G.; Hyland, N.P. Breaking down the barriers: The gut microbiome, intestinal permeability and stress-related psychiatric disorders. Front. Cell. Neurosci. 2015, 9, 392. [Google Scholar] [CrossRef] [Green Version]
  40. Liu, D.; Jiang, X.-Y.; Zhou, L.-S.; Song, J.-H.; Zhang, X. Effects of Probiotics on Intestinal Mucosa Barrier in Patients With Colorectal Cancer after Operation: Meta-Analysis of Randomized Controlled Trials. Medicine 2016, 95, e3342. [Google Scholar] [CrossRef]
  41. Van Hemert, S.; Verwer, J.; Schuetz, B. Clinical Studies Evaluating Effects of Probiotics on Parameters of Intestinal Barrier Function. Adv. Microbiol. 2013, 3, 212–221. [Google Scholar] [CrossRef] [Green Version]
Figure 1. The enrollment and study flowchart.
Applsci 11 04333 g001
Figure 2. The timeline of the study.
Applsci 11 04333 g002
Figure 3. Estimated means ± the standard error of the mean (mixed model repeated measures analysis with correction for differences in the baseline values). TCH (a), HDL-C (b), Lactic acid (c), and TNF-α (d). * p < 0.05 between the groups at the visit. p < 0.05 overall difference between the groups.
Applsci 11 04333 g003
Figure 4. All of the possible mechanisms of probiotics on cholesterol, oxidative stress, and biomarkers. (1) Cholesterol is synthesized into conjugated bile acids, and bile salt hydrolase enzymes from the probiotic synthesize conjugated bile acids to deconjugated bile acids, which are excreted into feces. (2) LDL-C is modified via lipoprotein modification into oxidized LDL and reacted with NADPH oxidase to ROS, which induces oxidative stress and leads to inflammation. The releasing of TNF-α generates foam cells and increases the cholesterol efflux. Probiotics can chelate metal ions from ROS, affect the reduction of oxidative stress, decrease inflammation, and release TNF-α; as a result, the cholesterol efflux into the bloodstream is reduced. (3) Probiotics promote healthy gut microbiota growth and stimulate the dendritic cells to produce pro- and anti-inflammatory cytokines (IFN-γ, IL-10), which affect the immune system in the production and releasing of macrophage/NK cells, and IgA as a defender with pathogenic/gram-negative bacteria. Moreover, probiotics can digest soluble fiber, synthesize short-chain fatty acids that improve the epithelial barrier, and reduce fat accumulation.
Applsci 11 04333 g004
Table 1. The basic demographic information of the study subjects.
ParametersL. paracasei Group (N = 26)Placebo Group (N = 26)p-Value
Male, n (%)9 (34.6)8 (30.8)1.000
Female, n (%)17 (65.4)18 (69.2)
Age (years)50.81 ± 3.0154.15 ± 2.340.385
Weight, kg68.63 ± 3.2567.32 ± 2.880.764
Height, cm158.54 ± 1.81155.41 ± 1.570.196
Body mass index, kg/m227.24 ± 5.7627.43 ± 5.800.905
Diabetes, n (%)2 (8.0)6 (23.08)0.248
Smoking, n (%)1 (3.9)2 (7.7)1.000
Alcohol drinking, n (%)6 (23.1)2 (7.7)0.248
The p-value was at a 95% Confidence interval. The proportion was analyzed using an exact probability test, and the continuous demographic data were analyzed using a t-test.
Table 2. Studied parameters within each group at different times, expressed as the mean ± SE.
ParametersL. paracasei (N = 26)Placebo (N = 26)
Baseline6 Weeks12 WeeksBaseline6 Weeks12 Weeks
Total cholesterol (mg/dL)223.46 ± 7.24215.35 ± 5.97202.23 ± 5.27219.79 ± 7.21215.88 ± 8.21214.58 ± 7.25
Triglycerides (mg/dL)143.04 ± 14.73140.92 ± 12.89137.62 ± 11.92140.50 ± 14.05143.54 ± 13.54159.33 ± 14.51
HDL-cholesterol (mg/dL)52.42 ± 1.8751.08 ± 2.0755.15 ± 1.9853.50 ± 1.8751.79 ± 2.3850.46 ± 2.22
LDL-cholesterol (mg/dL)141.80 ± 6.99140.61 ± 8.34130.69 ± 7.27142.19 ± 7.17136.55 ± 5.81136.71 ± 6.64
FBS (mg/dL)99.31 ± 7.5098.46 ± 6.0394.92 ± 5.0495.21 ± 5.24103.79 ± 4.68101.92 ± 5.89
TAC (µmol/mL)51.74 ± 5.4256.20 ± 5.5761.50 ± 6.6948.69 ± 3.7150.46 ± 4.4446.92 ± 4.09
MDA (µmol/mL)0.54 ± 0.02 a0.47 ± 0.02 ab0.41 ± 0.02 b0.58 ± 0.010.54 ± 0.020.51 ± 0.03
GSH (µg/mL)125.42 ± 7.38135.67 ± 7.21150.34 ± 10.98131.65 ± 5.51132.18 ± 6.39143.62 ± 8.64
Lactic acid (µmol/g)3.33 ± 0.41 a5.54 ± 0.81 ab6.41 ± 1.06 b2.26 ± 0.202.55 ± 0.212.60 ± 0.28
Acetic acid (µmol/g)3.48 ± 0.324.50 ± 0.626.38 ± 1.423.38 ± 0.213.61 ± 0.194.19 ± 0.29
Butyric acid (µmol/g)5.21 ± 0.486.32 ± 0.797.59 ± 1.444.61 ± 0.644.68 ± 0.474.94 ± 0.66
Propionic acid (µmol/g)16.55 ± 1.5017.44 ± 1.2218.22 ± 1.4413.87 ± 1.2912.66 ± 1.0112.78 ± 1.16
IL-10 (pg/mL)1.11 ± 0.28 a22.48 ± 8.83 ab48.40 ± 15.09 b3.17 ± 1.1218.41 ± 8.3025.13 ± 11.83
IFN-γ (pg/mL)40.52 ± 8.54 a63.22 ± 10.90 a153.16 ± 29.92 b45.77 ± 25.1767.11 ± 16.1699.04 ± 41.95
TNF-α (pg/mL)13.40 ± 5.067.22 ± 2.134.12 ± 1.8410.60 ± 6.148.67 ± 3.2911.22 ± 5.18
LPS (pg/mL)122.95 ± 17.8194.18 ± 12.3676.86 ± 9.67123.86 ± 17.38108.12 ± 14.31100.76 ± 13.53
IgA (ng/mL)403.05 ± 41.52464.24 ± 59.53544.93 ± 80.76406.92 ± 50.67456.74 ± 58.31478.36 ± 61.45
L/M ratio0.16 ± 0.030.12 ± 0.020.09 ± 0.010.16 ± 0.020.13 ± 0.020.09 ± 0.01
The p-value was at a 95% confidence interval. abc = different letters show the significant differences within each group at different times. HDL = High-Density Lipoprotein; LDL = Low-Density Lipoprotein; FBS = Fasting Blood Sugar; TAC = Total Antioxidant Capacity; MDA = Malondialdehyde; GSH = Glutathione Reduced; IL = Interleukin; IFN-γ = Interferon gamma; TNF-α = Tumor Necrosis Factor alpha; LPS = Lipopolysaccharide; IgA = Immunoglobulin A; L/M = Lactulose/Mannitol Ratio.
Table 3. Comparison of the changes in the studied parameters between the groups at different times, expressed as the mean difference.
ParametersBaseline—6 Weeksp-ValueBaseline—12 Weeksp-Value6 Weeks—12 Weeksp-Value
L. paracasei
(N = 26)
Placebo
(N = 26)
L. paracasei
(N = 26)
Placebo
(N = 26)
L. paracasei
(N = 26)
Placebo
(N = 26)
Total cholesterol (mg/dL)−8.12−3.920.553−21.23−5.210.037 *−13.12−1.290.047 *
Triglycerides (mg/dL)−2.123.040.633−5.4218.830.091−3.3115.790.170
HDL-cholesterol (mg/dL)−1.35−1.710.8512.73−3.040.001 *4.08−1.330.003 *
LDL-cholesterol (mg/dL)−1.19−5.640.515−11.11−5.480.422−9.920.160.021 *
FBS (mg/dL)−0.858.580.031 *−4.386.710.046 *−3.54−1.880.611
TAC (µmol/mL)4.461.770.4389.76−1.770.0525.29−3.540.085
MDA (µmol/mL)−0.07−0.040.155−0.13−0.070.055−0.06−0.030.063
GSH (µg/mL)10.250.530.37224.9211.970.41714.6711.440.739
Lactic acid (µmol/g)2.210.290.009 *3.090.330.009 *0.880.040.013 *
Acetic acid (µmol/g)1.040.230.1522.920.810.1531.880.580.158
Butyric acid (µmol/g)1.110.070.1732.390.320.2281.280.250.299
Propionic acid (µmol/g)0.89−1.210.2021.67−1.090.2440.770.120.399
IL-10 (pg/mL)21.3715.240.63038.0421.960.43416.676.720.232
IFN-γ (pg/mL)22.6921.340.947112.6453.270.29289.9531.920.184
TNF-α (pg/mL)−6.19−1.930.402−9.280.620.082−3.102.550.014 *
LPS (pg/mL)−28.77−15.740.169−46.09−23.100.126−17.32−7.360.092
IgA (ng/mL)61.1849.820.731141.8871.440.24180.6921.620.069
L/M ratio−0.04−0.030.745−0.07−0.060.745−0.04−0.030.745
The p-value was at a 95% confidence interval. * = significant difference (p less than 0.05); HDL = High-Density Lipoprotein; LDL = Low-Density Lipoprotein; FBS = Fasting Blood Sugar; TAC = Total Antioxidant Capacity; MDA = Malondialdehyde; GSH = Glutathione Reduced; IL = Interleukin; IFN-γ = Interferon gamma; TNF-α = Tumor Necrosis Factor alpha; LPS = Lipopolysaccharide; IgA = Immunoglobulin A; L/M = Lactulose/Mannitol Ratio.
Table 4. Gaussian regression analysis summary at week 6 of treatment for the L. paracasei group.
ParameterCoefficient95% CIp-Value
Total cholesterol (mg/dL)−6.18(−21.60 to 9.23)0.422
Triglycerides (mg/dL)−10.02(−32.82 to 12.77)0.380
HDL-cholesterol (mg/dL)−0.98(−5.39 to 3.42)0.655
LDL-cholesterol (mg/dL)3.15(−11.99 to 18.28)0.677
FBS (mg/dL)−5.78(−13.82 to 2.25)0.154
TAC (µmol/mL)3.77(−3.91 to 11.44)0.327
MDA (µmol/mL)−0.03(−0.08 to 0.02)0.295
GSH (µg/mL)8.98(−11.18 to 29.13)0.373
Lactic acid (µmol/g)1.23(−0.35 to 2.81)0.124
Acetic acid (µmol/g)0.28(−0.90 to 1.47)0.629
Butyric acid (µmol/g)0.69(−0.89 to 2.27)0.384
Propionic acid (µmol/g)3.85(1.07 to 6.63)0.008 *
IL-10 (pg/mL)30.98(−104.94 to 166.89)0.212
IFN-γ (pg/mL)−0.43(−43.51 to 42.66)0.983
TNF-α (pg/mL)−2.68(−9.44 to 4.08)0.380
LPS (pg/mL)−16.49(−29.63 to −3.36)0.015 *
IgA (ng/mL)6.66(−59.90 to 73.22)0.841
L/M ratio−0.01(−0.02 to 0.01)0.519
Compared with the placebo group at week 6. The p-value was at a 95% confidence interval. * = significant difference (p less than 0.05); HDL = High-Density Lipoprotein; LDL = Low-Density Lipoprotein; FBS = Fasting Blood Sugar; TAC = Total Antioxidant Capacity; MDA = Malondialdehyde; GSH = Glutathione Reduced; IL = Interleukin; IFN-γ = Interferon gamma; TNF-α = Tumor Necrosis Factor alpha; LPS = Lipopolysaccharide; IgA = Immunoglobulin A; L/M = Lactulose/Mannitol Ratio.
Table 5. Gaussian regression analysis summary at the end of treatment for the L. paracasei group.
ParameterCoefficient95% CIp-Value
Total cholesterol (mg/dL)−14.41(−28.52 to −0.31)0.045 *
Triglycerides (mg/dL)−28.19(−54.04 to −2.34)0.033 *
HDL-cholesterol (mg/dL)4.45(0.86 to 8.05)0.016 *
LDL-cholesterol (mg/dL)−7.14(−22.44 to 8.17)0.352
FBS (mg/dL)−4.30(−13.89 to 5.29)0.370
TAC (µmol/mL)14.39(2.04 to 26.75)0.024 *
MDA (µmol/mL)−0.05(−0.12 to 0.02)0.142
GSH (µg/mL)16.27(−14.41 to 46.94)0.290
Lactic acid (µmol/g)1.83(−0.44 to 4.09)0.111
Acetic acid (µmol/g)0.77(−2.33 to 3.86)0.619
Butyric acid (µmol/g)1.53(−1.90 to 4.96)0.372
Propionic acid (µmol/g)5.45(1.41 to 9.49)0.010 *
IL-10 (pg/mL)46.09(−242.48 to 334.65)0.291
IFN-γ (pg/mL)33.12(−86.70 to 152.94)0.565
TNF-α (pg/mL)−10.94(−21.17 to −0.71)0.039 *
LPS (pg/mL)−28.32(−48.68 to −7.95)0.008 *
IgA (ng/mL)42.31(−55.24 to 139.87)0.386
L/M ratio−0.01(−0.04 to 0.02)0.519
Compared with the placebo group at week 12. The p-value was at a 95% confidence interval. * = significant difference (p less than 0.05); HDL = High-Density Lipoprotein; LDL = Low-Density Lipoprotein; FBS = Fasting Blood Sugar; TAC = Total Antioxidant Capacity; MDA = Malondialdehyde; GSH = Glutathione Reduced; IL = Interleukin; IFN-γ = Interferon gamma; TNF-α = Tumor Necrosis Factor alpha; LPS = Lipopolysaccharide; IgA = Immunoglobulin A; L/M = Lactulose/Mannitol Ratio.
Publisher’s Note: MDPI stays neutral with regard to jurisdictional claims in published maps and institutional affiliations.

