Abstract
Our previous studies demonstrated that it is possible to perform the classification of both simulated pressed and actual vocally fatigued voice productions versus vocally healthy productions through the pattern recognition of sEMG signals obtained from subjects’ anterior neck. In these studies, the commonly accepted Vocal Fatigue Index factor 1 (VFI-1) was used for the ground-truth labeling of normal versus vocally fatigued voice productions. Through recent experiments, other factors with potential effects on classification were also studied, such as sEMG signal normalization, and data imbalance—i.e., the large difference between the number of vocally healthy subjects and of those with vocal fatigue. Therefore, in this paper, we present a much improved classification method derived from an extensive study of the effects of such extrinsic factors on the classification of vocal fatigue. The study was performed on a large number of sEMG signals from 88 vocally healthy and fatigued subjects including student teachers and teachers and it led to important conclusions on how to optimize a machine learning approach for the early detection of vocal fatigue.
1. Introduction
Vocal fatigue is a leading vocal symptom among teachers that, if evolving into a chronic voice disorder, can threaten a teacher’s career [1]. Teachers with a history of voice problems as student teachers and early career teachers are at the highest risk of developing a voice disorder [2,3]. However, the detection of vocal fatigue is not straightforward as there are no agreed upon markers of vocal fatigue during laryngeal endoscopic exams [4]. Moreover, if there were any, they may be elusive outside the teaching context that represents the vocal demand scenario. To fill a gap in the assessment of vocal fatigue, the Vocal Fatigue Index (VFI) [5] has been developed to determine self-reported levels of vocal fatigue in three factors related to tiredness of voice and the avoidance of voice use, physical discomfort with voice use, and the improvement of symptoms with rest. Vocal fatigue is related to perceived vocal effort and possible laryngeal muscular and/or tissue fatigue [5].
Surface electromyography (sEMG) is a noninvasive method to measure muscle activity in extralaryngeal muscles. It has been applied to various muscle groups for fatigue detection [6] such as trunk muscles [7], wrist muscles [8] and thigh muscles [9]. In addition, it can also be used to better understand muscle tension dysphonia—a voice disorder related to excessive or dysregulated laryngeal muscular function [10]. Studying extralaryngeal muscular activity in conjunction with VFI scores, specifically comparing repeated voice productions of those who score low or high on the VFI factor 1 (VFI-1), is a step toward quantifying vocal fatigue (decline in the function that influences task performance [11]) for the purpose of early detection.
Our first study on voice analysis using sEMG [12] employed a newly developed hierarchical approach based on the Guided Under-Determined Source Signal Separation (GUSSS) ratios [13] to classify what was referred to as vocal gestures. The study used four sEMG channels to collect signals from the anterior neck, but it was performed on a single test subject. As a result, the system achieved accuracy in classifying six voice gestures. In our following study [14], the same classification system was applied to a larger set of voice gestures including simulated pressed vowel productions and normal productions (/a/, /u/, and /i/). The approach was tested on ten vocally healthy subjects and achieved an overall accuracy of for classifying ten distinct gestures and for detecting normal and simulated pressed vowel productions. More recently, in [15], we continued this line of research and collected data on 37 test subjects divided into two groups labeled: vocally healthy and vocally fatigued, according to self-reported VFI-1 scores—VFI-1 is the first factor of the Vocal Fatigue Index: tiredness of voice and avoidance of voice use [5]. Our initial approach using GUSSS was improved by using five additional sEMG features. The results in the classification of healthy and fatigued voice productions reached accuracy under intra-subject testing conditions. For the same classification, but under inter-subject conditions, the overall accuracy was . Despite the good results in accuracy, this latest study pointed to potential concerns regarding data imbalance, as indicated by the low sensitivity achieved of .
Therefore, in this paper, we performed an extensive investigation of the challenges, as well as improvements in our approach to the classification of vocal fatigue using a substantially larger dataset, expanding the data set in [15] from 37 to 88. The overarching aim was to establish a reference dataset of extralaryngeal activity to determine the validity and reliability of pattern recognition of sEMG signals for detecting vocal fatigue. In that sense, we first explored the benefits of sEMG signal normalization by utilizing skinfold thickness and maximum voluntary contraction (MVC) trials. We then addressed the problem of data imbalance to improve the classification of vocal fatigue. Finally, we examined our classification experiments with an increased total sample size to address how to achieve better generalization in order to be clinically adoptable.
2. Experiment Setup
This section describes the subject characteristics, data collection protocol, and system setup used in this study, as illustrated in Figure 1. The equipment was installed in a soundproof booth (IAC Acoustics, North Aurora, IL, USA) and included: (1) a base station and four wireless Trigno™ mini sEMG sensors with a bandwidth of 20 Hz to 450 Hz (Delsys, Natick, MA, USA); (2) a head-worn microphone (AKG, Model C520, Vienna, Austria); (3) an audio interface (Scarlett 2i2, Focusrite, High Wycombe, UK); and (4) a data acquisition device (PowerLab 16/35, ADInstruments, Dunedin, New Zealand), which performed the synchronized sampling of audio and sEMG signals using LabChart v. 8.1.10 for MS Windows. The sampling rate was set to 4 kHz for the sEMG signals and 20 kHz for audio, both with 16-bit quantization. In addition, audio signals were collected using the software Audacity(R)© v. 2.1.1 for recording and editing, at a sampling rate of 44.1 kHz and 16-bit quantization. In this study, we focused on classification using only the sEMG data for vowel productions, but the audio signals were important to determine the sEMG ROI’s, as explained subsequently.

Figure 1.
System setup for data collection showing the flow of signals through the equipment.
2.1. Subject Characteristics
The study was conducted on 92 female subjects, one of which was withdrawn because of cold symptoms and three had to be excluded due to technical problems and/or difficulty with the sensor placement/adherence during data collection. Only female subjects between the ages of 21 and 39 years were included who were native speakers of English. The average age (standard deviation) for the 88 subjects was 24.7 (4.5) years. Subjects had to be in good general health with no acute or chronic upper respiratory infection or pulmonary disease (including allergies, laryngopharyngeal reflux disease, or asthma that affected voice at time of participation). They were excluded if they smoked within the past five years or failed a hearing screening in one or both ears at 1 kHz, 2 kHz, and 4 kHz at 20 db HL. Subjects did not report a current or past voice disorder nor therapy, no laryngeal trauma or surgery, and had normal mid-membranous vocal fold closure during comfortable pitch and loudness based on laryngeal videostroboscopy performed by a certified speech–language pathologist (M.D.). With regard to the wireless sensors, subjects could not be allergic to silver or have any metal devices of any kind implanted in their body.
To be eligible for the study, controls had to score on the VFI-1 [5]) while early career teachers (within their first 10 years of teaching experience) had to score on the VFI-1 during the pre-screening. For study 2 (subjects 62–92), student teachers without vocal fatigue were recruited as well and were tested twice throughout the course of the semester. Two-time testing during study 2 also applied to any teachers with vocal fatigue. The VFI-1 scores from the day of the experiment were used as the reference for assigning vocally healthy and vocally fatigued labels.
2.2. Data Collection Protocol
During the experiments, subjects filled out voice and personality questionnaires and completed standard clinical acoustic and aerodynamic vocal function testing. Then, during study 1, the subjects received training by a certified speech–language pathologist to produce vowels with a pressed voice, as described in detail in [14]. In essence, the subjects were instructed to produce vowels while restricting airflow almost as if pushing out the sound. Performance was validated with airflow feedback using the Phonatory Aerodynamic System (Model 6600, KayPENTAX, Lincoln Park, NJ, USA). Then, a caliper (Lange Skinfold Caliper, Beta Technology, Cambridge, MD, USA) was used to measure subjects’ skin-fold thickness overlying the submental and infrahyoid muscle groups where electrodes were placed: three recordings per site were averaged. Figure 2 shows the electrode placement and the corresponding muscle groups.
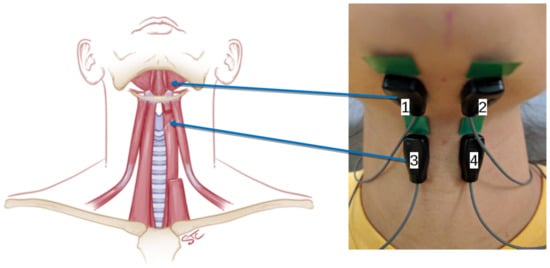
Figure 2.
Electrode placement used in this research: top pair of electrodes targeted the suprahyoid muscle group, and the bottom pair, the infrahyoid muscle group.
Each subject produced three sets of syllables (uniform utterances); a series of normal and simulated pressed voice gestures (vowels); two sentences (for future relative fundamental frequency analysis similar to syllables, [16]); and two types of non-speech gestures (throat clear and cough). Finally, each subject was asked to press their chin on a dynamometer (Chatillon, Model LG-050 with curved compression fixture SPK-FMG-142, Ametek, Largo, FL, USA) to collect maximum voluntary contraction (100% MVC) and submaximal voluntary contraction data (50% MVC) with 1 min rest intervals between three trials per MVC condition. The tasks performed, which were ordered from least to most fatiguing, are detailed in Table 1. Subjects in study 2 did not complete the simulated pressed phonations and non-speech gestures. Each subject took approximately 1.5–2 h to complete the entire experiment, with the voice and speech production portions taking the longest (approximately 30–45 min) due to 55 repetitions.

Table 1.
The complete sequence of utterances, their repetitions and durations for sEMG and acoustic data collection. Subjects in study 2 did not complete their simulated pressed phonations and non-speech gestures.
3. Classification Method
The steps taken by the classification system used in this study are summarized in Figure 3. The ROIs for the sEMG signals were determined using a window detection algorithm applied to the audio signals (top portion of Figure 3). Then, the system extracted seven different time-domain features from the observed sEMG ROIs, in addition to the GUSSS ratios [13], which measure the degree of presence of previously learned sEMG patterns within the observed sEMG signal. Then, a support vector machine (SVM) was employed for classification due to its elevated performance in non-linearly separable 2-class problems. The remaining steps of the system, such as signal normalization and imbalanced data training, are also represented in Figure 3 and will be further discussed in Section 4.
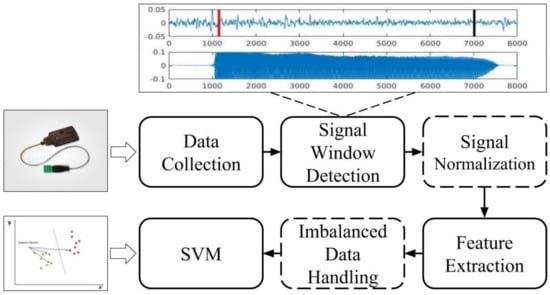
Figure 3.
The pipeline for the classification experiments.
3.1. Signal Window Detection
The algorithm for sEMG ROI detection—depicted in the top portion of Figure 3—consisted of computing statistics on audio signal amplitudes over 75 ms moving windows. Then, the amplitude mean (m) and standard deviation () were used to define a threshold for voice (and hence sEMG) activity given by: , where was a sensitivity adjustment for the detection among different subjects. The actual starting and ending points of the ROI were automatically shifted forward and backward, respectively, by 100 ms in order to eliminate muscle pre-activation and post-relaxation due to jaw movements.
3.2. Feature Set
The list of time-domain features used in this study and their definitions were already explained in detail in our previous work [15] and will be only briefly explained below. However, it is important to stress here that those features led to a 48-dimension vector to represent each sampled voice production, for a total of 14,153 vectors. The subsets of sample vectors used for training, validating and testing as well as the results obtained by the SVM classifier will be presented in Section 4. Finally, each sample vector consisted of the following features.
3.2.1. GUSSS Ratio
In our previous work [13,14], we developed an effective and robust feature, named the GUSSS ratio, for recognizing sEMG patterns, which was then employed to detect simulated vocal dysfunction. The basic idea in GUSSS (Guided Under-Determined Source Signal Separation) is to identify a previously learned signature representing an entire class of patterns as it may be embedded in an observed sEMG source signal. In fact, the GUSSS method can measure the degree of presence of each signature in the observed source signal by successively injecting the signatures into the same source signal and computing a set of ratios. The ratios are a measurement of the statistical independence between the sought signature and the source signal. For example, if the classification problem involves c classes, the algorithm obtains an equal number of ratios , each corresponding to the degree of independence of signature , representing class i, of the source signal. Indeed, if the source signal contains the signature for class i, the ratio is expected to be the smallest one among all other ratios, indicating the statistical dependency of the source signal and the class i.
As already mentioned, the GUSSS ratio has been a robust and accurate feature in all of our previous work, and it was once again employed in this study.
3.2.2. Other Features
In addition to the GUSSS ratio (GR, with one ratio per class), seven other features were used in this study. These features are explained in greater detail in [15], but also in other papers in the literature [17,18,19,20,21,22]. These features were: (1) mean absolute value (MAV, one dimension); (2) zero crossings (ZC, one dimension); (3) slope sign changes (SSC, one dimension); (4) waveform length (WL, one dimension); (5) Willison amplitude (WA, one dimension); (6) root mean square (RMS, one dimension); and finally (7) the coefficients of a fourth-order auto regressive model (AR, four dimensions) were used for robustness with respect to electrode placement [22]. This set of 12 features was extracted from all four sEMG channels (Figure 2) for a total of 48 dimensions in the feature vector.
4. Experiments
The first two experiments performed expanded on the tests done in [12,14], this time using a dataset with 57 (study 1, expanding the dataset in [15]) subjects who performed the complete sequence of the data collection protocol. The goal here was to confirm our previous findings using a larger dataset. Both experiments consisted of classifying distinct groups of voice gestures as normal or simulated pressed productions, under the intra-subject constraint.
For the first experiment, we used all vowels as individual gestures: i.e., /a/, /u/, and /i/; each produced under normal or simulated pressed conditions. Thus, a total of six classes were created, each with 50–55 valid samples due to a few occasional misarticulations or misses. The classification results are shown in the confusion matrix in Figure 4. The confusion matrix was arranged so that the normal and corresponding simulated pressed gestures are next to each other—i.e., the indices (row and column) of the matrix correspond to: (1) /a/ normal; (2) /a/ pressed; (3) /u/ normal; (4) /u/ pressed; (5) /i/ normal; and (6) /i/ pressed. Hence, the reader should notice that error in the amount of about 5% of the cases relates to the confusion between the normal and their corresponding simulated pressed vowels—i.e., six of the second-diagonal elements with indices of (1,2) or (2,1); (3,4) or (4,3); and (5,6) or (6,5). The remaining approximate 10% of the error is spread through the remaining elements on each side (upper and lower halves) of the confusion matrix.
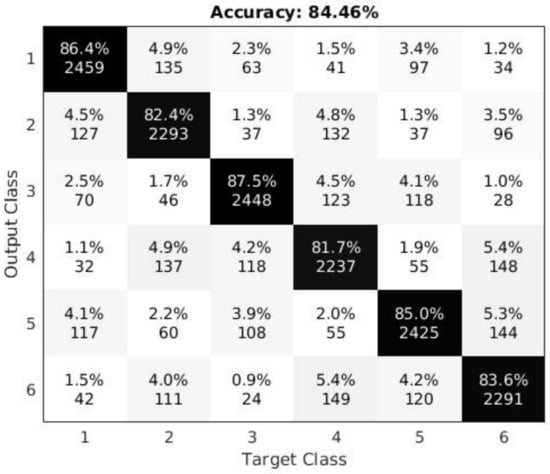
Figure 4.
Confusion matrix for all six vowel gestures (three normal and three simulated pressed) computed over all test subjects and under the intra-subject constraint. The entries in the table contain the percentages (top) and the actual number of samples detected (bottom). The numbers on the axes correspond to: (1) /a/ normal; (2) /a/ pressed; (3) /u/ normal; (4) /u/ pressed; (5) /i/ normal; and (6) /i/ pressed.
For the second test, the entire set of normal vowel productions or simulated pressed vowel productions were assigned to one of two classes: Negative and Positive, respectively. Each subject provided a total number of samples that varied between 108 and 165 for the Positive class, and between 55 and 165 for the Negative class. The test subjects were tested separately (i.e., intra-subject condition); their combined classification outcomes were averaged; and the results were shown in Table 2.
Table 2.
Confusion matrix for Positive vs. Negative detection of simulated fatigue (pressed vowels) among 57 test subjects under the intra-subject constraint.
As Figure 4 and Table 2 indicate, the overall accuracy of 84% for all six classes (first test) and 90% for two classes (second test) confirm the conclusions in [12,14]. That is, (1) distinguishable sEMG patterns do emerge from individual voice gestures (vowels) measured from subjects’ anterior necks; and similarly, (2) distinguishable sEMG patterns also emerge from simulated pressed voice gestures as a representation of vocal effort or strain. These conclusions led to the assumption that it could also be possible to distinguish normal vowel gestures from individuals without self-reported vocal fatigue from “real” vocally fatigued vowel gestures produced by individuals who actually reported vocal fatigue. Thus, the following experiments aimed to confirm this assumption.
4.1. Classifying Vowel Productions Based on Self-Reported VFI-1 Scores
As indicated above, the goal of this experiment was to classify sEMG signals during vowel productions from subjects with self-reported vocal fatigue as a representation of real-life vocal fatigue. This experiment included a much larger data set of 88 subjects that included data from study 1 and study 2. Study 2 did not require subjects to simulate pressed phonation nor produce non-speech gestures. Furthermore, the challenge was to perform this classification under the inter-subject constraint. That is, for the previous cases, the tests were performed under the more typical sample-based cross-validation, where random samples from the entire pool are set apart for testing. Instead, for this experiment, we used a leave-one-out (LOO) approach, where if N was the number of vocally healthy subjects and M the number of vocally fatigued subjects, a total of subjects were successively selected for training and validation, while the subject left-out was used for testing. The only question remaining was that of how to separate the two groups of N vocally healthy and M vocally fatigued subjects.
According to [5], the mean (standard deviation) of VFI-1 score for patients with dysphonia was 24.47 (9.76) and for vocally healthy individuals, this was 5.16 (4.58). Thus, one approach would be to derive two boundaries, VFI-1 ⩾ 15 (or ) for vocal fatigue and VFI-1 ⩽ 10 (or ) for normal voice. However, these two boundaries would have left subjects with scores between 10 and 15 in a “gray area” of VFI-1 scores investigated. Moreover, for the early detection of vocal fatigue, it is very important that the subjects in “gray area” be taken into consideration. Thus, we initially arbitrarily decided to use a VFI-1 score of 10 as the single threshold separating the two groups of test subjects. This threshold of 10 resulted in 26 vocally fatigued (23 teachers) and 62 vocally healthy subjects (14 teachers) in the dataset. In terms of the total number of samples, there were 4174 vowel productions from those with known vocal fatigue (positive samples) and 9979 normal vowel productions (negative samples). The results of the LOO classification are shown in Table 3.
Table 3.
Confusion matrix for positive vs. negative detection of vowel productions based on self-reported VFI-1 scores among 88 test subjects using leave-one-out cross-validation.
Table 3 shows the validation results which achieved an accuracy of . This high accuracy in validation indicated that there was a clear distinction between the samples and the classifier was very successful in discriminating the two classes. However, after conducting a testing experiment—using the LOO approach—the same accuracy dropped to , with most of the error coming from false positives (FPs). This lower-than-expected accuracy for testing may be related to a difficulty for the classifier to generalize. In that sense, it is necessary to highlight that our data were not evenly balanced. In fact, there were more than twice as many negative than positive samples. Typically, this imbalance causes a bias in the system towards the negative class, which can be easily observed by a much lower sensitivity (true positive rate) with respect to specificity (true negative rate). In this experiment, sensitivity was and specificity was . In essence, while most normal vowel productions were correctly classified, about one fifth of the vowel productions from speakers with self-reported vocal fatigue were misclassified.
Three potential limitations could explain this lack of generalization: first, as already mentioned, our data were imbalanced. Second, since some of the features used are amplitude-dependent, the lack of amplitude normalization in the sEMG signals extracted from different subjects could exacerbate the error under the inter-subject constraint. Third, we may still have insufficiently diverse data in order for the classifier to achieve better generalization (only four subjects scored high in the clinical range of the VFI-1, that is, >24 [23]). In the next sections, these three potential problems were investigated.
4.2. Classification of Matched-Subject Groups
In order to address the first of the potential causes for the low sensitivity, we age-matched a balanced group of 40 subjects, 20 vocally healthy (non-teachers) and 20 vocally fatigued (early career teachers), from a total of 88 subjects. Additionally, to address the second cause—lack of amplitude normalization—the subjects were matched on skinfold thickness [24]. The descriptive statistics for both groups are shown in Table 4. All vocally healthy and vocally fatigued subjects had a VFI-1 ⩽ 10 and VFI-1 ⩾ 15, respectively—therefore, no subjects were in the gray area of VFI-1 scores. This age- and skinfold-thickness-based matching allowed us to eliminate all potential issues discussed earlier, since now the classes were balanced; amplitude normalization was approached via skinfold thickness; and incorrect labels were alleviated by leaving subjects in the “gray area” out of the experiment.
Table 4.
Descriptive statistics for age, neck skinfold thickness (supra- and infrahyoid), and Vocal Fatigue Index factor 1 (VFI-1) scores for 40 matched test subjects.
We performed the same LOO test as described in Section 4.1. The total numbers of Positive and Negative samples were 3270 and 3202, respectively, and Table 5 shows the final classification results. This time, an even higher validation accuracy was obtained—demonstrating that the imbalanced data and normalization indeed played a role in the classification. Similarly, after performing the LOO test, the overall accuracy of testing also improved from to , and the true positive from to . Both of these highly promising improvements show that the assumptions on imbalanced data and lack of normalization were correct. However, these changes had an impact on the specificity of the classifier, which decreased to .
Table 5.
Confusion matrix for the positive vs. negative detection of vocal fatigue among 40 subjects closely matched by age and skinfold thickness, labeled according to the Vocal Fatigue Index factor 1 scores and using leave-one-out cross-validation.
In summary, these results demonstrated that, as long as the data are balanced, normalized and appropriately labeled, the classification of normal and vocally fatigued vowel productions as indicated by self-reported vocal fatigue can be achieved, and yet the classifier can reasonably generalize on a completely new test subject. However, further investigation into the generalization ability of the classifier is warranted.
4.2.1. Normalization Using 100% MVC
In addition to matching our subjects by age and skinfold thickness, we also investigated the possibility of using MVC as a method for amplitude normalization [24]. In this case, the approach was to normalize all vowel productions by the subject’s 100% MVC measurements during data collection. First, a moving window was employed to average the absolute value of the sEMG signals from each of the four channels during 100% MVC. Then, the maximum moving-window average from each channel was determined and used to normalize the sEMG signals collected during voice productions. Table 6 shows the results after applying the 100% MVC amplitude normalization to the sEMG signals and then classifying the signals using each feature separately. The goal was to determine the impact of 100% MVC normalization on each feature, as well as on groups of features: i.e., amplitude-dependent features, such as MAV, RMS, and WL; frequency-dependent features, such as ZC, SSC, and WA; and stochastic features, such as AR and GR.
Table 6.
Comparison of classification results (accuracy, sensitivity, specificity) before/after 100% MVC normalization among 40 subjects, matched by age and neck skinfold thickness. Each row corresponds to an individual feature; features are grouped by type; and the average by type is presented at the end of each group. Moreover, the last row shows the overall performance across features.
As expected, the results indicated that 100% MVC normalization improved classification when using amplitude-dependent features, but it did not affect the frequency-dependent or the stochastic features. However, this test also revealed that: (1) frequency-dependent features were in general much better at detecting fatigued samples demonstrated by their testing accuracy and sensitivity; (2) the more features being added to the classifier, the lesser its ability to generalize to the testing samples. This could be potentially caused by the fact that the more features were being incorporated, the more information was correlated to the particular subject rather than indicating either healthy and fatigued classes. A possible solution is to increase the total sample size being used for training that would ideally cover all possible subjects to improve the generalization of the classifier.
4.3. Generalization vs. Total Sample Size
As mentioned in Section 4.1, the trained classifier did not satisfactorily generalize with respect to the left-out subjects—having an almost perfect validation accuracy while yielding a lower testing accuracy. As pointed out, one potential reason could be the lack of diversity on training data to provide a big enough learning space for vocal fatigue. The results from Section 4.2.1 also indicated that although more features could lead to better validation accuracy, it aggravated the issue with the generalization. So, in order to investigate the influences of sample sizes we repeated the experiment in Section 4.2, but this time varies the amount of used subject pairs in each experiment from 20 to 40. The classification results were plotted in terms of their testing accuracy in Figure 5. These results demonstrated a clear linear relationship between the total amount of training data being used (as adding the subject pair) and the resulting accuracy. Evidently, if more than 40 pairs were available, the results would further improve.
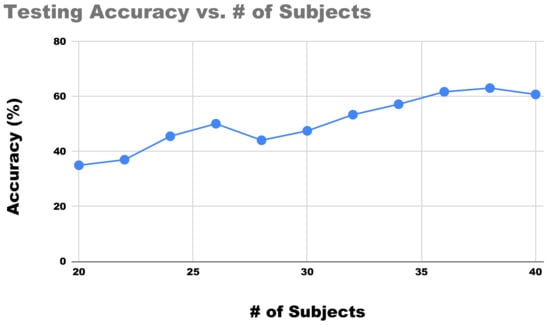
Figure 5.
Progression of the proposed protocol for the sEMG classification of vocal fatigue as the total number of matched subjects increases.
Finally, as a last investigation on the generalization capability of the classifier, we performed a left-out experiment on the 40 age- and skinfold-matched subjects. In this case, we randomly selected of the samples (i.e., between 10 and 15 samples) from the testing subject ‘left-out’ to be included in training and validation. The results are reported in Table 7. As the table shows, by adding only 10–15 additional training samples (w.r.t. the total size of 6472 samples), the classification performance in testing was significantly improved from to in accuracy. Similarly, the sensitivity went up from to , and the specificity from to .
Table 7.
Confusion matrix for positive vs. negative detection of vocal fatigue among 40 subjects closely matched on age and skinfold thickness, labeled according to the Vocal Fatigue Index factor 1 scores and using left-out cross-validation.
5. Discussion
Inter-subject classification using either sEMG signals or by comparison acoustic signals/acceleration signals still are a significant challenge in voice research. For example, in [25] the authors performed leave-one-subject-out cross validation for classifying mood in individuals with bipolar disorder. The accuracy they achieved was between 67–77% based on acoustic signals. Similarly, in a study on acoustic markers of affect [26], leave-one-speaker-out classification was also employed, and the results achieved ranged from to . More recently, Ref. [27] used neck-surface acceleration to classify vocal hyperfunction, which yielded an accuracy of based on L1 logistic regression. However, when models were evaluated only by cross-validation (some test subjects’ samples could be included in training data), they tend to obtain higher accuracies. Ref. [28] proposed and evaluated two different models. The first was a long-short-term-memory (LSTM)-based emotion detector using speech signals that achieved accuracy with five-fold cross-validation. The second model was for mood disorder detection using leave-one-group-out cross validation. The best performance of the model was . To the best of our knowledge, there was no comprehensive study conducted by other parties on using neck sEMG to classify vocal fatigue that we could compare our results with.
However, outside the scope of classification and machine learning, several other studies demonstrated that frequency-based sEMG features could be strong indicators of muscle fatigue. In a review conducted by [29], it was mentioned that the median frequency was superior to amplitude-based measures in detecting muscle fatigue [29]. Another study [30] also suggested a list of sEMG features including ZC, SSC and WA as fatigue indices. These findings are consistent with what we previously demonstrated in Section 4.2.1 and Table 6, which showed that frequency-based features showed superior accuracy performance compared with the rest of sEMG features we selected.
6. Conclusions
In this paper, we addressed some of the most critical challenges for adopting machine learning to detect vocal fatigue. We established that there were distinguishable patterns between healthy and fatigued samples by demonstrating a validation accuracy as high as . We also discovered that frequency-based sEMG features were more accurate and reliable in detecting vocal fatigue. This finding provides a window into the clinical relevance of sEMG data classification with regard to the early detection of vocal fatigue. Moreover, we addressed the shortcomings of using a classification approach, which might have led to lower than expected generalization, while we also offered solutions to minimize this problem: (1) by focusing on balanced, normalized data; and (2) by demonstrating a clear improvement when increasing the overall sample size. The impact of this study ranges from suggestions on the best protocol for data acquisition and signal conditioning for classification of vocal fatigue using machine learning to providing recommendations on adopting the approach in a clinical setting with potential methods to achieve better performance.
Future work will involve the assignment of labels on a per-sample basis—as individuals with vocal fatigue, especially those with low vocal fatigue, may still produce ‘healthy-like’ samples, an issue that was also pointed out for classifying vocal hyperfunction using neck surface acceleration [27]. A limitation of the current dataset is that the majority of cases with elevated VFI-1 scores used in this experiment would be considered low vocal fatigue, whereas only four teachers had scores greater than 24, representing clinically high vocal fatigue [23]. We will also further investigate the differences in validation and testing performances, as well as new features and techniques that can yield a better generalization and a deeper understanding of vocal fatigue clinically such as spectral analyses [29] and the analysis of sentence-level data.
Author Contributions
Conceptualization, M.D. and G.N.D.; methodology, Y.G., M.D. and G.N.D.; software, Y.G.; validation, Y.G., M.D. and G.N.D.; formal analysis, Y.G.; investigation, M.D.; resources, M.D. and G.N.D.; data curation, Y.G.; writing—original draft preparation, Y.G.; writing—review and editing, Y.G., M.D. and G.N.D.; visualization, Y.G.; supervision, M.D. and G.N.D.; project administration, M.D.; funding acquisition, M.D. All authors have read and agreed to the published version of the manuscript.
Funding
Research reported in this publication was supported by the National Institute On Deafness and Other Communication Disorders of the National Institutes of Health under Award Number R15DC015335 and R01DC018026.
Institutional Review Board Statement
The study was conducted according to the guidelines of the Declaration of Helsinki, and approved by the Institutional Review Board of the University of Missouri (protocol number 2006447, date of approval 09/14/2016).
Informed Consent Statement
Informed consent was obtained from all subjects involved in the study.
Data Availability Statement
The data presented in this study are available on request from the corresponding author: http://vigir.missouri.edu/Research/sEMG_dataset.html (accessed on 14 February 2020).
Acknowledgments
Thank you to Ashton Bernskoetter, Taylor Hall, Katherine Johnson, Haley McCabe, Melinda Pfeiffer, and Allison Walker for assistance with data collection. We thank Matthew Page, MD, for reviewing laryngeal videostroboscopies.
Conflicts of Interest
The authors declare no conflict of interest. The content is solely the responsibility of the authors and does not necessarily represent the official views of the National Institutes of Health. The funders had no role in the design of the study; in the collection, analyses, or interpretation of data; in the writing of the manuscript, or in the decision to publish the results.
References
- Smith, E.; Verdolini, K.; Gray, S.; Nichols, S.; Lemke, J.; Barkmeier, J.; Dove, H.; Hoffman, H. Effect of voice disorders on quality of life. J. Med. Speech-Lang. Pathol. 1996, 4, 223–244. [Google Scholar] [CrossRef]
- Kooijman, P.G.C.; de Jong, F.I.C.R.S.; Thomas, G.; Huinck, W.; Graamans, K.; Schutte, H.K. Risk factors for voice problems in teachers. Folia Phoniatr. Logop. 2006, 58, 159–174. [Google Scholar] [CrossRef]
- Thomas, G.; Kooijman, P.G.C.; Cremers, C.W.R.J.; de Jong, F.I.C.R.S. A comparative study of voice complaints and risk factors for voice complaints in female student teachers and practicing teachers early in their career. Eur. Arch. Oto-Rhino-Laryngol. Head Neck 2006, 263, 370–380. [Google Scholar] [CrossRef]
- Hillman, R.E.; Van Stan, J.H.; Mehta, D.D.; Zañartu, M.; Ghassemi, M.; Cheyne, H.A., II; Guttag, J.V. Future directions in the development of ambulatory monitoring for clinical voice assessment. In Proceedings of the 10th International Conference on Advances in Quantitative Laryngology, Voice and Speech Research, Cincinnati, OH, USA, 3–4 June 2013. [Google Scholar]
- Nanjundeswaran, C.; Jacobson, B.H.; Gartner-Schmidt, J.; Verdolini Abbott, K. Vocal fatigue index (VFI): Development and validation. J. Voice 2015, 29, 433–440. [Google Scholar] [CrossRef] [PubMed]
- Rampichini, S.; Vieira, T.M.; Castiglioni, P.; Merati, G. Complexity analysis of surface electromyography for assessing the myoelectric manifestation of muscle fatigue: A review. Entropy 2020, 22, 529. [Google Scholar] [CrossRef] [PubMed]
- Moniri, A.; Terracina, D.; Rodriguez-Manzano, J.; Strutton, P.H.; Georgiou, P. Real-time forecasting of sEMG features for trunk muscle fatigue using machine learning. IEEE Trans. Biomed. Eng. 2021, 68, 718–727. [Google Scholar] [CrossRef] [PubMed]
- Mugnosso, M.; Zenzeri, J.; Hughes, C.M.L.; Marini, F. Coupling robot-aided assessment and surface electromyography (sEMG) to evaluate the effect of muscle fatigue on wrist position sense in the flexion-extension plane. Front. Hum. Neurosci. 2019, 13, 396. [Google Scholar] [CrossRef]
- Yun, I.; Jeung, J.; Song, Y.; Chung, Y. Non-Invasive quantitative muscle fatigue estimation based on correlation between sEMG signal and muscle mass. IEEE Access 2020, 8, 191751–191757. [Google Scholar] [CrossRef]
- Verdolini, K.; Rosen, C.; Branski, R. Classification Manual for Voice Disorders-I; Lawrence Erlbaum Associates: Mahwah, NJ, USA, 2006. [Google Scholar]
- Hunter, E.; Cantor-Cutiva, L.; van Leer, E.; van Mersbergen, M.; Nanjundeswaran, C.; Bottalico, P.; Sandage, M.; Whitling, S. Toward a consensus description of vocal effort, vocal load, vocal loading, and vocal fatigue. J. Speech Lang. Hear. Res. 2020, 63, 509–532. [Google Scholar] [CrossRef]
- Smith, N.R.; Klongtruagrok, T.; DeSouza, G.N.; Shyu, C.R.; Dietrich, M.; Page, M.P. Non-invasive ambulatory monitoring of complex sEMG patterns and its potential application in the detection of vocal dysfunctions. In Proceedings of the 2014 IEEE 16th Healthcom, Natal, Brazil, 15–18 October 2014; pp. 447–452. [Google Scholar]
- Rivera, L.; DeSouza, G.N. Recognizing Hand Movements from a Single sEMG Sensor using Guided Under-determined Source Signal Separation. In Proceedings of the 12th IEEE ICORR, Zurich, Switzerland, 29 June–1 July 2011. [Google Scholar]
- Smith, N.R.; Rivera, L.A.; Dietrich, M.; Shyu, C.R.; Page, M.P.; DeSouza, G.N. Detection of simulated vocal dysfunctions using complex sEMG patterns. IEEE J. Biomed. Health Inform. 2016, 20, 787–801. [Google Scholar] [CrossRef]
- Gao, Y.; Dietrich, M.; Pfeiffer, M.; DeSouza, G. Classification of sEMG Signals for the Detection of Vocal Fatigue Based on VFI Scores. In Proceedings of the IEEE 40th EMBC, Honolulu, HI, USA, 18–21 July 2018; pp. 5014–5017. [Google Scholar]
- Lien, Y.A.; Gattuccio, C.; Stepp, C. Effects of phonetic context on relative fundamental frequency. J. Speech Lang. Hear. Res. 2014, 57, 1259–1267. [Google Scholar] [CrossRef]
- Young, A.J.; Smith, L.H.; Rouse, E.J.; Hargrove, L.J. Classification of simultaneous movements using surface EMG pattern recognition. IEEE Trans. Biomed. Eng. 2013, 60, 1250–1258. [Google Scholar] [CrossRef]
- Li, G.; Schultz, A.E.; Kuiken, T.A. Quantifying pattern recognition—Based myoelectric control of multifunctional transradial prostheses. IEEE Trans. Neural Syst. Rehabil. Eng. 2010, 18, 185–192. [Google Scholar]
- Englehart, K.; Hudgins, B. A robust, real-time control scheme for multifunction myoelectric control. IEEE Trans. Biomed. Eng. 2003, 50, 848–854. [Google Scholar] [CrossRef]
- Zardoshti-Kermani, M.; Wheeler, B.C.; Badie, K.; Hashemi, R.M. EMG feature evaluation for movement control of upper extremity prostheses. IEEE Trans. Rehabil. Eng. 1995, 3, 324–333. [Google Scholar] [CrossRef]
- Fukuda, T.; Echeimberg, J.; Pompeu, J.; Lucareli, P.; Garbelotti Junior, S.; Gimenes, R.; Apolinário, A. Root mean square value of the electromyographic signal in the isometric torque of the quadriceps, hamstrings and brachial biceps muscles in female. J. Appl. Res. 2010, 10, 32–39. [Google Scholar]
- Hargrove, L.; Englehart, K.; Hudgins, B. A training strategy to reduce classification degradation due to electrode displacements in pattern recognition based myoelectric control. Biomed. Signal Process. Control 2008, 3, 175–180. [Google Scholar] [CrossRef]
- Nanjundeswaran, C.; van Mersbergen, M.; Banks, R.; Hunter, E. Vocal fatigue index in teachers using mokken analysis. J. Voice 2021. [Google Scholar] [CrossRef]
- Stepp, C.E. Surface electromyography for speech and swallowing systems: Measurement, analysis, and interpretation. J. Speech Lang. Hear. Res. 2012, 55, 1232–1246. [Google Scholar] [CrossRef]
- Gideon, J.; Provost, E.M.; Mclnnis, M. Mood State Prediction from Speech of Varying Acoustic Quality for Individuals with Bipolar Disorder. In Proceedings of the IEEE International Conference on Acoustics, Speech and Signal Processing, Shanghai, China, 20–25 March 2016; pp. 2359–2363. [Google Scholar] [CrossRef]
- Eyben, F.; Scherer, K.R.; Schuller, B.W.; Sundberg, J.; André, E.; Busso, C.; Devillers, L.Y.; Epps, J.; Laukka, P.; Narayanan, S.S.; et al. The geneva minimalistic acoustic parameter set (GeMAPS) for voice research and affective computing. IEEE Trans. Affect. Comput. 2016, 7, 190–202. [Google Scholar] [CrossRef]
- Cortés, J.P.; Espinoza, V.M.; Ghassemi, M.; Mehta, D.D.; Van Stan, J.H.; Hillman, R.E.; Guttag, J.V.; Zañartu, M. Ambulatory assessment of phonotraumatic vocal hyperfunction using glottal airflow measures estimated from neck-surface acceleration. PLoS ONE 2018, 13, e0209017. [Google Scholar] [CrossRef] [PubMed]
- Huang, K.Y.; Wu, C.H.; Su, M.H.; Kuo, Y.T. Detecting unipolar and bipolar depressive disorders from elicited speech responses using latent affective structure model. IEEE Trans. Affect. Comput. 2020, 11, 393–404. [Google Scholar] [CrossRef]
- Yousif, H.A.; Zakaria, A.; Rahim, N.A.; Salleh, A.F.B.; Mahmood, M.; Alfarhan, K.A.; Kamarudin, L.M.; Mamduh, S.M.; Hasan, A.M.; Hussain, M.K. Assessment of muscles fatigue based on surface EMG signals using machine learning and statistical approaches: A review. IOP Conf. Ser. Mater. Sci. Eng. 2019, 705, 012010. [Google Scholar] [CrossRef]
- Shair, E.F.; Ahmad, S.A.; Marhaban, M.H.; Mohd Tamrin, S.B.; Abdullah, A.R. EMG processing based measures of fatigue assessment during manual lifting. BioMed Res. Int. 2017, 2017. [Google Scholar] [CrossRef]
Publisher’s Note: MDPI stays neutral with regard to jurisdictional claims in published maps and institutional affiliations. |
© 2021 by the authors. Licensee MDPI, Basel, Switzerland. This article is an open access article distributed under the terms and conditions of the Creative Commons Attribution (CC BY) license (https://creativecommons.org/licenses/by/4.0/).