1. Introduction
MOOCs (massive open online courses) have gained huge popularity in recent years transforming the traditional learning environment of universities, thanks to initiatives, such as edX, Coursera, or FutureLearn [
1]. These online courses normally involve a very heterogeneous set of participants with different learning capabilities and motivations [
2]. These participants communicate with each other and also with the instructors in different ways, including forums and social networks [
3]. At present, most MOOC platforms include a built-in forum, which is typically the preferred means of communication for MOOC participants [
4,
5], and that can be used to ask questions, get answers, share information, or express concerns.
MOOC forums include a significant amount of data that can be used to understand learners’ performance during the course [
6]. The collection and analysis of data from forum interactions in MOOCs can be framed within the research area called “Social Learning Analytics” [
7]. The collection and analysis of data from forum interactions in MOOCs can serve to detect behavior patterns. Moreover, forum interactions can be used for grading learners. For example, there are several dashboards [
6,
8,
9] that represent the information contained in MOOC forums, independently [
6] or combined with learners’ interactions with other elements of the MOOC, such as videos or exercises [
8,
9].
Learners’ interactions in the forum may be of importance for the development of the MOOC and can be encouraged and directed by the instructor through concrete instructions in the course. Several articles have shown the positive effect of learner active participation in the MOOC forum [
10,
11,
12,
13,
14,
15]. In fact, the first so-called MOOC “Connectivism and Connective Knowledge CCK08” relied on knowledge generated by learners themselves in open spaces for reflection and discussion, with a strong focus on collaboration and cooperation among learners, with instructors facilitating interactions rather than transmitting knowledge [
1]. MOOCs that share these characteristics are classified as cMOOCs (connectivist MOOCs), as opposed to the so-called xMOOCs, which are more focused on the traditional lecture format (e.g., most of those provided through edX, Coursera, FutureLearn, etc.), and where learners’ interactions in the forum are not as essential for the development of the course [
1]. Even so, some research articles have analyzed the relationship between learners’ participation in the forum and the final grade obtained in the (x)MOOC [
10,
11,
12,
13,
14]. These analyses have typically been carried out considering only the quantitative dimension of such participation (number of messages posted) but not the relevance of the messages posted (measured either through text data mining [
16] or through direct quantifiable indicators, such as length, average votes/likes received per post, instructors’ endorsement, etc.). Moreover, these analyses tend to focus on aggregate data rather than individual learner behavior. Thus, there is an opportunity for research regarding the incorporation of information about the relevance of the messages posted by MOOC learners, as well as on the analysis of each learner’s behavior from their interaction through the MOOC forum.
The assessment of learners’ knowledge and skills in MOOCs is often undertaken using traditional summative assessment activities, such as questions and problems (which in many cases can be automatically graded) or peer-assessment activities. However, the forum interactions and messages posted might also be used as part of this assessment, as learners may post relevant questions and provide comprehensive answers to help their peers. This is important, as there might be courses where discussion forums contain the main evidence of learners’ work, or where discussion forums could serve to complement the grade obtained by learners through summative assessment activities. In any case, it is important to keep in mind that the ultimate decision on whether to use the forums as part of the learners’ grade and the weight the use of the forums will have on learners’ final grade, corresponds to the MOOC instructors. This decision may cause side effects, such as more intensive use of the forum by the learners (since they will know that their final grade also depends on their interactions in the MOOC forum), which could be understood as something positive or negative depending on the course context. These types of behaviors could be seen as “gaming the system” [
17]. Nevertheless, “gaming the system” is not only an issue related to assigning grades based on the use of the forum; several ways of “gaming the system” (or cheating) have also been found in traditional summative assessment activities in MOOCs (e.g., [
18]).
In this context, this work aims to present an algorithm that allows teachers to automatically and individually grade MOOC learners based on their interactions in the course forum, as well as a tool that implements the algorithm and represents the results graphically. This grading algorithm shall take into account both the quantitative dimension and the relevance of the messages posted, using direct quantifiable indicators to assess this relevance, but not text mining techniques, in order to perform fast calculations in a high-volume interaction environment as is the case in MOOCs. The grades calculated by the algorithm could be used by the instructors as part of the final grade of MOOC learners, combining them with other possible grades, such as those obtained from summative assessment activities. This grading algorithm is validated with a concrete MOOC example on which two research questions (RQs) are posed:
RQ1: What is the relationship between the grades obtained by the learners through the grading algorithm for forum interactions and the summative assessment activities of the MOOC?
RQ2: What is the explanatory power of the grading algorithm for forum interactions through predictive models of learners’ grades?
This paper is structured as follows.
Section 2 introduces the literature on social learning analytics and MOOC forums.
Section 3 presents the automatic grading algorithm from learners’ interactions in the MOOC forum.
Section 4 presents the tool that implements the algorithm and provides a visual representation of the results.
Section 5 presents the materials and methods.
Section 6 summarizes the main results.
Section 7 discusses the results obtained and answers the RQs. Conclusions and future work are set out in
Section 8.
2. Related Work
Social learning analytics is a subset of learning analytics that relies on the fact that “new skills and ideas are not solely individual achievements, but are developed, carried forward, and passed on through interaction and collaboration” [
19]. Social learning analytics has been studied in numerous educational contexts, especially in online environments, mainly with the objectives of analyzing and promoting the discussion that takes place among learners [
20,
21]. This discussion typically happens in the course forum [
21] but can also take place in other contexts, such as social networks [
22].
In the case of MOOCs, interaction among learners and with instructors also happens mainly in the course forum [
5], which is a built-in feature in most platforms that offer MOOCs. The analysis of learners’ participation in the MOOC forum allows for a better understanding of learners’ behavior and can be helpful in the identification of patterns. For example, Kizilcec et al. [
13] classified MOOC participants according to four engagement trajectories (completing, auditing, disengaging, and sampling), concluding that forum activity varies significantly between engagement trajectories with medium to large effect sizes. Similarly, Hill [
23] identified five patterns in MOOC learners, no-shows, observers, drop-ins, passive, and active, with only the last three participating in the forum, although passive learners only read messages, while drop-ins and active learners also posted messages. In addition, Chen et al. [
24] clustered learners’ personalities in five categories (openness, extraversion, conscientiousness, agreeableness, and neuroticism), including multiple indicators extracted from the MOOC forum (e.g., total forum posting, new forum questions, forum replies, forum browsing time, etc.) in their analysis.
Therefore, participation in the MOOC forum is normally quite heterogeneous, with some learners contributing extensively to the forum and others not at all. Nevertheless, the amount of interaction in the MOOC forum may depend on the topic, difficulty, and number of participants in the course [
15]. For example, Breslow et al. [
25] analyzed learners’ posts in the first MOOCs offered through edX, concluding that only 3% of enrollees posted messages in the discussion forum. Manning and Sanders [
26] analyzed 23 Stanford MOOCs and also found that the number of people posting in the forums was usually under 5% and never higher than 10% of the registered participants. Belanger and Thornton [
27] analyzed learners’ posts in the discussion forum of the first MOOC offered by Duke University, obtaining that 7% of enrollees posted messages in the forum. In contrast, the University of Edinburgh declared higher numbers, with an average of 15% of learners posting messages in the discussion forums of its first six MOOCs [
28]. In any case, it is important to stress that MOOC instructors may encourage learners to use the forum using live polls or specific prompts [
29] versus the alternative of just expecting learners to use the forum of their own volition.
The relationship between learners’ interactions in the MOOC forum and learners’ final grades in the course has also been studied. For example, He et al. [
11] found a positive correlation between forum activity and final grade in a Chinese College MOOC. Velo Beascoechea et al. [
10] reported that almost half of the learners who passed a MOOC on computer sciences had posted comments in the forum and that the higher the number of posts published by a learner in the MOOC forum, the higher the passing rate. Similarly, Breslow et al. [
25] concluded that 52% of the total number of learners who obtained a completion certificate in the first edX MOOCs were active contributors in the forum. Moreover, Manning and Sanders [
26] matched learners’ final grade in 23 Coursera MOOCs with the percentage of posts that these learners had submitted to the discussion forum, concluding that between 20% and 80% of the learners who obtained at least 60% of the final grade contributed through the forum. Alario-Hoyos et al. [
30] analyzed the role of “top contributors” (1% of MOOC learners with more posts submitted) to try to detect them early and assign them special permissions as community teaching assistants in the MOOC, finding a moderate positive correlation (r = 0.343) between the number of posts published and final grade in the MOOC. Huang et al. [
31] also studied the highest-volume forum contributors, named “superposters”, concluding that “superposters” obtained higher grades than the average forum participants as well as replied faster and received more upvotes. In contrast, some other publications concluded that forum-related variables do not add much value when trying to predict learners’ grades [
32,
33], which makes this issue worth exploring even further.
Nevertheless, it is not only important to consider the number of messages (quantity) sent by MOOC learners but also their relevance. This can be done by analyzing the characteristics of the message (e.g., length, number of replies, number of likes, etc.) or the content of the message (e.g., through text mining techniques) [
16]. For example, Yang et al. [
34] developed a model to identify confused learners through expressions, such as “I’m stuck”. Almatrafi et al. [
35] proposed a model to identify urgent posts that needed immediate attention from instructors based on several linguistic features. Wen et al. [
36] explored the collective sentiment of learners in a MOOC based on forum posts, evaluating the impact of sentiment on attrition over time. Similarly, Moreno-Marcos et al. [
37] classified the posts obtained from a MOOC forum as positive, negative, or neutral according to a word dictionary and some grammar rules to detect moments of greater negativity throughout the course. In this same line, Ramesh et al. [
38] developed a weakly supervised system for detecting both sentiments and topics from the body of messages posted in 12 MOOCs. Furthermore, Brinton et al. [
39] proposed a model for classifying threads in forums by ranking their relevance using 80 Coursera MOOCs.
Finally, it is important to present the results of the analysis of the MOOC forum in a comprehensible way for the stakeholders (typically the instructors) so that these can make interventions or even improvements to the MOOC in future editions. Several dashboards have been developed to present visualizations with the information of the MOOC forums. For example, iForum [
40] offers several visualizations regarding three interleaving aspects of MOOC forums: posts, users, and threads. VisMOOC [
41] provides a visualization based on social network analysis that shows the shape of the social network created around the MOOC forum, including in one single chart both the learner’s grade and the learner’s activity level in the forum. MessageLens [
42] provides several visualizations aimed at helping MOOC instructors to better understand forum discussions from three facets: discussion topic, learner attitude, and communication among learners. Finally, Moreno-Marcos developed LATƎS [
6], a tool that provides visualizations related to the use of the forum in edX MOOCs with a focus on three dimensions: number and type of social interactions, learners’ sentiments, and learners’ skills.
All in all, this research work builds on the related literature by proposing an algorithm that can be used to automatically grade MOOC learners based on their contributions in the forum, taking into account not only the number of messages (quantity), but also their relevance, and presenting the results in the form of comprehensive visualizations; in addition, these visualizations are integrated into the tool LATƎS [
6]. This is a novel research contribution to the best of the authors’ knowledge.
3. Grading Algorithm
This section presents the proposed algorithm to automatically grade MOOC learners individually based on their interactions in the course forum. This algorithm considers both the number of messages (quantity) and the relevance of the messages using direct quantifiable indicators for learners’ contributions in the course forum but without the use of text mining techniques. The proposed algorithm builds on the forum message structure of the edX/Open edX MOOC platform, although it could be tailored to the forum message structure of other learning platforms. The grades resulting from the application of this algorithm could complement the grades obtained by MOOC learners in summative assessment activities according to the weight assigned by the instructors to the social discussion in the MOOC forum.
3.1. Forum Message Structure in edX/Open edX
edX is one of the main MOOC initiatives, together with Coursera [
43]. edX is based on Open edX, an open-source platform that can be installed locally by any institution to offer its own MOOCs. The forum in edX/Open edX structures messages on three levels (see
Table 1), no matter if these messages are published by instructors or by learners. A message posted as a new discussion in the forum is called ‘
Thread’ (first level message). A reply to a ‘
Thread’ is called ‘
Response’ (second level message). A reply to a ‘
Response’ is called ‘
Comment’ (third level message). The total number of messages posted by a learner is the sum of the messages posted in the three levels.
The actions the platform permits on each message change depending on its level. For example, instructors and learners can upvote for a ‘Thread’ or a ‘Response’ but not for a ‘Comment’. Instructors and learners can follow a ‘Thread’ but not a ‘Response’ or a ‘Comment’. Instructors can endorse (i.e., promote a post due to the high value of its content) a ‘Thread’ or a ‘Response’ but not a ‘Comment’. These actions can be useful to assess the relevance of the messages posted in the forum, and also allow instructors and learners to better filter and sort the message list, which is often quite long in a MOOC.
3.2. Grade Calculation
The algorithm calculates a grade for each learner individually, assigning a partial score to each message posted by each learner in the course forum. The grade calculation considers both the number of messages posted by learners and their relevance (measured through direct quantifiable indicators). Learners who do not post any messages to the course forum are excluded from this analysis directly receiving a score of zero points.
- (a)
Quantitative dimension
The quantitative dimension considers the total number of messages sent by each learner, regardless of the level of these messages (see
Table 1). Due to the different durations and delivery modes in MOOCs (e.g., 4–7 weeks of duration, instructor-paced/synchronous vs. self-paced/asynchronous delivery mode [
44]), the interval in which the messages posted in the forum are analyzed is considered of importance. Therefore, a new indicator is defined as part of the quantitative dimension: the
period. The
period is the average time between messages posted by the same learner and can be computed for a certain time interval (e.g., the full duration of the MOOC, a calendar month, a week of the MOOC, etc.). This gives instructors the flexibility to calculate the grade for learners’ contribution in the forum throughout the entire duration of the MOOC, or a sub-interval of this duration.
- (b)
Relevance
The relevance of each message is assessed individually, considering a series of direct quantifiable indicators. It is important to note that these indicators may change depending on the level of the message (see
Table 1) since some indicators are not available for all levels.
Table 2 presents the list of indicators used as well as the score received by each message according to its level (‘
Thread’, ‘
Response’, and ‘
Comment’). Each message is assessed in the range of 0 to 10 points.
Four indicators are considered mandatory (length, votes, replies, and followers). The length of the message (number of words) is available at all levels and is the only mandatory quantifiable indicator in the case of ‘Comments’; the score for the length of each message is computed according to four ranges. The number of votes is available for ‘Threads’ and ‘Responses’ and is also computed according to four ranges. The number of replies is available for ‘Threads’ and ‘Responses’ and is also computed according to four ranges. The number of followers is only available for ‘Threads’ and is computed according to two ranges. The upper and lower levels for each range in length, number of votes, number of replies, and the number of followers may take default values or be tuned by instructors.
In addition, five indicators are optional (quotes, endorsed, pinned, views, and abusive) since they may or may not be present in the messages. The number of mentions (quotes) to other learners is available at all levels, although is computed differently depending on the level of the message. The endorsement by instructors is available for ‘Threads’ and ‘Responses’ and is also computed differently depending on the level of the message. Instructors can also pin a ‘Thread’ but not ‘Responses’ or ‘Comments’. ‘Threads’ can also be viewed by other participants, adding points with an upper limit. Finally, messages that are flagged by other learners more than five times for inappropriate use or abuse receive zero points regardless of the remainder indicators. Optional indicators can add up to one extra point although the maximum score of each message is always 10 points.
This collection of mandatory and optional indicators assesses the relevance of each message considering the intrinsic nature of the message (length and quotes), and the extrinsic interactions with the message (votes, replies, followers, endorsed, pinned, views, abusive). This collection of indicators could be adjusted, both in terms of their weight at each level and in the ranges in which they are computed, according to the needs of the instructors.
Once each message receives its score, the average grade of the posts for each learner must be calculated. In this case, the level of the message is considered relevant, prioritizing those messages that open new ‘
Threads’, or that are ‘
Responses’ to these ‘
Threads’, over ‘
Comments’. Formula (1) shows how this calculation is made, where
n1 is the number of ‘
Threads’,
n2 the number of ‘
Responses’, and
n3 the number of ‘
Comments’ for a certain learner, and
Th.i the score for ‘
Thread’ i,
Resp.j the score for ‘
Response’ j, and
Com.k the score for ‘
Comment’ k:
- (c)
Final Grade: Combining the quantitative dimension and the relevance
Once the
period (quantitative dimension) and the
post average grade (relevance) have been calculated for each learner, it would be possible to represent this information in a chart with the quantitative dimension on the
X-axis, and the relevance on the
Y-axis.
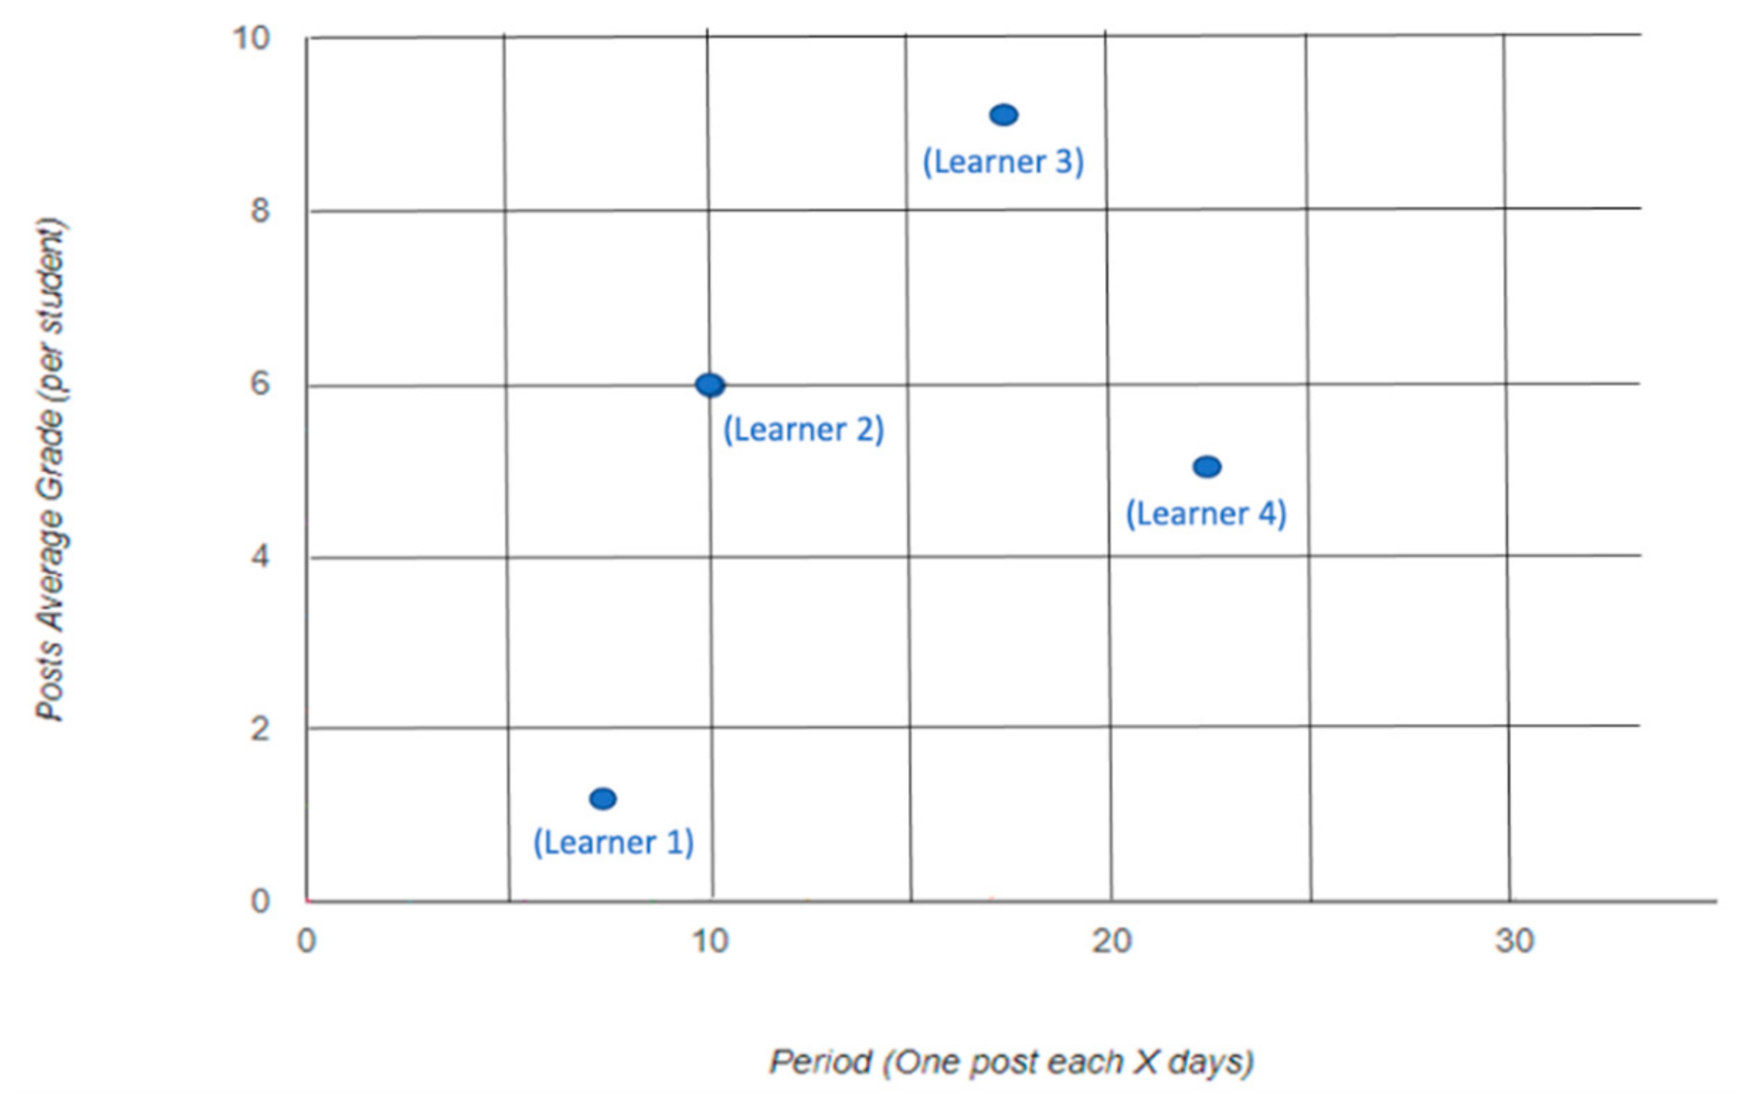
Figure 1 presents an example chart with the values in these two dimensions for four learners (four blue points). Each learner is represented as a point P(x,y) with x his/her quantitative dimension, and y indicating his/her relevance. If several learners get the same value in both dimensions, it would be possible to increase the size of the point to indicate overlapping learners.
Nevertheless, this two-dimensional model does not permit to easily determine which learner had a better behavior (and therefore a higher grade) in the MOOC forum, for example, when comparing learners 2 and 3, or learners 1 and 4 in
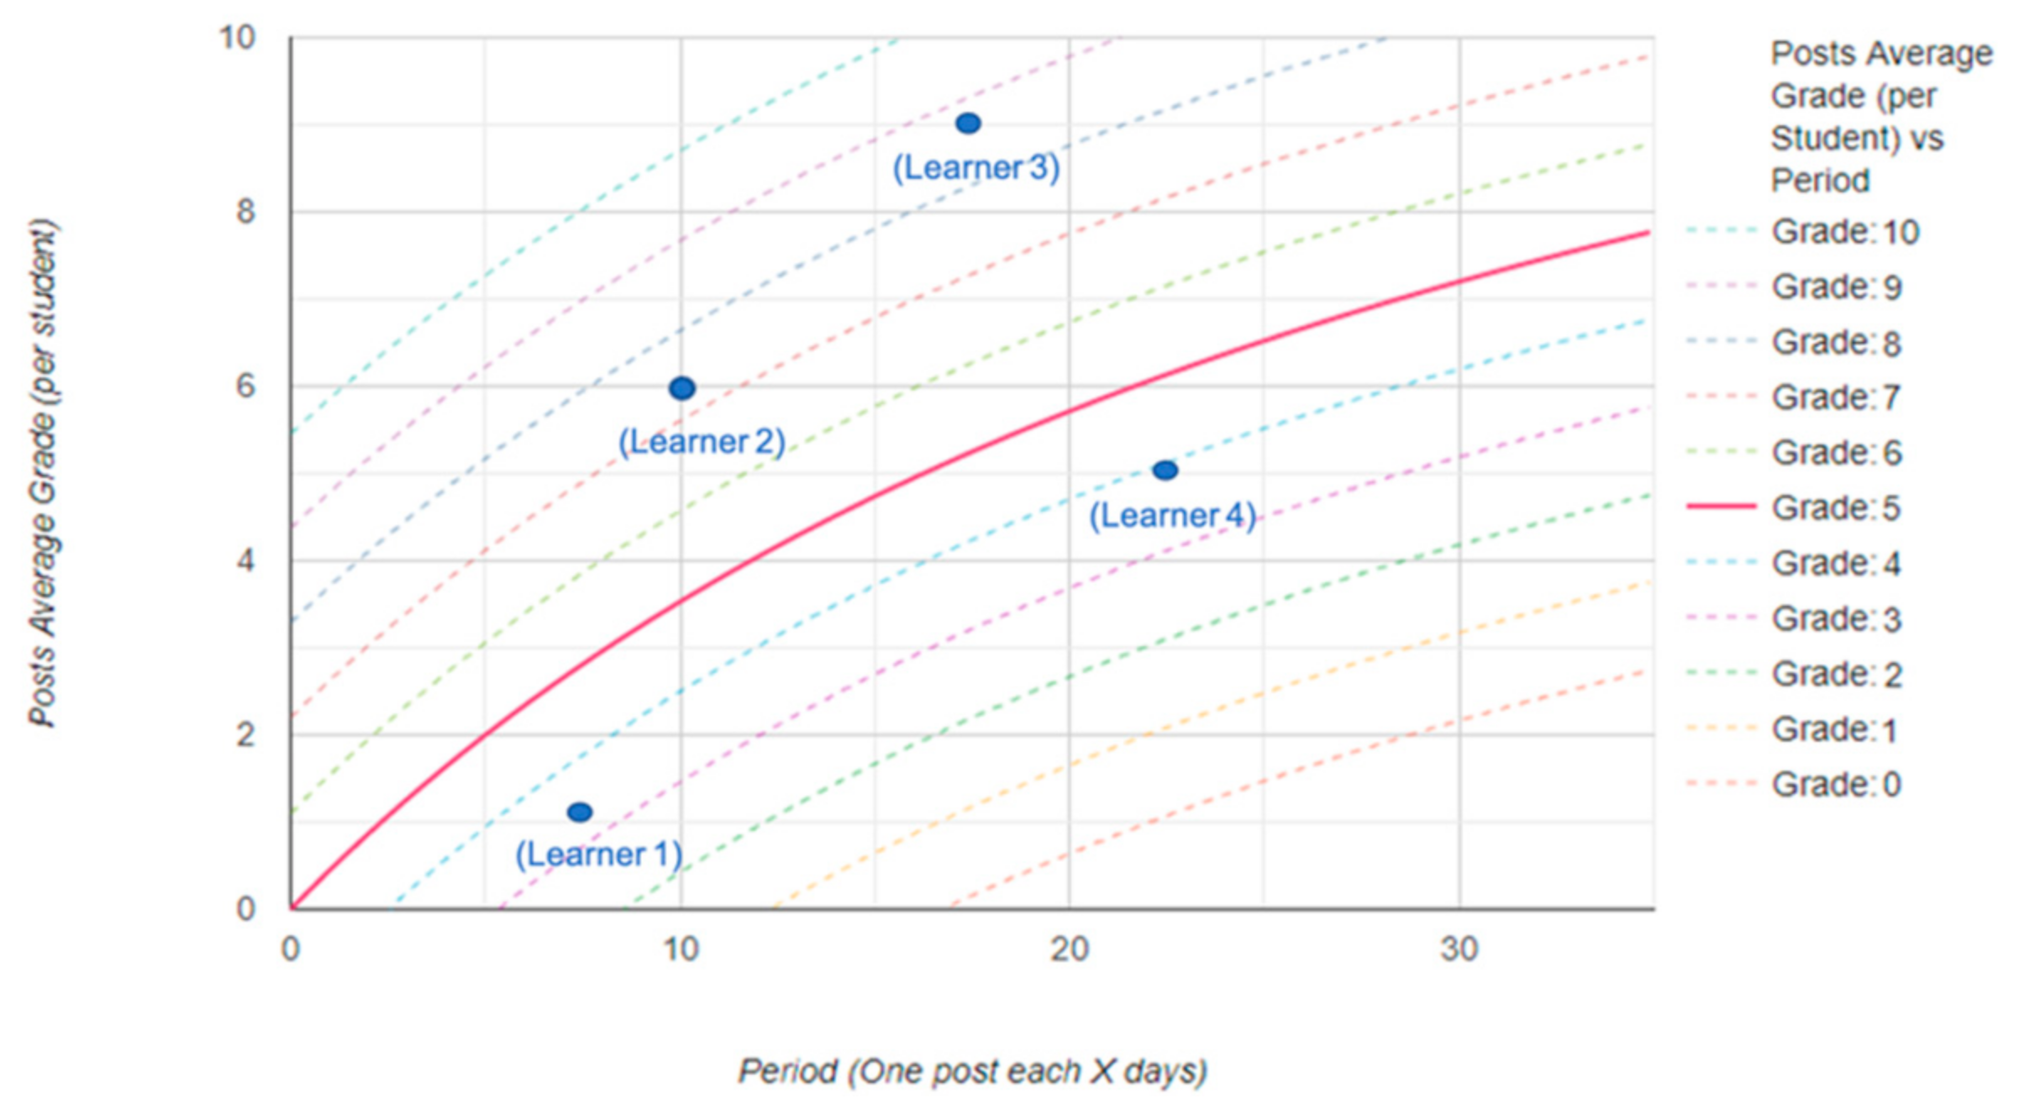
Figure 1 To compare learners’ behavior in these two dimensions and to be able to assign them a grade, a curve that contains all the points that shall receive the same score needs to be defined. This curve should not be fixed but should allow instructors some flexibility when calculating learners scores, depending on the specific characteristics of the MOOC, such as the expected relevance of the messages posted by learners, or the level of interaction required (some MOOCs may be designed to require more intensive discussion in the forum, while others may not give as much importance to forum interaction).
A curve
f(
x) is defined as a function of the posting period in days (x), to represent the grade that is in the middle of the range established by the instructors (e.g., 5 points in a range between 0 and 10 points). The grade of each learner would then be calculated as this grade in the middle of the range (e.g., 5 points) plus (if the point is over the curve) or minus (if the point is under the curve) the Euclidean distance from the point P(x,y) to the nearest point of the curve
f(
x) [
45]. Therefore, if the point which represents the learner is above the curve, that learner will get a score above the middle of the range, and if the point is under the curve, that learner will get a score below the middle of the range (see examples in
Figure 2, where the range 0-10 has been taken as a reference with 5 as the middle of the range). In this context, the following curve is defined,
f(
x) (2), which goes through the coordinate origin, considers that the maximum post average grade per learner is 10 points, and contains four parameters (A, B, C, and D) that can be adjusted to give greater flexibility to the instructors:
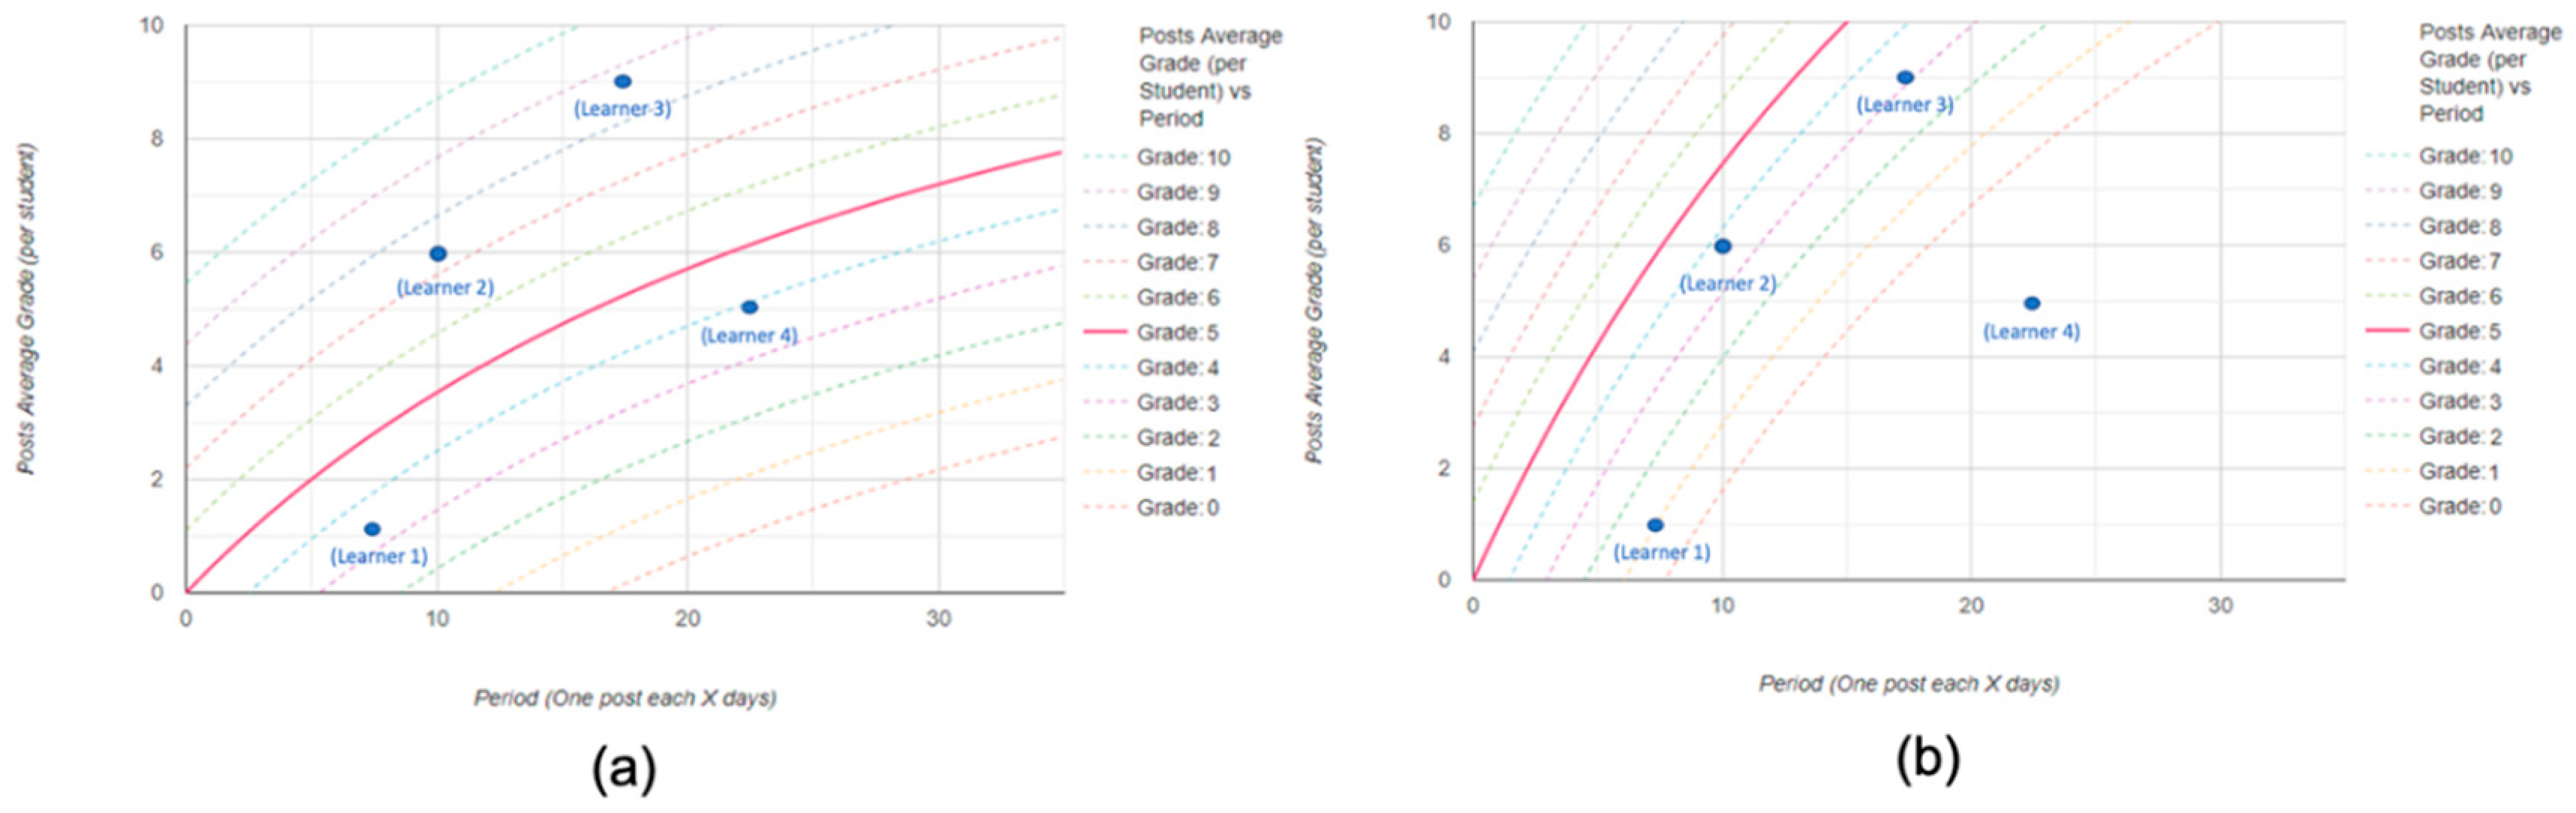
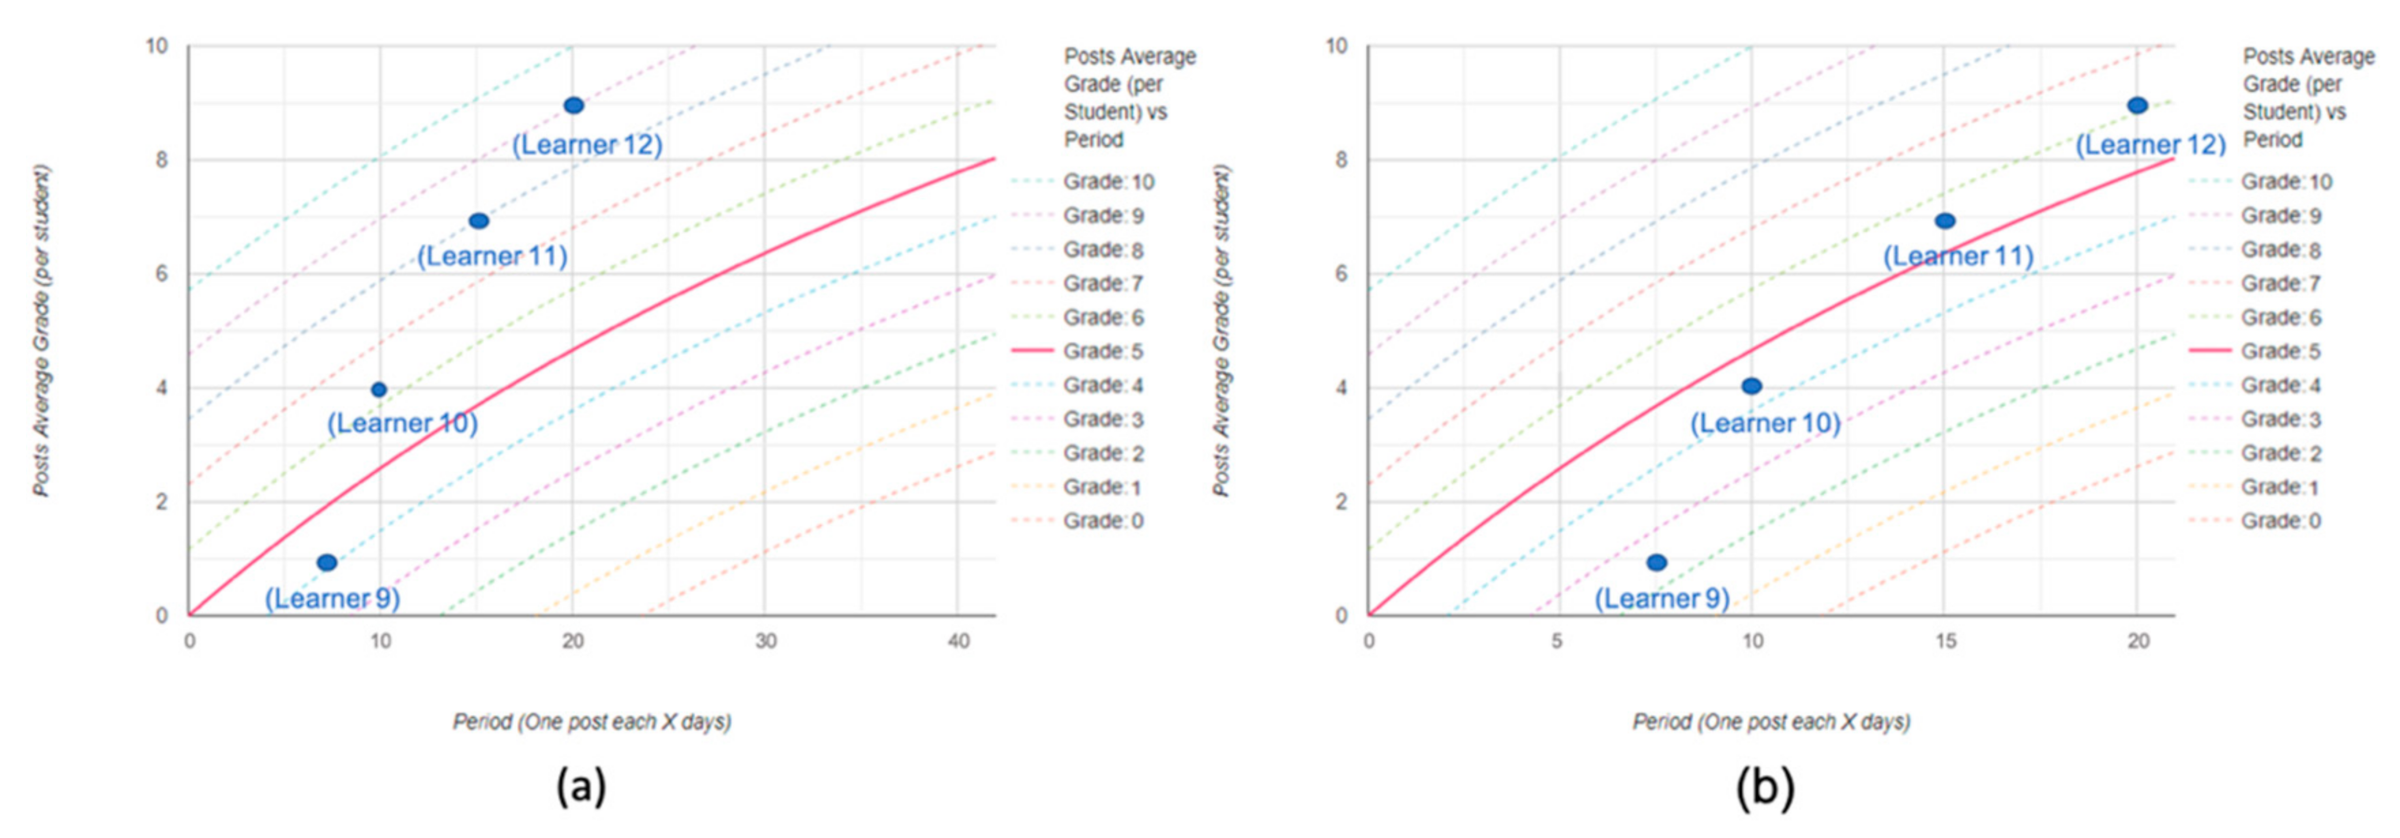
A refers to the expected relevance of the posts (
Post Average Grade—y-axis). The higher the value of
A, the higher must be the relevance of learners’ contributions to get the same grade. Graphically,
A raises or lowers the curve
f(
x), as can be seen in
Figure 3 where
Figure 3a corresponds to a lower value of
A, while
Figure 3b corresponds to a higher value of
A.
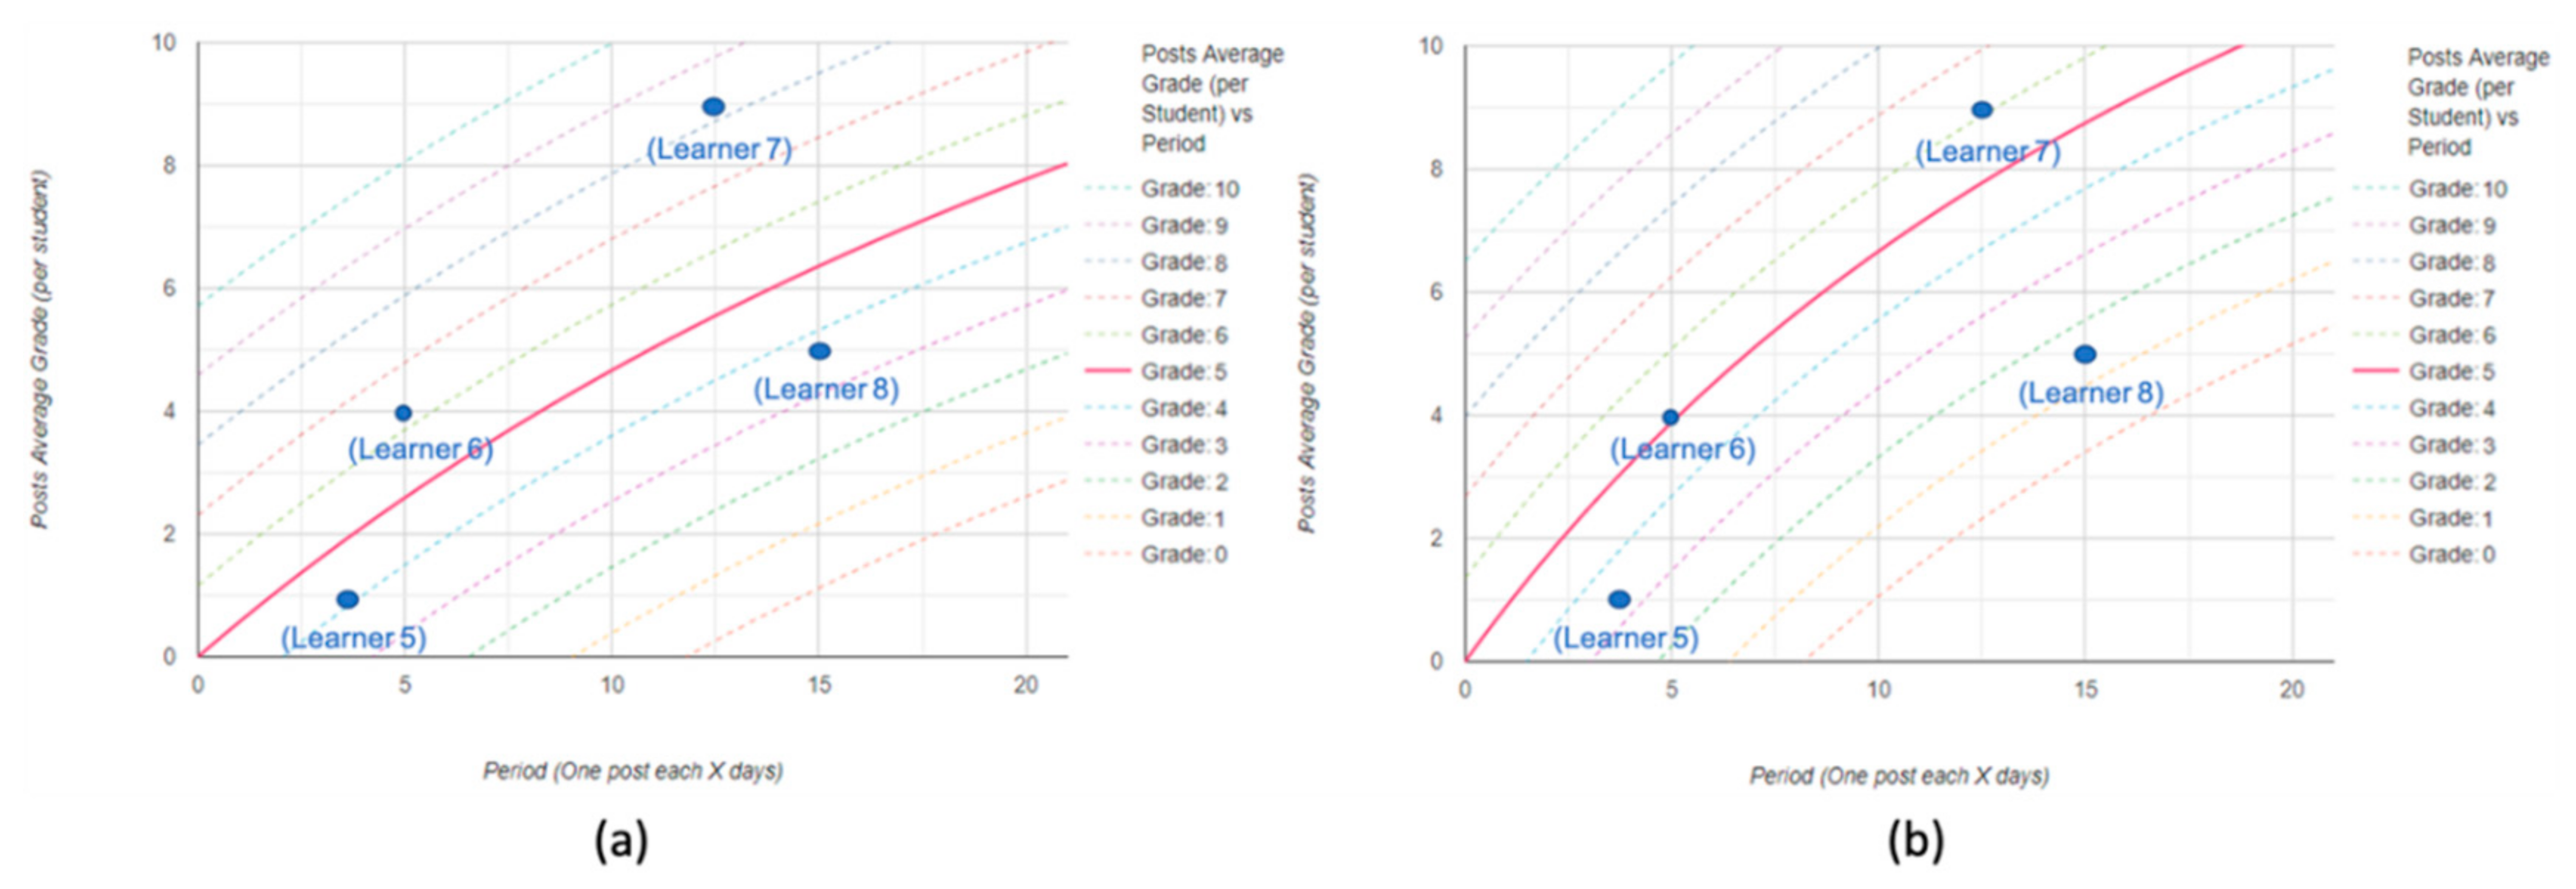
B refers to the required interaction in the forum and considers the relevance of the posts sent by the learners (
Post Average Grade—y-axis) and their number (
Period—x-axis). This parameter affects inversely so that a lower value of
B means a higher general implication required to get the same grade. Graphically,
B increases or decreases the curvature of
f(
x), as it can be seen in
Figure 4 where
Figure 4a corresponds to a higher value of
B (lower general interaction required), while
Figure 4b corresponds to a lower value of
B (higher general interaction required).
C refers to the posting period in the forum required and takes into account the number of posts sent by the learner (
Period—x-axis). This parameter also affects inversely, so that a lower value of
C means that a higher number of posts is required to get the same grade. Graphically, C moves
f(
x) to the left or right, as it can be seen in
Figure 5, where
Figure 5a corresponds to a lower value of
C (lower number of posts required), while
Figure 5b corresponds to a higher value of
C (higher number of posts required).
The formula that defines
f(
x) depends on four parameters (
A,
B,
C, and
D) that the instructors can adjust, and that determine the grade that each learner will receive as a result of the contributions to the course forum. In addition, once this grade is calculated it would be possible to add some extra points, as indicated in
Table 3, also at the discretion of the instructors to reward exceptional situations.
4. Web Application
This section presents the web application designed and developed to implement the grading algorithm as well as additional visualizations with the results of applying the algorithm on learners taking a MOOC. The web application is built upon the open-source tool developed by Moreno-Marcos et al. [
6], which already showed some general visualizations regarding the use of the course forum in edX/Open edX MOOCs. Therefore, this web application is compatible with the data format of the edX/Open edX MOOC platform, although it could be extended to be compatible with the data format of other MOOC platforms. The web application receives as input a file with the forum events from MOOCs offered in edX/Open edX. This file is obtained after pre-processing the tracking logs of the MOOC, which typically contain many more events, including learners’ interactions with videos, and activities. The file uploaded to the web application contains data related to the creation of messages (threads, responses, and comments), as well as other events that refer to indicators presented in
Table 2, such as votes, followers, or endorsements.
The design of the web application follows the MVC (Model-View-Controller) software design pattern [
46]. The model refers to the data structure, which contains the events from the course forum after pre-processing the tracking logs from the MOOC. The controller processes the data according to the grading algorithm and the parameters set by the instructor, calculating the grade for each of the learners. The view represents the results in the web browser through visualizations, allowing instructors to download these results. The development of the web application has been done using the Java Servlet Container Apache Tomcat, which provides a web server to run web applications. Additionally, the Java programming language has been used to develop the servlets, JSP (Java Server Pages) has been used for the web page, with CSS and JavaScript, including the Google Charts library for the representation of graphs. Finally, the data file is in JSON format.
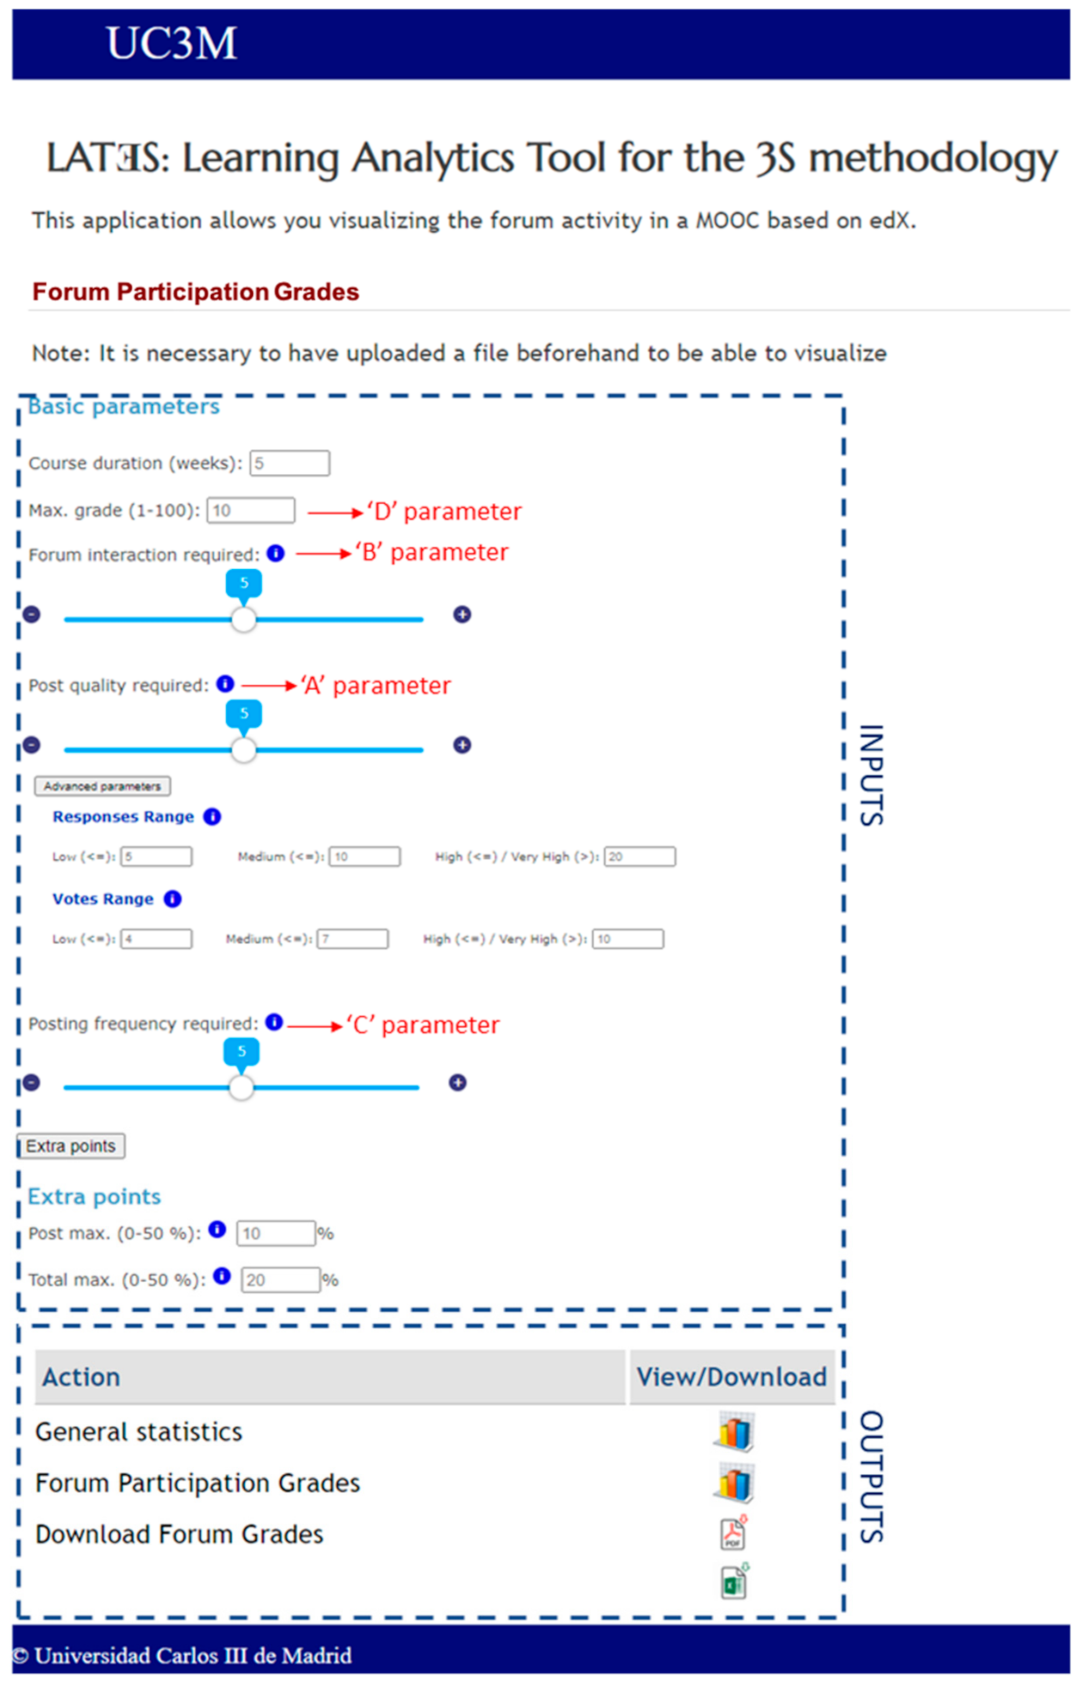
Figure 6 shows a screenshot of the web application with the functionality that has been added to the tool by Moreno-Marcos et al. [
6]. This new functionality is divided into two parts, (1) inputs, where instructors can configure the parameters of the algorithm, and (2) outputs where instructors can see the grades calculated according to the algorithm and download them.
4.1. Inputs
This part contains the different input values to be provided by instructors before running the grading algorithm, and according to the particularities of their MOOC. These input values serve to adjust the point
P(
x,y) that corresponds to each specific learner, and also the curve
f(
x) on which the Euclidean distance between the point
P(
x,y) and the closest point to the curve
f(
x) will be calculated to get each learner’s grade. The section “Basic Parameters” contains as inputs: the course duration in weeks (which affects the x-component in
P(
x,y)); the maximum grade that a learner can get (which corresponds with parameter
D and affects the y-component in
P(
x,y) and
f(
x)); the forum interaction required (which corresponds to parameter
B); the relevance required (which corresponds to parameter
A), with some advanced parameters to set the four ranges in the number of votes and replies (direct quantifiable indicators in
Table 2); and the posting frequency required (which corresponds to parameter
C). In addition, it is possible to configure the extra points in this part, including the optional points in
Table 2 (Post max.), and the extra points added at the end as indicated in
Table 3 for the posts with more votes/replies (Total max.).
4.2. Outputs
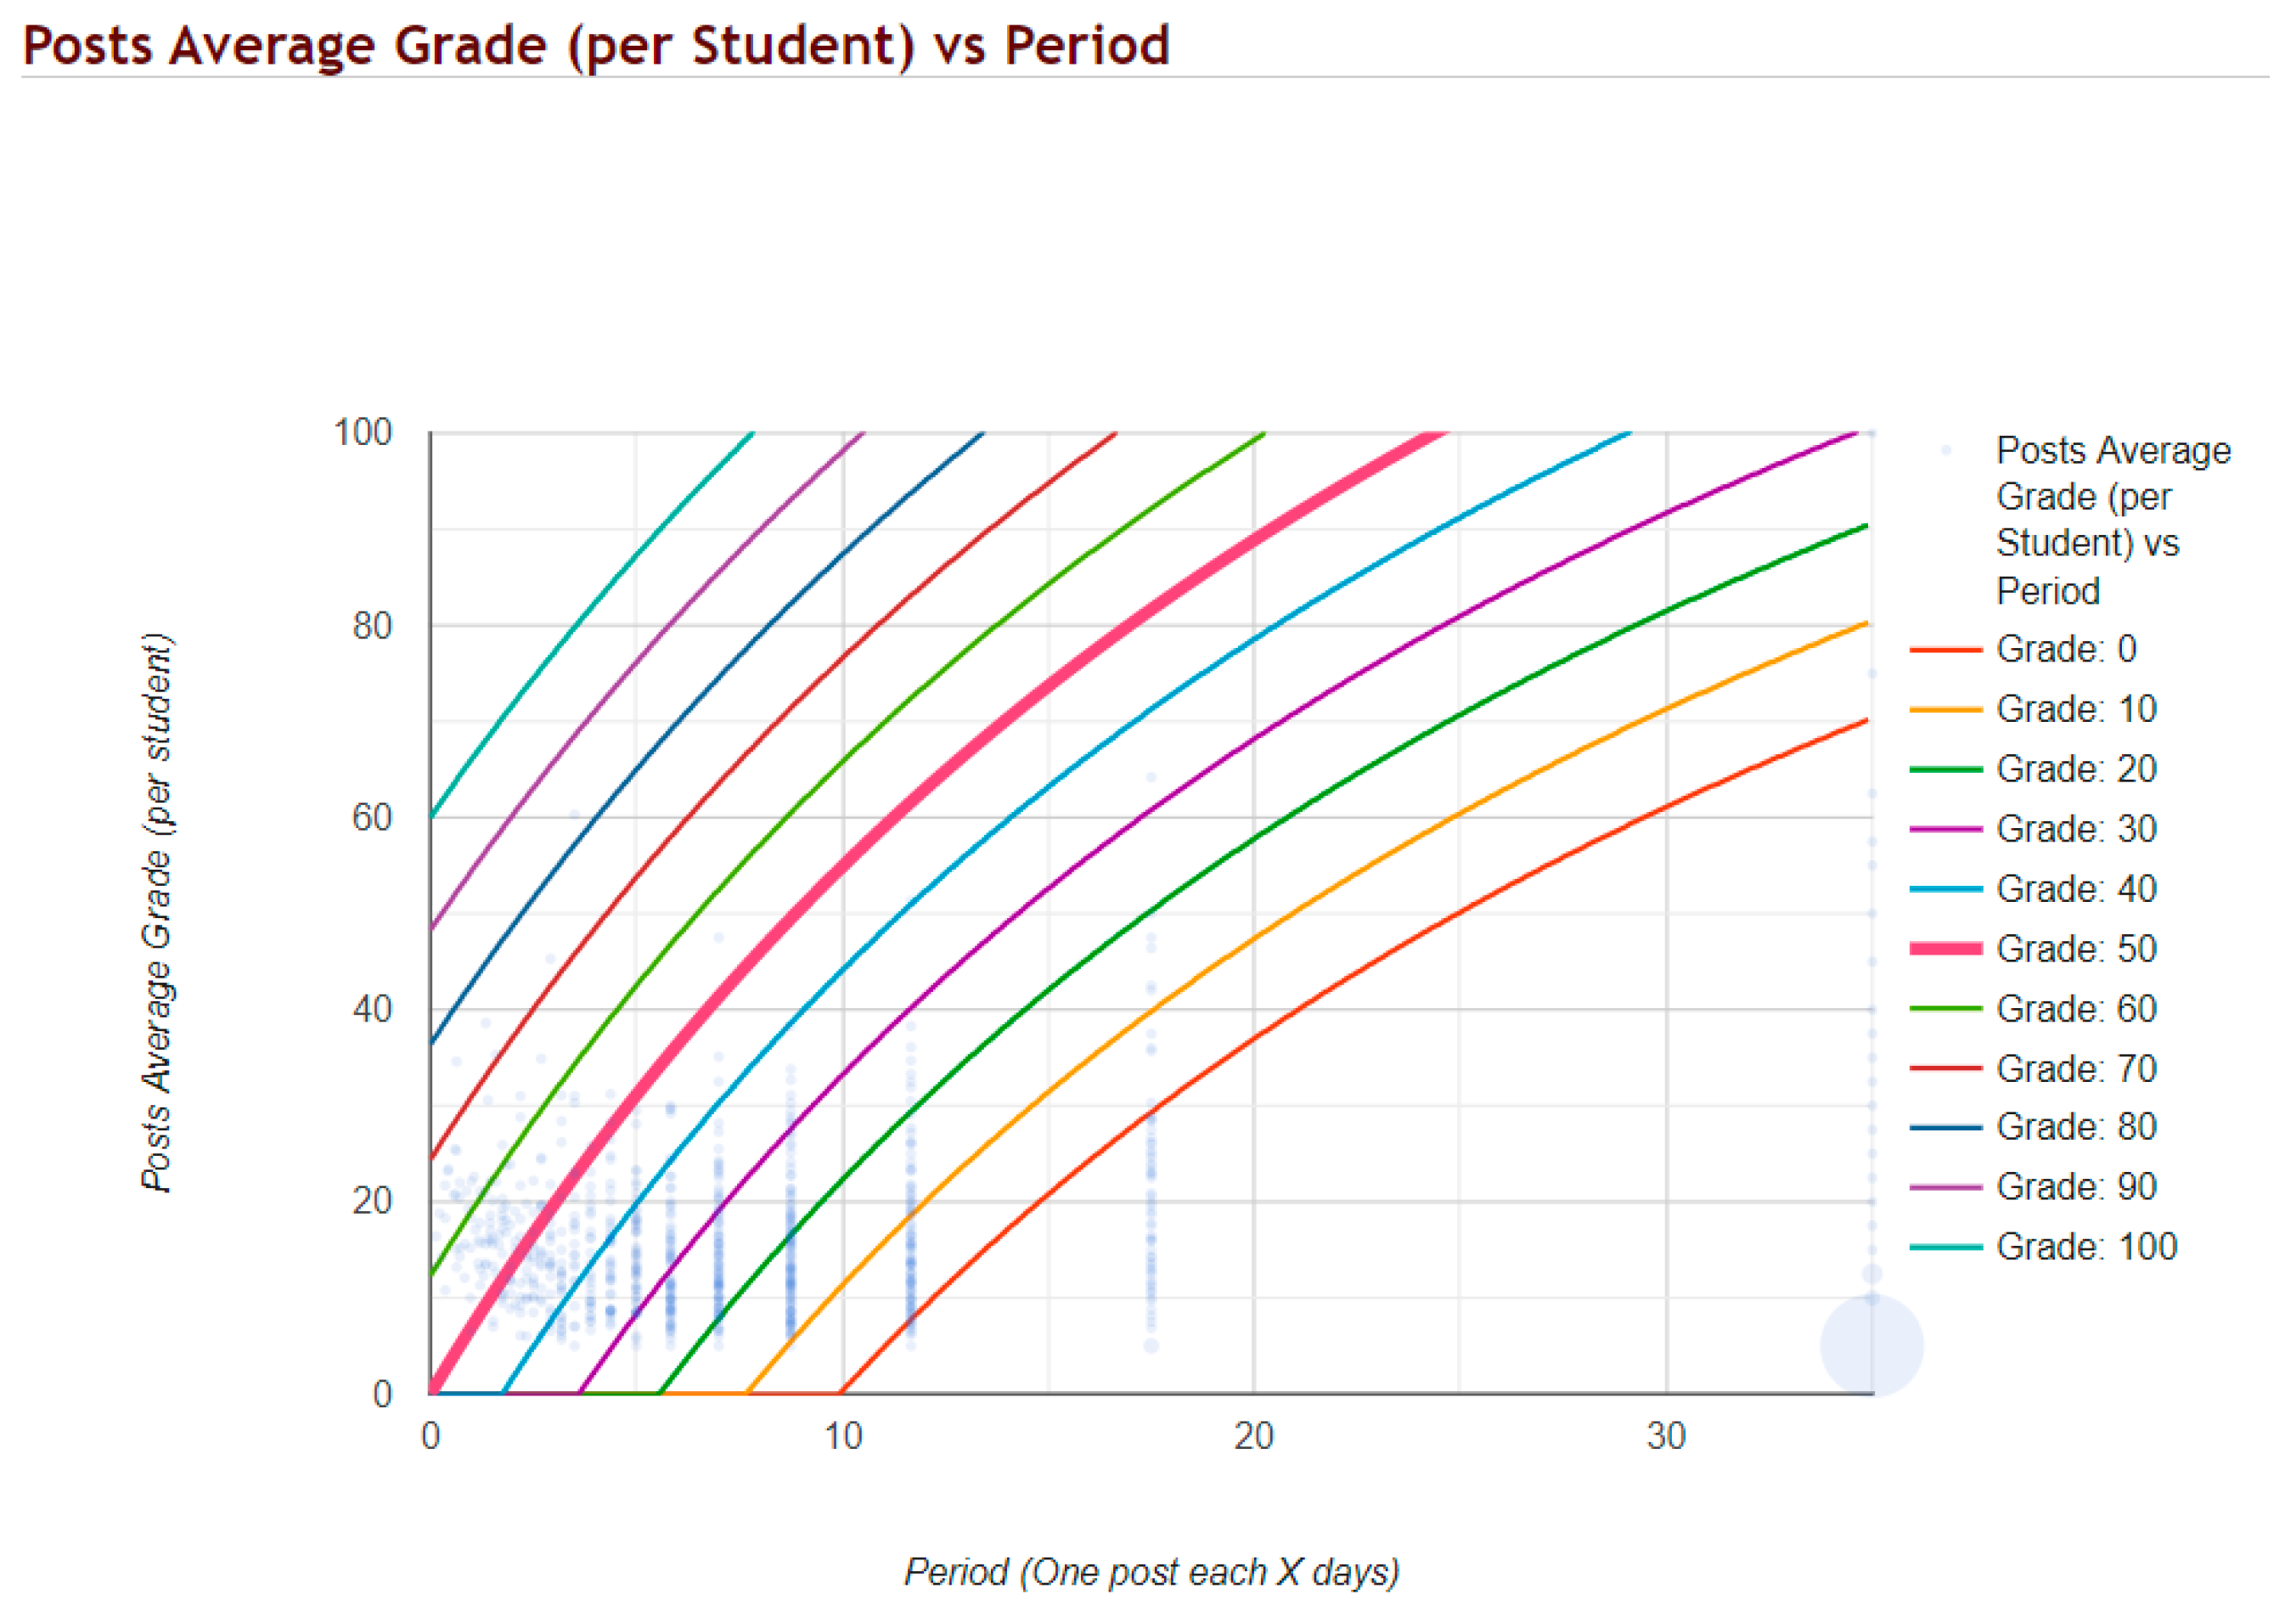
This part contains three features: (1) General Statistics; (2) Forum Participation Grades; and (3) Download Forum Grades. First, General Statistics shows a graph with the calculation of
f(
x) for the indicated input values plus other lines representing points of equal value (e.g.,
f(
x) for Grade 50 and other lines for grades between 0 and 100 in scales of 10) (see
Figure 7). In addition, each learner is also represented with a point on the graph, increasing the size of that point if several learners get the same value for
P(
x,y). For example,
Figure 7 shows a large point in the lower right corner representing a high number of learners who only sent one single not very relevant message (typically opened a new thread in the forum to post a presentation message); this graph does not include the possible extra points defined in
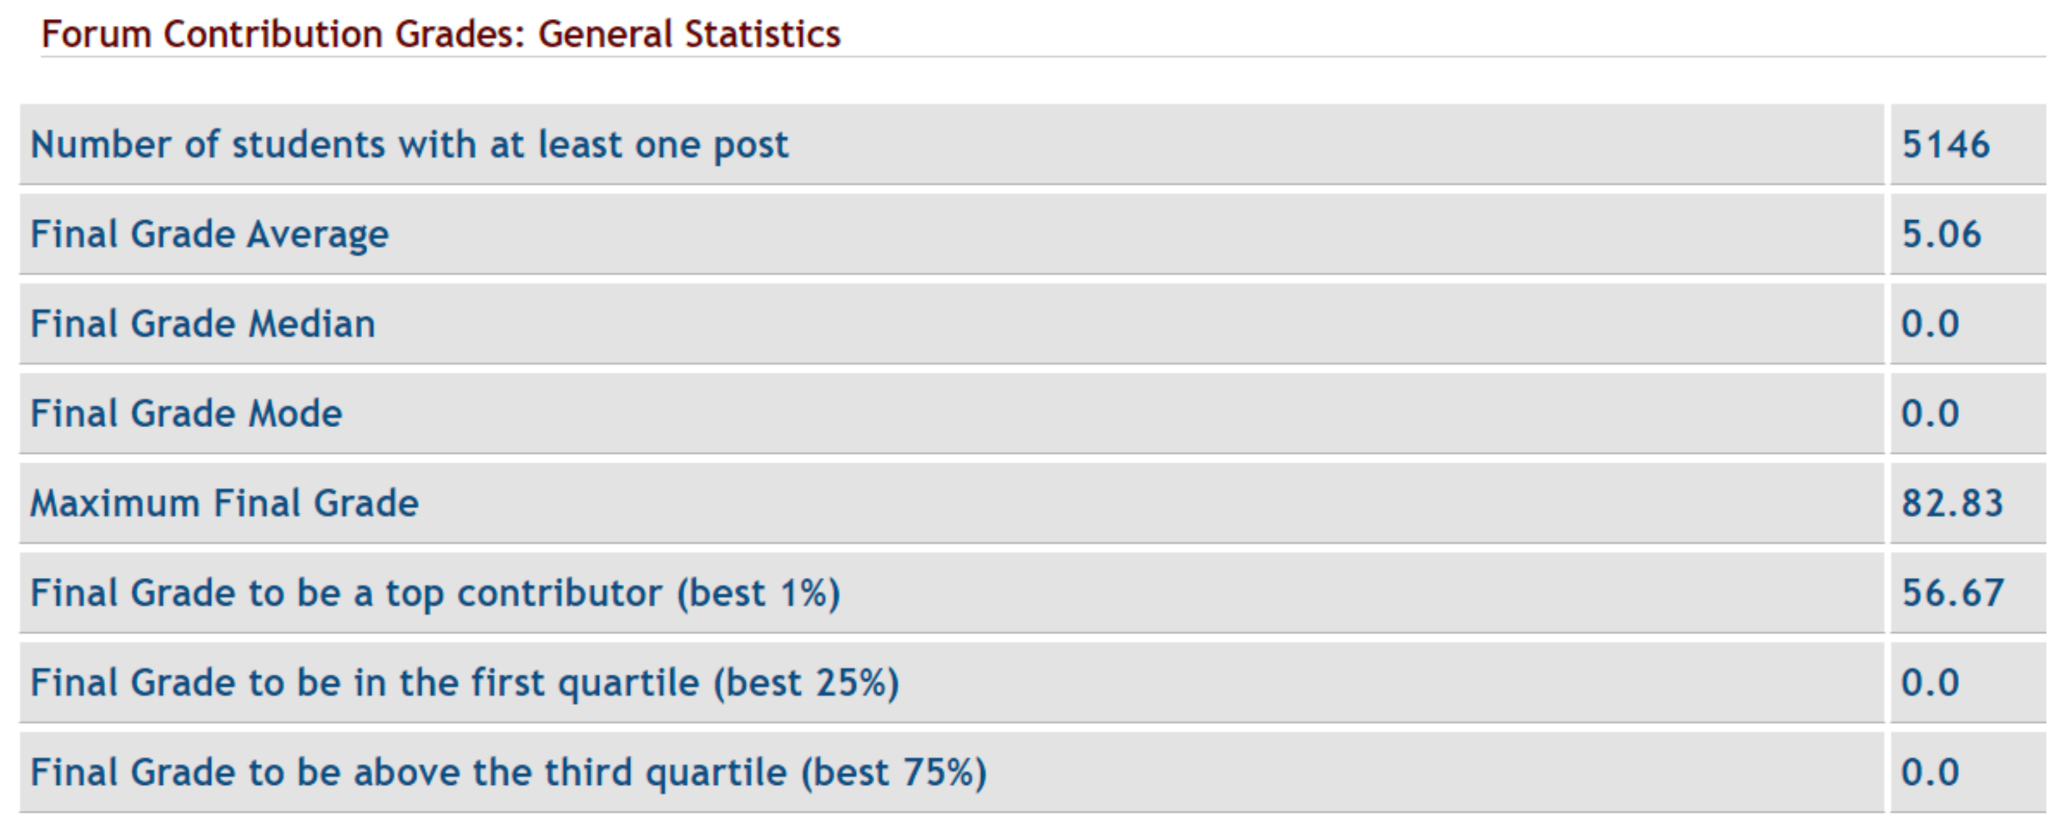
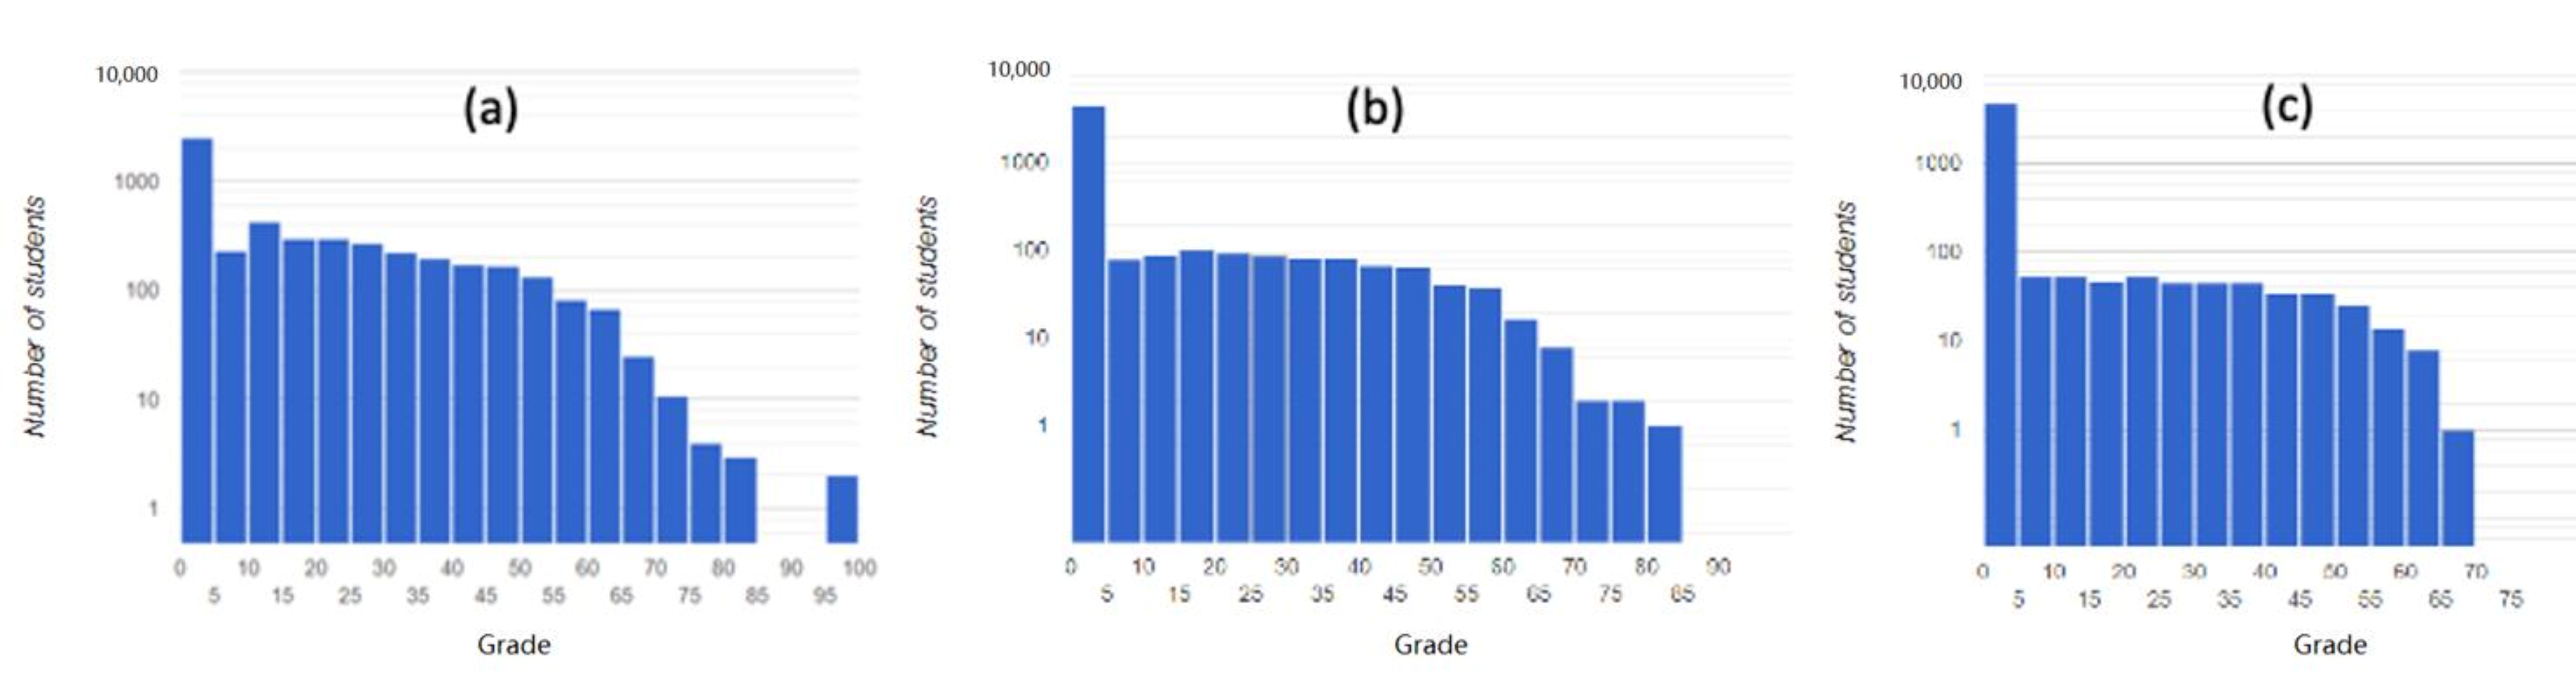
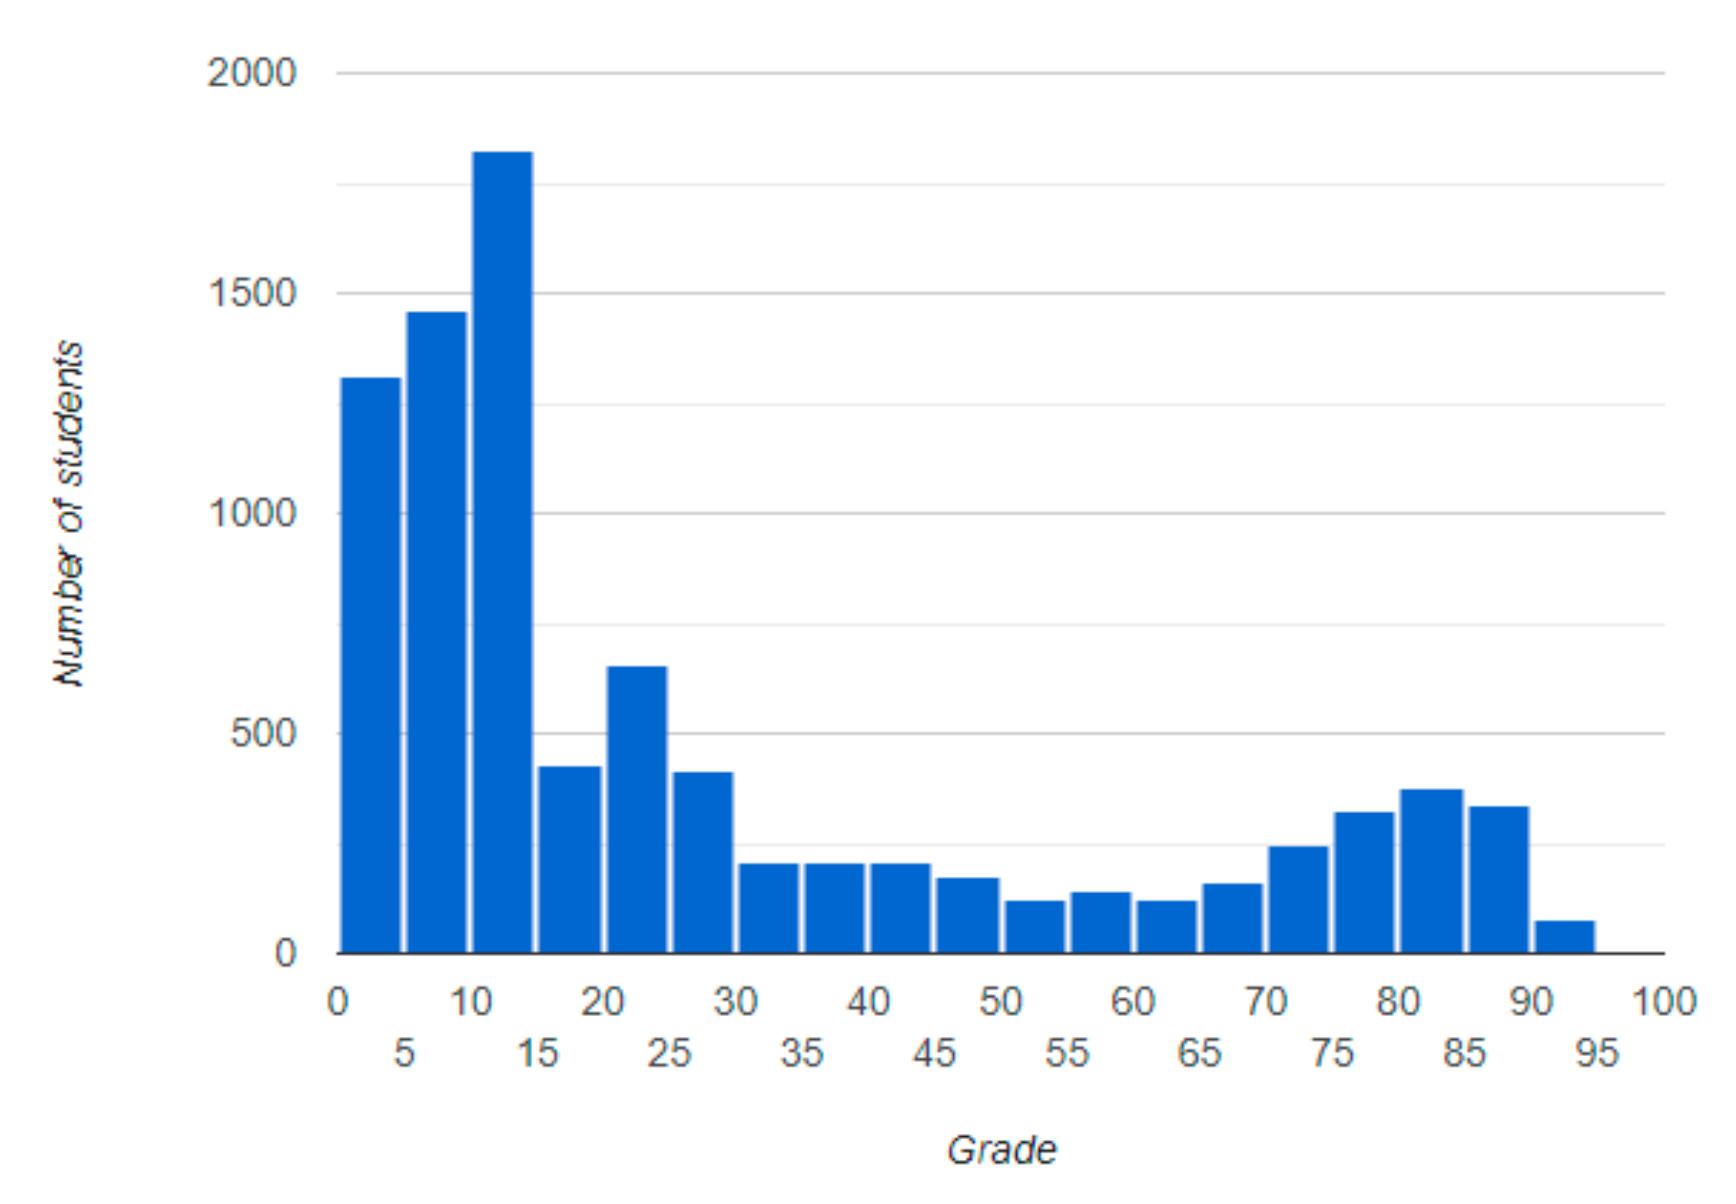
Table 3 General Statistics also contain a histogram with grades distribution (either in linear or logarithmic scale), and a summary table with basic statistics: average, median, mode, quartiles, or the grade to be a top contributor (best 1%) [
30], as it can be seen with an example in
Figure 8.
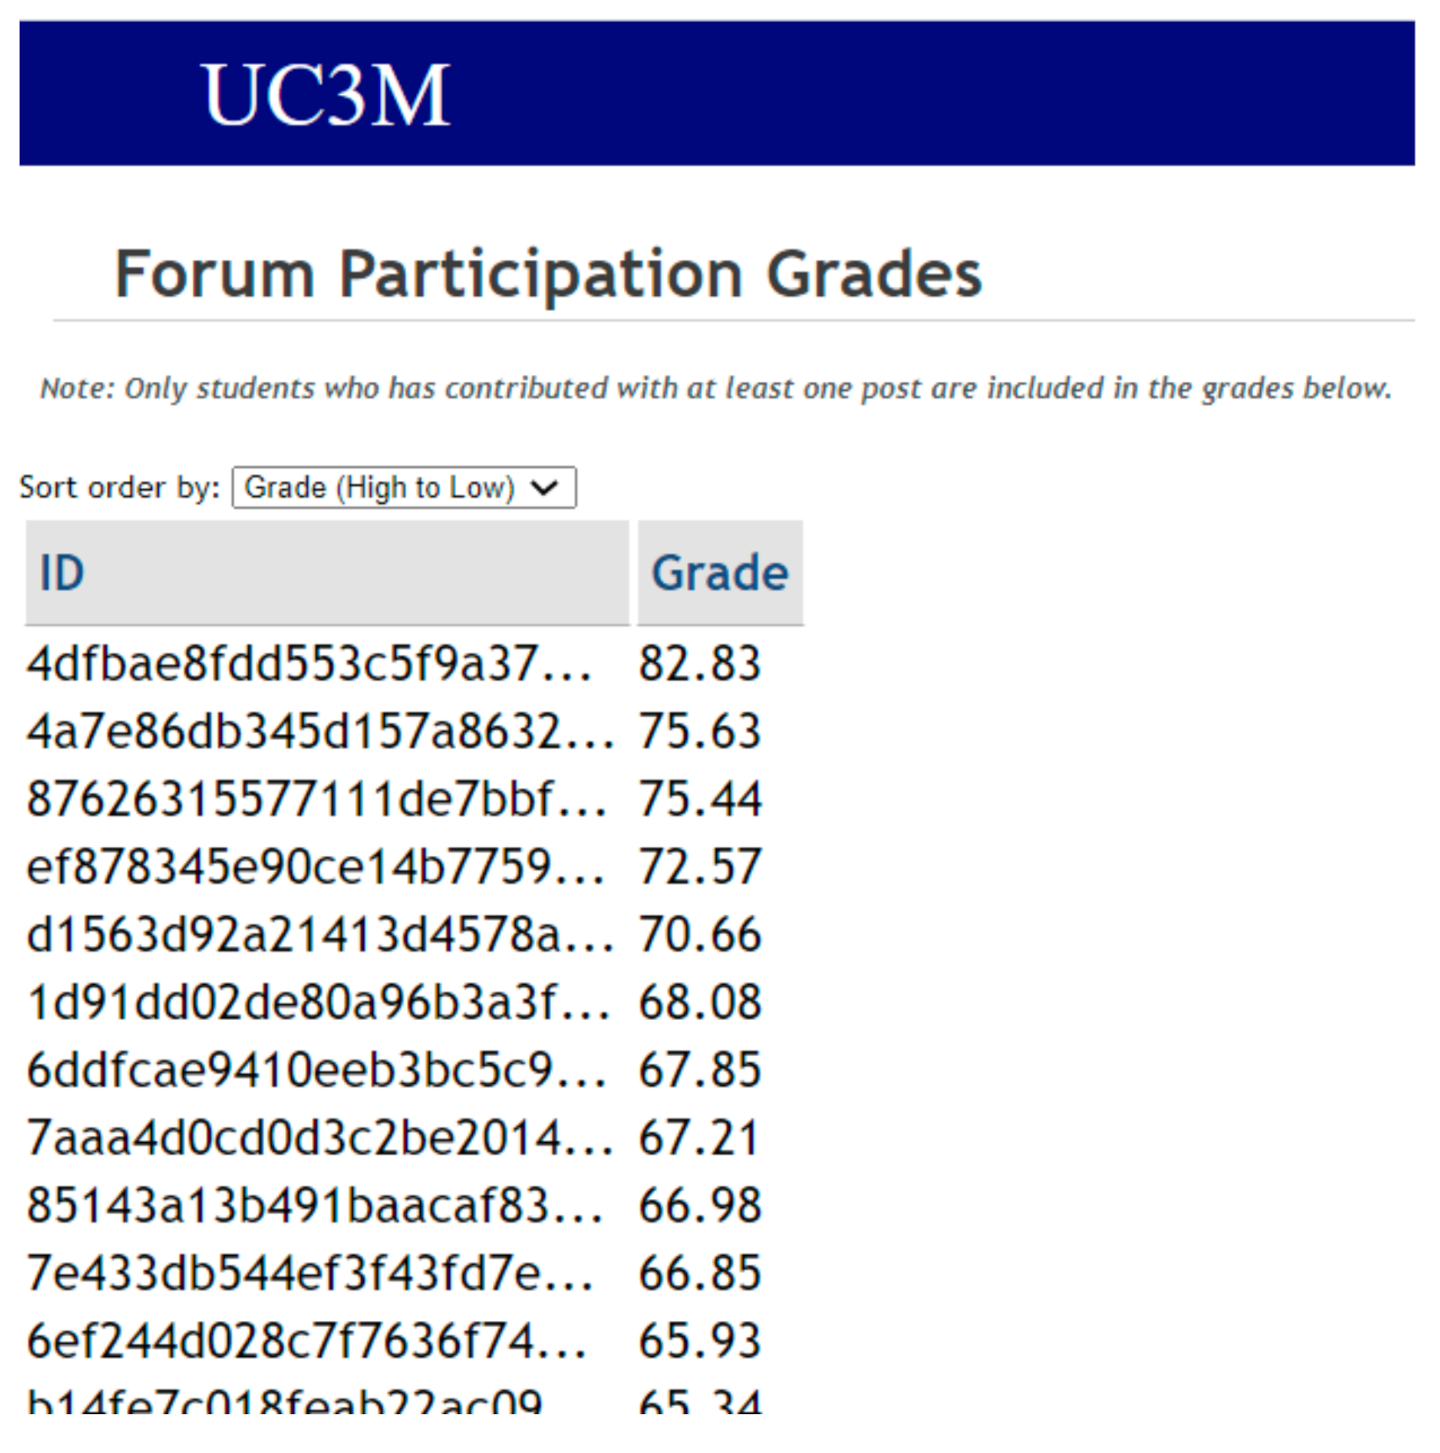
The option Forum Participation Grades shows a table with the list of learners in the MOOC (using pseudonymized identifiers) and the grade they got in the forum calculated according to the grading algorithm and input values provided by instructors (see the example in
Figure 9). The list with the forum grades can be downloaded (option Download Forum Grades) in two formats, .pdf and .xlsx (Excel file).
7. Discussion
The results have served to assess the grading algorithm and the web application through three scenarios with different input parameters, and with data collected from a real MOOC, in which the role of the forum was not a priority and served only to have a shared space for questions and answers. It is important to note that this exploratory analysis has been done after the MOOC was completed, so no interventions could be made to encourage the use of the forum by the learners. It should be noted that while completion rates in MOOCs are typically very low (usually around 5–10%) [
50], the use of the course forum might be even lower [
11,
51], although it may be interesting for instructors to take into account learners’ dedication to the forum as part of their grade. It is also important to bear in mind the possible side effects of grading learners based on their use of the forum. On the positive side, faster response times and larger numbers of responses per post could be obtained, as already demonstrated when including a reputation system associated with a MOOC forum [
52]. On the negative side, an artificial or unnecessary use of the forum could happen in the case of learners who simply want to gain more points. For example, if learners are informed about the input parameters used by the algorithm, they might decide to write longer messages, or agree with other colleagues to upvote/follow certain messages. Considering the use of the forum in learners’ final grade (and if so, the weight assigned and the values of the input parameters) is a decision that should be made by the instructors of the MOOC depending on the purpose of the course, especially if the instructors want to foster the discussion among learners. In any case, forum grades add new possible ways of “gaming the system” since students might want to increase their grades artificially and this can be a promising future research direction to complement the present literature on “gaming the system” [
17,
18].
Regarding RQ1, the results have disclosed a moderate positive correlation between the grades obtained through the grading algorithm and summative assessment activities although this correlation depends on the input parameters of the algorithm and decreases as the requirements increase. These results are consistent with those from Brooker et al. [
29], who also obtained a positive correlation coefficient between final grade and use of the forum. He et al. [
11] pointed out that learners who participate in the MOOC forum have better performance (in terms of final grades) than those who do not. Similarly, Velo Beascoechea et al. [
10] reported in another example MOOC the relationship between posting multiple times in the forum and passing the course. In this sense, and as part of this research question, the effect of the so-called top contributors or “superposters” [
30,
31] has also been studied, obtaining a similar correlation, but in this case higher in the scenario with higher requirements. However, the relationship between posting on the forum and getting good grades on the summative evaluation activities is not a two-way relationship. In this MOOC, 92.6% of learners who got more than 60 points out of 100 in their forum grade (average requirements) also passed the course according to the summative assessment activities, while from those who passed the course only 3.1% of learners got more than 60 points out of 100 in their forum grade. It is important to note that unlike previous related publications that analyze the relationship between course grades and contributions in the forum of the MOOC, this research work takes into account not only the quantitative dimension of the messages published in the forum but also their relevance. Moreover, this exploratory analysis did not aim at achieving a very high correlation, since then the forum grade would be redundant, but to try to understand the relationship between the grades obtained through the grading algorithm and summative assessment activities depending on the input parameters of the grading algorithm.
Regarding RQ2, results show that while there can be a moderate positive correlation between forum grades and those obtained from summative assessment activities, this may not be enough to use forum grades as predictors of course grades. The R2 obtained using linear regression was low regardless of the requirements used for the forum grades and the predictive power obtained with all the algorithms suggested that forum grades added little value to the predictive models, considering what other variables (e.g., activity with videos and formative exercises) can achieve [
33]. This result is consistent with other previous publications in the literature (e.g., [
32] and [
53]), which used other variables related to forum activity without achieving a strong predictive power with them. While this may vary if the forum activity is higher, this result may suggest that predictive models may need to focus on other variables. This particularly happens if the requirements are not properly set, as the predictive power can also vary depending on the requirements and it can be lower if the demands are so high for the learners. Despite having low predictive power of forum grades, these results can also entail that forum grades add a different perspective compared to those grades obtained from summative assessment activities and these results can also be valuable for instructors to better understand the learners’ behavior in the MOOC. Moreover, if forum grades were used as part of learners’ final grade in the MOOC, learners could also develop cross-curricular skills related to the proper use of the forum that could enrich the overall experience of taking a MOOC.
8. Conclusions and Future Work
This article has presented an automatic grading algorithm for learners’ contributions in MOOC forums, and a web application that implements the algorithm, giving instructors the flexibility to adapt the algorithm to the characteristics of their MOOC and desired behavior of learners in the course forum. For example, there may be MOOCs that do not require any kind of interaction on the forums and where this algorithm does not need to be used. There may be MOOCs in which instructors decide to reward learners’ contributions in the forum with some extra points (calculated with the proposed algorithm) that are added to learners’ final grade. There may be MOOCs where the instructors’ expressed desire is to encourage discussion and debate in the forum in order to create a learning community, and therefore, where the proposed algorithm and web application are helpful to automatically calculate learners’ forum grade. The algorithm considers both the quantitative dimension and the relevance of learners’ contributions and has been particularized for the case of the edX/Open edX MOOC platform. The web application runs the algorithm, allowing instructors to adjust the input parameters, and providing a visual and a numerical representation of the grade for each learner. An explorative study has also been carried out with data collected from a MOOC on programming, proposing three scenarios with different input parameters for the algorithm. The results show the existing moderate relationship between the forum grades obtained through the algorithm and the course grade obtained in the summative assessment activities of the MOOC, although forum grades did not turn out to be good predictors of the course grade.
This work is not without its limitations. The first limitation is that the relevance of forum messages has been measured employing a series of direct quantifiable indicators. Some of these quantifiable indicators depend on the good judgment of other people. For example, it might happen that a meaningful comment receives few responses or upvotes because of disagreements with its author or that a not very relevant message has many followers because it was sent by a popular person. The next step would be to combine these quantifiable indicators with text mining techniques that would bring another perspective to the analysis of the relevance of each message posted in the MOOC forum. For example, the analysis of specific text in forum messages could provide important information about the knowledge acquired by learners, and even on the development of certain skills. The second limitation is that the algorithm is currently based on the message structure of the edX/Open edX platform. It would be possible to extend the algorithm to work with input data from other platforms, by analyzing their forum message structure and studying the possible generalization of the algorithm. The third limitation is the nature of the exploratory analysis conducted. So far, the analysis compares forum grades with course grades based on summative assessment activities with exercises, but these two types of activities (forums and exercises) can be different and can be evaluating different skills as they were not designed to evaluate the same skills. The fourth limitation is the MOOC used. It would be possible to extend the analysis to other MOOCs designed with a higher social component with activities specifically designed to discuss in the course forum.
As future work, the evaluation could be extended. First, it would be possible to include instructors in the analysis so that these could validate the forum grade given to each learner by the algorithm. In addition, specific assessments based on exercises and others based on forums could be designed at specific moments of the MOOC to evaluate the knowledge of learners on the same topics (through both forums and exercises) and compare the results obtained about these topics.

 ,
, 


