Article

Roll-to-Roll In-Line Implementation of Microwave Free-Space Non-Destructive Evaluation of Conductive Composite Thin Layer Materials

1
Adamant Composites Ltd., Platani-Patras, GR-26504 Achaia, Greece
2
Biophysics Department, Johannes Kepler University, 4020 Linz, Austria
3
Keysight Technology Labs, 4020 Linz, Austria
4
CNRS, Centrale Lille, Université Polytechnique Hauts-de-France, Université Lille, UMR 8520—IEMN, F-59000 Lille, France
*
Author to whom correspondence should be addressed.
Appl. Sci. 2021, 11(1), 378; https://doi.org/10.3390/app11010378
Submission received: 3 November 2020 / Revised: 16 December 2020 / Accepted: 17 December 2020 / Published: 2 January 2021

Abstract

:

Featured Application

In-line implementation of microwave nondestructive testing and evaluation (MNDT&E) based on continuous wave radar operating in monostatic mode.

Abstract

A free-space microwave nondestructive testing and evaluation module is developed for the low-power, non-ionizing, contactless, and real-time characterization of doped composite thin-film materials in an industrial context. The instrumentation proposed is built up with a handled vector network analyzer interfaced with corrugated horn antennas to measure the near-field complex reflection S11 of planar prepreg composite materials in a roll-to-roll in-line production line. Dedicated modeling and calibrations routines are developed to extract the microwave conductivity from the measured microwave signal. Practical extraction of the radiofrequency (RF) conductivity of thin film prepreg composite materials doped with nano-powders is exemplary shown at the test frequency of 10 GHz.

1. Introduction

Microwave characterization techniques for the measurement of dielectric and conductive properties of materials have been widely described in the literature [1,2]. In particular, free-space methods have the advantages of being nondestructive and contactless [3,4]. The general set-up consists of a pair of directive antennas associated to a vector network analyzer (VNA) to measure the free-space S-parameters of planar materials positioned in the trajectory of the radiated beam assuming far-field conditions [5,6]. From the calibrated microwave signals in the material reference planes, the complex permittivity can be determined after modelling of reflection at the air—material interface and the propagation in the material. Consequently, the accuracy in the extraction of the complex permittivity depends on the hardware resources but also on the mathematical modeling adopted to express the measured S-parameters as a function of the geometry and the physical properties of the material under investigation. Most of the works reported in the literature are related to the development of free-space techniques assuming a transverse electromagnetic mode (TEM) model of the waves propagating in the material.
Many industrial processes require an instrumentation suitable for contactless methods and real-time on-line monitoring and control. Although microwave free-space techniques present features to address non-ionizing and low-power microwave nondestructive testing and evaluation (MNDT&E) applications in an industrial context, its transposition in an industrial context still remains a challenge [7,8]. The use of focusing horn-lens antennas are not suitable as the material under test is usually one-sided. Consequently, a monostatic (reflection mode) free-space technique is the most viable solution to be considered. At microwave range, i.e., 300 MHz–30 GHz, the moderate directivity of traditional horn antennas is not in favor for operating in the far-field. Indeed, free-space propagation losses and spatial resolution are function of the stand-off (distance between the antenna aperture and the material plane). As conductive thin-film composite materials are mainly reflective objects with negligible propagation in the bulk materials, by properly calibrating the free-space set-up, the stand-off can be drastically reduced to benefit from both spatial resolution and high signal to noise (SNR). In Section 2, the production line of Adamant Composites FXply™ prepregs is presented together with the implementation of the microwave free-space nondestructive module. At our test frequency set to 10 GHz, the far-field region is around 4 m. Consequently, running the system in conventional TEM mode is not possible as the distance separation between antenna aperture and material is too big. The electromagnetic beam will not be entirely intercepted by the material and the signal to noise ratio (SNR) will be too low. Consequently, the antenna operates in the near-field region where the propagation of the waves is difficult to model. Consequently, electromagnetic modeling and dedicated free-space calibration procedure are derived for the extraction of the complex permittivity of the material under investigation from the measured microwave signals. In particular, we demonstrate that the conventional calibration procedure can be applied in the near-field region to recover the complex reflection in the reference plane of the material. In Section 3, test materials are prepared to qualify the radiofrequency (RF) instrumentation proposed. Experimental results related to the measurement of the conductivity at 10 GHz of the test materials after calibration are demonstrated. The penetration of microwave techniques in industry is mainly limited by the use of sophisticated equipment commonly found in research laboratory. To resume, the objective of the paper is to consider simple test bench, perform calibration in the reference plane of the material (the calibration is available only around the reference plane) and apply it for RF conductivity measurements.

2. Materials and Methods

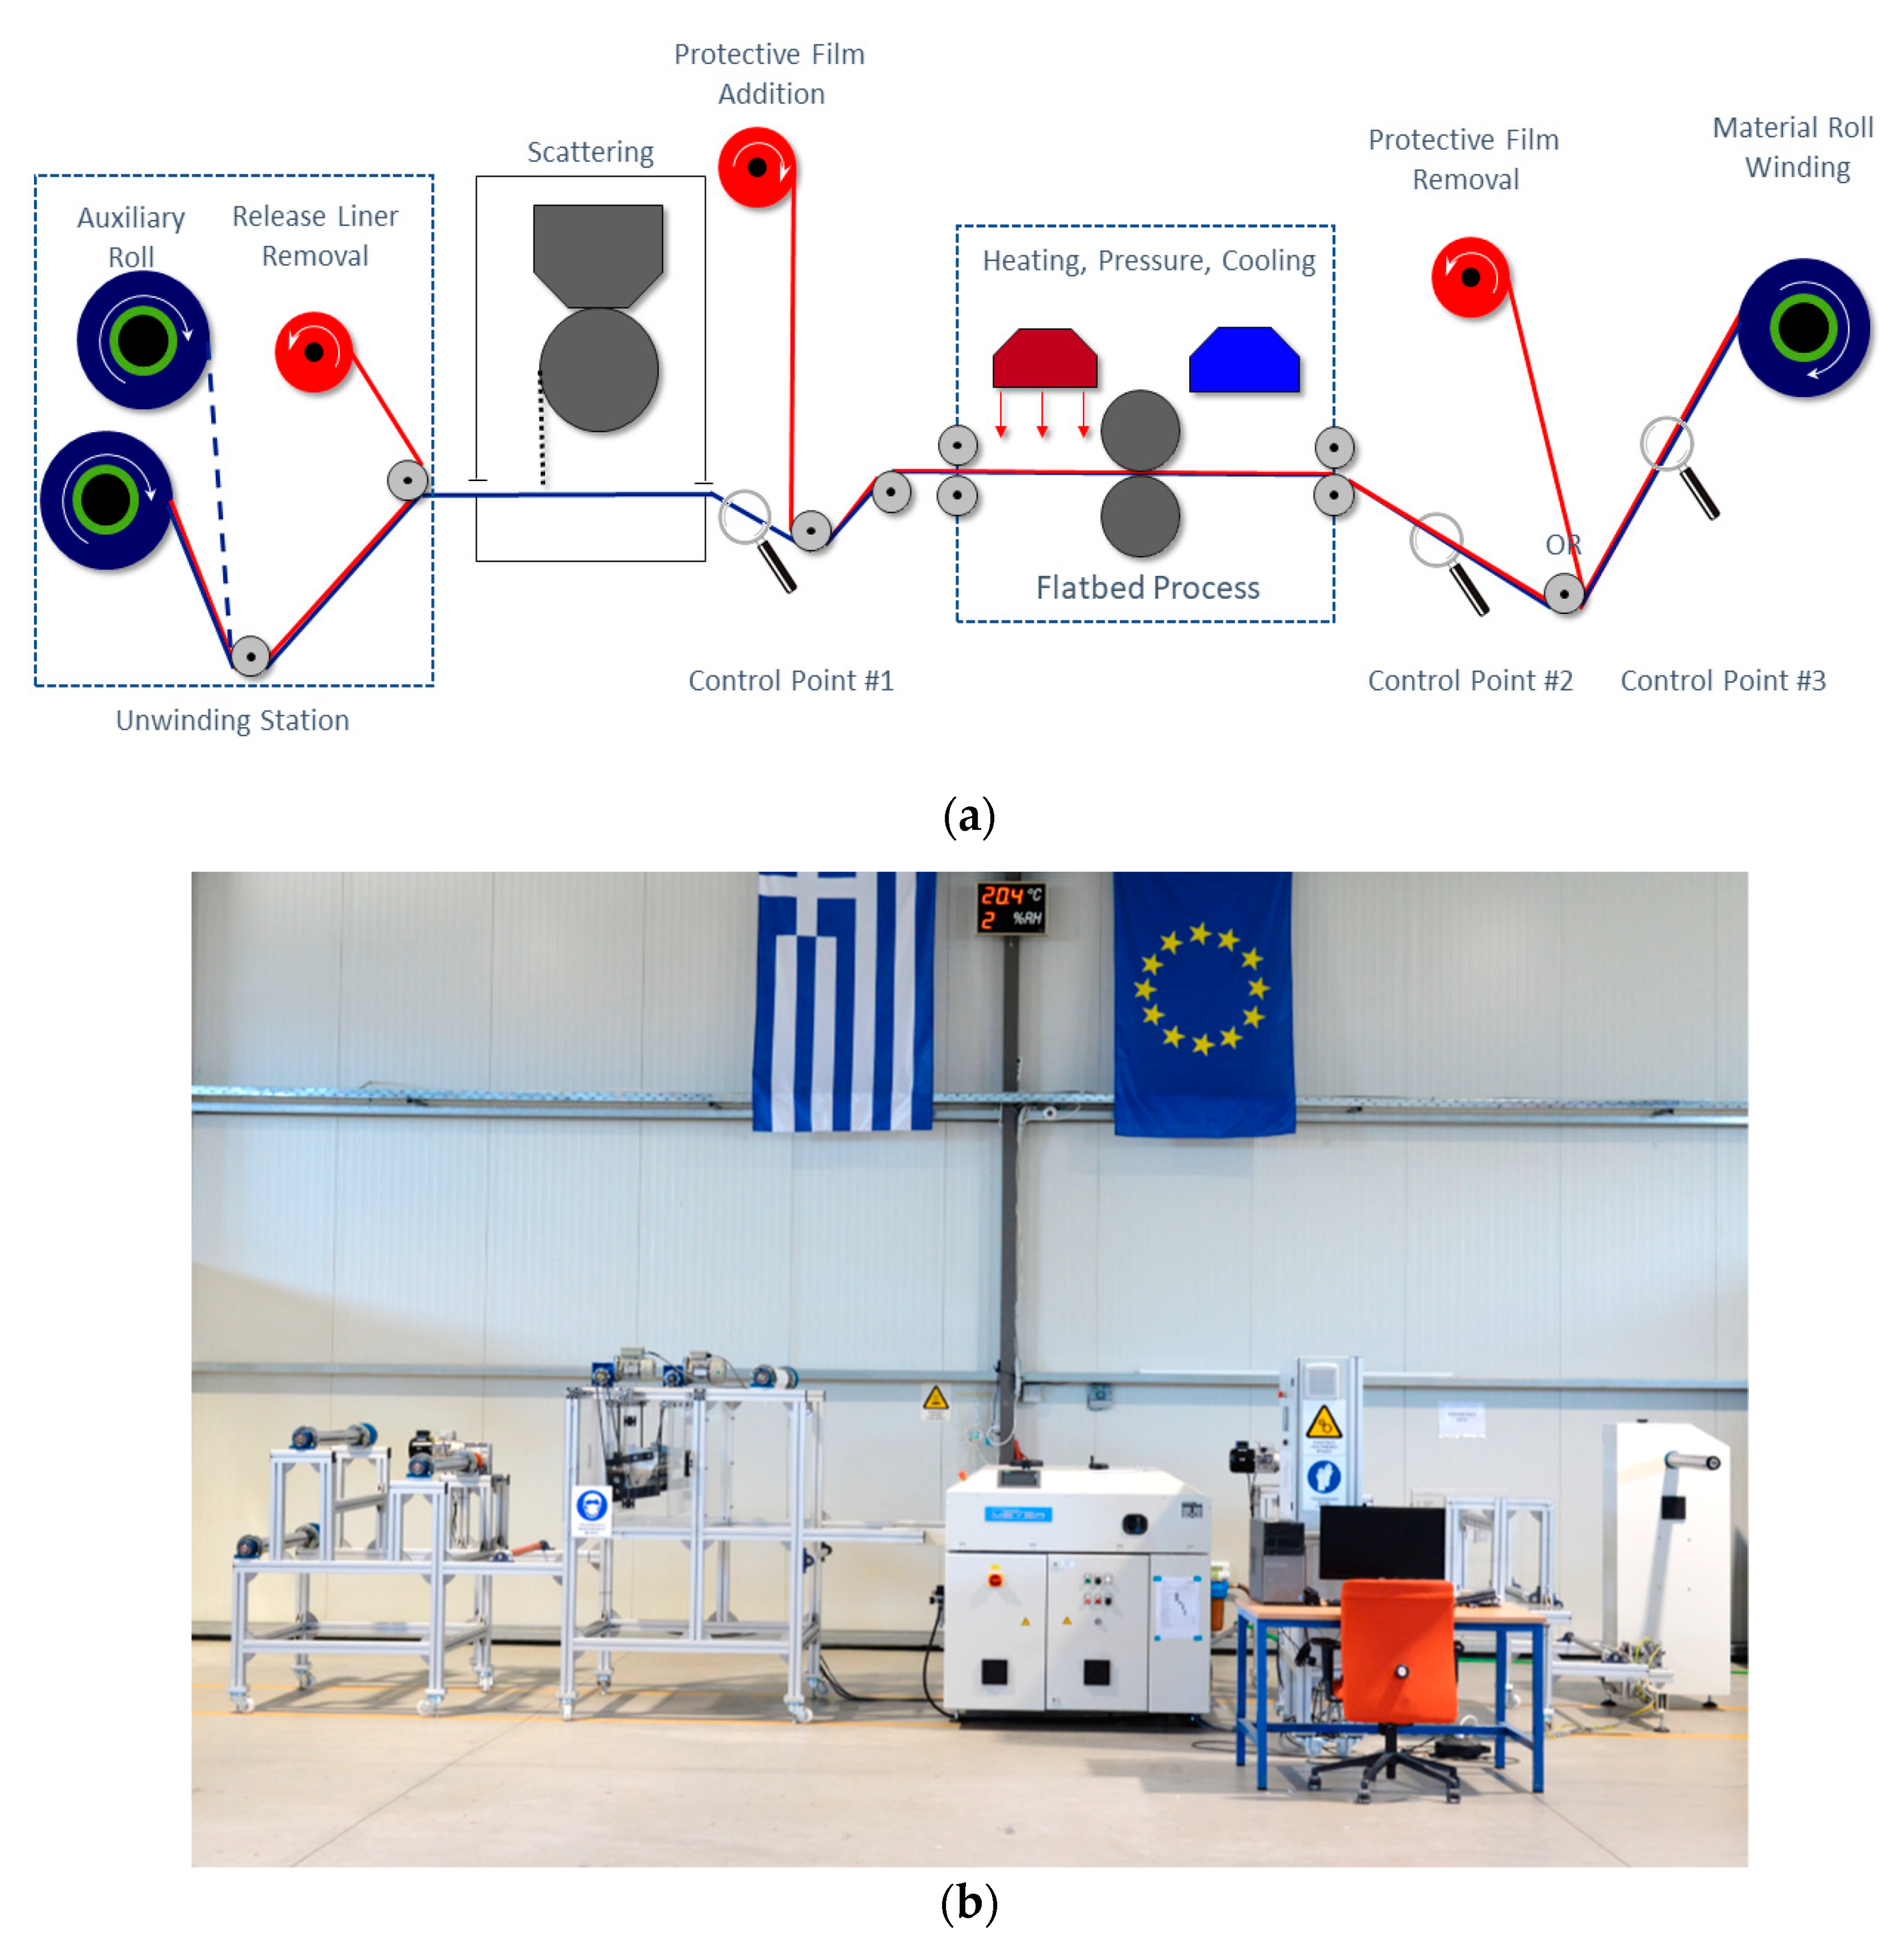
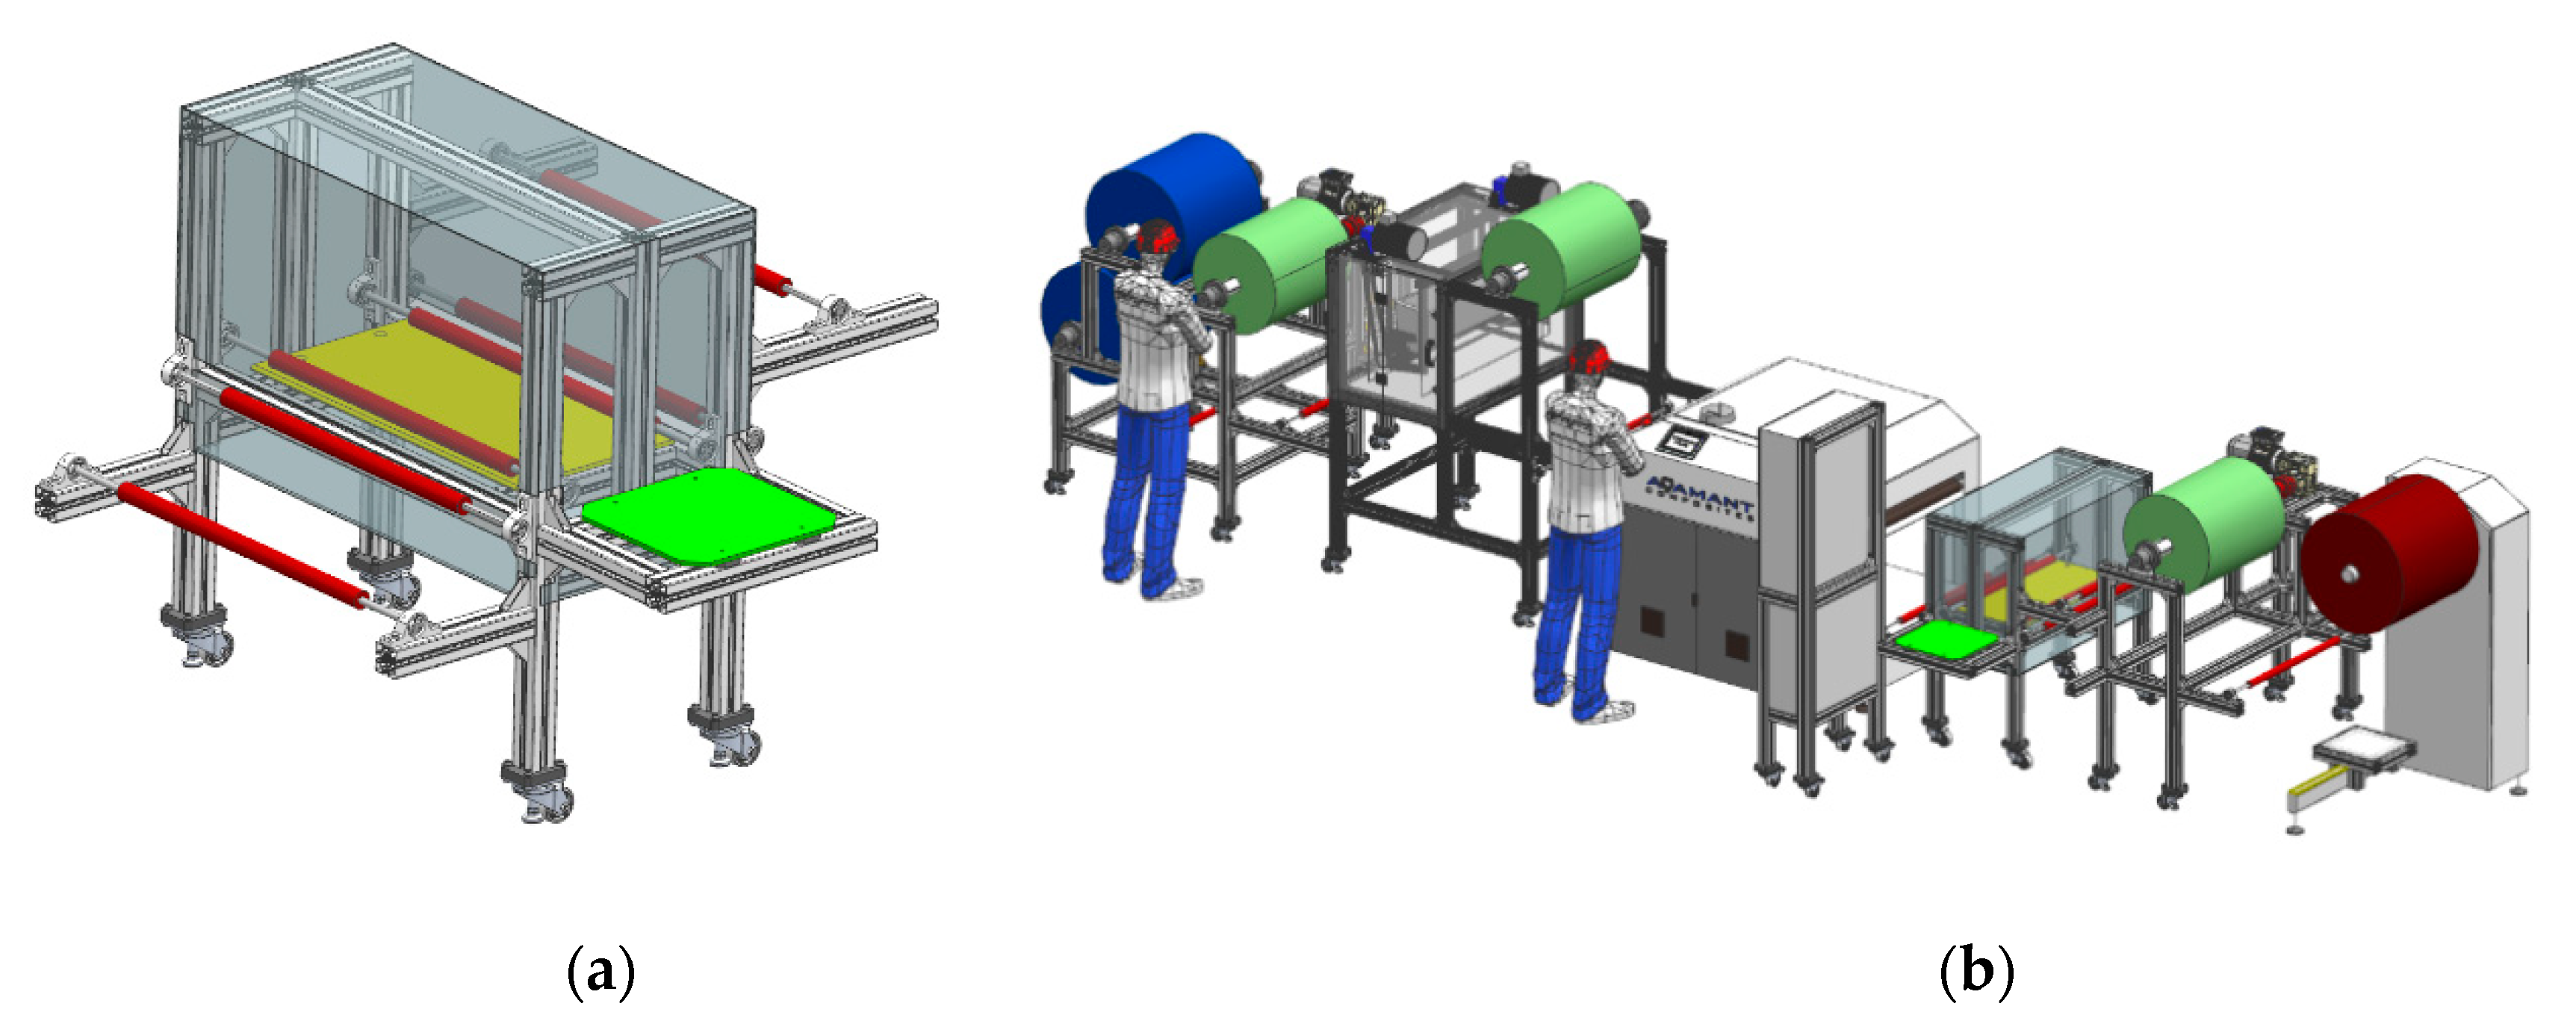
2.1. Adamant Composites Production Line for Prepreg Composite Materials

To address Aerospace’s and not only ever-increasing demands from the properties of the materials used, Adamant Composites has proposed a method to enhance prepreg materials, which already exhibit extraordinary specific properties [9]. Based on this method, Adamant takes into advantage the unmatched electrical, thermal, and impact properties of various nanomaterials by integrating them into prepreg materials by a novel manufacturing process. The effort to industrialize this process led to the implementation of the roll-to-roll (R2R) pilot line for the production of functionalized prepregs (Figure 1).
Following the manufacturing process used in the R2R pilot, a commercial prepreg in the form of a roll is positioned at the “Unwinding Station” (the beginning of the line) to retrieve a roll of functionalized prepreg at the “Winding Station” (the end of the line). The dopants have the form of a micro-powder, which is deposited by a scattering process at a specific amount on the prepreg substrate. Then this micro-powder is firmly integrated into the prepreg with the help of the temperature and the pressure of the “Flatbed Process”. The final product can either have or not have an extra protective film. The R2R pilot line process is based on a programmable logic controller (PLC) and its specifications are given in Table 1.

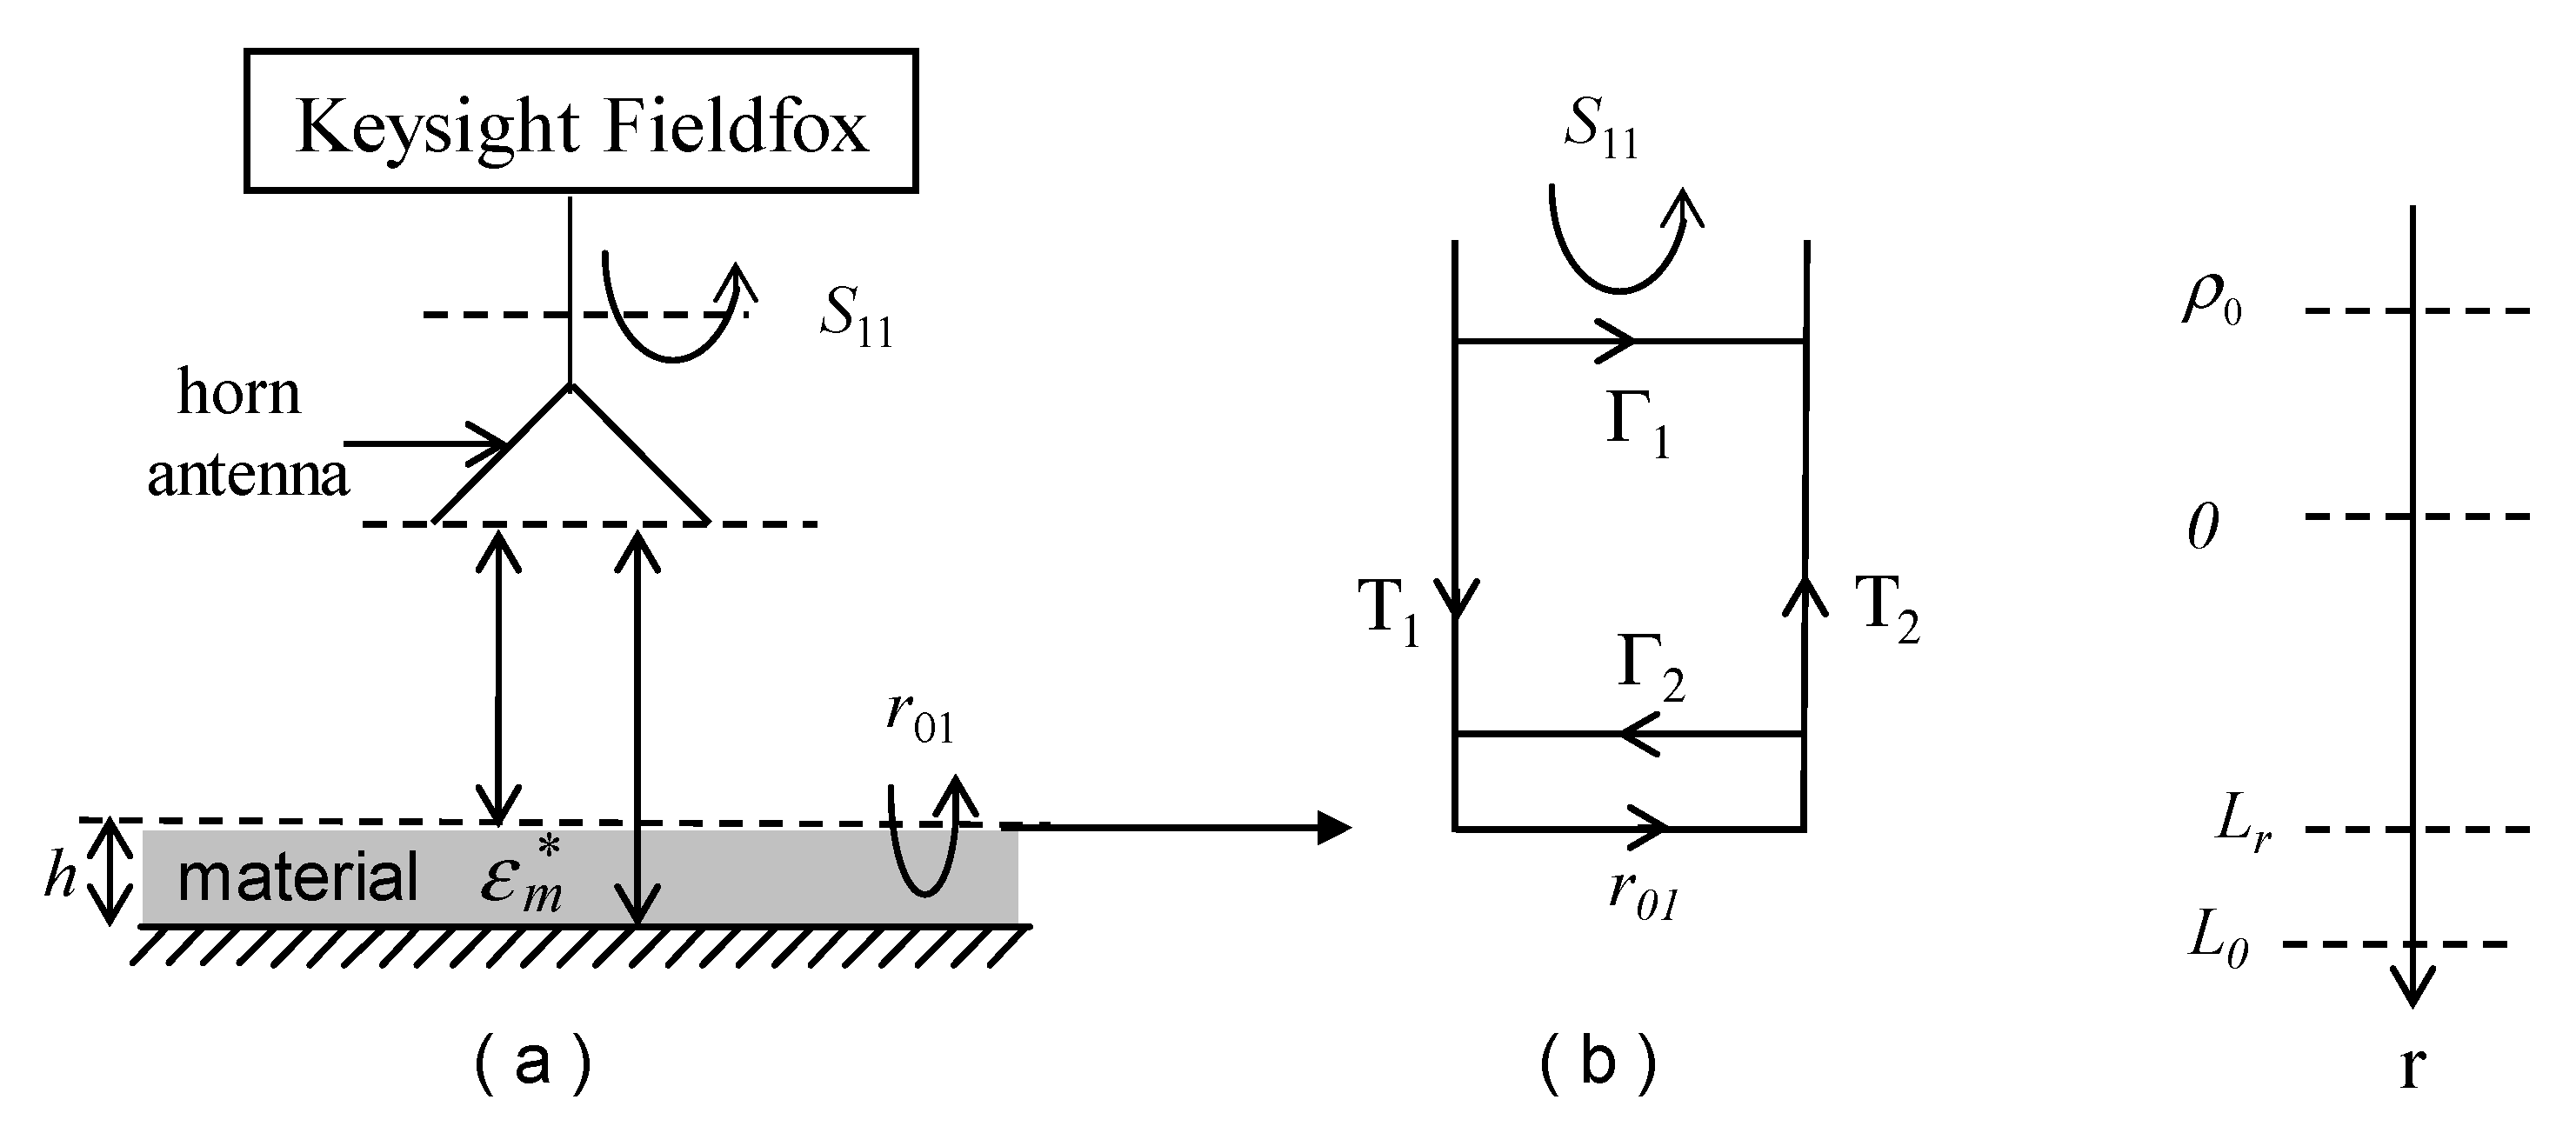
2.2. Microwave Free-Space Monostatic Method

To ensure the high quality of the end product required especially by the aerospace sector, a new free-space monostatic instrumentation was developed and integrated in-line in the R2R pilot line of Adamant Composites™ to allow for the online quality monitoring and characterization of the material being under production. There are possible positions for integrating such a system in the R2R pilot line and they are stated as Control Points to allow the monitoring of the product at different stages of the manufacturing process. In the present work, the material is checked on its final condition only, just before being winded to form the final roll. The prepreg substrate may or may not have a protective film on top of it. The main issue to investigate is the homogenous deposition of the powder and its integration in the prepreg substrate. In this setup, a handled Keysight™ Fieldfox VNA is connected to a single horn waveguide antenna (working as transmitter and receiver) to measure the free-space reflection coefficient S11 of a planar material lying on a metallic plate [10]. A schematic diagram of the free-space monostatic microwave measurement system is given in Figure 2.
The complex permittivity of the planar sample is defined as
ε * m = ε m j ε m
where ε m is the dielectric constant and ε m is the loss factor. We consider that the microwave response of conductive composite materials is mainly attributed to the wave reflection at the air to material interface. The complex reflection coefficient S11 measured by the VNA can be derived from the phenomenological flow graph given in Figure 2b where a two port error adapter is considered to relate S11 to the free-space reflection coefficient of the material under test r01 located at a reference distance Lr from the antenna aperture. The error terms Γ1, Γ2 and T1T2 correspond respectively to the directivity, source match and reflection tracking error terms. These three terms determined from a calibration procedure are used to derive the actual reflection coefficient r01. The term r01 defines the reflection coefficient at the interface air-material. By applying boundary conditions at the air-sample interface, it is found that this parameter is related to ε r * by
r 01 = 1 ε r * 1 + ε r *

2.3. Microwave Free-Space Calibration Procedure

Before doing any measurement, the instrumentation must be calibrated. This calibration step consists to determine the three complex terms Γ 1 ,   Γ 2 and T 1 T 2 . This calibration process is based on the modeling of the empty fixture (without the sample under test) considering multiple distance separations between the antenna and the metallic base. The procedure is inspired by the well-known SOL (Short–Open–Load) found in traditional on-wafer or guided microwave measurements, but by considering 3 known distance separations between the antenna and a material standard [11]. As the antenna operates close to the sample, spread propagation losses due to the spherical nature of the propagation waves induce amplitude variation of the propagating waves a function of the distance. Consequently, this calibration procedure provide accurate data only if the calibration standards are close to the material reference plane. The measured empty complex reflection coefficient S 11 E measured by the VNA can be expressed as a function of the complex reflection S11 at distance Δ r from the reference plane by
S 11 E = Γ 1 + T 1 T 2 S 11 1 Γ 2 S 11
where S 11 = e 2 γ 0 Δ r with γ 0 denotes the free-space propagation constant.
A linear system of three equations of type (3) is then solved to determine the three error terms.

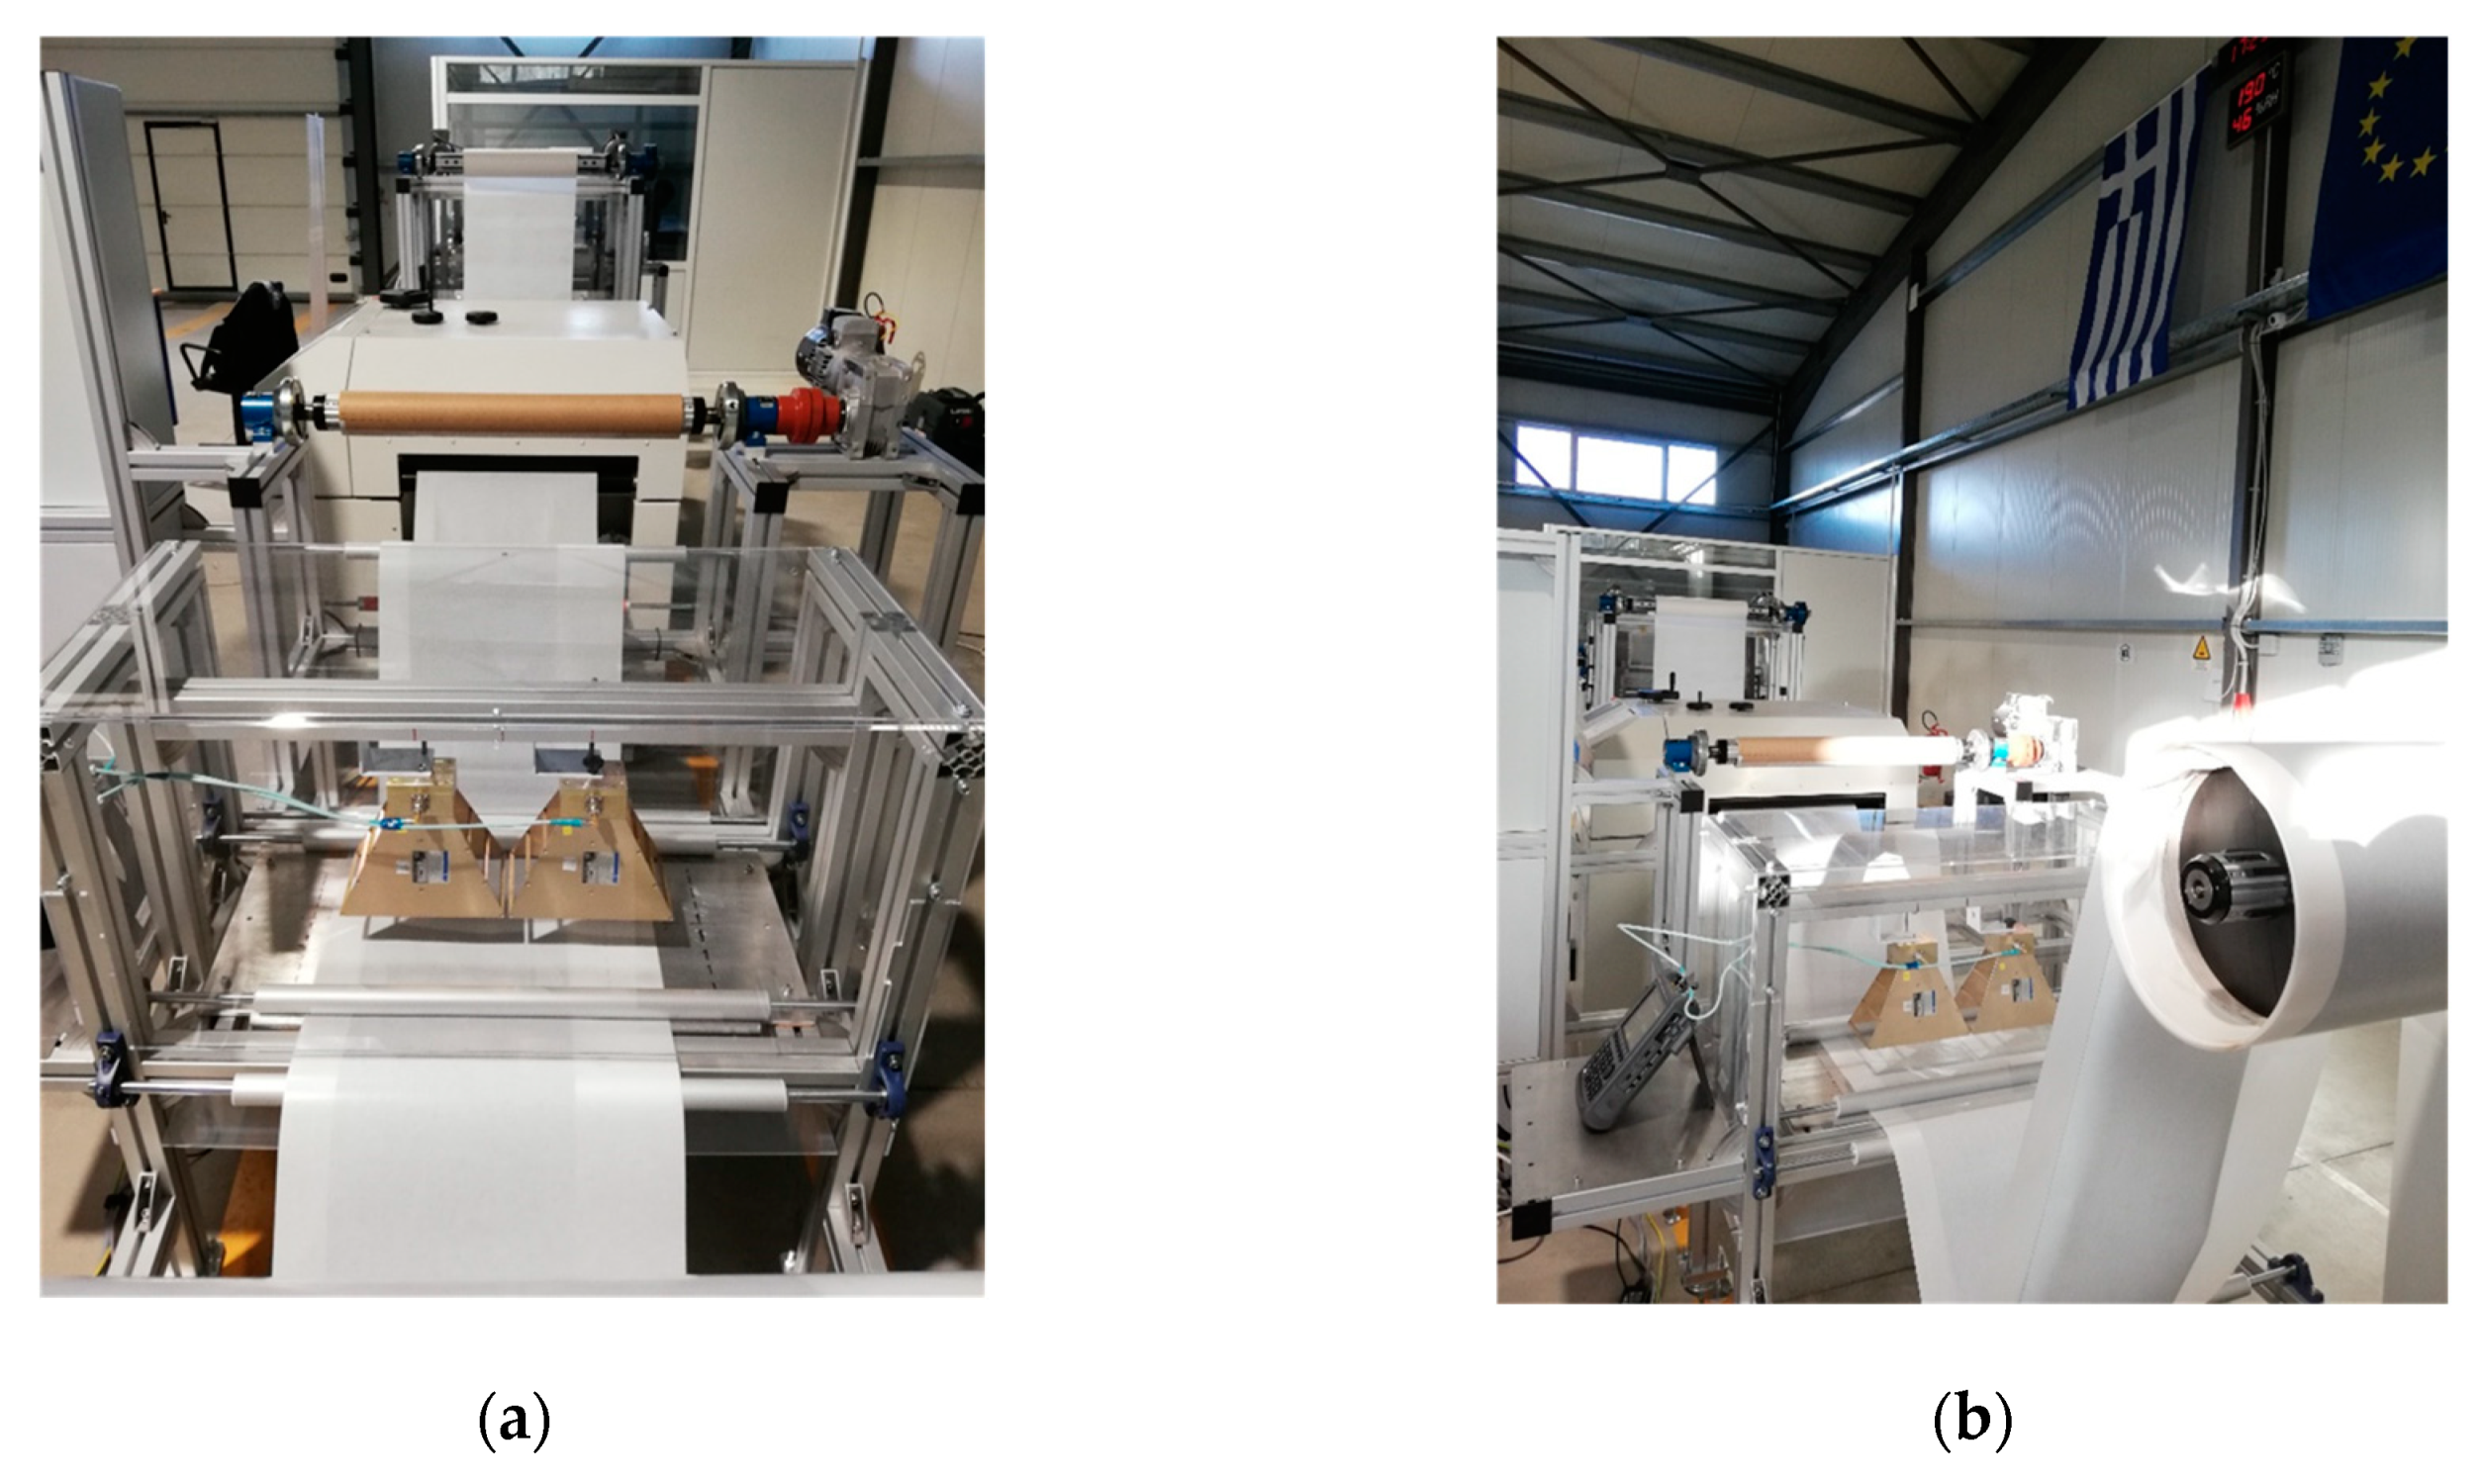
2.4. Online Quality Control Design and Implementation

The integration of the microwave free-space module in the operating industrial environment requires design considerations. Indeed, the performance of the module proposed are depending on requirements from the points of view of both microwave instrumentation and R2R pilot line. From the microwave instrumentation level, the material below the composite materials can be made out of a dielectric or metallic material with a size of 400 × 700 mm2. The choice of material affects the modelling part needed for the analysis of the measurements when purely dielectric materials are aimed. In the present work, we used a conductive material and assumes that the microwave signal is mostly reflected at the air–material interface. The prepreg should move in a perfectly flat manner on top of this substrate. The frame should be able to accommodate two antennas, whose position along the width axis can be adjustable. Note that the antennas operate separately from each other. Indeed, as the VNA has two inputs to extend the measurements to two sites. The installation height of both antennas should be also adjustable to set the lateral spatial resolution. There should be a place at the side of the frame to position the VNA. The antennas should be ideally boxed with an absorbing material. Only a small crevice should be left for the prepreg to enter and exit the module. A special care should be taken to isolate the system from mechanical vibrations. From the R2R pilot line point of view, the module should be interfaced for integration in the R2R Line. The scanning area is defined at maximum length × width = 300 × 600 mm2 (600 mm is the maximum width of the rolls that can be processed). The top surface of the prepreg, where it receives the treatment, is not to be touched with any means. Taking into account the aforementioned requirements and the fact that the R2R pilot line presented above is built in a modular way to allow for the easy integration of new features, it has been decided to design and built a dedicated quality control module to accommodate the free space antenna system and facilitate its integration in the R2R pilot line of Adamant Composites (Figure 3). The design of the module and its general dimensioning has been made with respect to the general format followed by the R2R pilot. To bold its modular nature, the frame is based on industrial wheels that have screw-stands to allow for a perfect leveling of the entire module at its position. Special attention has been paid on making the prepreg have the appropriate tension and be perfectly flat on the substrate, where the measurements take place. To do so, six tensioning axles has been used (the red axles in Figure 3). Two of them are used to press flat the prepreg on the supportive metallic substrate. Another two axles are used for the levelled entering and exiting of the prepreg in and out of the module and another two are used in different heights to assure there is enough tensioning on the material. The substrate panel that accommodates the measurements is made out of 6 mm thick aluminium and sits on a layer of 5 mm thick cork which has good antivibration properties. It has a filleted format at the front and back edge to allow easy entering and exiting of the prepreg in and out of the module. Two metallic mounts, which can move along the width axis, are used for positioning the antennas on a bar, which is centred in the module along the direction of the production and whose height can also be adjusted. This way the positioning of the antennas is very space flexible. The antennas are boxed in 6 mm thick fiberglass to isolate them from environmental disturbances. Fiberglass provides also good visibility of the process. Only two small crevices are left for the prepreg to enter and exit the module and two small holes from where the VNA cables pass. Finally, a metallic table allows the position of the VNA at the side of quality control module.

3. Results

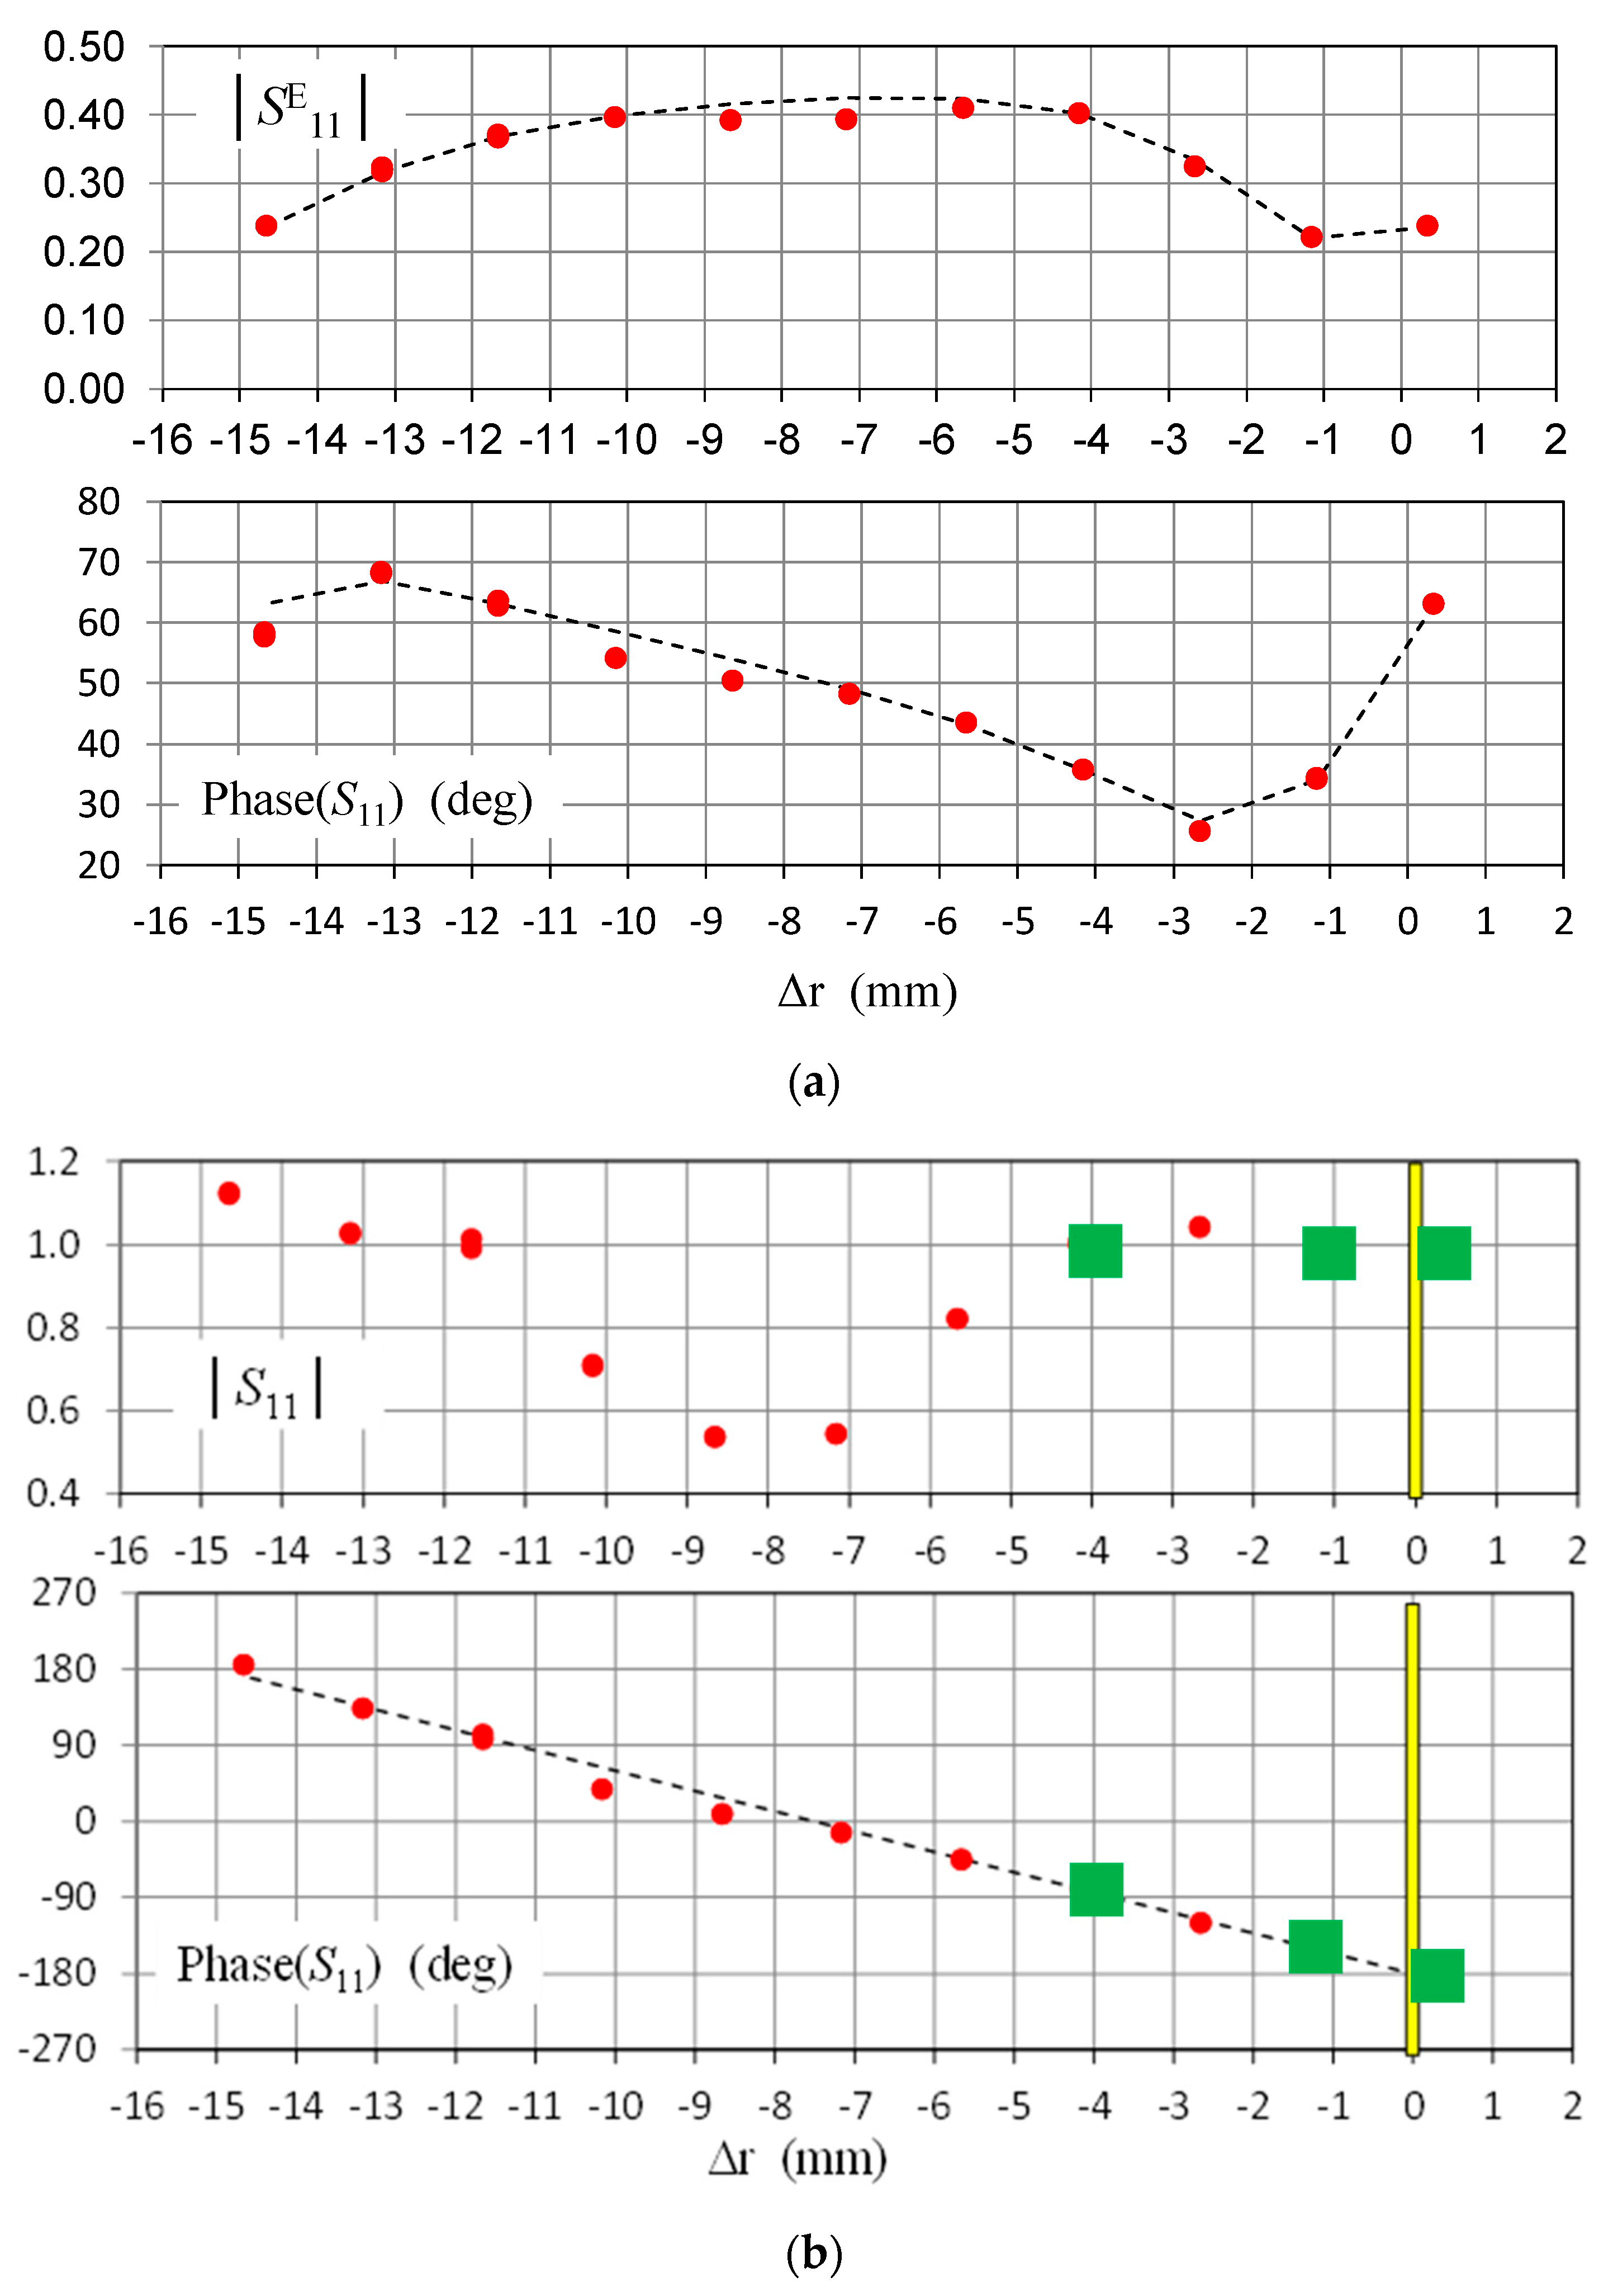
3.1. Free-Space Calibration

The two horn antennas (AH Systems 248 SAS-571 Double Ridge Horn Antenna 700 MHz–18 GHz) are connected to a N9918A FieldFox handheld VNA 26.5 GHz [X] through high stable coaxial cables (Figure 4). Measurements are performed at 10 GHz, with an RF output power set to 0 dBm and intermediate frequency bandwidth IFBW set to 100 Hz. No coaxial calibration is considered. The antenna aperture is set at a distance L = 24.4 mm from the metallic base for the reasons discussed in Section 2. The reference calibration plane is set to 24.05 mm (take into account the thickness of the material under investigation, i.e., 0.35 mm).
Prior to the measurements, free-space calibration considers 11 distance separations Δ r between the antenna aperture and a metallic plate (electrical standard with S11 = −1) and the nominal position (L = 24 mm) are considered in this study (three for calibration and others for validation). The distance is changed by positioning calibrated metallic plates with thickness 1.5 mm on the metallic base. Each measurement is repeated two times to check the measurement reproducibility. To that end, the metallic plates are removed and repositioned between two consecutive measurements. The measurement raw data are given in the Figure 5.
The plot shows that the S11 signal, i.e., measurement of interest, is mixed with complex error terms. The calibration procedure consists in the determination of the complex error terms Γ1, Γ2 and T1T2 by applying the modified SOL algorithm described in Section 2. As mentioned, the calibration standards considered lossless (│ S 11 │ = 1) are summarized in Table 2.
From the calibration procedure, the complex error terms are determined (Table 3).
From the calibration data, the modelling of the complex reflection coefficient is established according to the model (3). The comparison between measurement and modelling is given in Figure 6a. From these data associated to the analytical inversion of the model (3), the calibrated complex reflection S11 of the reference devices (metallic plates with different stand-off) in the measurement reference plane can be retrieved. The results are depicted in Figure 6b.
From these data, the amplitude of the amplitude of the complex reflection coefficient is nearly unity in the proximity of the measurement reference plane. Therefore, the validity of the calibration concerns only material with low thickness in the vicinity of the reference plane. After calibration, the phase-shift exhibits a linear behavior as expected. In the same manner, as a lossless model is considered in this study, deviation from the theoretical phase occurs when the measurement is taken far from the reference plane.

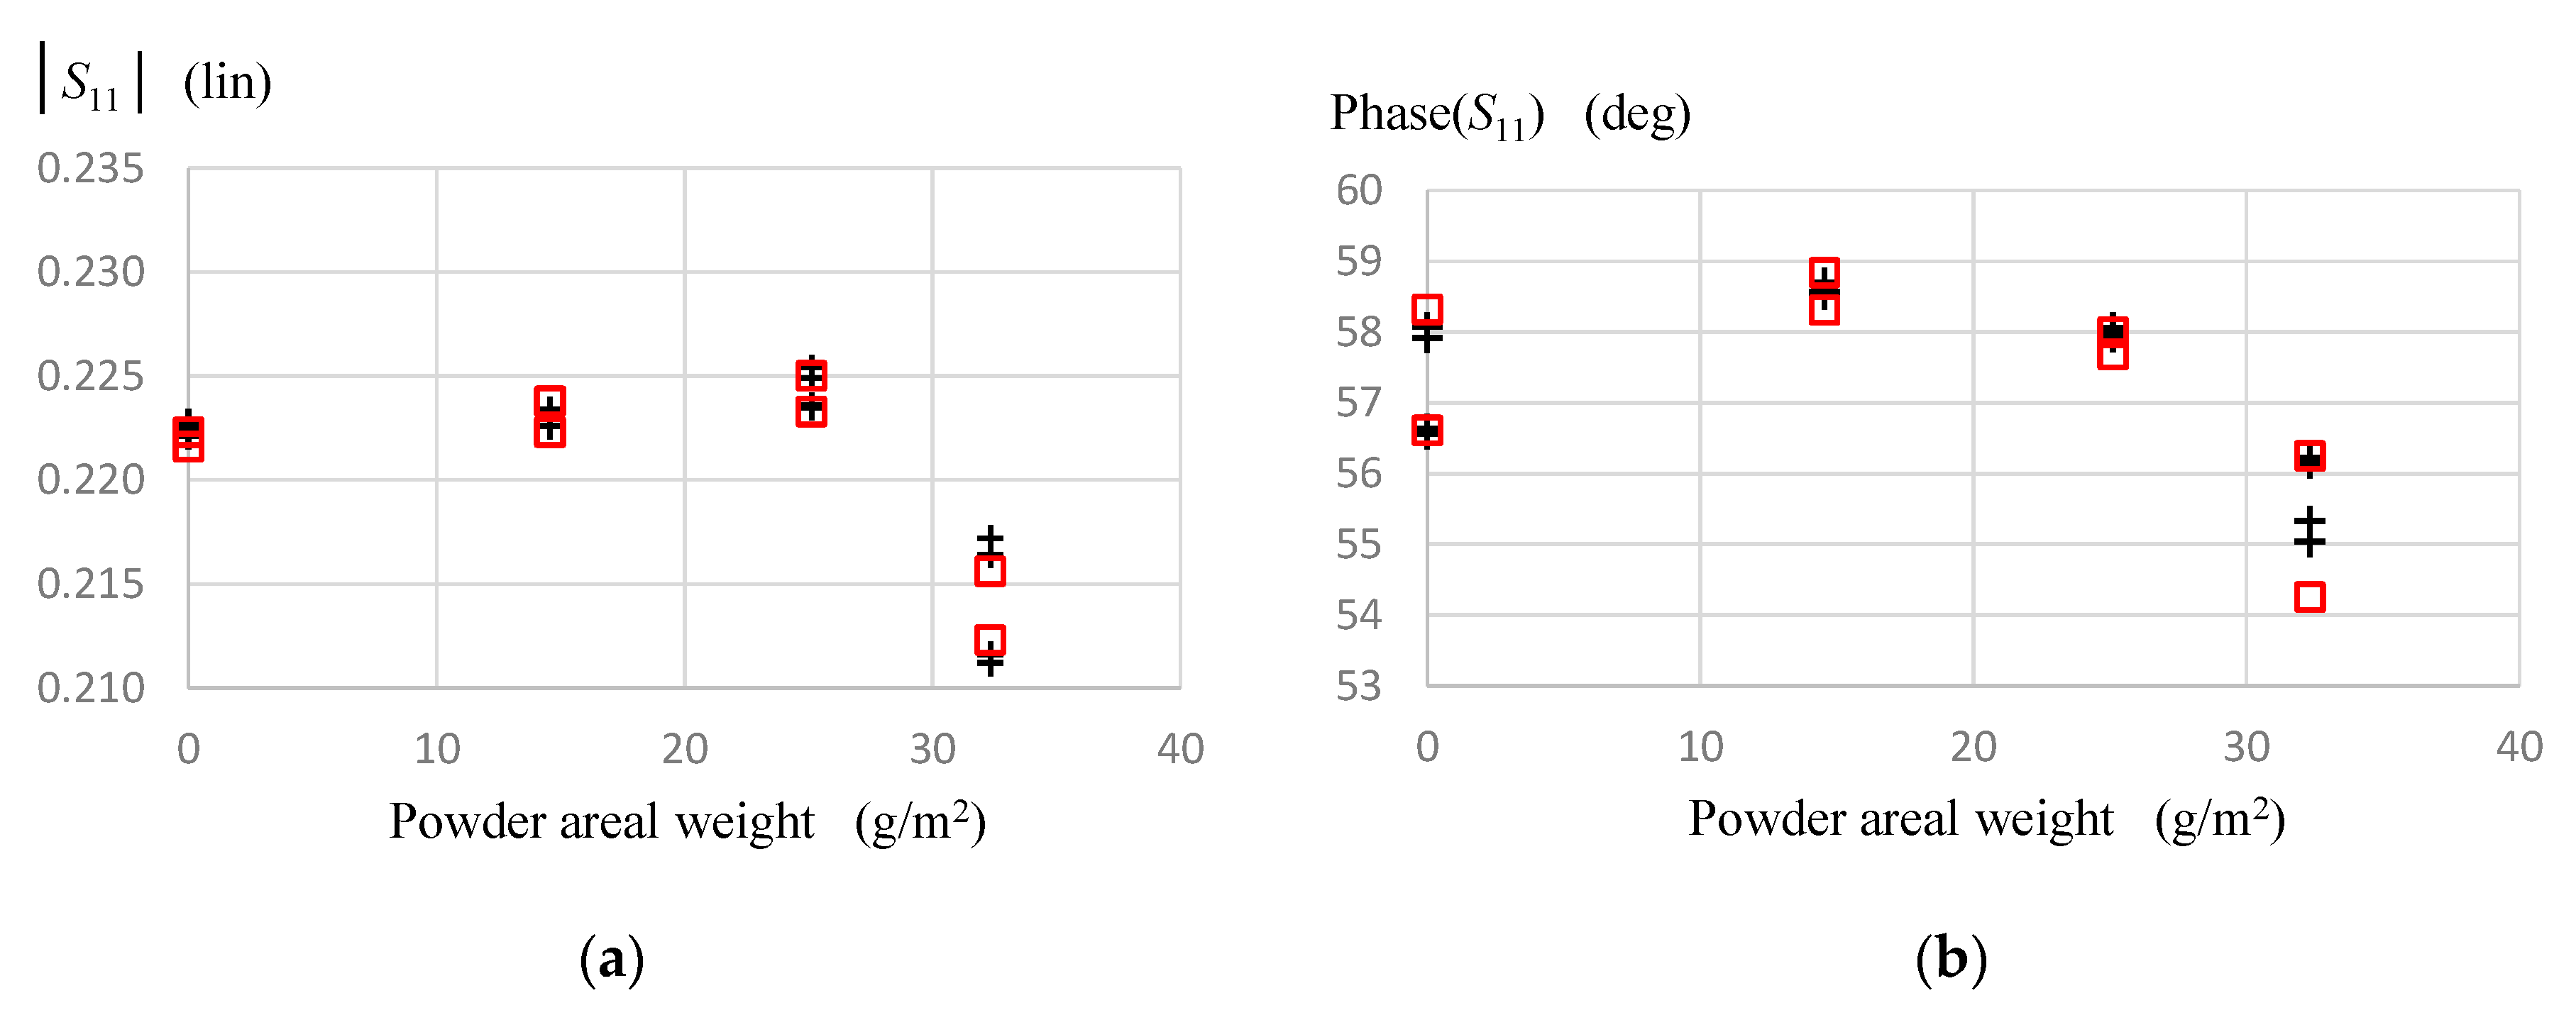
3.2. Material Measurements

Materials samples with different powder areal weights have been prepared for the evaluation of the free-space technique (see Table 4).
Given the electrical nature of the materials considered with relatively low conductivity contrast between them, a reliability study has been performed. Tests in the roll-to-roll pilot lines have been performed. Measurements are done at room temperature around 18 °C with humidity rate around 52%. The antenna is positioned in the orientation of the carbon fibers for all tests. Each measurement is done two times by moving the sample. Between two samples characterization, the empty fixture is measured as a reference to check the environment variations (denoted FREE SPACE). The measured amplitudes and phase-shifts of the complex reflection coefficient S11m are given in Figure 7. After the first round of measurements, each sample is measured one more time.
From these data, unique microwave signatures are noticed for the different powder areal weights considered. For each sample under test, a vector calibration is performed at the material reference plane. Note that the procedure does not require any other measurements as the reference plane can be chosen arbitrary. From the calibrated complex reflection coefficients r01, the relative complex permittivity ε r * of the material can be extracted using the inversion of the following relationship. From the imaginary part ε r of the relative complex permittivity ε r * = ε r j ε r and assuming that the dielectric losses are only attributed to the RF conductivity σ R F (case of metals) at 10 GHz, we can extract the value of σ R F by
σ R F = ω ε 0 ε r .
where ω is the microwave excitation pulsation and ε 0 1 36 π × 10 9 F/m denotes the vacuum permittivity. The extracted complex permittivity and related RF conductivities are summarized in the following table.

4. Discussion

From the extracted RF conductivity data summarized in Table 5, the powder areal weight plays a role in the change of the RF conductivity. These values are instructive for the optimization of the deposition process. In particular, conductive nano-powders added on a conductive composite built up with micro-fibers is a sensitive process. The extracted RF conductivity is a direct signature of the surface conductivity and depends on (i) the spatial distribution of the nano-powders, (ii) their interactions with the hosting material, and (iii) the powder areal weight. In addition, it is demonstrated that the hosting material consisting of conductive fibers, presents a dispersion in the measured RF conductive values (T1.1 and T1.2 that are not doped with nano-powders). These findings are attributed to the material characteristics and not to the measurement set-up. Indeed, calibration has been performed by checking the measurement reproducibility considering metallic standard metallic materials. Surprisingly, the last line of the table that gives an estimation of the reproducibility of the microwave measurement presents a large deviation for materials references T1.1 and T3.2 and needs further investigation.
The following hypothesis are considered for the resolution of the inverse problem:
Only the reflected wave at the surface material contributes to the determination of the conductivity. Further development assuming microwave absorption within the materials will be considered.
During the measurement campaign, we observed a temperature variation around 0.4 °C. Together with drift of the electronic system, the vector calibration is affected as the calibration error terms are determined for fixed environmental conditions. For example, the calibration standard, i.e., aluminium metallic plate (at 24.4 mm for the antenna aperture) considered as ideal in the calibration process ( σ R F ) yields to a value around 14 × 104 S/m when measured after the measurement campaign.
Errors induced by the distance control between the material surface and the antenna aperture impact the measurement accuracy.
The reasons given above yields to measurement uncertainties. These results are instructive as they suggest that a real-time calibration procedure (including temperature and distance measurement) would be beneficial to enhance the measurement accuracy. This work contributes to the penetration of microwave free-space measuring techniques developed by several research groups [12,13,14,15,16].

Author Contributions

Conceptualization, G.K., I.A., A.V., F.K., and K.H.; methodology, G.K., I.A., A.V., F.K., and K.H.; validation, G.K., I.A., A.V., F.K., and K.H.; investigation, G.K., I.A., A.V., F.K., and K.H.; resources, G.K., I.A., A.V., F.K., and K.H.; data curation, G.K., I.A., A.V., F.K., and K.H.; writing—original draft preparation, K.H.; writing—review and editing, G.K, I.A., A.V., F.K., and K.H.; supervision, A.V., F.K., and K.H.; project administration, K.H.; funding acquisition, A.V., F.K., and K.H. All authors have read and agreed to the published version of the manuscript.

Funding

This work was supported by the European Union’s Horizon 2020 Research and Innovation Programme under Grant Agreement No. 761036 (MMAMA project).

Conflicts of Interest

The authors declare no conflict of interest.

References

  1. Kharkovsky, S.; Zoughi, R. Microwave and millimeter wave nondestructive testing and evaluation-Overview and recent advances. IEEE Instrum. Meas. Mag. 2007, 10, 26–38. [Google Scholar] [CrossRef]
  2. Baker-Jarvis, J.; Vanzura, E.J.; Kissick, W.A. Improved technique for determining complex permittivity with the transmission/reflection method. IEEE Trans. Microw. Theory Tech. 1990, 38, 1096–1103. [Google Scholar] [CrossRef] [Green Version]
  3. Ghodgaonkar, D.K.; Varadan, V.V.; Varadan, V.K. A free-space method for measurement of dielectric constants and loss tangents at microwave frequencies. IEEE Trans. Instrum. Meas. 1989, 38, 789–793. [Google Scholar] [CrossRef]
  4. Zhao, M.; Shea, J.D.; Hagness, S.C.; van der Weide, D.W. Calibrated free-space microwave measurements with an ultrawideband reflectometer-antenna system. IEEE Microw. Wirel. Compon. Lett. 2006, 16, 675–677. [Google Scholar] [CrossRef]
  5. Petersson, L.R.; Smith, G.S. An estimate of the error caused by the plane-wave approximation in free-space dielectric measurement systems. IEEE Trans. Antennas Propag. 2002, 50, 878–887. [Google Scholar] [CrossRef]
  6. Saenz, E.; Rolo, L.; Van’TKlooster, K.; Paquay, M.; Parshin, V.V. Accuracy assesment of material measurements with a quasi-optical free-space test bench. In Proceedings of the 2012 6th European Conference on Antennas and Propagation (EUCAP), Prague, Czech Republic, 26–30 March 2012; pp. 572–576. [Google Scholar]
  7. Haddadi, K.; Wang, M.M.; Benzaim, O.; Glay, D.; Lasri, T. Contactless microwave technique based on a spread-loss model for dielectric materials characterization. IEEE Microw. Wirel. Compon. Lett. 2008, 19, 33–35. [Google Scholar] [CrossRef]
  8. Haddadi, K.; Lasri, T. Geometrical optics-based model for dielectric constant and loss tangent free-space measurement. IEEE Trans. Instrum. Meas. 2014, 63, 1818–1823. [Google Scholar] [CrossRef]
  9. Kostopoulos, V.; Vavouliotis, A.; Baltopoulos, A.; Sotiriadis, G.; Masouras, A.; Pambaguian, L. Nanotechnologies for composite structures-from nanocomposites to multifunctional nano-enabled fibre reinforced composites for spacecrafts. In Proceedings of the 13th European Conference on Spacecraft Structures, Materials & Environmental Testing, Braunschweig, Germany, 1–4 April 2014. [Google Scholar]
  10. Keysight Technologies, FieldFox Handheld Analyzers 4/6.5/9/14/18/26.5/32/44/50 GHz, Datasheet. Available online: https://www.keysight.com/us/en/assets/7018-03314/data-sheets/5990-9783.pdf (accessed on 21 October 2020).
  11. Rumiantsev, A.; Ridler, N. VNA calibration. IEEE Microw. Mag. 2008, 9, 86–99. [Google Scholar] [CrossRef]
  12. Oliveira, J.G.; Junior, J.G.D.; Pinto, E.N.; Neto, V.P.S.; D’Assunção, A.G. A New Planar Microwave Sensor for Building Materials Complex Permittivity Characterization. Sensors 2020, 20, 6328. [Google Scholar] [CrossRef] [PubMed]
  13. Ho, M.C.; Le, T.H.; Nguyen, L.C. Accurately estimated the complex relative permittivity of materials using a super high-resolution algorithm at X-band microwave propagation. Electromagnetics 2020, 40, 1–12. [Google Scholar] [CrossRef]
  14. Zhang, Y.; Li, E.; Gao, C.; Zheng, H. Portability improvement for free-space reflectivity measurement. Measurement 2020, 157, 107686. [Google Scholar] [CrossRef]
  15. Daass, B.; Pomorski, D.; Rouibah, A.; Haddadi, K. Proof-of-Concept Millimeter-Wave Free-Space Nondestructive Testing Implemented on Collaborative Mobile Robots. In Proceedings of the 2020 IEEE International Workshop on Metrology for Industry 4.0 & IoT, Roma, Italy, 3–5 June 2020; IEEE: Piscataway, NJ, USA, 2020; pp. 354–359. [Google Scholar]
  16. Xie, Y.; Shen, F.; Zhou, T.; Zhang, B.; Wang, J.; Li, C.; Ran, L. Remote Measurement of Dielectric Constants for Samples With Arbitrary Cross Sections. IEEE Microw. Wirel. Compon. Lett. 2020, 30, 1005–1008. [Google Scholar] [CrossRef]
Figure 1. (a) Schematic and (b) Picture of the Adamant Composites™ roll-to-roll (R2R) pilot line for the production of FXply™ functionalized prepregs.
Applsci 11 00378 g001
Figure 2. (a) Schematic diagram of the free-space monostatic microwave measurement instrumentation. (b) Flow-chart of the wave propagation.
Applsci 11 00378 g002
Figure 3. (a) CAD representation of the free-space quality module. (b) CAD representation of the dedicated module in position Control Point #2 of the R2R pilot line.
Applsci 11 00378 g003
Figure 4. (a) A front and (b) an isometric view of the R2R pilot line with the free space antenna system integrated.
Applsci 11 00378 g004
Figure 5. Measured empty free-space complex reflection coefficient S 11 E as a function of the stand-off distance Δ r from the reference plane (Lr = 24.04 mm)—f = 10 GHz (+ amplitude│S11E│ and Phase of S11E).
Applsci 11 00378 g005
Figure 6. (a) Comparison between Modelled (---) and measured () empty free-space complex reflection S 11 E as a function of the stand-off distance Δ r from the reference plane (Lr = 24.04 mm) – f = 10 GHz. (b) Comparison between Modelled (---) and measured () calibrated empty free-space complex reflection S 11 as a function of the stand-off distance Δ r from the reference plane (Lr = 24.04 mm)—f = 10 GHz. The reference plane is illustrated in yellow color (at Δ r = 0) and the calibration standards are illustrated with .
Applsci 11 00378 g006
Figure 7. Measured amplitude and phase-shift of the complex reflection coefficient as a function of the powder areal weight (+ First measurement round, Second measurement round)—f = 10 GHz.
Applsci 11 00378 g007
Table 1. Specifications of the R2R pilot line for prepreg production.
Roll widthup to 600 mm
Roll outer diameterup to 600 mm
Roll weightmax. 100 kg
Forward speed range0.2–9 m/min
Production rateup to 1000 sqm/day
Table 2. Free-space electrical standards used for calibration—f = 10 GHz.
Standard Δ r (mm) S 11 E   [ Lin ] Phase   ( S 11 E )   [ deg ] S 11   [ Lin ] Phase   ( S 11 )   [ deg ]
CAL 1−0.350.236563.131−8
CAL21.150.220634.18128
CAL34.150.401735.671100
Table 3. Complex error terms determined from the free-space calibration procedure—f = 10 GHz.
DirectivityΓ10.22422 + 0.26289i
Source matchΓ20.27198 − 0.15393i
Frequency resp.T1T2−0.06859 − 0.072409i
Table 4. Thin film prepreg parameters.
Sample IdentificationMeasured Thickness * [mm]
(* at Different Locations: One Measurement per Sample’s Side)
Main Thickness (mm)Weight (g)Powder Areal Weight (g/m2)
Hexcel’s M21/34%/UD194/T800s/300 ATT1.10.370.340.350.340.3537.660
T1.20.350.380.380.350.3737.900
FXply™-ELT2.10.480.410.440.450.4540.0425.11
T2.20.400.410.410.420.4140.1226.00
FXply™-EL_lowT3.10.480.500.420.450.4639.0914.56
T3.20.320.360.390.420.3739.4919.00
FXply™-EL_highT4.10.490.480.470.430.4740.6932.33
T4.20.460.470.410.410.4440.9935.67
Prepreg Paper only-0.10.10.090.090.10--
Table 5. Extracted complex permittivity and conductivity as a function of the powder areal weight—f = 10 GHz.
T1.1T1.2T2.1T2.2T3.1T3.2T4.1T4.2
Thickness (µm)350370450400460370470440
Powder areal weight (g/m2)0025.1126.0014.5619.0032.3335.67
ε r (F/m)891714171966105386451121,9436150
ε r (F/m)484819082668394981741031411,5275124
σ R F (S/m)26971061148421974547573864132851
Δ σ R F / σ R F (%)51.70.0210.86.1513.925.412.81.2
Publisher’s Note: MDPI stays neutral with regard to jurisdictional claims in published maps and institutional affiliations.

