1. Introduction
The widely applied industrial technology of computer-aided design/computer-aided manufacturing (CAD/CAM) has been increasingly applied in dentistry over the past few decades [
1,
2]. Digital devices and technology have substantially simplified the complex processes involved in the conventional procedure applied for restoration, and clinicians now express a greater preference for virtual devices due to their superior accuracy and simplification of the workflow [
3].
The intraoral scanner (IOS) is a type of digital equipment that acquires optical impressions of dental anatomical structures and prostheses, and is commonly used in the clinic as an alternative to taking conventional impressions [
4,
5]. The accuracy of conventional impressions and the fit of the produced prosthesis are highly dependent on every step of the process, whereas the digital magnifications and quality-control tools of digital impression devices reveal visible areas of defects so as to allow clinicians to rescan and correct those areas immediately without needing to restart the entire process like in the conventional procedures [
6]. Additionally, the performance of digital impressions on the margin or internals of fixed restorations is better than for conventional techniques [
7]. However, there are still concerns about distortion in digital impressions obtained using different devices and under various intraoral conditions [
8,
9].
Numerous researchers have recently made efforts to determine the accuracy of IOSs. Several studies have evaluated the trueness and precision of different IOSs and revealed that their accuracy is at least as good as for conventional impressions in short-span areas [
10,
11,
12]. However, the trueness and precision of IOSs are lower for the full arch than in short-span areas [
13]. Additionally, the accuracy of IOSs was found to decrease with increasing distance between the implant scan bodies [
14]. Several studies have found it difficult for an IOS to capture accurate impressions for long-span restorations [
15,
16]. Low accuracy results were observed in long distance scan and rather high accuracy in short distance, thus implying the scanning distance could be an impact factor to the accuracy of the scan [
17]. These results revealed that the accuracy of IOS devices may be related to the length of scanning target and likely to decrease with the extension of the arch span. This may be due to the influences of the joints on errors during the stitching process when images overlap over a curved span.
One of the important factors that can affect the accuracy of intraoral scanning data is the landmark structure in the region of interest. The landmark is important for accurate alignment when registering the bite during the oral scanning process. A recent study found that the trueness and precision of intraoral scanning were improved if an artificial landmark in the long edentulous area was used [
18]. Errors may occur when aligning images during scanning by an IOS if the digitized items are too simple [
19], with the errors being lower when complex geometric items are added [
20]. Another recent study found that the use of auxiliary geometric structures can enhance the outcomes of digital impressions of the edentulous maxilla [
21].
Implant placement and prosthesis production are performed in an edentulous area where a tooth is missing. IOSs have been widely used in recent years in the manufacture of implant prostheses [
22]. In the digital impression process, after removing the healing abutment (HA), the first scan is performed to record the transgingival profile. After the scan body is connected, additional scanning is performed to accurately reproduce the three-dimensional (3D) position of the implant. However, the transgingival profile is less important when implants are placed in posterior areas, and gingival molding using temporary teeth is rarely performed due to the aesthetics being far less important. In addition, after removing the HA, there is concern that the accuracy of the scan may be reduced because only residual ridges or structures with motion frenum remain and landmarks for use in the bite registration process disappear. Therefore, some clinicians perform a primary scan with the HA in the posterior region. In such cases, it is necessary to scientifically verify whether the presence of the HA improves the accuracy during intraoral scanning and buccal bite registration, which is used to align the upper and lower arches using the virtual interocclusal record (VIR). While many studies have investigated the accuracy of IOS scans, investigations of the VIR have been insufficient [
23,
24]. In particular, there is a need for investigations of the effects of landmarks on the accuracy of the VIR on edentulous areas [
18].
The present study aimed to determine the accuracy of intraoral scanning data and the jaw relationship between quadrant maxillary and mandibular models according to whether or not there is an HA at the implant placement site, and elucidate the distribution of distortion on the arch span when using three types of IOSs. The first null hypothesis of this study was that the accuracy of the scan data does not differ significantly between the presence or absence of an HA in a quadrant implant model. The second null hypothesis was that the distortion in the accuracy of the scan does not vary from anterior to posterior tooth positions.
2. Materials and Methods
2.1. Design of the Study
The model design and overall experimental workflow of this study are illustrated in
Figure 1. To design the model in each group, a maxillary tooth dentiform model (D85DP-500B.1, Nissin, Kyoto, Japan) was scanned using a laboratory scanner (Identica T500, Medit, Seoul, Korea), with the obtained data exported in the Standard Triangulated Language (STL) digital file format. The converted design file was then imported into modeling software (Meshmixer, Autodesk, San Rafael, CA, USA), the palate and other unnecessary structures were deleted, and a U-shaped model was designed. A cross-arch plate model was designed by attaching a 1.5-mm-thick cross-arch plate at the position of the palate (
Figure 2).
One implant was placed at each position where a tooth was missing, with each implant designed to be placed in the same position in each model. Once the implant surgical guide was designed using Implant Studio software (3Shape, Copenhagen, Denmark) and three-dimensionally printed using an SLA 3D printer (Form 3, Formlabs, Somerville, MA, USA), the implants were installed at the position of the missing teeth in each model by a single expert clinician. Since the implant positions were likely to affect the results, an implant surgical guide was used to ensure precise implant placement for each model.
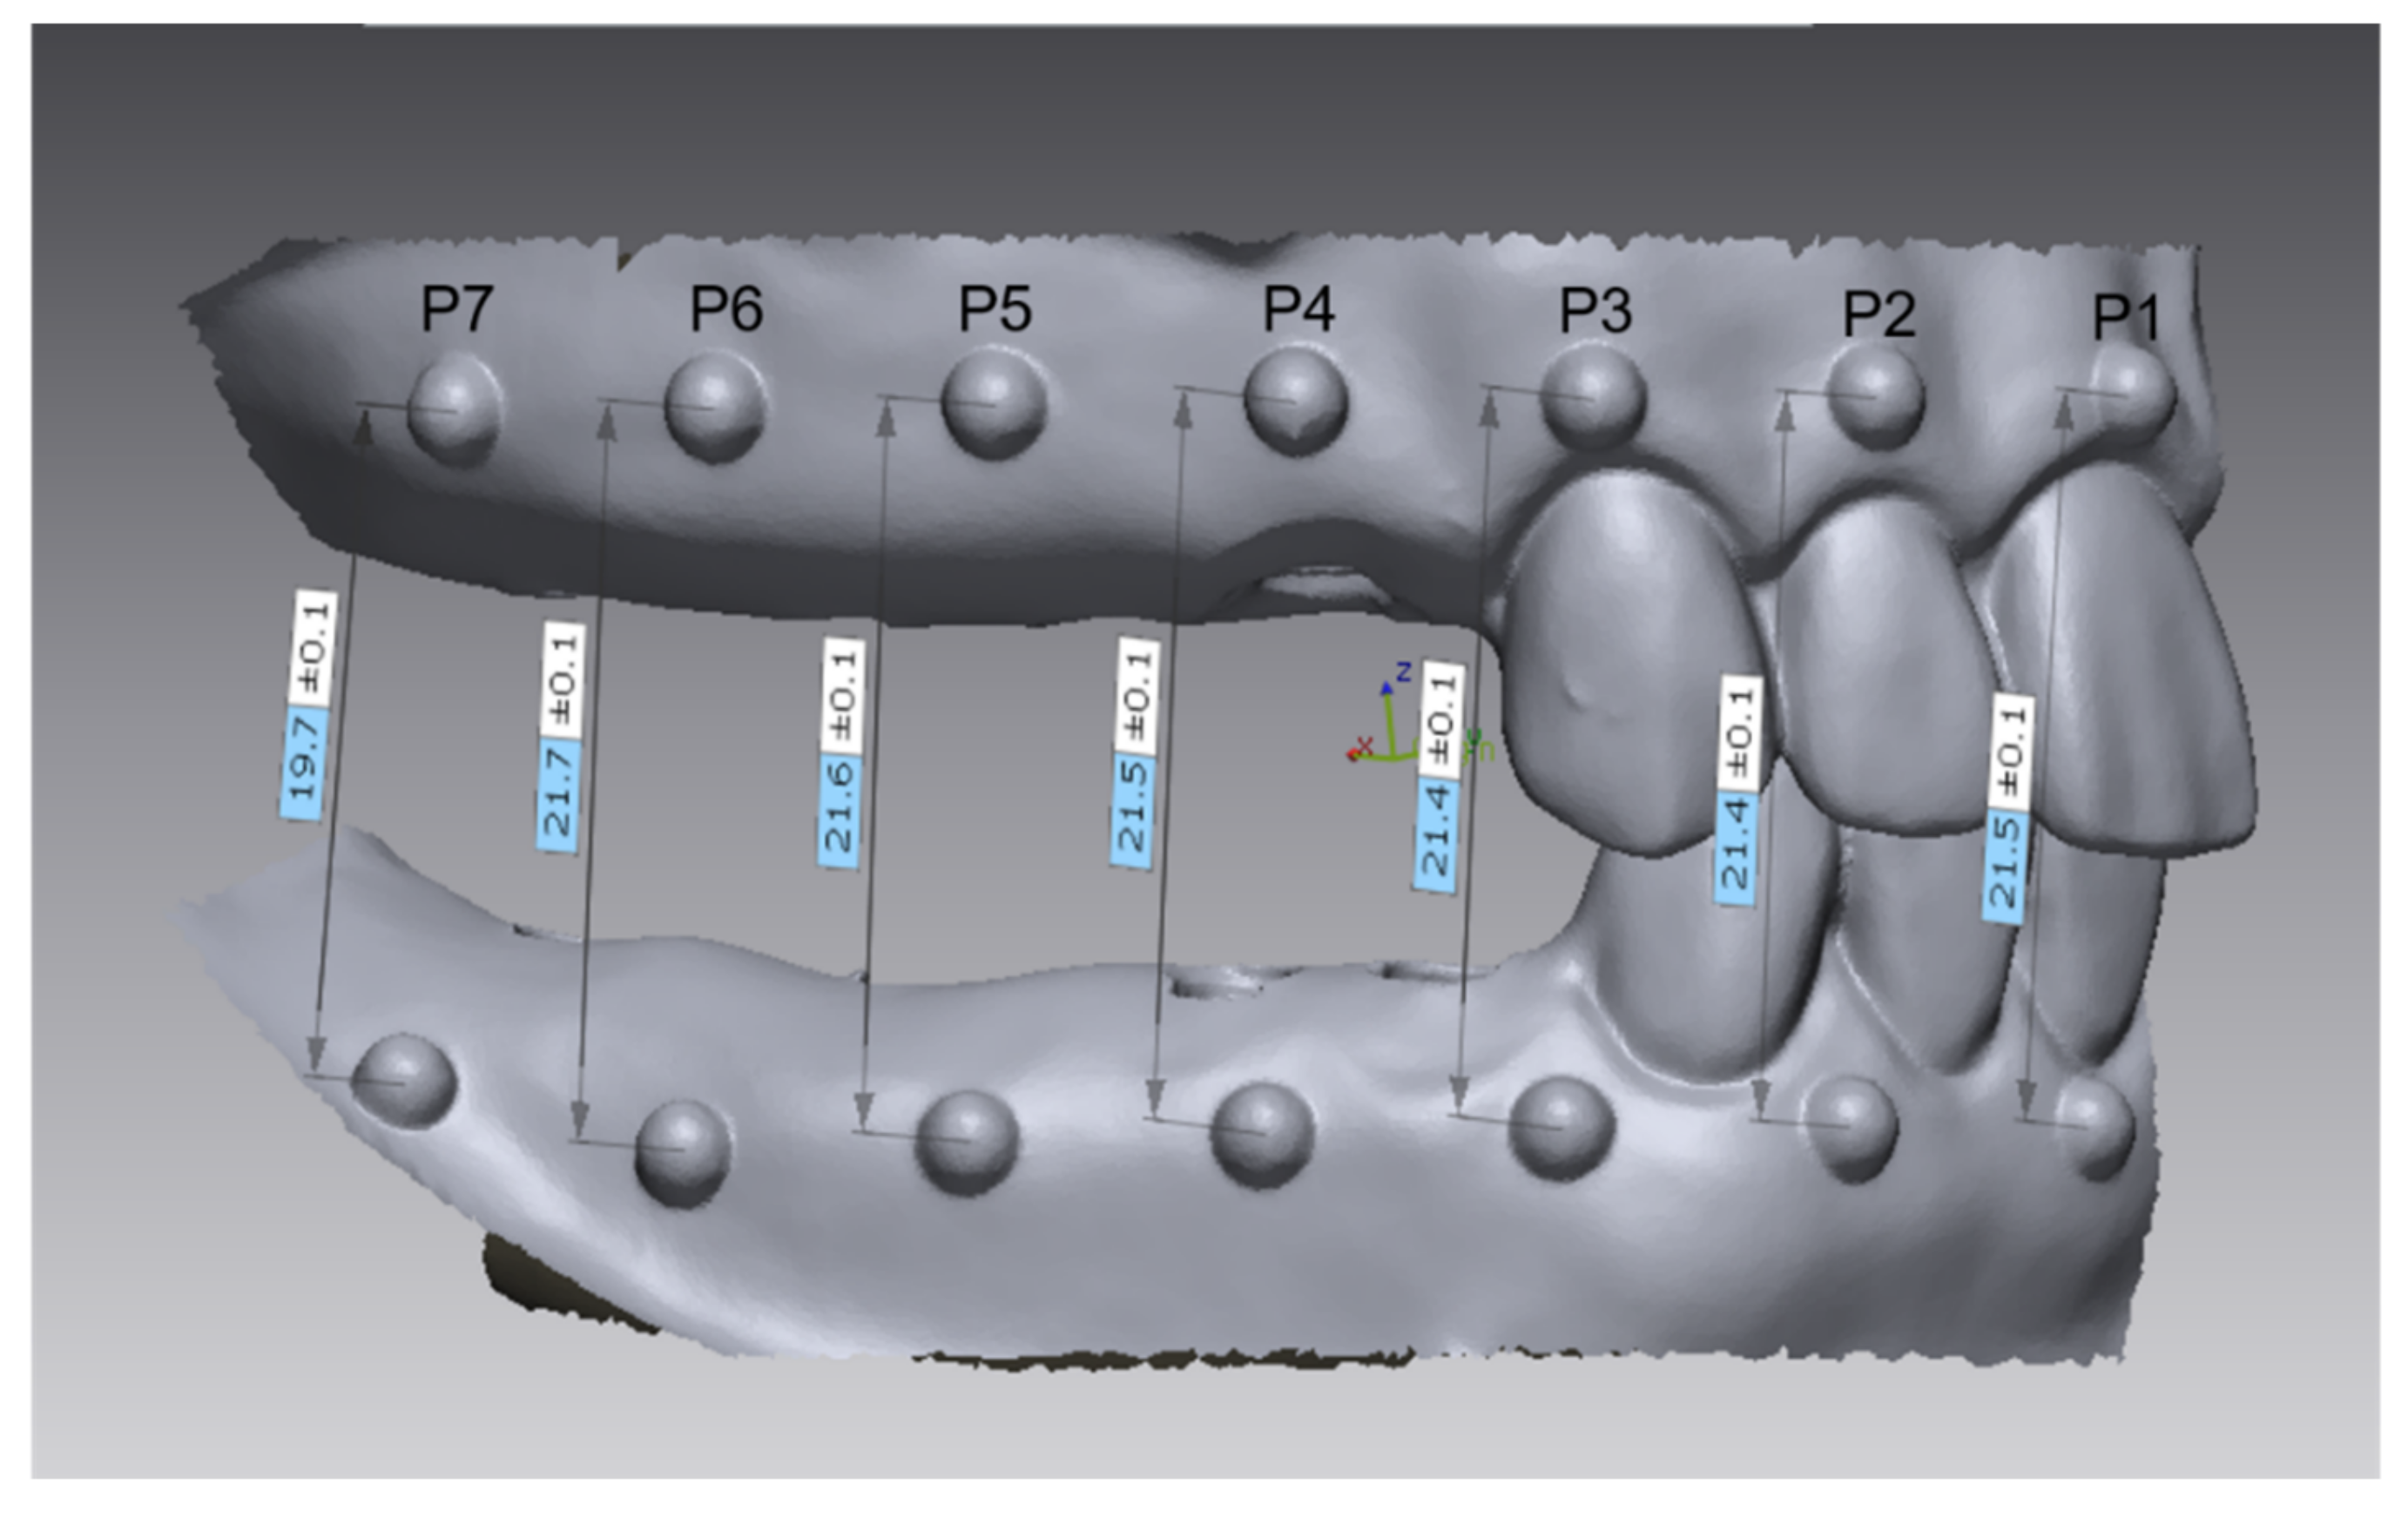
A hemisphere was fabricated on the labial/buccal side of the gingiva corresponding to each tooth position on a curved line. The distance between the upper and lower hemispheres in each position was measured during the linear measurement process.
The following six groups of experimental models were produced based on whether the HA was connected to the installed implant location and the location of missing teeth (
Figure 2):
- (1)
HA-2: HA group with two missing teeth replaced with implants (first molar and second molar).
- (2)
HA-3: HA group with three missing teeth replaced with implants (first premolar, second premolar, and first molar).
- (3)
HA-4: HA group with four missing teeth replaced with implants (first premolar, second premolar, first molar, and second molar).
- (4)
NHA-2: non-HA (NHA) group with two missing teeth replaced with implants (first molar and second molar).
- (5)
NHA-3: NHA group with three missing teeth replaced with implants (first premolar, second premolar, and first molar).
- (6)
NHA-4: NHA group with four missing teeth replaced with implants (first premolar, second premolar, first molar, and second molar).
The maxilla and mandible were in a stable bite, with the area of missing teeth being on the right side of the model.
This study compared three IOSs that are commonly used: CS3600® (version 3.1, Carestream, Dental, Atlanta, GA, USA), Trios 3® (3Shape, Copenhagen, Denmark), and I500® (Medit, Seoul, Korea). The scanning performance is influenced by the scanning speed, and so each arch was scanned at the same speed by a single operator within about 90 s. In order to control the variance, this study kept the scanning process of all the IOSs at the same speed to compare the performance of IOSs during a certain limited period.
All models with implants and HAs in position were scanned using a laboratory optical scanner (T500, Medit, Seoul, Korea), which can probe the surface of an object to obtain detailed 3D information. The acquired data included the maxillary and mandibular arches as well as information about bite registration. Each model was scanned eight times, and one of these scans was randomly selected as a reference scan for the trueness analysis of the IOSs. After acquiring the data for the HA groups, the HAs were removed and all of the models were again scanned eight times in an identical manner. One of these scans was then randomly selected as a reference scan for the NHA groups in the trueness analysis.
The quadrant implant models together with bite registration were then scanned eight times using each IOS. All scanning processes were performed under the same conditions of place, room temperature, and operator. Once data acquisition was completed, the data sets were exported as STL files. These STL files were imported into DentalCAD (Exocad, GmbH, Darmstadt, Germany) to align the maxillary and mandibular arches by utilizing the bite scans. The aligned models were then imported into a reverse-engineering software (Geomagic Control X®, 3D Systems, Rock Hill, SC, USA) and trimmed into uniform figures using the “cut with planes” function to ensure that no interferential structures were formed during superimposing. The uniformly trimmed models were then exported in the same folder and ready to be analyzed.
2.2. Trueness and Precision
For the trueness evaluation, all of the STL files for each group acquired by IOSs were imported into the reverse-engineering software (Geomagic Control X) as measurement data and superimposed onto the reference data selected from the eight scans acquired by the T500 scanner. The working process was as follows. First, two models were roughly aligned using the “initial alignment” function, in which the software detected features that were identical in the IOS and reference models and roughly aligned them. Second, the “best fit” function was applied. Since all of the models had been trimmed uniformly, it was not necessary to select a specific area to use in the alignment process. The distances (quantified as mean ± standard deviation (SD)) between the reference and measurement models were automatically calculated by the software. Finally, the “3D compare” function was used to display the 3D distance between the two models within a tolerance of 100 µm. The root mean square (RMS) was then acquired. The overall RMS values were calculated using the following formula:
where
xref is the measurement made on the reference scan,
xi is the measurement of the test model scan being compared with the reference scan, and
n is the total number of measurements.
All the values were recorded in micrometers. The process of precision evaluation was identical. Pairwise comparisons were performed for all scans in each group, with each scan serving as the reference model. The scans in each group were overlapped and calculated using the software.
2.3. Linear Measurements
Linear measurements were used in this study to illustrate the distortion of the scan relative to the tooth position and identify the area with the greatest distortion. Each scan was imported into the Geomagic Control X software, and the “resegment” function was used to divide the model into a multitude of small regions. The hemispheres on the labial/buccal side of the arch were then automatically recognized and captured by the software. The coordinate of the center point was provided by the software. The hemisphere position of the central incisor was named position 1 (P1) and the hemisphere position of the lateral incisor was named position 2 (P2). By analogy, we named the remaining hemisphere positions up to position 7 (P7) (second molar) (
Figure 3). The distance between the upper and lower hemispheres was then calculated using the “linear dimension measurement” function. All of the linear distances between the upper and lower hemispheres were recorded, and the difference values (D-Values) between the measurement scan distance (MSD) (acquired by IOSs) and the reference scan distance (RSD) (acquired by the T500 scanner) were calculated using the following formula:
where
xi is MSD and
xref is RSD.
2.4. Statistical Analysis
Trueness was defined based on the results obtained when superimposing the IOS and reference scans. Normality was checked using the Shapiro–Wilk test, and Levene’s test was used to assess the homogeneity of the variances for all test groups (with a significance cutoff of α = 0.05). The mean RMS value and its standard deviation were calculated and defined as trueness in the variance analysis. Three-way ANOVA, as implemented by statistical software (SPSS version 25.0, IBM, Armonk, NY, USA), was used to analyze differences of the trueness between the HA and non-HA (NHA) groups for any given scanner and location and number of missing teeth and to assess the effect of HA (α = 0.05). Tukey investigations were used for multiple comparisons. For each IOS, due to the relatively small samples, additional Bonferroni’s post hoc tests were applied for pairwise comparisons between groups.
Precision was measured using the same analysis procedure as described above except that the superimpositions were conducted between different scans captured with the same scanner. Finally, the Jonckheere–Terpstra (J–T) trend test was used to analyze the tendency for distortion from anterior to posterior tooth positions (α = 0.05).
3. Results
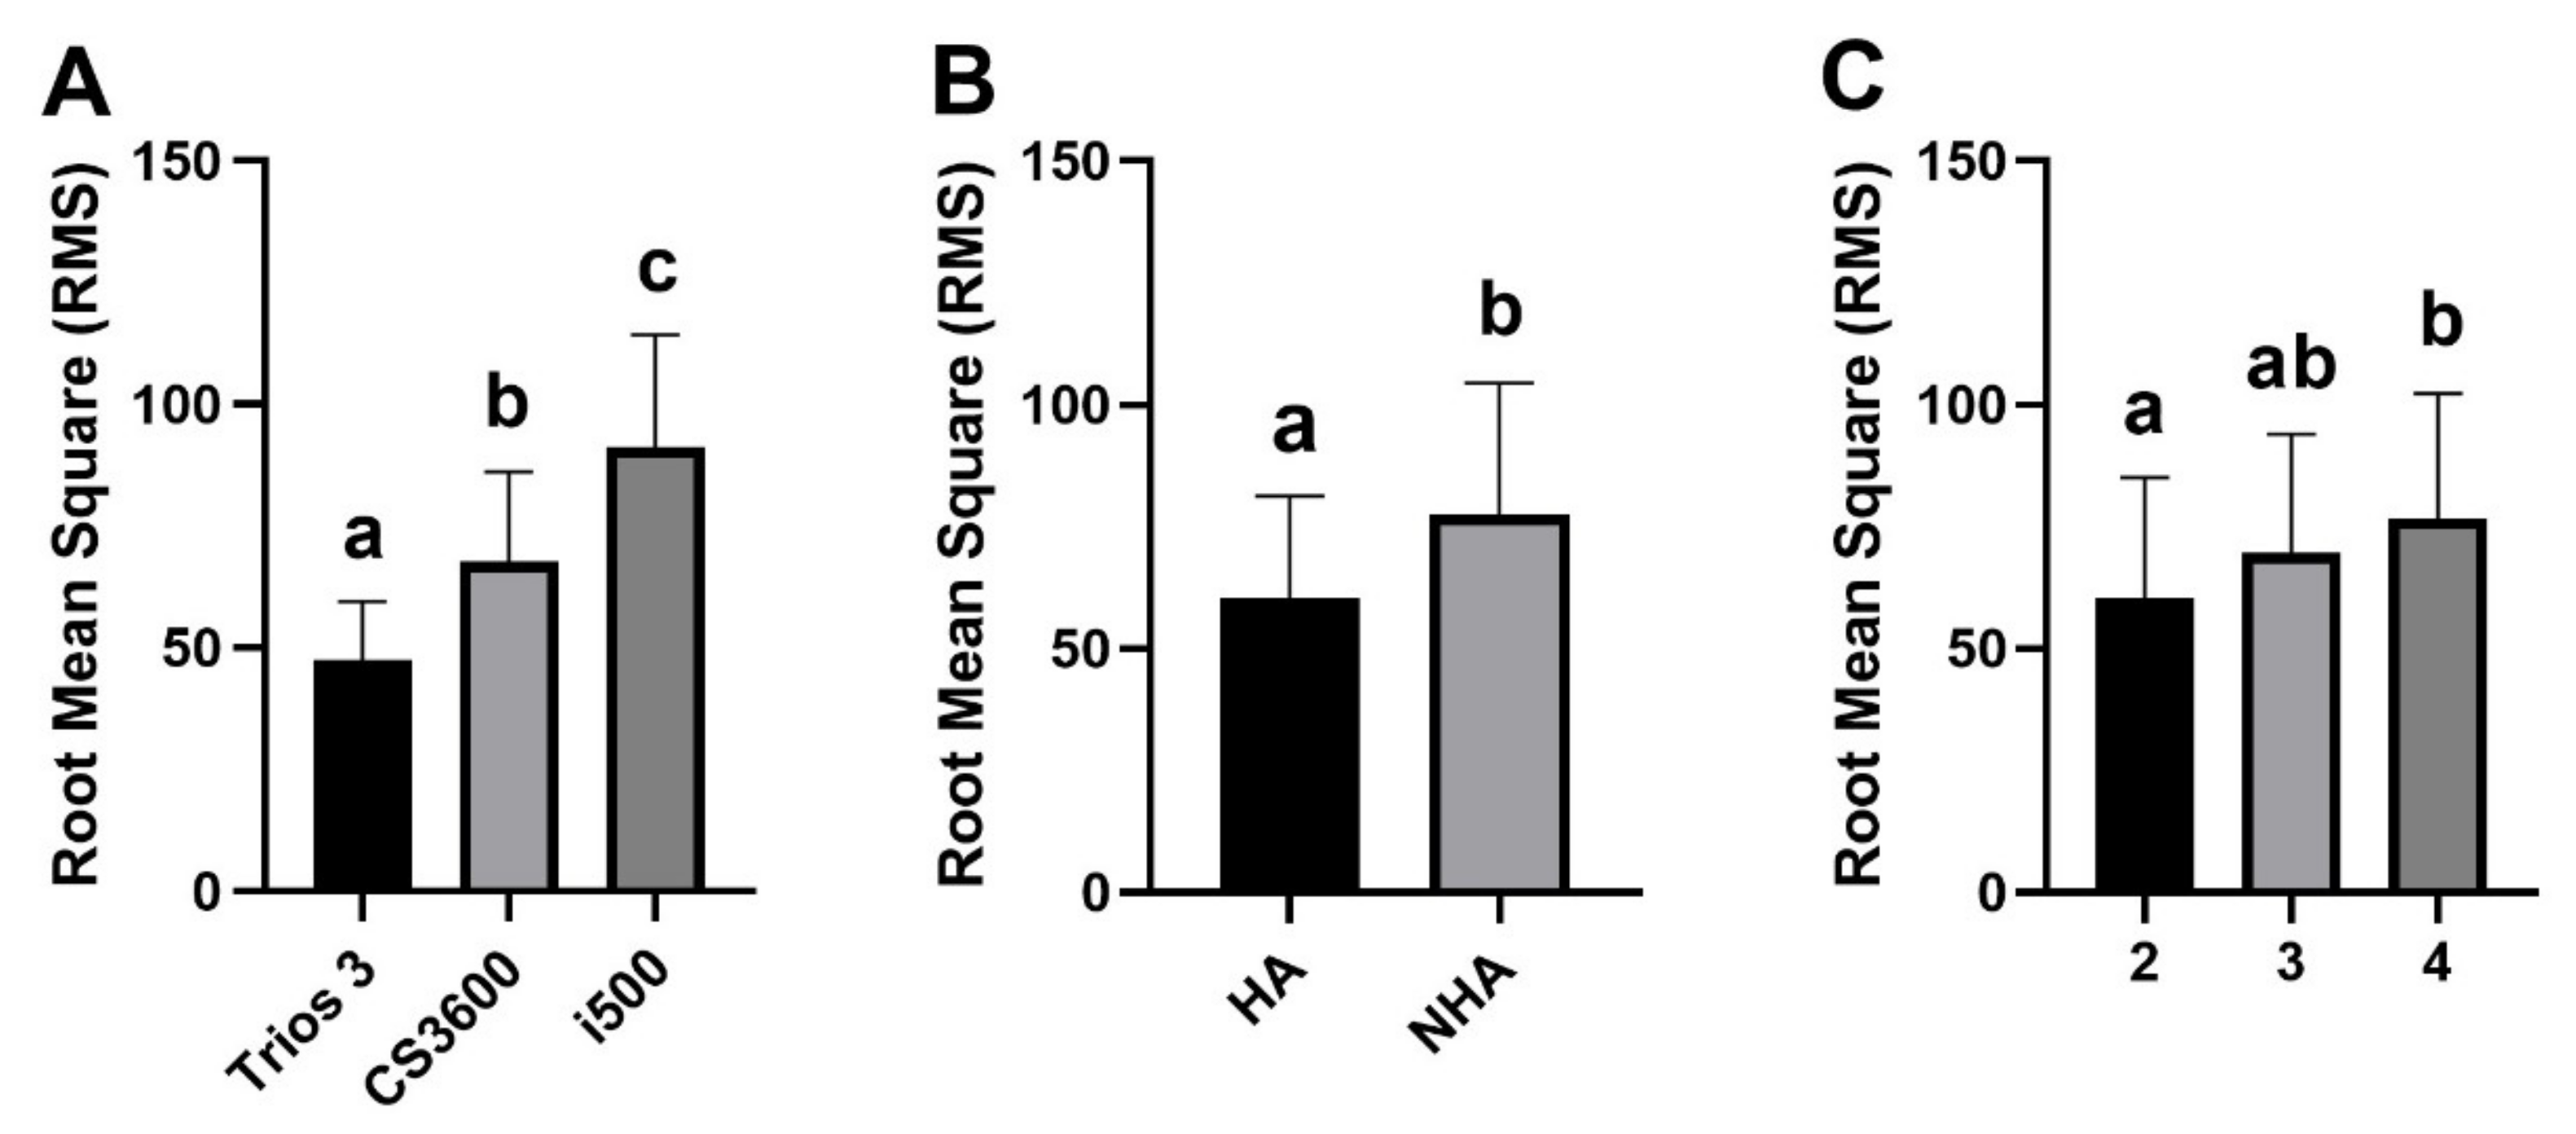
The trueness was influenced by the presence of an HA (
F = 48.155,
p < 0.05), the scanner (
F = 104.722,
p < 0.05), and the location of missing teeth (
F = 14.600,
p < 0.05). There was no significant interaction between these factors. The results of pairwise comparisons among factors are shown in
Figure 4. The trueness in each group is summarized in
Table 1. The results indicate that there were significant differences between almost all of the HA groups (HA-2, HA-3, and HA-4) and NHA groups (NHA-2, NHA-3, and NHA-4), with the exceptions of HA-3 and NHA-3 for the Trios 3 IOS. Additionally, there were significant differences between all three IOSs, with the trueness being best for the Trios 3 IOS, followed by the CS3600 and i500 IOSs. The pairwise comparisons based on the number of missing teeth revealed a significant difference only between groups with two teeth missing and groups with four teeth missing.
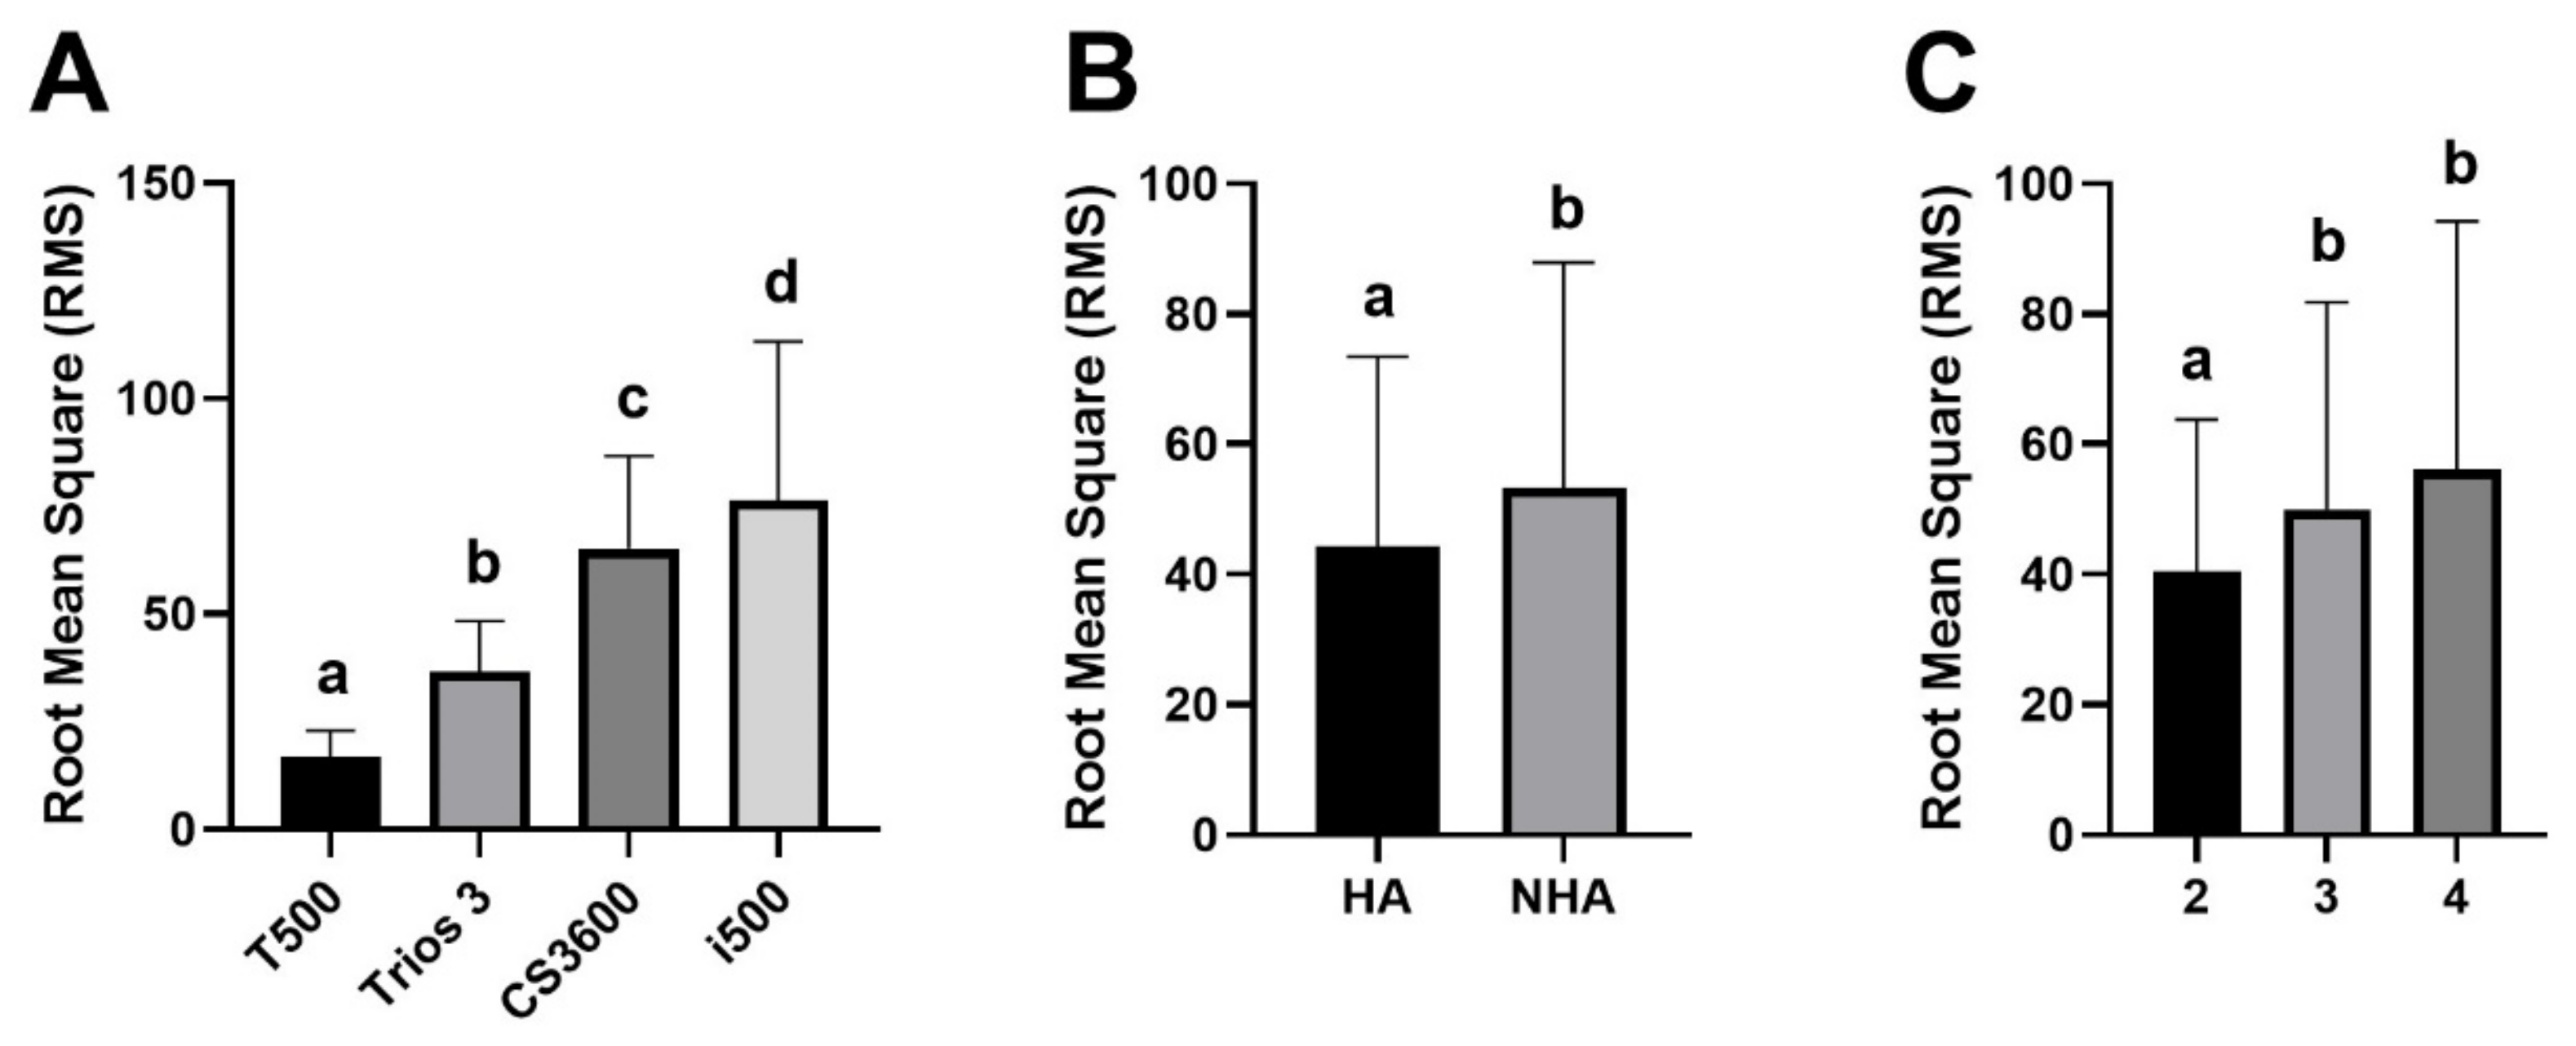
The precision was influenced by the presence of an HA (
F = 34.291,
p < 0.05), the scanner (
F = 312.483,
p < 0.05), the location of missing teeth (
F = 35.107,
p < 0.05), and the interaction between the location of missing teeth and the scanner (
F = 10.535,
p < 0.05). The results of pairwise comparisons among factors are shown in
Figure 5. The precision in each group is summarized in
Table 2. The results indicate that the precision was significantly higher in groups with an HA. Additionally, there were significant differences between all of the scanners, with the precision being best for the T500 scanner, followed by the Trios 3, CS3600, and i500 IOSs. The pairwise comparisons based on the number of missing teeth revealed significant differences between groups with two teeth missing and groups with three teeth missing, as well as between groups with two teeth missing and groups with four teeth missing.
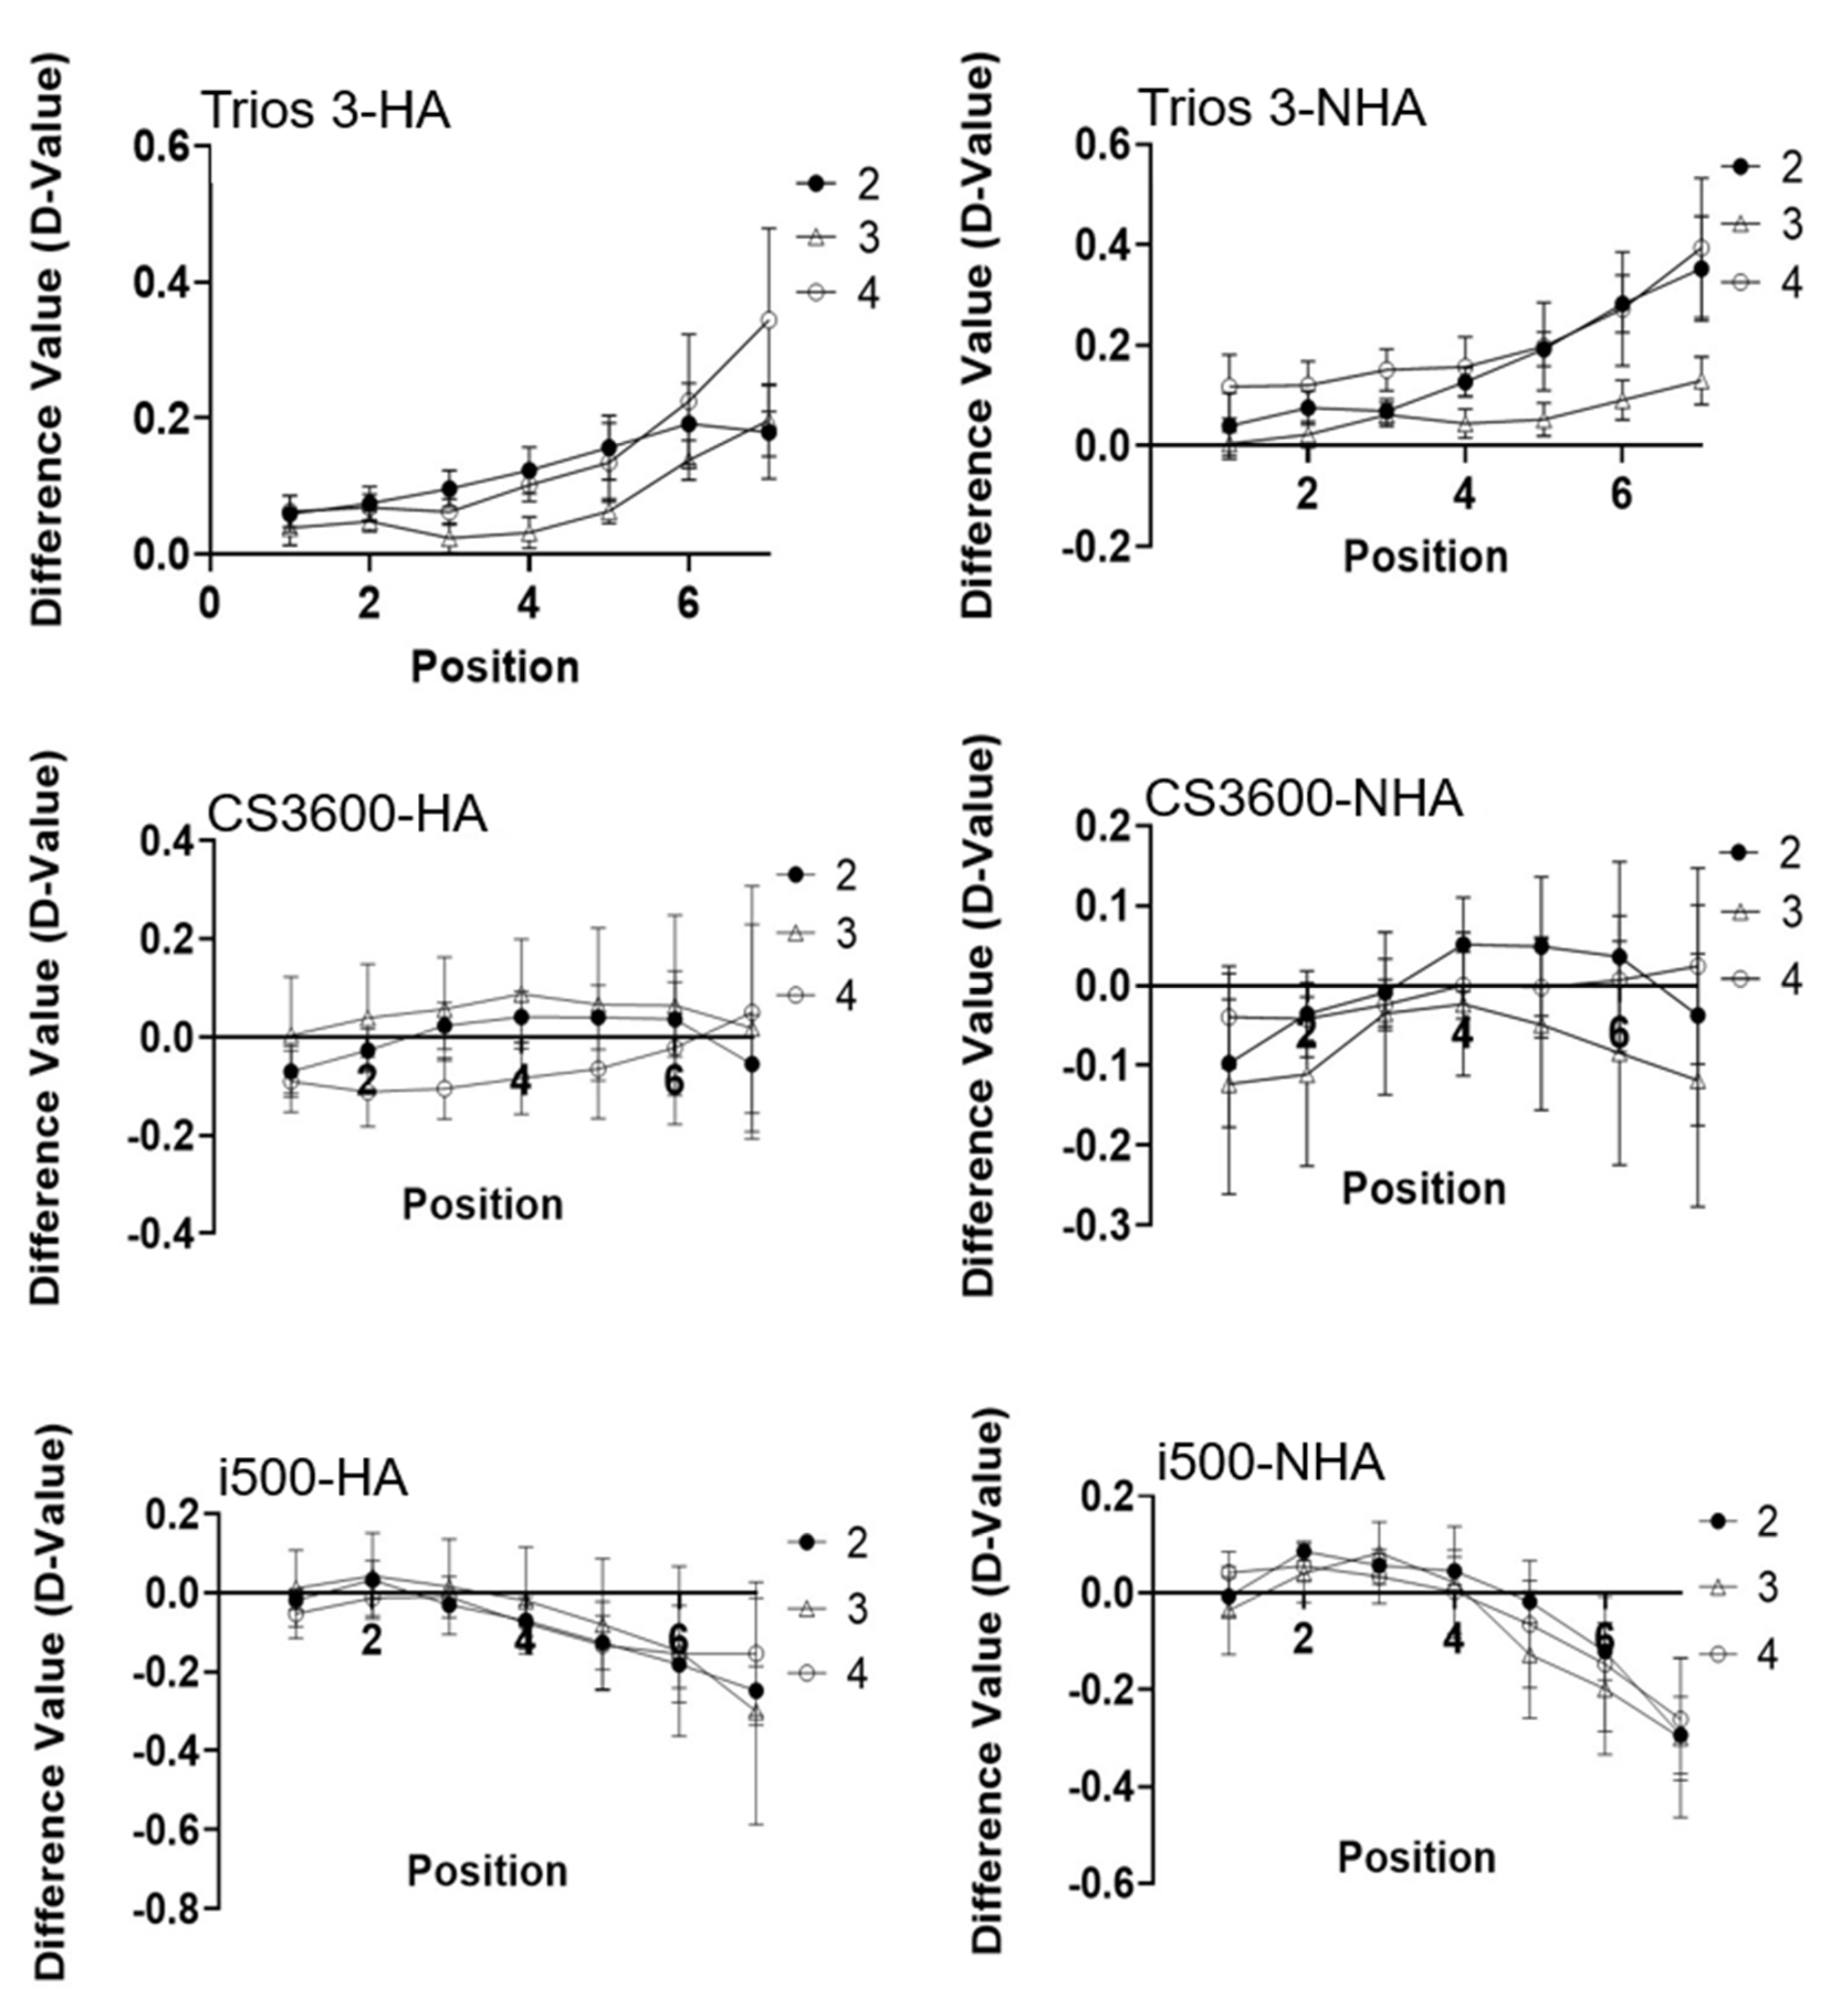
The results of the J–T trend test are summarized in
Table 3. The differences between the reference and measurement scans at each tooth position for the given scanners are illustrated in
Figure 6. A negative value of the Standard J–T Statistic in this case indicates that the difference decreased as the tooth position moved posteriorly, while a positive value indicates the opposite.
Table 3 indicates that positive values of the Standard J–T Statistic were found for the Trios 3 IOS and negative values were found for the i500 IOS. However, most of the values for the difference were negative. The differences increased as the tooth position moved posteriorly. Therefore, a significant upward trend of distortion was also found from the anterior tooth position to the posterior tooth position for the i500 IOS. However, no significant trend was found for the CS3600 IOS.
4. Discussion
This study evaluated the enhancement effect of an HA when making digital impressions with three commonly used IOSs and investigated the distribution of distortion across different tooth sites. The effect of the HA was assessed by determining how the accuracy varied according to whether or not an HA was applied in edentulous areas. The distribution of the distortion according to tooth sites was evaluated by comparing the distances between the upper and lower hemispheres at each tooth site.
The accuracy was significantly higher for groups with an HA. Therefore, the first null hypothesis was rejected, since the HA did affect the accuracy of virtual records obtained using IOSs. However, for the Trios 3 IOS, pairwise comparisons showed no significant difference between HA-3 and NHA-3. This may be attributable to both the HA-3 and NHA-3 scans obtained using the Trios 3 IOS showing higher trueness than for the other scanners, since high accuracy would mean that the presence or absence of the HA would not greatly influence any discrepancies in the accuracy. The results for all the scanners validated that the HA can be used as a landmark to facilitate the accuracy of scanning in edentulous areas.
The accuracy of an IOS was previously found to be lower in a long edentulous area, which would be improved if an artificial landmark was applied [
18]. This result may arise from the lack of stable features that could guarantee accurate stitching in an edentulous area [
25]. The presence of auxiliary geometric structures may enhance the outcomes of digital impressions of edentulous areas [
21]. When compared with the partially edentulous groups, the presence of an HA provided more complex geometry features for scanners to detect and allowed images to be stitched together smoothly, resulting in a significant enhancement in the scanning accuracy. Kim et al. [
18] reported the accuracy of IOSs could be improved when applying an artificial landmark on the edentulous area. Iturrate et al. [
26] evaluated the effect of an auxiliary geometric device (AGD) on the accuracy of intraoral scanning and they found the trueness and precision were significantly improved when the AGDs were applied on the edentulous jaws. However, considering clinical applicability, it can be impossible to employ additional artificial landmarks to improve the accuracy of scanning when making a digital implant impression. Therefore, according to the results of our study, simply keeping the HA present during the first scan may be desirable for improving the scan accuracy. In addition, complex geometric structures on the dental arch were found to contribute positively to the outcomes of image alignment [
20], which might have ameliorated the results in the HA groups in the present study. After applying an HA, the accuracy of the aligned arch increased significantly.
Several previous studies have found that the span and location of the edentulous area interferes with the accuracy of IOSs [
12,
27,
28,
29], and that the accuracy of the scanned data decreases with increasing distance between the scan bodies [
14]. The J–T trend test was applied in the present study to analyze how the distortion was affected by increasing the span length from the initial scanning position. The second hypothesis stated that the distortion in the accuracy of the scan does not vary from an anterior tooth position to a posterior tooth position. Based on the findings of the J–T trend test, the second hypothesis was partially rejected. For the Trios 3 IOS, a significant trend was found in all groups with a positive value of the Standard J–T Statistic, which indicated an upward trend from an anterior to a posterior tooth position. All Trios 3 groups tended to present extension of the maxilla and mandible when compared with the reference model. For the i500 IOS, a significant trend was found in all groups with a negative value of the Standard J–T Statistic, which indicated a downward trend from anterior to posterior positions. Since the values of the differences between the measurement and reference scans were mostly negative, with a numerically downward tendency, this indicates increased distortion in the posterior area, whereas the measurement scan models tended to show compression when compared with the reference scan models. To sum up, both the Trios 3 and i500 IOSs displayed variation trends in the distortion from anterior to posterior positions, with the Trios 3 IOS tending to show an extension form while the i500 IOS appeared to be more prone to a compression form of the upper and lower arches. In contrast, applying the J–T trend test to the CS3600 IOS showed no significant trend in either group.
Batak et al. [
30] evaluated the effect of the position of a coded healing abutment (CHA) on trueness of intraoral scanning. Two CHAs were placed at mandibular left first and second molar positions and then scanned by an intraoral scanner (TRIOS, 3Shape). The trueness of the first molar site was found significantly greater than of the second molar site. In our study, similar results were found in terms of the posterior sites. In
Figure 6, the trends of distortion in Trios 3 and i500 were found steady in the anterior tooth position yet suddenly rose in the posterior tooth position especially at position 6 and position 7. Therefore, the most easily distorted area may be distributed in the posterior tooth site.
As evident in
Figure 6, for the Trios 3 IOS, groups HA-3 and NHA-3 seemed to exhibit lower distortion along the arch span when compared with the other groups. This might have been due to the existence of the second molar in these two groups. For metal restorations, the scanner light that impinges on a surface without a powder coating tends to refract and scatter, which hinders the ability of the scanner to determine the depth of the object [
31]. Therefore, the accuracy tends to be lower for metal restorations than for natural teeth. Some studies have found that applying a powder coating to the surface will produce more accurate and consistent results when scanning materials with different layers [
32,
33]. However, the present study focused on the effects of the HA itself, and so other interference factors were minimized even though the outcomes for the accuracy of IOSs could have been better. Lee et al. [
20] reported that the precision of the scan data was significantly lower when there were greater than or equal to five missing teeth on the dental arch. Our study found the trueness and precision among the IOSs mostly decreased in the following order: HA-2 > HA-3 > HA-4, NHA-2 > NHA-3 > NHA-4. In addition, Braian et al. [
19] found the trueness for short-arch scans was <103 μm for edentulous scans and <56 μm for dentate scans. Comparing to our study, it seems that, despite the presence of the HA, the presence of a larger number of natural teeth in the model resulted in higher accuracy in the scanning process. Therefore, the anatomical morphology of natural teeth might be easier for IOSs to detect, resulting in superior results compared with HAs. The molar teeth constitute more complex anatomical structures, especially in the occlusal plane, which may also facilitate the scanning process.
Another important finding was that the trueness and precision mostly did not differ significantly among IOSs for the groups with four teeth missing when compared with groups in which three teeth were missing, while they differed significantly from groups with two teeth missing. This may be because the absence of two teeth facilitates continuous scanning across consecutive images from the anterior to the posterior direction, hence improving recognition and creating smaller errors [
34]. In groups with three or four teeth missing, the scanning process may be hampered from the canine to the first premolar, which is the turning point for different objects. Despite this, the present study still found that the scanning accuracy in the presence of the HA can be significantly improved compared with an edentulous dental arch.
A recent study found that for image stitching-based IOSs, local deviations appear at the distal end of a dental arch, while the video-based IOSs are likely to be more prone to compression of the dental arch [
35]. The results presented in
Figure 6 show that all of the IOSs performed similarly well. That figure indicates a large deviation at the end of the arch span for the Trios 3 IOS, with a trend for expansion of the upper and lower arches. The CS3600 and i500 IOSs mostly displayed compression of the arch according to the negative D-value, but the i500 IOS showed a greater deviation at the end of the arch span, while the CS3600 IOS was relatively harmonious. Regarding image acquisition methods, the Trios 3 IOS is a single-image capture system [
13], while the CS3600 and i500 IOSs capture images using a video acquisition system [
13,
36]. These differences between the methods of image acquisition among the IOSs may have influenced the distribution of the scan distortion. Yamamoto et al. [
37] compared the performance of two IOSs, one based on a single-image acquisition system (Bluecam version 4.0) and the other being a full-color video acquisition system (Omnicam version 4.2), and found that the optical performance was better for the full-color video acquisition system. Nevertheless, the graphical imaging mechanisms differ in these two scanners, as they generally do between scanners. It remains unclear which specific IOS or scanning strategy is the best, since different IOSs exhibit different accuracies based on the data capture mode, underlying principles, or software algorithms utilized [
28] and it may be arbitrary to attempt to explain these observations in our study. Since both previous studies and the present study have found differences in the strategies used to capture images among IOSs [
37,
38], future studies should further investigate the effects of differences between IOSs in terms of the image capture systems and graphical imaging mechanisms.
Regarding clinical considerations, the first primary scan of the target area is performed when manufacturing an implant prosthesis. After trimming off the implant area, HAs are replaced with scan bodies and the second scan is performed to acquire the positions of the scan bodies for transferring to the position of the implants. However, extreme situations such as the presence of undercut, steep, sharp, deep, angled, or crowded surfaces make it difficult for IOSs to capture accurate point clouds [
39,
40,
41]. The physical structure of scan bodies makes it difficult to scan the complete peri-implant gingiva, and so some clinicians will keep the HA in position during the first scan. After trimming off the HA area in the scan model, they remove the HA, air-dry the saliva and blood immediately, and perform the peri-implant gingiva scan, so as to guarantee the presence of the complete margin of the implant site. In addition, there is concern that the accuracy of the scan may decrease after removing the HA because, for those cases in which only residual ridges or structures with motion frenum remain, the landmarks used in the bite registration process disappear. Some clinicians, therefore, perform an anecdotal primary scan with the HA in the posterior region in order to provide a reference for the bite registration process. The results of the present study have demonstrated that the HA can significantly improve the accuracy of bite registration. Therefore, it is recommended that the first scan made during implant impression taking is performed with the HA present, and that bite registration is performed before scanning the scan bodies.
This study had some limitations. First, this was an in vitro study and, hence, ignored the complex situation of the actual oral condition, such as the presence of saliva, blood, and mist on the scanner head. In the clinical situation, the impact of those factors is not predictable. Second, it was not clear whether distortion occurred during the scanning or bite registration procedure. The current results only include the combined consequences of image distortion, while other types of distortion could arise during both procedures. Future studies should investigate the various scenarios where distortion occurs during the scanning procedure in order to provide information that the manufacturers of IOSs can use to improve their products. Studies of the mechanisms underlying the operation of IOSs are also recommended to obtain a better understanding of these systems.


