Article

Development of Simulation Based p-Multipliers for Laterally Loaded Pile Groups in Granular Soil Using 3D Nonlinear Finite Element Model

Department of Civil and Environmental Engineering, Hanyang University, Seoul 04763, Korea
*
Author to whom correspondence should be addressed.
Appl. Sci. 2021, 11(1), 26; https://doi.org/10.3390/app11010026
Submission received: 23 November 2020 / Revised: 18 December 2020 / Accepted: 18 December 2020 / Published: 22 December 2020
(This article belongs to the Section Civil Engineering)

Abstract

:
The behavior of laterally loaded pile groups is usually accessed by beam-on-nonlinear-Winkler-foundation (BNWF) approach employing various forms of empirically derived p-y curves and p-multipliers. Averaged p-multiplier for a particular pile group is termed as the group effect parameter. In practice, the p-y curve presented by the American Petroleum Institute (API) is most often utilized for piles in granular soils, although its shortcomings are recognized. In this study, we performed 3D finite element analysis to develop p-multipliers and group effect parameters for 3 × 3 to 5 × 5 vertically squared pile groups. The effect of the ratio of spacing to pile diameter (S/D), number of group piles, varying friction angle (φ), and pile fixity conditions on p-multipliers and group effect parameters are evaluated and quantified. Based on the simulation outcomes, a new functional form to calculate p-multipliers is proposed for pile groups. Extensive comparisons with the experimental measurements reveal that the calculated p-multipliers and group effect parameters are within the recorded range. Comparisons with two design guidelines which do not account for the pile fixity condition demonstrate that they overestimate the p-multipliers for fixed-head condition.

1. Introduction

Pile foundations are commonly used to withstand both vertical and lateral loads. The lateral response of a pile–soil system is an important design consideration for pile foundations. Well-known methods for prediction of lateral response of a single pile includes the elastic solution proposed by Poulos and Davis [1], strain wedge method proposed by Ashour et al. [2], beam-on-nonlinear-Winkler-foundation (BNWF) model framework, and continuum analysis [3,4,5,6,7,8].
The most common method to analyze the lateral response of piles is the BNWF approach. In this approach, the interaction of the pile–soil system is represented by the p-y curve, where p is the soil resistance and y and is the lateral displacement. Various functional forms of p-y curves are used for the piles embedded in sands such as Reese et al. [9] and API [10]. American Petroleum Institute API [10] provides some simple guidelines to develop nonlinear p-y curves that are most often used in practice. However, a number of researchers [11,12,13,14,15] reported that the use of these generic curves may produce a high level of error in the prediction of lateral response of pile foundations. Despite their documented shortcomings, practitioners most often use the API curves owing to their ease of use.
The BNWF model is also widely used to analyze the pile group response subjected to lateral loading. When piles act in a group, the soil resistance decreases due to ”shadowing effect” and ”edge effect”, as reported by Larkela [16]. This reduction in resistance is accounted in the BNWF model by introducing a reduction factor, termed the p-multiplier, first proposed by Brown et al. [17]. To account for the shadowing effect, a higher value of p-multiplier is typically applied to the leading row relative to the trailing rows. Various studies recommended that p-multipliers for squared vertical groups are a function of center-to-center spacing and soil type [17,18,19,20,21,22]. Extensive studies have been performed to derive the p-multipliers from field and model tests [17,19,20,22,23,24,25,26,27]. Brown et al. [28] also reported that it is quite acceptable to use an average p-multiplier for all the piles in the group, rather than applying p-multipliers for each row. This averaged p-multiplier is referred to as the group effect parameter. The group effect parameter is widely used in a dynamic analysis, where the direction of the loading changes, converting “leading“ rows of pile immediately into ”trailing rows” [28].
The p-multiplier is most often determined from an iterative process involving comparisons of the BNWF model result with a reference field load test output. After selection of the p-y curves, BNWF analyses are performed with a range of p-multipliers. The p-multiplier that produces the most favorable fit with the reference set of data is selected. Because experimental data are required, there is a limitation on the cases that can be considered. Full-scale tests have been mostly performed using 3 × 3 free-head group pile with spacing to diameter ratio (S/D) of 3. The effect of number of piles, S/D, and soil shear strength cannot be evaluated. Additionally, it was reported that the p-multiplier is sensitive to the p-y curves [28]. Considering that the design p-y curves do not provide realistic representation of the pile–soil interaction, the p-multiplier derived from this procedure may not be reliable. Additionally, because only the load–displacement outputs are compared, the BNWF model may not provide an agreeable fit with the bending moment profile.
The p-multiplier can also be directly calculated from the ratio of p calculated for group and single piles [17,22,29,30]. For this direct extraction, full 3D numerical simulations need to be performed. Because the ratio changes with the depth, an averaged value calculated up to the depth of influence should be extracted. Numerous studies have been performed to investigate the response of group piles subjected to lateral loading based on 3D numerical analyses. Brown and Shie [3] performed numerical simulation of one row of piles subjected to lateral loading. It was observed that group effects are most significantly influenced by the row position and center-to-center pile spacing. Yang and Jeremić [31] performed numerical simulations of 3 × 3 to 4 × 3 pile groups. However, the influence of S/D on p-multiplier was not reported. Abu-Farsakh et al. [30] proposed site specific p-multipliers for vertical and battered 3 × 4 pile groups with S/D = 4.3 and 2.5 using the commercial finite element analysis code ABAQUS. The site consisted mainly of a clay deposit. The influence of number of piles, S/D, and soil type on p-multipliers was not accounted. Albusoda et al. [32] performed experimental and numerical modeling of laterally loaded regular and finned pile foundation in sand. Site specific p-multipliers were calculated for the pile groups that consist of a maximum of five piles. To model the sand behavior, the Mohr–Coulomb model was used. The effect of number of piles and soil condition on p-multipliers was not evaluated. Fayyazi [14] used the procedure of Rollins et al. [25] to extract the p-multipliers and develop group factors for piles in sand profiles by performing a comprehensive parametric study. However, instead of using the group pile load test measurements, 3D finite difference analyses were performed. Because the 3D model and BNWF model outputs showed poor fits, p-multipliers could not be directly derived. Therefore, the shear modulus of the soil layers for the 3D model was manually adjusted. Additionally, use of the API curves, which have been reported to provide an unrealistic estimate of the soil resistance, is likely to have influenced the derived p-multipliers. These adjustments are not needed if the p-multipliers are directly extracted from a 3D continuum analysis, or more realistic p-y curves should be used in the BNWF model. Literature review reveals that uncertainties remain in estimation of p-multipliers for pile foundations in granular soils.
In this study, p-multipliers and group effect parameters for piles in granular soils are developed from a parametric study utilizing 3D nonlinear finite element (FE) analyses. The p-multipliers are calculated directly from the numerical analyses. The effect of S/D, number of group piles, friction angle φ, and pile fixity conditions are evaluated and quantified. Based on the simulation outcomes, a new functional form for p-multipliers of pile groups is proposed. The proposed equation is compared with available measured values. Comparisons are also made with multipliers presented in AASHTO [33] and FEMA [34] design codes.

2. Summary of p-Multipliers and Group Effect Parameters

In this section, a comprehensive summary of the experiment and simulation-based p-multipliers and group factors of group piles in sands are presented. The experiment-based results are a combination of both field and centrifuge model tests. Table 1 shows the calculated p-multipliers from experimental tests for free-head pile groups. The tests were conducted on steel pipe piles except for the tests of Ruesta and Townsend [22], where concrete piles were used. In all of these tests, the range of S/D was from 3 to 5.65, whereas φ varied from 32° to 40°. The tests were performed using 3 × 3 piles groups, whereas the tests of Ruesta and Townsend [22], Walsh [27], and McVay et al. [24] were performed on 4 × 4, 3 × 5, and 3 × 7 pile groups, respectively. The proposed p-multipliers range from 0.65 to 1.0 for the leading row, whereas the multipliers range from 0.4 to 0.85 for the first trailing row. Table 2 summarizes the p-multipliers for the fixed-head pile groups. The p-multipliers measured for the leading and first trailing rows were 0.8 and 0.4, respectively. It is demonstrated that the multipliers are smaller for the fixed-head piles. Table 3 lists the p-multipliers calculated from numerical analyses. Whereas S/D was mostly fixed to 3 in experimental tests, they were varied from 3 to 6 in the numerical simulations. The dependences on S/D and pile fixity condition can be observed, which were not evaluated in the field and centrifuge tests.

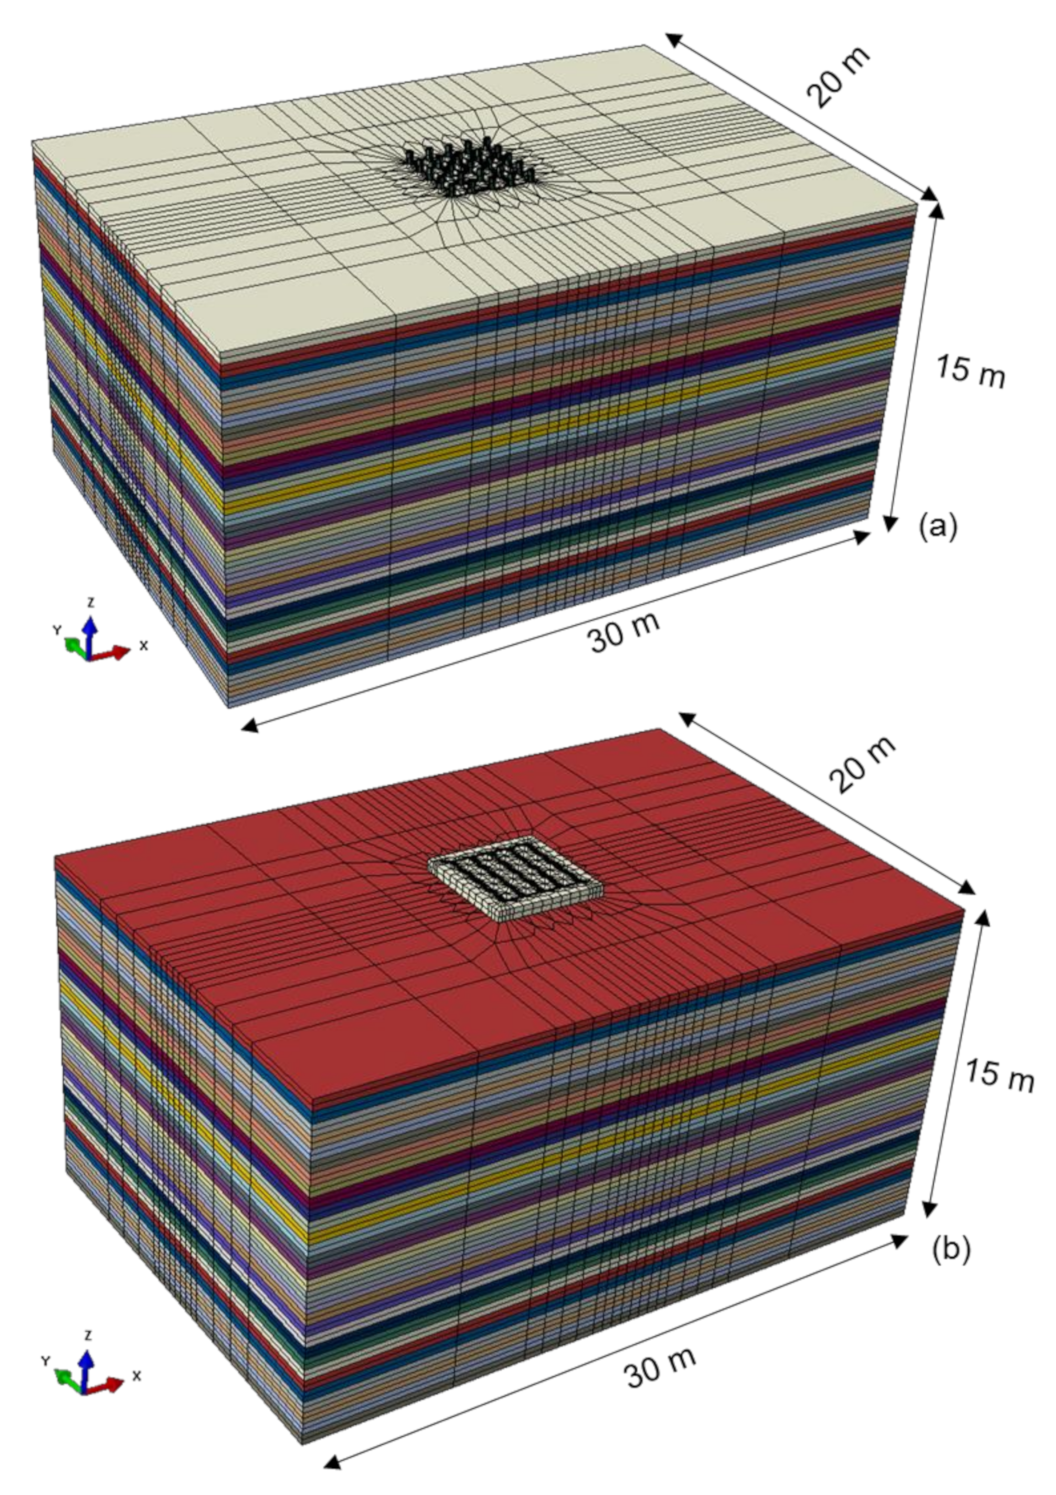
3. Finite Element (FE) Model

The 3D nonlinear FE model of the pile group is shown in Figure 1. The size of the computational domain was determined after a sensitivity analysis such that the calculated responses were not affected by the boundaries. The length and width of the numerical model were set to 50D and 33D from the center of the foundation, where D is the pile diameter. The pile configurations considered in this study are 3 × 3, 4 × 4, and 5 × 5 pile groups. The size of the computational domain is 30, 20, and 15 m in length, width, and height, respectively. The convergence analysis for the finite element mesh was also performed to determine optimum element sizes to obtain accurate results. The mesh was generated in such a way that it was finer near the piles and coarser towards the boundaries of the computational domain. The width of the smallest element was 0.15D. Eight-node brick elements (C3D8) were used to model both the piles and soil. The interface between the piles and soil was modeled using a surface-to-surface contact model that allows for both slipping and normal separation (gapping). The Coulomb model was used to simulate the tangential slip, where the friction coefficient was set to tan(2/3φ), as used in the study of Park et al. [38].
The pile group was placed at the center of the computational domain. The length of the piles was fixed to 12 m. Pile bottoms were tied to the soil elements. The bottom of the computational model was fixed in the horizontal and vertical directions. The horizontal displacement constraints were applied at the lateral boundaries. No constraint was applied at the surface of the soil domain. To simulate the fixed pile head condition, pile heads were tied with a pile cap. The pile cap was fixed in the vertical direction, whereas lateral movement was allowed. The piles were modeled using the linear elastic model. The properties of the hollow steel pipe pile are listed in Table 4. The piles were modeled as solid rods with an outer diameter of 0.3 m. To achieve identical flexural rigidity as the reference steel pipe pile, the modulus of elasticity of the solid piles was adjusted such that it was equivalent to that of the steel pipe pile, as summarized in Table 4.
The nonlinear soil stress–strain behavior is simulated using the bounding surface plasticity model of Borja and Amies [39]. The model was selected because it has been widely used in the simulation of the seismic response of soils. It is reported to have no purely elastic region, and therefore effective in modeling even the small-strain nonlinearity of soil. The shear modulus reduction curve derived from the plasticity model is as follows:
G G m a x   =   1 3 2 γ 0 0 2 τ 0 h R / 2 + τ 0 τ τ m + H 0 1 d τ
where G G m a x is the secant shear modulus normalized to maximum shear modulus; γ 0 is the shear strain; τ 0 is the shear stress; R is radius of the bounding surface; h and m, which are the coefficient and exponent of the exponential hardening function, respectively; and H0 is the kinematic hardening parameter. This plasticity model was implemented in ABAQUS using the UMAT subroutine code developed by Zhang et al. [40]. The numerical models of single and 3 × 3 group piles were validated against the field test measurements of Rollins et al. [25]. The details of the numerical model and validation results are reported in Adeel et al. [41].

3.1. Procedure for Extraction of p-Multipliers

The p-multipliers were calculated directly from the 3D FE model by dividing the computed average soil resistance of a row within a pile group configuration and within a prescribed depth by that of the single pile model at a selected displacement. The double derivation of the bending moment with respect to depth was used to calculate p. The bending moment profile was first fitted with a seventh order polynomial function before derivation. Figure 2 shows the averaged soil resistance with respect to depth for the single pile and leading row of the 3 × 3 free-head group pile. It was observed that the maximum soil resistance occurs within a normalized depth of 15 z/D. Similar observations were reported in Souri et al. [29]. Therefore, p within a depth of 15 z/D was averaged to calculate the p-multiplier. Static loading was applied at the pile top in the lateral direction. A displacement controlled approach was used in the numerical simulation. It was reported in Fayyazi [14] that the upper range of pile head displacement in the experimental tests listed in Table 1 and Table 2 is 50 mm. Hence, to be consistent with the experimental studies, the p-multipliers and group effect parameters were extracted at a displacement of 50 mm.

3.2. Parametric Study

This section describes the parametric studies performed to derive the p-multipliers and group effect parameters of group piles in sand. A suite of nonlinear 3D analyses was performed to investigate the effect of different pile configurations (3 × 3, 4 × 4, and 5 × 5), pile head fixity (free and fixed), S/D (3, 4, 5, and 6), and friction angle (φ) of sand (30°, 35°, and 40°). The depth of the soil profile was set to 15 m. The soil profile was assumed to be composed of uniform soil with a constant φ, but the shear wave velocity ( V s ) was varied with depth to account for its dependence on confining pressure. It is first calculated by determining the overburden and energy corrected SPT blow count ( N 1 60 ) and then converting to V s . Values of N 1 60 were back-calculated from φ using the correlation of Hatanaka and Uchida [42] presented in Equation (2):
ϕ = 20 N 1 60 + 20
N1(60) blow count was converted to N60 using the equation of Liao and Whitman [43]. Finally, the V s profile was calculated using the empirical equation of Kwak et al. [44] for sand. The calculated shear wave velocity used in the simulations is shown in Figure 3. V s is shown to increase with depth. The unit weight of the soil was set to 18 kN/m3. The water table reduces the effective stress of soil and also the stiffness of the p-y curve. However, because the water table is most often below the 10D critical depth of influence, it was assumed that the soil is dry.

4. Results and Discussions

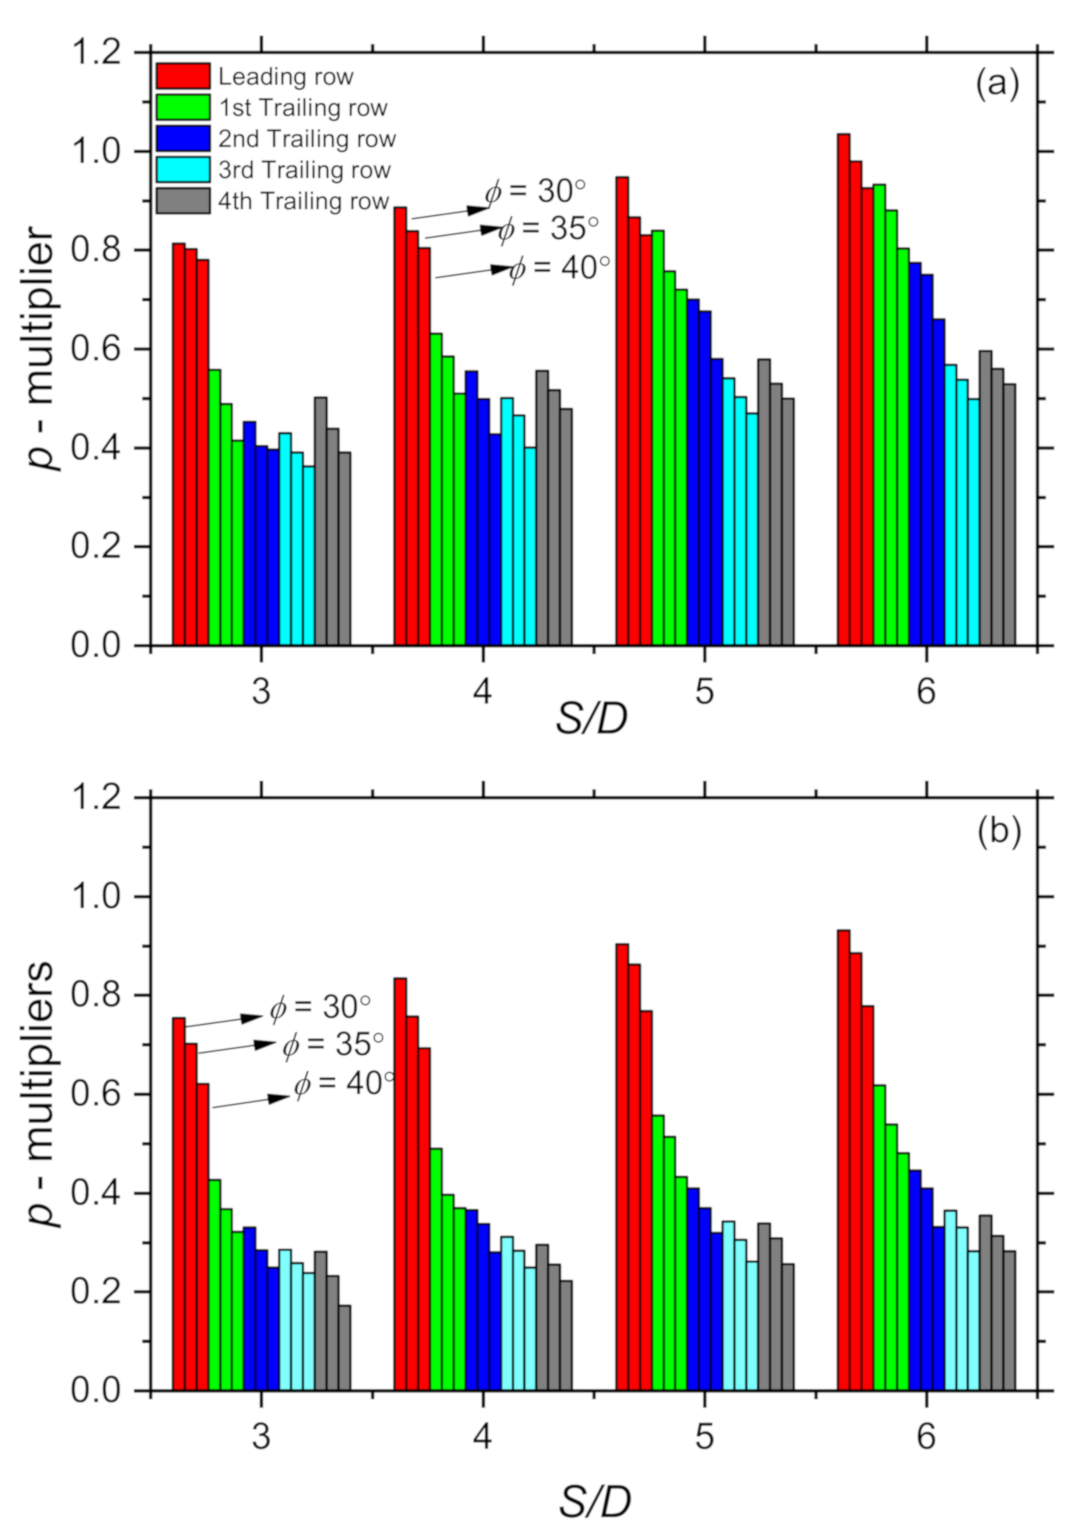
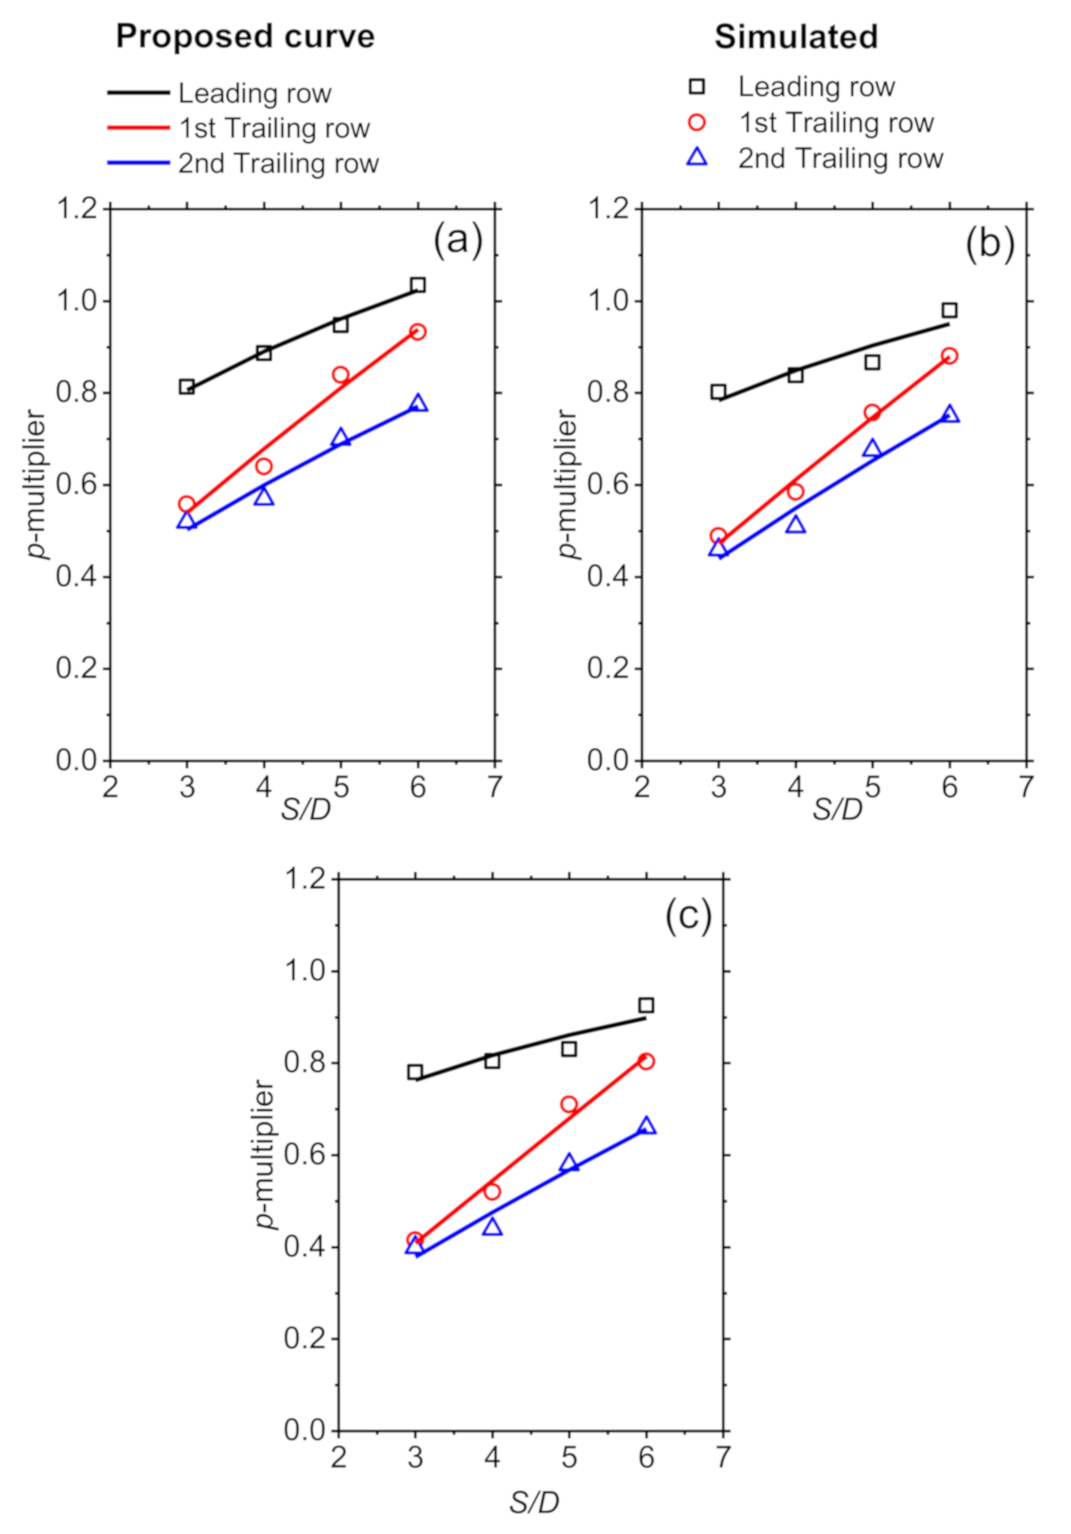
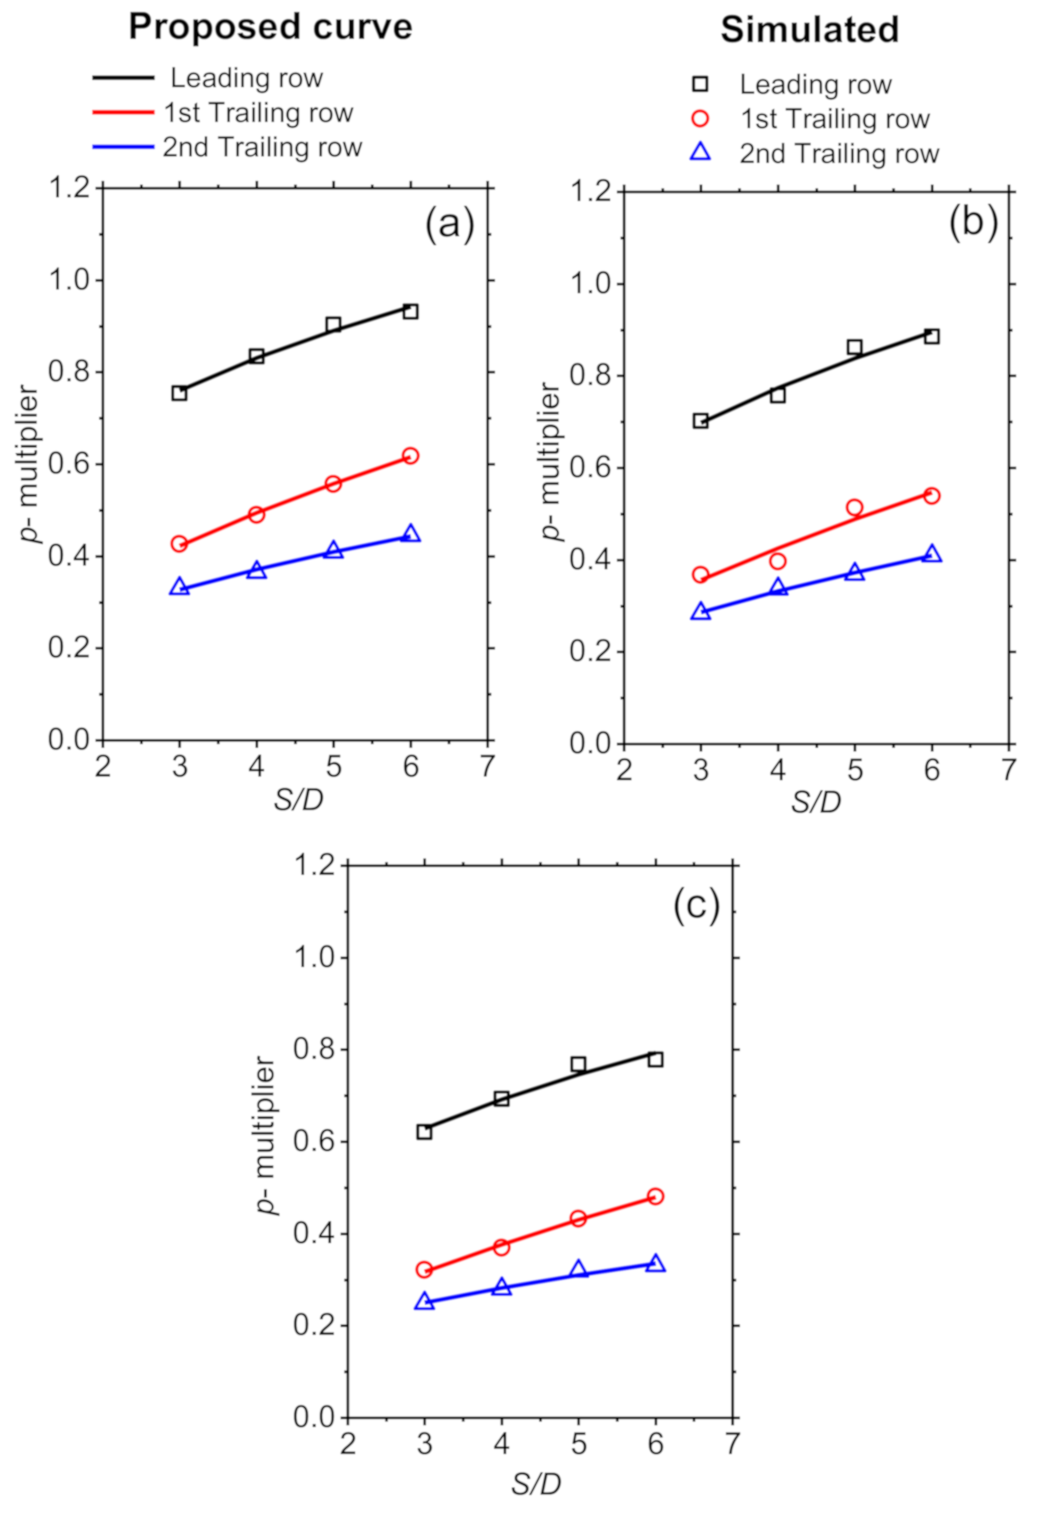
4.1. Effect of φ, S/D, Pile Head Fixity and Number of Piles on p-Multipliers

Friction angle φ is observed to have a primary influence on p-multipliers. Figure 4 plots the variation of p-multipliers for 5 × 5 free- and fixed-head pile groups with φ and S/D. The p-multiplier is shown to decrease with an increase in φ. It was reported in Ashour et al. [2] that increasing φ causes a wedge-shaped influence zone in front of each pile to increase, which in turn produces larger a shear zone and ultimately higher level of interaction between piles. Calculated p-multipliers for free-head pile groups range from a minimum value of 0.36 for φ = 40° and S/D = 3 to a maximum value of 1.0 for φ = 30° and S/D = 6. The p-multipliers are positively correlated to S/D because the shadowing and edge effects reduce with an increase in S/D.
The p-multipliers are highly dependent on the pile head condition. The fixed-head pile groups yield lower p-multipliers compared with those for the free-head pile groups, because a higher level of group interaction is produced. For φ = 30°, the p-multipliers for 3 × 3 fixed-head pile groups are 0.75, 0.42, and 0.3 for the leading, first, and second trailing rows, respectively. On the contrary, for the free-head pile group, the p-multipliers increase to 0.81, 0.55, and 0.51 for leading, first, and second trailing rows, respectively. A pronounced difference is found in the p-multipliers of the leading and first trailing rows for the fixed-head condition, especially at S/D = 5 and 6, as compared with the free-head condition. For the widely used spacings of S/D = 3 and 4, the p-multipliers converge at the third row. For larger spacings, the p-multipliers are shown to continuously decrease for third and fourth trailing rows. However, for conservative design, it can be assumed to converge after the second trailing row. The number of piles is shown to have negligible influence on the calculated p-multipliers. Therefore, the p-multipliers for 3 × 3 can also be applied to 4 × 4 and 5 × 5 pile groups.
It is demonstrated in detail that the p-multipliers are sensitive on φ, pile head fixity, and S/D. In order to capture the effects of these parameters, the following functional form is proposed to calculate p-multipliers:
p multiplier   = a S D b
where a and b are curve fitting coefficients, summarized in Table 5. These coefficients are dependent on the fixity condition and φ. It should also be noted that only p-multipliers up to second trailing rows are presented because of marginal variation in the calculated values for the following rows. Figure 5 and Figure 6 show the calculated p-multipliers plotted against S/D, along with the proposed functional form. The p-multipliers obtained using the equation developed matches well with the calculated results. Therefore, this equation can be used to predict the p-multipliers for both free- and fixed-head pile groups subjected to lateral load.

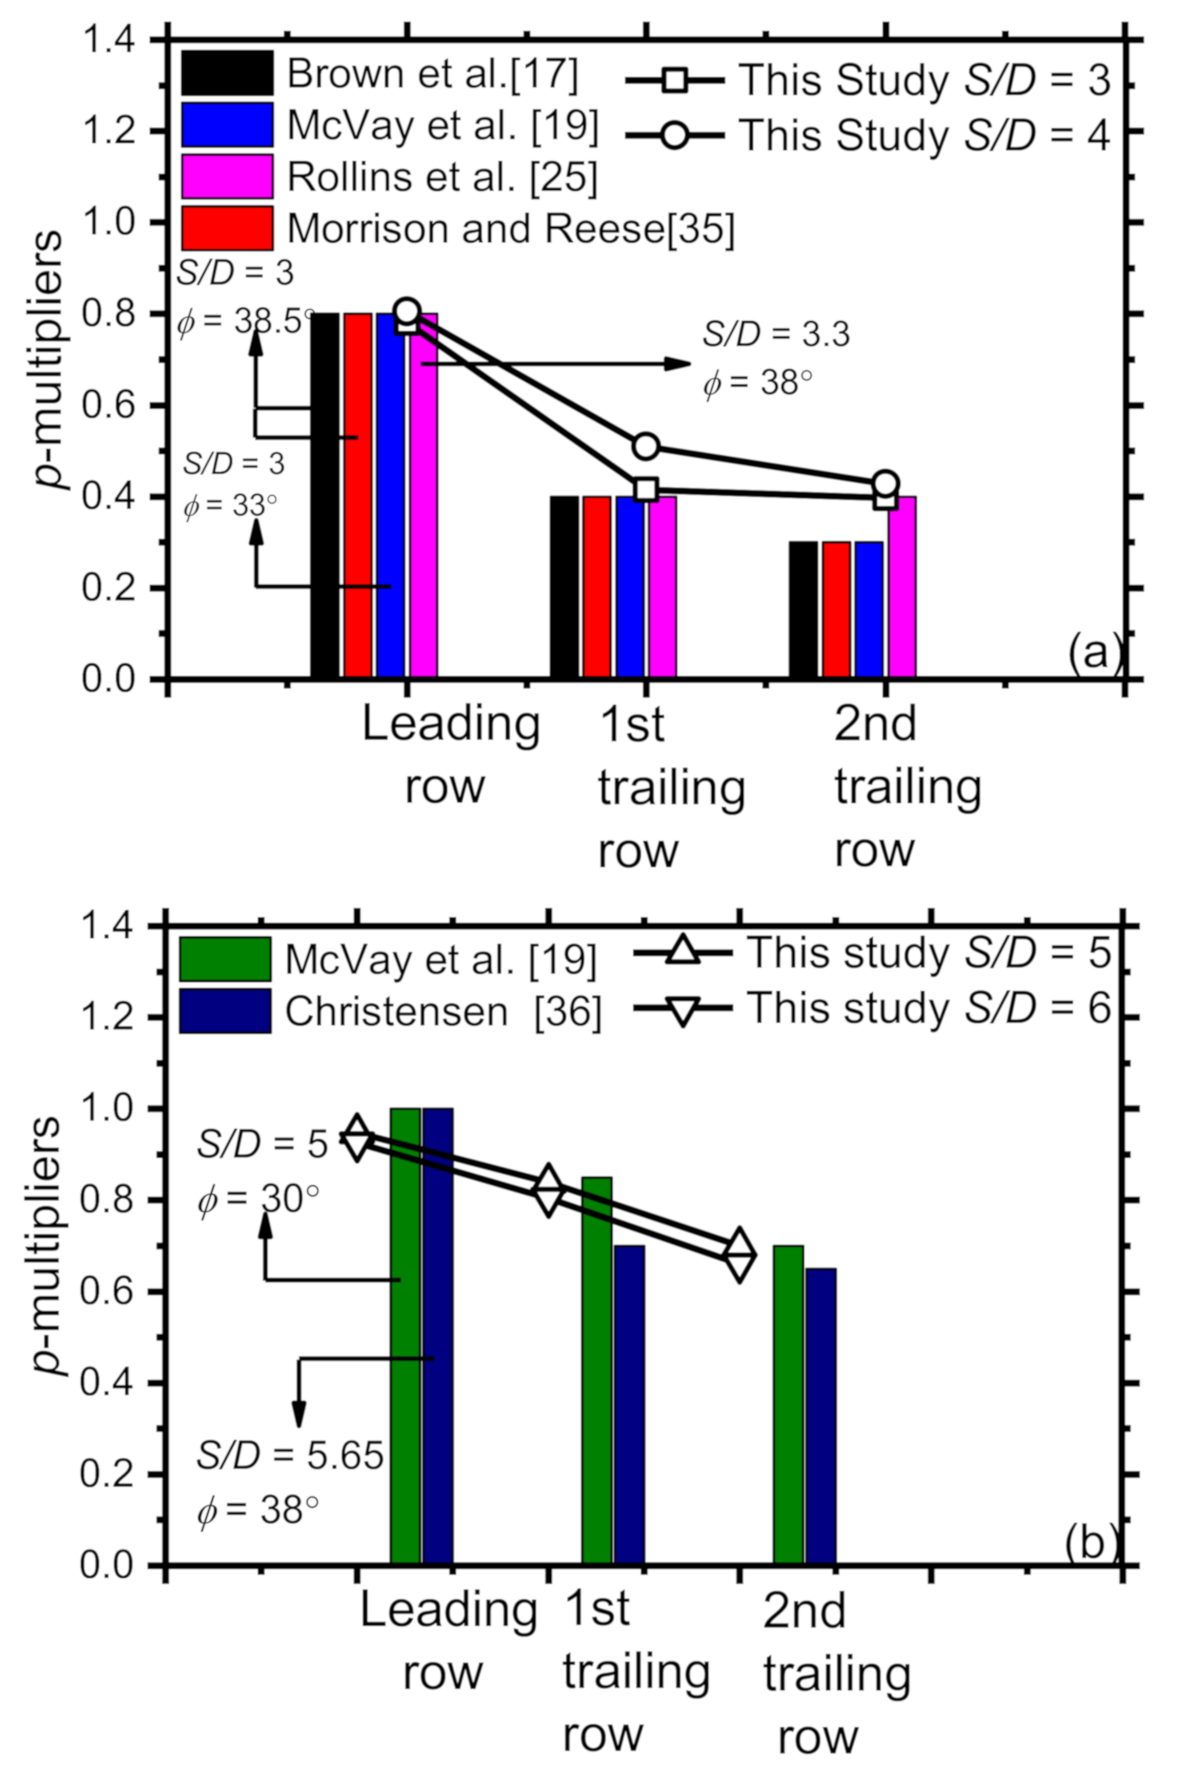
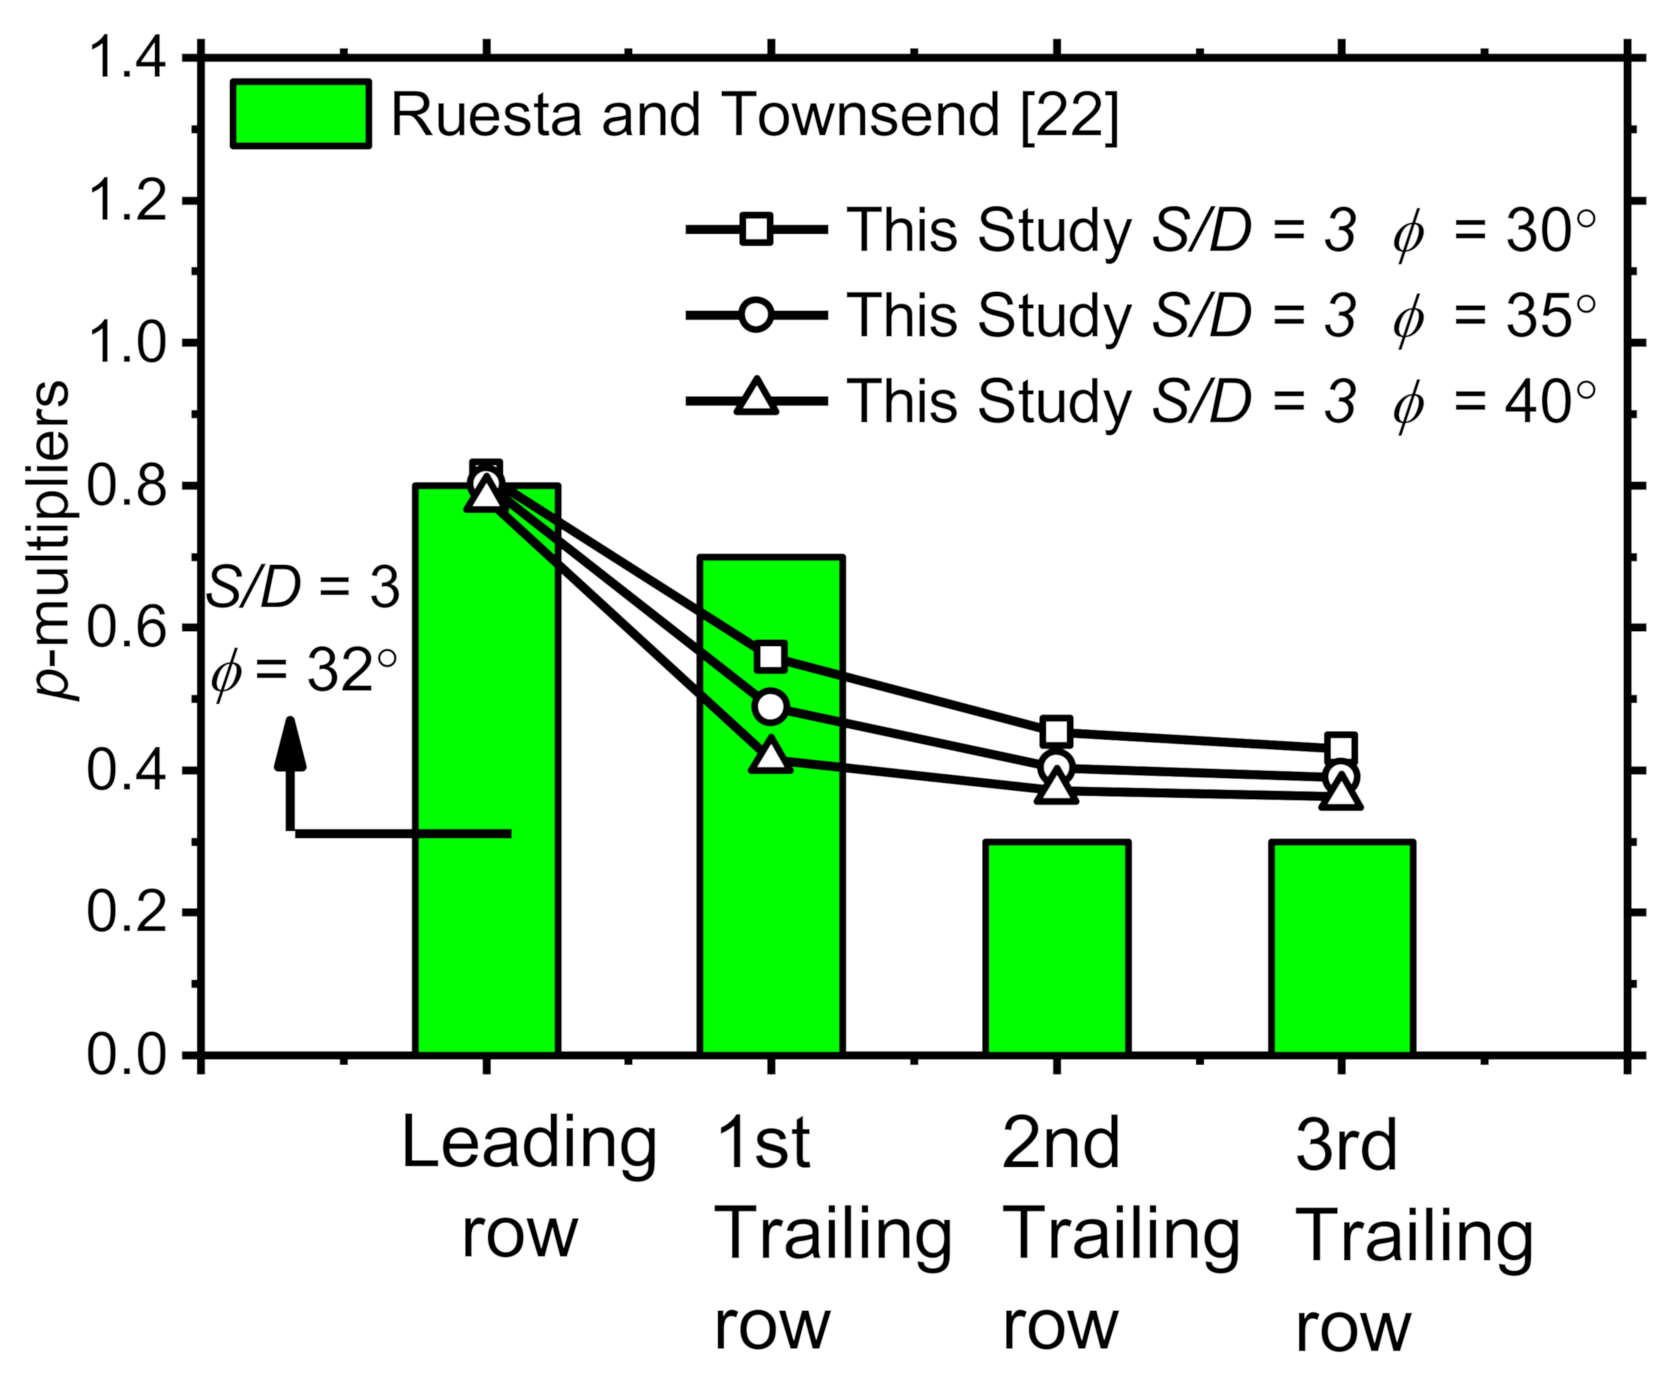
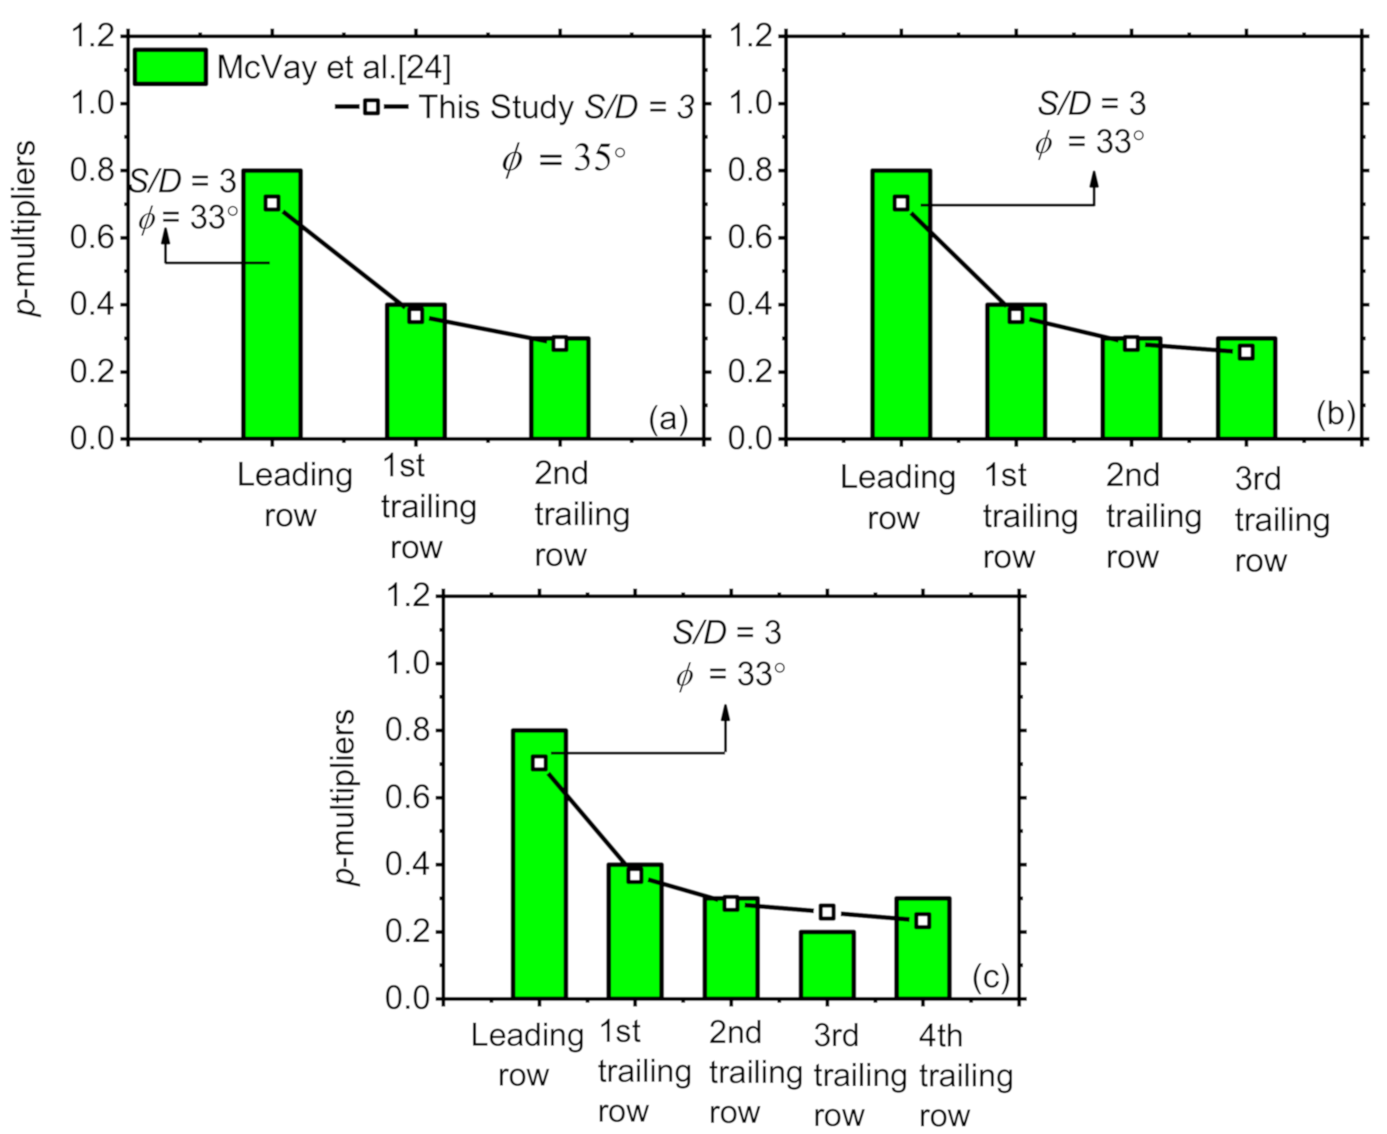
4.2. Comparsion of p-Multipliers and Group Effect Parameters with Experimental Studies

In this section, the calculated p-multipliers and group effect parameters from the numerical simulations are compared with those derived from previous experimental studies. Figure 7 compares the results of the p-multipliers calculated for 3 × 3 free-head pile groups with experimentally extracted values [17,19,25,36,37]. Brown et al. [17] and Morrison and Reese [35] used a S/D ratio of 3, whereas McVay et al. [19] performed tests on piles with S/D ratios = 3 and 5. Rollins et al. [25] and Christensen [36] performed experimental tests on piles with S/D ratios = 3.3 and 5.65. Full-scale lateral load tests were conducted by [17,25,36,37] in granular soil with φ = 38°. The friction angle φ of soil were reported as 30° and 33° for the tests performed by McVay et al. [19]. The experimentally derived and numerically calculated p-multipliers are shown to be comparable. Figure 8 shows the p-multipliers calculated for 4 × 4 free-head pile group performed by Ruesta and Townsend [22] along with those derived from the numerical simulations. φ = 32° and S/D = 3 were adopted in their study. The p-multipliers for the leading row calculated in this study are in line with that measured from field tests. The calculated multiplier is slightly lower for the first trailing row, and higher for second and third trailing rows. Overall, the calculated and recorded values are again comparable.
Figure 9 compares the calculated and measured p-multipliers for fixed-head pile groups. McVay et al. [24] conducted tests on fixed-head pile groups, which were 3 × 3, 3 × 4, and 3 × 5. S/D was fixed to 3 and φ = 33° was used. For comparison, the results for 3 × 3, 4 × 4, and 5 × 5 pile groups are displayed for S/D = 3 and φ = 35°. The calculated and measured p-multipliers are shown to match favorably. The extensive comparisons reveal that the simulated p-multipliers are in line with those measured, further ensuring that the numerically derived values are reliable.

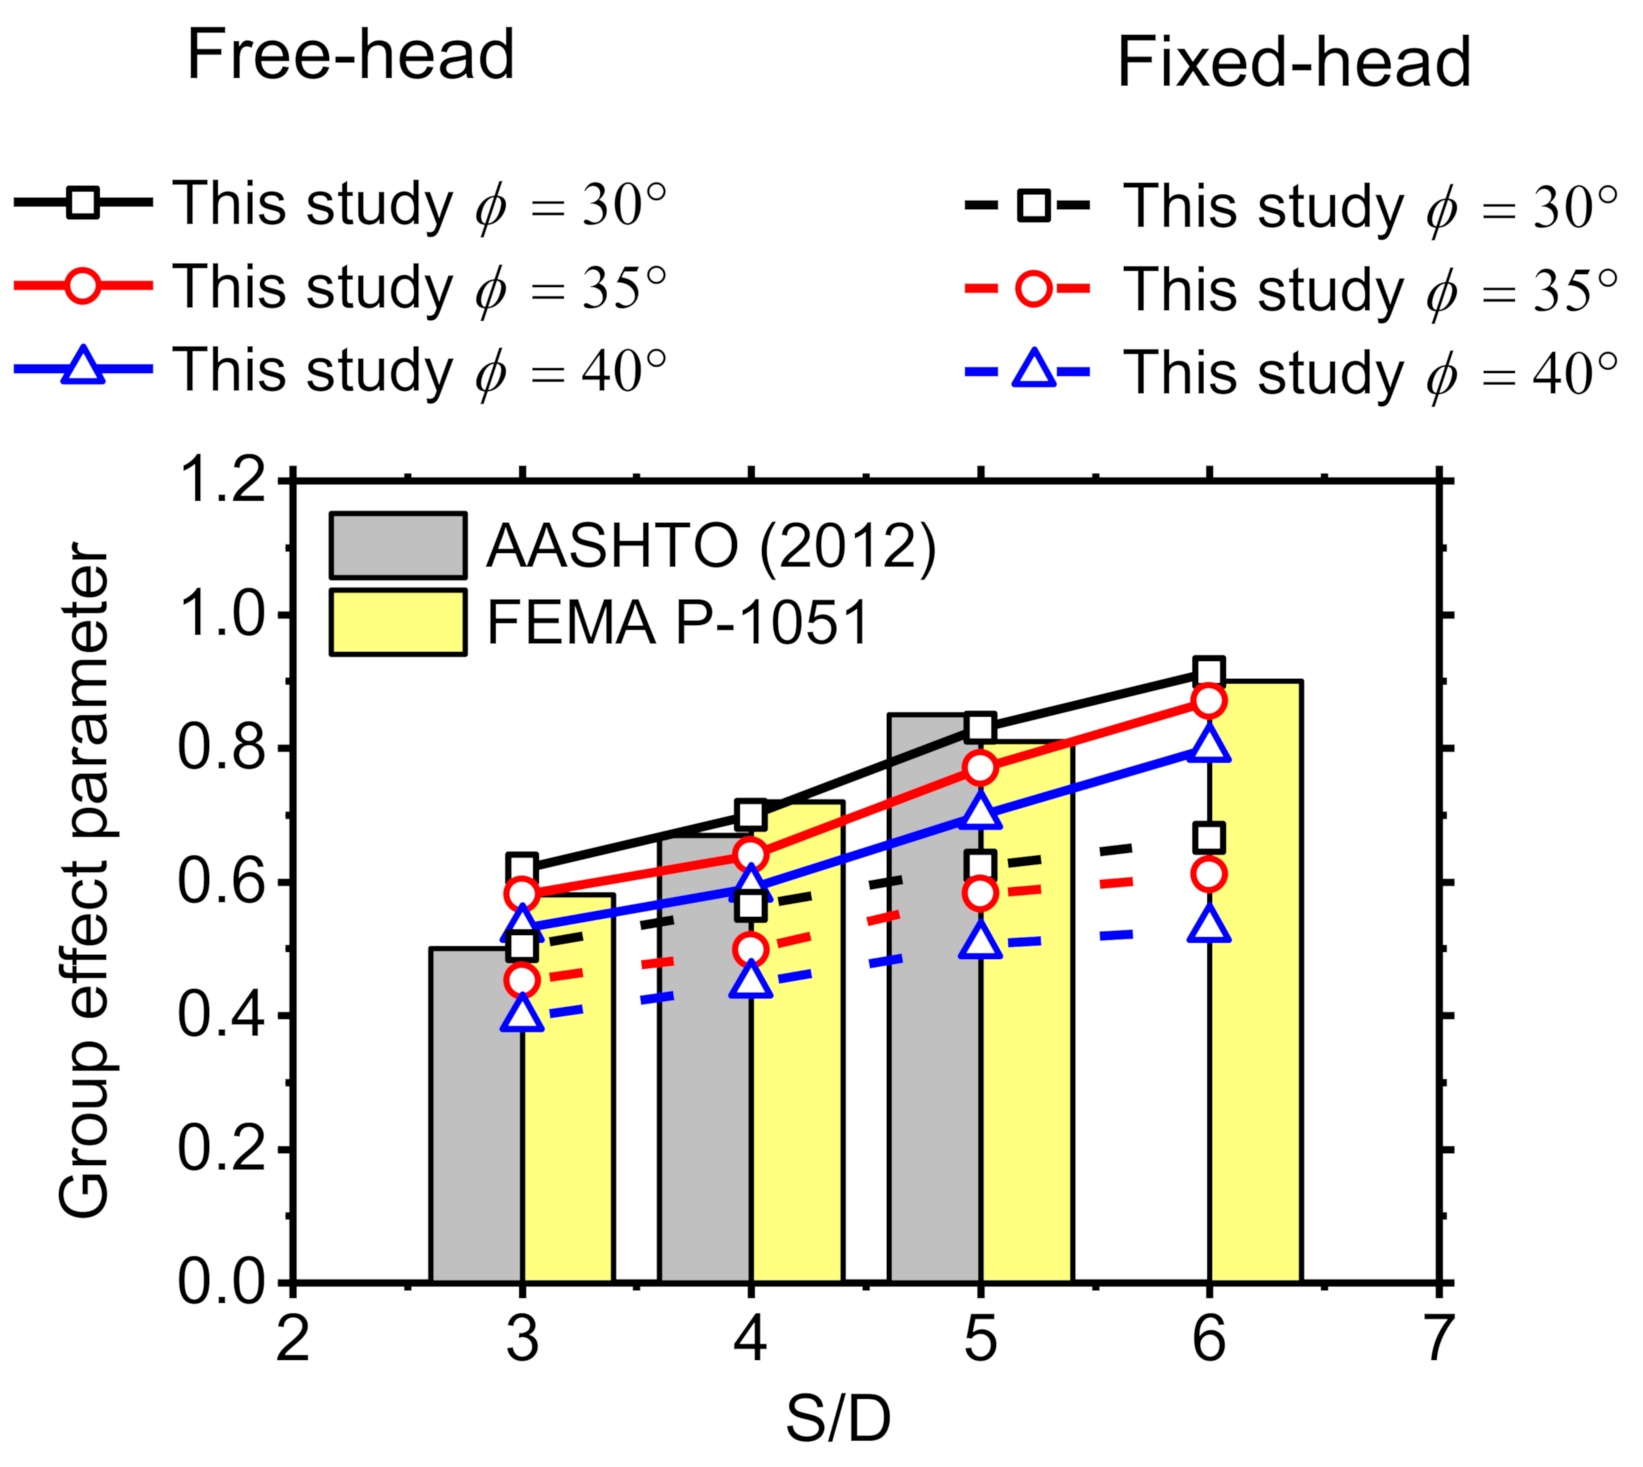
4.3. Comparsion of Group Effect Parameter with Design Codes

In this section, the groups effect parameters averaged from numerically generated p-multipliers are compared and quantified with those provided in the design codes, which are American Association of State Highway and Transportation Officials AASHTO [33] and Federal Emergency Management Agency FEMA [34].
Table 6 lists the recommended p-multipliers provided in AASHTO [33]. This design report presents p-multipliers obtained from free-head pile group tests. It should be noted that the effects of soil shear strength and pile head condition are not accounted for in the AASHTO recommendations [34]. The p-multipliers are provided for S/D = 3 and 5. No recommendation is provided for S/D greater than 5. The effect parameter for AASHTO [33] is calculated by averaging the p-multipliers for all rows of pile group and for S/D = 4; the group effect parameters are interpolated between S/D = 3 and 5. The equations suggested by Rollins et al. [45] for estimation of the p-multipliers were recommended in FEMA [34]. These equations were proposed on the basis of three full-scale tests, where 3 × 3, 3 × 4, and 3 × 5 pile groups with S/D = 5.65, 4.4, and 3.3 were used. Soil type was stiff clay and free-head condition of pile groups were considered in all of the tests performed. The effect of soil type was not accounted for in FEMA [34].
Figure 10 compares group effect parameters calculated numerically with those recommended in AASHTO [33] and FEMA [34] for both free- and fixed-head conditions. For S/D = 3 and 4, the group effect parameters of AASHTO [33] are lower than those of FEMA [34], whereas for S/D = 5 the trend is reversed. The calculated parameters for the free-head pile groups match well with those presented in AASHTO [33] and FEMA [34]. The results for φ = 30° produce the upper limit of the parameters for all S/D compared with those presented in AASHTO [33] and FEMA [34]. For S/D = 3, AASHTO [33] and FEMA [34] parameters are similar to the calculated values for φ = 40° and φ = 35°, respectively. At higher S/Ds, φ = 35° results are similar to the mean values of the parameters presented in AASHTO [33] and FEMA [34]. Both AASHTO [33] and FEMA [34] highly overestimate the parameters for fixed-head condition, and therefore should be used with caution.

5. Conclusions

This study focuses on developing the p-multipliers and group effect parameters for squared vertical pile groups in granular soil using a 3D nonlinear FE model. The p-multipliers are derived directly from numerical simulation by calculating the ratio of averaged soil resistances within a prescribed depth of group and single piles. The effect of S/D, number of group piles, φ, and pile fixity conditions are examined and quantified. Based on the simulation results, an empirical functional form for the p-multipliers is proposed for pile groups.
The proposed p-multipliers generated from the numerical simulations exhibit the following trends. The p-multipliers decrease with an increase in φ and decrease in S/D. The number of piles is shown to have marginal influence on the values of the p-multipliers. The p-multipliers are shown to be highly influenced by the pile fixity conditions. The results demonstrate that the p-multipliers are lower for fixed-head pile groups because of higher group interactions compared with the free-head pile groups. Based on the numerical outputs, an empirical functional form conditioned on S/D, φ, and fixity condition is proposed to estimate the p-multipliers.
The numerically calculated p-multipliers and group effect parameters are compared with the previous experimental studies. The p-multipliers calculated in this study are in line with that measured from field tests. Further comparison of group effect parameters with the group effect parameters presented in AASHTO [33] and FEMA [34] depicts that the calculated values for φ = 30° yield the upper limit values for free-head condition. The parameters of AASHTO [33] and FEMA [34] do not account for the fixity condition, and therefore produce significantly higher parameters for fixed-head condition.

Author Contributions

Conceptualization and methodology, D.P.; formal analysis, resources, and writing—original draft preparation, M.B.A.; numerical simulations, M.B.A., M.A.J. and M.A.; review and editing, D.P. All authors have read and agreed to the published version of the manuscript.

Funding

This research was supported by a grant (20SCIP-B146946-03) from Smart Civil Infrastructure Research Program funded by Ministry of Land, Infrastructure and Transport of Korean government, Korea Institute of Energy Technology Evaluation and Planning (KETEP), and the Ministry of Trade, Industry and Energy (MOTIE) of the Republic of Korea (No. 20183010025580).

Acknowledgments

The authors would like to thank Wenyang Zhang and Ertugrul Taciroglu for providing the user material subroutine (UMAT) of the nonlinear soil model used in the analyses, along with a MATLAB code to calibrate its input parameters.

Conflicts of Interest

The authors declare no conflict of interest.

References

  1. Poulos, H.G.; Davis, E.H. Pile Foundation Analysis and Design; John Wiley and Sons: New York, NY, USA, 1980. [Google Scholar]
  2. Ashour, M.; Norris, G.; Pilling, P. Lateral loading of a pile in layered soil using the strain wedge model. J. Geotech. Geoenviron. 1998, 124, 303–315. [Google Scholar] [CrossRef]
  3. Brown, D.A.; Shie, C.-F. Three dimensional finite element model of laterally loaded piles. Comput. Geotech. 1990, 10, 59–79. [Google Scholar] [CrossRef]
  4. Muqtadir, A.; Desai, C.S. Three-dimensional analysis of a pile-group foundation. IJNAMG 1986, 10, 41–58. [Google Scholar]
  5. Trochanis, A.M.; Bielak, J.; Christiano, P. Three-dimensional nonlinear study of piles. Electron. J. Geotech. Eng. 1991, 117, 429–447. [Google Scholar] [CrossRef]
  6. Yang, Z.; Jeremić, B. Numerical analysis of pile behaviour under lateral loads in layered elastic-plastic soils. IJNAMG 2002, 26, 1385–1406. [Google Scholar] [CrossRef]
  7. Kwon, S.Y.; Yoo, M. Study on the dynamic soil-pile-structure interactive behavior in liquefiable sand by 3D numerical simulation. Appl. Sci. 2020, 10, 2723. [Google Scholar] [CrossRef] [Green Version]
  8. Kwon, S.Y.; Yoo, M. Evaluation of dynamic soil-pile-structure interactive behavior in dry sand by 3D numerical simulation. Appl. Sci. 2019, 9, 2612. [Google Scholar] [CrossRef] [Green Version]
  9. Reese, L.C.; Cox, W.R.; Koop, F.D. Analysis of laterally loaded piles in sand. In Offshore Technology in Civil Engineering: Hall of Fame Papers from the Early Years; ASCE Publications: Reston, VA, USA, 1974; pp. 95–105. [Google Scholar]
  10. American Petroleum Institute (API). Recommended Practice for Planning, Designing, and Constructing Fixed Offshore Platforms. API Recommended Practice 2A-WSD, 21st ed.; American Petroleum Institute: Washington, DC, USA, 2007; Volume 2. [Google Scholar]
  11. Murchison, J.M.; O’Neill, M.W. Evaluation of py relationships in cohesionless soils. In Analysis and Design of Pile Foundations; American Society of Civil Engineers: New York, NY, USA, 1984; pp. 174–191. [Google Scholar]
  12. Zhang, L.; Silva, F.; Grismala, R. Ultimate lateral resistance to piles in cohesionless soils. J. Geotech. Geoenviron. 2005, 131, 78–83. [Google Scholar] [CrossRef]
  13. McGann, C.R.; Arduino, P.; Mackenzie-Helnwein, P. Applicability of conventional py relations to the analysis of piles in laterally spreading soil. J. Geotech. Geoenviron. 2010, 137, 557–567. [Google Scholar] [CrossRef]
  14. Fayyazi, M.S. Numerical Study on the Response of Pile Groups under Lateral Loading. Ph.D. Thesis, University of British Columbia, Vancouver, BC, Canada, 2015. [Google Scholar]
  15. Rahmani, A.; Taiebat, M.; Finn, W.L.; Ventura, C.E. Evaluation of py springs for nonlinear static and seismic soil-pile interaction analysis under lateral loading. Soil Dyn. Earthq. Eng. 2018, 115, 438–447. [Google Scholar] [CrossRef]
  16. Larkela, A. Modeling of a Pile Group under Static Lateral Loading. Master’s Thesis, Helsinki University of Technology, Espoo, Finland, 2008. [Google Scholar]
  17. Brown, D.A.; Morrison, C.; Reese, L.C. Lateral load behavior of pile group in sand. Electron. J. Geotech. Eng. 1988, 114, 1261–1276. [Google Scholar] [CrossRef]
  18. Chandrasekaran, S.; Boominathan, A.; Dodagoudar, G. Group interaction effects on laterally loaded piles in clay. J. Geotech. Geoenviron. 2009, 136, 573–582. [Google Scholar] [CrossRef]
  19. McVay, M.; Casper, R.; Shang, T.-I. Lateral response of three-row groups in loose to dense sands at 3D and 5D pile spacing. Electron. J. Geotech. Eng. 1995, 121, 436–441. [Google Scholar] [CrossRef]
  20. Rollins, K.M.; Peterson, K.T.; Weaver, T.J. Lateral load behavior of full-scale pile group in clay. J. Geotech. Geoenviron. 1998, 124, 468–478. [Google Scholar] [CrossRef]
  21. Rollins, K.; Olsen, R.; Egbert, J.; Olsen, K.; Jensen, D.; Garrett, B. Response, Analysis, and Design of Pile Groups Subjected to Static & Dynamic Lateral Loads; The Utah Department of Transportation Research Division: Salt Lake City, UT, USA, 2003.
  22. Ruesta, P.F.; Townsend, F.C. Evaluation of laterally loaded pile group at Roosevelt Bridge. J. Geotech. Geoenviron. 1997, 123, 1153–1161. [Google Scholar] [CrossRef]
  23. Brown, D.A.; Reese, L.C.; O’Neill, M.W. Cyclic lateral loading of a large-scale pile group. Electron. J. Geotech. Eng. 1987, 113, 1326–1343. [Google Scholar] [CrossRef]
  24. McVay, M.; Zhang, L.; Molnit, T.; Lai, P. Centrifuge testing of large laterally loaded pile groups in sands. J. Geotech. Geoenviron. 1998, 124, 1016–1026. [Google Scholar] [CrossRef]
  25. Rollins, K.M.; Lane, J.D.; Gerber, T.M. Measured and computed lateral response of a pile group in sand. J. Geotech. Geoenviron. 2005, 131, 103–114. [Google Scholar] [CrossRef]
  26. Rollins, K.M.; Olsen, R.J.; Egbert, J.J.; Jensen, D.H.; Olsen, K.G.; Garrett, B.H. Pile spacing effects on lateral pile group behavior: Load tests. J. Geotech. Geoenviron. 2006, 132, 1262–1271. [Google Scholar] [CrossRef]
  27. Walsh, J.M. Full-Scale Lateral Load Test of a 3 × 5 Pile Group in Sand. Master’s Thesis, Brigham Young University, Provo, UT, USA, 2005. [Google Scholar]
  28. Brown, D.A.; O’Neill, M.; Hoit, M.; McVay, M.; El Naggar, M.; Chakraborty, S. Static and Dynamic Lateral Loading of Pile Groups; TRB: Washington, DC, USA, 2001. [Google Scholar]
  29. Souri, A.; Abu-Farsakh, M.Y.; Voyiadjis, G.Z. Evaluating the effect of pile spacing and configuration on the lateral resistance of pile groups. Mar. Georesouces Geotechnol. 2020, 1–13. [Google Scholar] [CrossRef]
  30. Abu-Farsakh, M.; Souri, A.; Voyiadjis, G.; Rosti, F. Comparison of static lateral behavior of three pile group configurations using three-dimensional finite element modeling. Can. Geotech. J. 2018, 55, 107–118. [Google Scholar] [CrossRef]
  31. Yang, Z.; Jeremić, B. Numerical study of group effects for pile groups in sands. IJNAMG 2003, 27, 1255–1276. [Google Scholar] [CrossRef]
  32. Albusoda, B.S.; Al-Saadi, A.F.; Jasim, A.F. An experimental study and numerical modeling of laterally loaded regular and finned pile foundations in sandy soils. Comput. Geotech. 2018, 102, 102–110. [Google Scholar] [CrossRef]
  33. AASHTO. AASHTO LRFD Bridge Design Specifications; American Association of State Highway and Transportation Officials (AASHTO): Washington, DC, USA, 2012. [Google Scholar]
  34. Federal Emergency Management Agency (FEMA). Foundation and liquefaction design, FEMA P-1051. In NEHRP Recommended Seismic Provisions: Design Examples; National Institute of Building Sciences: Washington, DC, USA; Building Seismic Safety Council: Washington, DC, USA, 2015. [Google Scholar]
  35. Morrison, C.S.; Reese, L.C. A Lateral-Load Test of a Full-Scale Pile Group in Sand; The University of Texas at Austin: Austin, TX, USA, 1988. [Google Scholar]
  36. Christensen, D.S. Full Scale Static Lateral Load Test of a 9 Pile Group in Sand. Master’s Thesis, Brigham Young University, Provo, UT, USA, 2006. [Google Scholar]
  37. Taghavi, A.; Muraleetharan, K.K. Analysis of laterally loaded pile groups in improved soft clay. Int. J. Geomech 2016, 17, 04016098. [Google Scholar] [CrossRef]
  38. Park, J.-S.; Park, D.; Yoo, J.-K. Vertical bearing capacity of bucket foundations in sand. Ocean Eng. 2016, 121, 453–461. [Google Scholar] [CrossRef]
  39. Borja, R.I.; Amies, A.P. Multiaxial cyclic plasticity model for clays. Electron. J. Geotech. Eng. 1994, 120, 1051–1070. [Google Scholar] [CrossRef]
  40. Zhang, W.; Esmaeilzadeh Seylabi, E.; Taciroglu, E. Validation of a three-dimensional constitutive model for nonlinear site response and soil-structure interaction analyses using centrifuge test data. IJNAMG 2017, 41, 1828–1847. [Google Scholar] [CrossRef]
  41. Adeel, M.B.; Aaqib, M.; Park, D. Simulation of pile foundations in granular soil subjected to lateral loading using beam-on-nonlinear-winkler-foundation and nonlinear finite element models. Ocean Eng. in press.
  42. Hatanaka, M.; Uchida, A. Empirical correlation between penetration resistance and internal friction angle of sandy soils. Soils Found. 1996, 36, 1–9. [Google Scholar] [CrossRef] [Green Version]
  43. Liao, S.S.; Whitman, R.V. Overburden correction factors for SPT in sand. Electron. J. Geotech. Eng. 1986, 112, 373–377. [Google Scholar] [CrossRef]
  44. Kwak, D.Y.; Brandenberg, S.J.; Mikami, A.; Stewart, J.P. Prediction equations for estimating shear-wave velocity from combined geotechnical and geomorphic indexes based on Japanese data set. Seismol. Soc. 2015, 105, 1919–1930. [Google Scholar] [CrossRef]
  45. Rollins, K.M.; Olsen, K.G.; Jensen, D.H.; Garrett, B.H.; Olsen, R.J.; Egbert, J.J. Pile spacing effects on lateral pile group behavior: Analysis. J. Geotech. Geoenviron. 2006, 132, 1272–1283. [Google Scholar] [CrossRef]
Figure 1. Finite element (FE) model for the 5 × 5 pile group: (a) free-head and (b) fixed-head condition.
Applsci 11 00026 g001
Figure 2. Average soil resistance for a single pile and leading row in a 3 × 3 free-head pile group at y = 50 mm.
Applsci 11 00026 g002
Figure 3. Vs vs. depth profiles used in the FE model.
Applsci 11 00026 g003
Figure 4. Numerically calculated p-multipliers for 5 × 5 (a) free-head and (b) fixed-head pile groups.
Applsci 11 00026 g004
Figure 5. Regression between calculated p-multipliers vs. S/D for various rows for free-head condition: (a) φ = 30°, (b) φ = 35°, and (c) φ = 40°.
Applsci 11 00026 g005
Figure 6. Regression between calculated p-multipliers vs. S/D for various rows for fixed-head condition: (a) φ = 30°, (b) φ = 35°, and (c) φ = 40°.
Applsci 11 00026 g006
Figure 7. Comparison between calculated p-multipliers and previous experimental work for free-head pile groups in sand with 3 × 3 pile configuration: (a) S/D = 3, 3.3 and (b) S/D = 5, 5.65.
Applsci 11 00026 g007
Figure 8. Comparison of p-multipliers for the free-head pile groups in sands calculated in this study with those measured from field tests with 4 × 4 pile configuration performed by Ruesta and Townsend [22].
Applsci 11 00026 g008
Figure 9. Comparison of fixed-head pile groups in sands calculated in this study and measured from centrifuge tests with (a) 3 × 3, (b) 3 × 4, and (c) 3 × 5 pile configurations performed by McVay et al. [24].
Applsci 11 00026 g009
Figure 10. Comparison among calculated group effect parameters for 3 × 3 free-head and fixed-head pile groups in this study, AASHTO [33], and FEMA [34].
Applsci 11 00026 g010
Table 1. Previous experimental studies conducted on free-head pile groups (modified after Fayyazi [14]).
ReferenceSoil Typeφ (°)Test TypePile LayoutPile TypeD (cm)S/DProposed p-Multipliers for RowsGroup Effect Parameter
1st 2nd 3rd 4th5th 6th 7th
Brown et al. [17]Sand38.5Full-Scale3 × 3Steel Pipe27.330.80.40.3----0.5
Morrison and Reese [35]Sand38.5Full-Scale3 × 3Steel Pipe27.330.80.40.3----0.5
McVay et al. [19]Sand30Centrifuge3 × 3Steel Pipe43510.850.7----0.85
Sand33Centrifuge3 × 3Steel Pipe43510.850.7----0.85
Sand30Centrifuge3 × 3Steel Pipe4330.650.450.35----0.48
Sand33Centrifuge3 × 3Steel Pipe4330.80.40.3----0.5
Ruesta and Townsend [22]Sand32Full-Scale4 × 4Square Concrete7630.80.70.30.3---0.52
Walsh [27]Sand40Full-Scale3 × 5Steel pipe32.43.9210.50.350.30.4--0.51
Rollins et al. [25]Sand38Full-Scale3 × 3Steel pipe32.43.30.80.40.4----0.53
Christensen [36]Sand38Full-Scale3 × 3Steel pipe32.45.6510.70.65----0.78
Table 2. Previous experimental studies conducted on fixed-head pile groups (modified after Fayyazi [14]).
ReferenceSoil Typeφ (°)Test TypePile LayoutPile TypeD (cm)S/DProposed p-Multipliers for RowsGroup Effect Parameter
1st Leading 2nd Trailing3rd Trailing4th Trailing 5th Trailing6th Trailing7th Trailing
McVay et al. [24]Sand33Centrifuge3 × 3Square Steel42.930.80.40.3----0.5
Sand33Centrifuge3 × 4Square Steel42.930.80.40.30.3 0.45
Sand33Centrifuge3 × 5Square Steel42.930.80.40.30.20.3- 0.4
Sand33Centrifuge3 × 6Square Steel42.930.80.40.30.20.20.3 0.37
Sand33Centrifuge3 × 7Square Steel42.930.80.40.30.20.20.20.30.34
Table 3. Numerically derived p-multipliers in previous studies.
ReferenceSoil TypePile Head ConditionS/DPile Configurationp-Multipliers for RowsGroup Effect Parameter
1st2nd3rd4th5th6th7th
Albusoda et al. [32]SandFixed32 × 20.810.5-----0.655
62 × 20.830.69-- ---0.76
35 piles0.710.60.51----0.655
65 piles0.90.730.75----0.815
Abu-Farsakh et al. [30]ClayFixed4.43 × 40.560.390.410.53---0.47
Taghavi and Muraleetharan [37]Stiff ClayFixed32 × 20.890.6-----0.745
72 × 211-----1
Soft clayFixed32 × 20.840.43-----0.635
72 × 211-----1
Fayyazi [14]Sand φ = 30°Free33 × 3-0.54
4 × 4-0.43
5 × 5-0.39
6 × 6-0.35
43 × 3-0.66
4 × 4-0.56
5 × 5-0.53
6 × 6-0.49
53 × 3-0.8
4 × 4-0.7
5 × 5-0.67
6 × 6-0.62
63 × 3-0.89
4 × 4-0.83
5 × 5-0.79
6 × 6-0.77
Fixed33 × 3-0.47
4 × 4-0.39
5 × 5-0.31
6 × 6-0.29
43 × 3-0.52
4 × 4-0.44
5 × 5-0.41
6 × 6-0.36
53 × 3-0.59
4 × 4-0.53
5 × 5-0.49
6 × 6-0.46
63 × 3-0.67
4 × 4-0.63
5 × 5-0.58
6 × 6-0.57
Table 4. Properties of steel pile.
ParametersValue
Outer diameter (m)0.3
Thickness (m)0.0095
Moment of inertia (m4)0.000398
Modulus of elasticity of reference steel pipe pile, E (GPa)200
Adjusted modulus of elasticity, E (GPa)46
Table 5. Regression coefficients for free- and fixed-head pile group.
RowsFree-Head Condition
φ = 30°φ = 35°φ = 40°
ababab
Leading row0.550.340.570.270.580.23
1st Trailing row0.220.800.170.890.140.99
2nd Trailing row0.250.620.190.770.160.80
RowsFixed-Head Condition
φ = 30°φ = 35°φ = 40°
ababab
Leading row0.540.310.470.360.430.34
1st Trailing row0.230.540.180.620.160.60
2nd Trailing row0.200.440.160.510.160.43
Table 6. The p-multipliers suggested in AASHTO [33].
Pile Spacingp-Multiplier
Leading Row1st Trailing Row2nd Trailing Row and HigherGroup Effect Parameter
3D0.80.40.30.5
5D10.850.70.85
Publisher’s Note: MDPI stays neutral with regard to jurisdictional claims in published maps and institutional affiliations.

