Article

In-Plane Heatwave Thermography as Digital Inspection Technique for Fasteners in Aircraft Fuselage Panels

1
Brussels Airlines M&E, Brussels Airport, Technical Complex South, Building 32, 1930 Zaventem, Belgium
2
KU Leuven, Department of Materials Engineering, Kasteelpark Arenberg 44, 3001 Leuven, Belgium
3
Fraunhofer IKTS, Maria-Reiche-Straße 2, 01109 Dresden, Germany
*
Author to whom correspondence should be addressed.
Appl. Sci. 2021, 11(1), 132; https://doi.org/10.3390/app11010132
Submission received: 19 November 2020 / Revised: 17 December 2020 / Accepted: 19 December 2020 / Published: 25 December 2020

Abstract

:

Featured Application

This work presents In-plane Heatwave Thermography as a new in-service qualification method of fasteners in aircraft fuselage panels. By performing feasibility tests on a serviceable part of an aircraft, the results of this work aim towards the application in an industrial environment like the aircraft hangar. A benchmark and comparison with Ultrasound Lock-in Thermography and Scanning Laser Doppler Vibrometry ranks this technology with respect to industrial applications.

Abstract

The inspection of fasteners in aluminium joints in the aviation industry is a time consuming and costly but mandatory task. Until today, the manual procedure with the bare eye does not allow the temporal tracking of a damaging behavior or the objective comparison between different inspections. A digital inspection method addresses both aspects while resulting in a significant inspection time reduction. The purpose of this work is to develop a digital and automated inspection method based on In-plane Heatwave Thermography and the analysis of the disturbances due to thermal irregularities in the plate-like structure. For this, a comparison study with Ultrasound Lock-in Thermography and Scanning Laser Doppler Vibrometry as well as a benchmarking of all three methods on one serviceable aircraft fuselage panel is performed. The presented data confirm the feasibility to detect and to qualify countersunk rivets and screws in aluminium aircraft fuselage panels with the discussed methods. The results suggest a fully automated inspection procedure which combines the different approaches and a study with more samples to establish thresholds indicating intact and damaged fasteners.

1. Introduction

For decades, the development and application of non-destructive testing (NDT) ensure the safety and reliability in many fields such as civil engineering, transportation and the energy sector. The increasing technical know-how, the growth of personnel costs and the advancement of hard- and software tools are the main drivers for this phenomena.
On the one hand, modern materials and structural concepts come with new and tailored monitoring systems that are potentially embedded in the structure during the manufacturing process. On the other hand, classic fatigue phenomena of “old-school” materials like concrete, steel and aluminium alloys undergo advanced monitoring and testing methods. Many of these are empowered by the developments of new sensors and the (on-line) data processing. This work is positioned within the latter field and applies new as well as common technologies to a fuselage panel of a commercial aircraft.
Since the beginning of civil aviation, aluminium alloy sheets have been important building blocks of the fuselage, and hence, its assembling, usage and fatigue behavior is well understood. In aircraft fuselage panels, riveted lap joints build the connection between neighboring aluminium alloy sheets established by different kinds of rivets. As in most structural components, joints within the fuselage are critical areas. Hence, avoiding rivet failure plays an important role in the save and reliable operation. As all critical parts, also riveted joints are regularly checked to ensure the safe operation of the aircraft.
Nowadays, the inspection procedure to detect loose and sheared rivets in critical areas requires a lot of manpower of certified and specially trained personnel. The manual visual inspection is performed with the naked eye and comes with some inevitable drawbacks. One major aspect is that the inspection and its outcome is subjective and depends on the individual inspector. For this purpose, the comparison between inspections of the same area at different times and objective documentation of the temporal development of each rivet is impossible. Also, the inspection procedure requires a high concentration level of the inspector, therefore regular breaks are required and mandatory to minimize the likelihood of human errors.
Due to the aforementioned technical developments, the authors believe that automated rivet inspection is possible with state-of-the-art NDT techniques enhancing safety as well as the economic efficiency of civil aviation.
This work puts forward a proof of concept to detect and localize loose and damaged rivets in a “real aircraft fuselage panel” with advanced NDT methods. Such a study is necessary since many investigations are performed on test samples with parameters not always representative for real aircraft fuselage. This work presents a novel thermal inspection procedure which measures the surface temperature of the specimen while an in-plane heatwave is propagating through the plate–like structure. The disturbances of this in-plane heatwave by irregularities in heat conductivity reveals subsurface flaws and damages. This inspection method will be tested on a commercial aircraft fuselage panel with loose, damaged and intact fasteners. Besides this new technology, measurements with a Scanning Laser Doppler Vibrometer (SLDV) which are realized with a commercial off–the–shelf device and Ultrasound Lock–In Thermography (ULT) which combines a vibrational excitation of the specimen with a thermal detection of flaws will be investigated. By testing all methods on one sample, a comparison provides benefits and drawbacks for each technology.

2. Literature Review

The importance of riveted lap joints in aircraft fuselage panels is reflected in a wide range of scientific and industrial literature dealing with the manufacturing, installation, corrosion and fatigue behavior. Reference [1] provides a good overview of the topic and discusses the dependence of the fatigue behavior of riveted lap joints upon the processing parameters. Some literature explicitly discusses the fatigue performance of riveted lap joints based on numerical simulations [2,3,4,5] as well as experimental studies [6,7,8]. However, the well-defined conditions of the scientific studies are rarely fulfilled in the daily aircraft assembling processes [1].
Although the in-service quality assessment of aluminium riveted lap joints is of high interest, it is rarely discussed in scientific publications. Many authors providing overviews of aerospace specific large-scale NDT methods support the common opinion that maintenance of lightweight structures made from composite materials is the new challenge for NDT [9,10]. This goes in line with many review articles in this field [10,11,12,13,14]. Even if the share of composite parts in new aircraft is constantly raising, riveted metal-metal and metal-composite joints will remain the most critical structural parts. Taking the labor-intensive work of manual rivet inspections into consideration, it is surprising that only a few publications discuss the automated in-service rivet inspection as a possible application of common NDT methods.
Reference [15] discuss Ultrasound Lock-in Thermography as a suitable method for loose rivet detection and conclude that the comparison of aluminium-aluminium and CFRP-aluminium riveted joints shows that only damaged rivets in the latter configuration are detected with ULT. In their work, the authors use unpainted specimens which have significantly different physical parameters compared to a real aircraft fuselage part. Others detect loose contact between riveted lap joints as a consequence of faulty fasteners [16,17]. However, such a method does not provide enough information for a technician to decide which rivets need to be replaced and which not. Given the recent technological advancements since the aforementioned works [18], it is evident that the investigations on thermal detection of loose rivets with modern technology in software and hardware need to be reopened.
ULT belongs to the thermographic methods that measure the heat generated in the defect. Other active thermographic methods like pulse thermography introduce heat at the surface and record the thermal response at the same or the opposite surface. This reveals defects that influence the heat diffusion and therefore cause changes in the measured surface temperature. Although this concept is successfully used for various applications [19], the authors are not aware of any application of this method to detect defected rivet.
Another well-established technology to detect surface and near-surface cracks in metallic aeronautical parts is the Eddy current technique [20,21]. Even though the Eddy current inspection is commonly used for rivet hole inspection [22,23,24] and specifically applied to riveted lap joints [25,26], no work regarding the detection of loose rivets is published.
The inspection of riveted lap joints with magneto-optic imaging is described in some work [27,28] and can be used for the automated detection of rivets [29]. However, only rivet holes with and without surface cracks are distinguished and the authors do not discuss the possibility of characterizing single rivets and their respective state.
Another tool which is widely used in the automotive, aerospace and many other industries are measurements with Scanning Laser Doppler Vibrometer (SLDV) [30]. Even if the measurement principle allows only point-wise measurements of the surface vibrations, a sufficient scanning area and a point density plot enables a quasi-full-field measurement which gives a detailed insight into the vibration behavior of various specimens. A vibration analysis to detect cracks and defects in plate-like structures is used since decades and is described in several articles, for example, Reference [31].

3. Methods

In-plane Heatwave Thermography (IPHWT) is presented in this paper for the detection and quantification of loose and damaged fasteners in lap joints and benchmarked concerning two established methods, ULT and SLDV measurements. While SLDV measurements and ULT are very established techniques which are well described in the literature [30,32,33,34], IPHWT is a less common technique and described in more detail.

3.1. In-Plane Heatwave Thermography

As mentioned, active thermography based on a time-varying amount of heat flux at the specimen surface is not known as a successful method for defect rivet detection. Most of the applications of this method are on structures with homogeneous surfaces containing internal heterogeneities parallel to the surface. In this work, however, the thermal diffusion perpendicular to the specimen surface is of major interest. In general, thermal diffusion happens in all spatial directions and cannot be “steered”. However, heat diffusion in plate-like structures experiences boundary conditions similar to “guided sonic waves” which are regularly used in ultrasonic inspections. Far from the heat source, the heat diffusion is mainly parallel to the plate surface. Hence, measuring the surface temperature reveals information of cracks, inhomogeneities or thermal obstacles perpendicular to the surface since they disturb the heat diffusion in the plate. This principle is successfully applied by for example, Reference [35] which detected thin (1 μ m to 25 μ m ) infinite as well as finite cracks in stainless steel plates [35,36]. To detect such small cracks, the aforementioned studies applied a contactless and periodic Laser-excitation of the specimen in combination with lock-in post-processing.
This work proposes a similar method called In-plane Heatwave Thermography (IPHWT) which is based on the temperature change at the surface generated by a local heat pulse. A challenging point is the signal evaluation because the relevant small signal change must be identified within a large general temperature increase. This is due to a different thermal excitation and requires a significantly enhanced post-processing for the feature extraction. The thermal excitation documented in this paper is realized with a simple pulse excitation by a Peltier element attached to the surface of the fuselage panel. Although a contactless heat excitation as performed by Reference [35] has some advantages, it is not an option in the framework of this work. The authors want to highlight the common practice of the term “thermal wave” in thermal NDT.
The authors want to comment shortly on the term “wave” in the expression “In-plane Heatwave Thermography”. The space-time behavior of the temperature is described by a diffusion equation and not a wave equation. Especially for pulse excitation, there is no periodicity of the temperature in time and/or space. Nevertheless, the term “heat wave” is widely accepted in the NDT community for periodic [37] as well as pulse excitation [19]. This is partly justified, because for periodic excitation the solution has the form of a strongly damped and dispersive wave [37] and because the pulse excitation solution can be Fourier decomposed in a series of periodic excitations.
For the feature extraction of the recorded thermal heatwave propagation, two methods are proposed. One is based on a local and the other one on a global pixel comparison. The first method is sensitive to a local spatial gradient of the temporal surface temperature while the latter method is sensitive to variations of pixel behavior compared to a wider range of pixels in the video. Below, both methods will be described separately.

3.1.1. Local Gradient Method

The authors suggest extracting features like cracks or loose rivets from the recorded videos by analyzing the local gradient of the in-plane heat diffusion. The so-called local gradient method processes each image of the thermal video separately and extracts features from each frame independently. As a first step, a horizontal and vertical mean filter with a window size of three pixels is applied to every image I ( x , y ) , t at the time t containing the pixel values i x , y .
s ( x , y ) = i x 1 , y + i x , y + i x + 1 , y + i x , y 1 + i x , y + 1 5 .
From the filtered frame s ( x , y ) , the spatial gradient in x- and y-direction are computed using second order central differences approximation. Summing their absolute values results in a new frame g x , y and video G ( x , y ) , t , in which every pixel represents the local gradient at a specific time t in the original data.
g ( x , y ) = 1 2 × | s x 1 , y s x + 1 , y | + | s x , y 1 s x , y + 1 | .
The different steps of this calculation are shown in Figure 1 where one frame of a thermal video shows the rivet that has a lower temperature than the surrounding plate due to the thermal barrier caused by the gap between rivet and plate.
By performing the calculations above for every frame in the original video, a new video G ( x , y ) , t is obtained with the local gradient results. To reduce the dimension of the data, one single image should be calculated from the video and is to be used for an assessment of loose rivets. For this, different methods like temporal averaging, variance or peak-finding can be used to transform each pixels temporal signal g ( x , y ) , t to a single value g ^ ( x , y ) . A comparison showed that the variance of the temporal pixel gradient results in easy to interpret and meaningful images.

3.1.2. Covariance of Temporal Pixel Behavior

The second proposed method which is applied to the IPHWT video is based on the covariance matrix of the temporal behavior of each pixel and the average signal of the pixels with similar expected behavior. In the following, the calculation that results in a single image will be explained.
As a first step, the heat source is localized by identifying the pixels with the total largest heating rate ( d T / d t ) ( x , y ) . This identifies the area associated with the heat source. With this information, the shortest distance d ( x , y ) between each pixel and the area of heat source is calculated in pixel values. With the assumption of a homogeneous plate and a point-like heat source, it can be assumed that all pixels with the same distance to the heat source show similar shapes in the temperature profile. However, if a crack, flaw or any other obstacle influences the in-plane heat flow, the temperature profile will differ from the other pixels with the same shortest distance d ( x , y ) . To minimize the influence of different surface emissivity, all temperature profiles are normalized so that the absolute value of the surface temperature becomes irrelevant but only the shape of the profile plays a role.
To calculate the similarity of each pixel profile with the averaged profile in its group of pixels with similar d ( x , y ) , the normalized covariance matrix or correlation coefficient matrix R ( x , y ) of the pixel profile and the averaged profile is calculated. The off-diagonal scalar elements r ( x , y ) 1 of R ( x , y ) indicate the similarity of the pixel profile and the averaged signals the respective group. Here, values near 1 represent a high similarity whereby a low similarity is indicated by r ( x , y ) 1 .

3.2. Scanning Laser Doppler Vibrometry

The principle of SLDV measurements is based on the Doppler effect, which causes a phase shift between a reflected laser beam and a reference beam when the reflecting surface is vibrating as described in some of the aforementioned literature [30].
For the measurement in the presented work, a piezoelectric transducer, also called a piezoelectric waver, is glued on the fuselage panel and driven by an amplifier. In general, any signal (most common—chirp sine wave, rectangular pulse) generated by a function generator can serve as the input signal for the piezoelectric transducer. Based on the frequency chosen, the vibration induced by the piezoelectric patch propagates as a guided elastic wave through the specimen and the SLDV measures the out-of-plane vibration at each point of a predefined grid. Here, the point density determines the spatial resolution and, together with the covered area, the measurement time.
For the post-processing, the out of plane vibration of each grid point can be post-processed in different ways. In this work, the root mean square (RMS) of the band-passed filtered fast Fourier transform (FFT) of the time signal in each point is used. With this, the time information in each point is presented in one single image, which is important for later applications. In addition to the RMS, the coherence (COH) of the input signal and the vibration in each point is shown in the results and indicates loose rivets.

3.3. Ultrasound Lock-in Thermography

Lock-in measurements take advantage of a periodic excitation and advanced post-processing. Reference [33] also explain the concept of Ultrasound Thermography where heat production is a result of clapping and rubbing of exited defects. Both concepts are described in many articles and reviews. The major challenge in the presented experiments is the high thermal conductivity of aluminium. The increase of temperature with a given energy deposition decreases with increasing thermal conductivity (k) and heat capacity ( c p ) [38]. Hence, the application of ULT to materials with low k and c p is, in general, more robust than with materials of high k and c p .

4. Experimental Setup
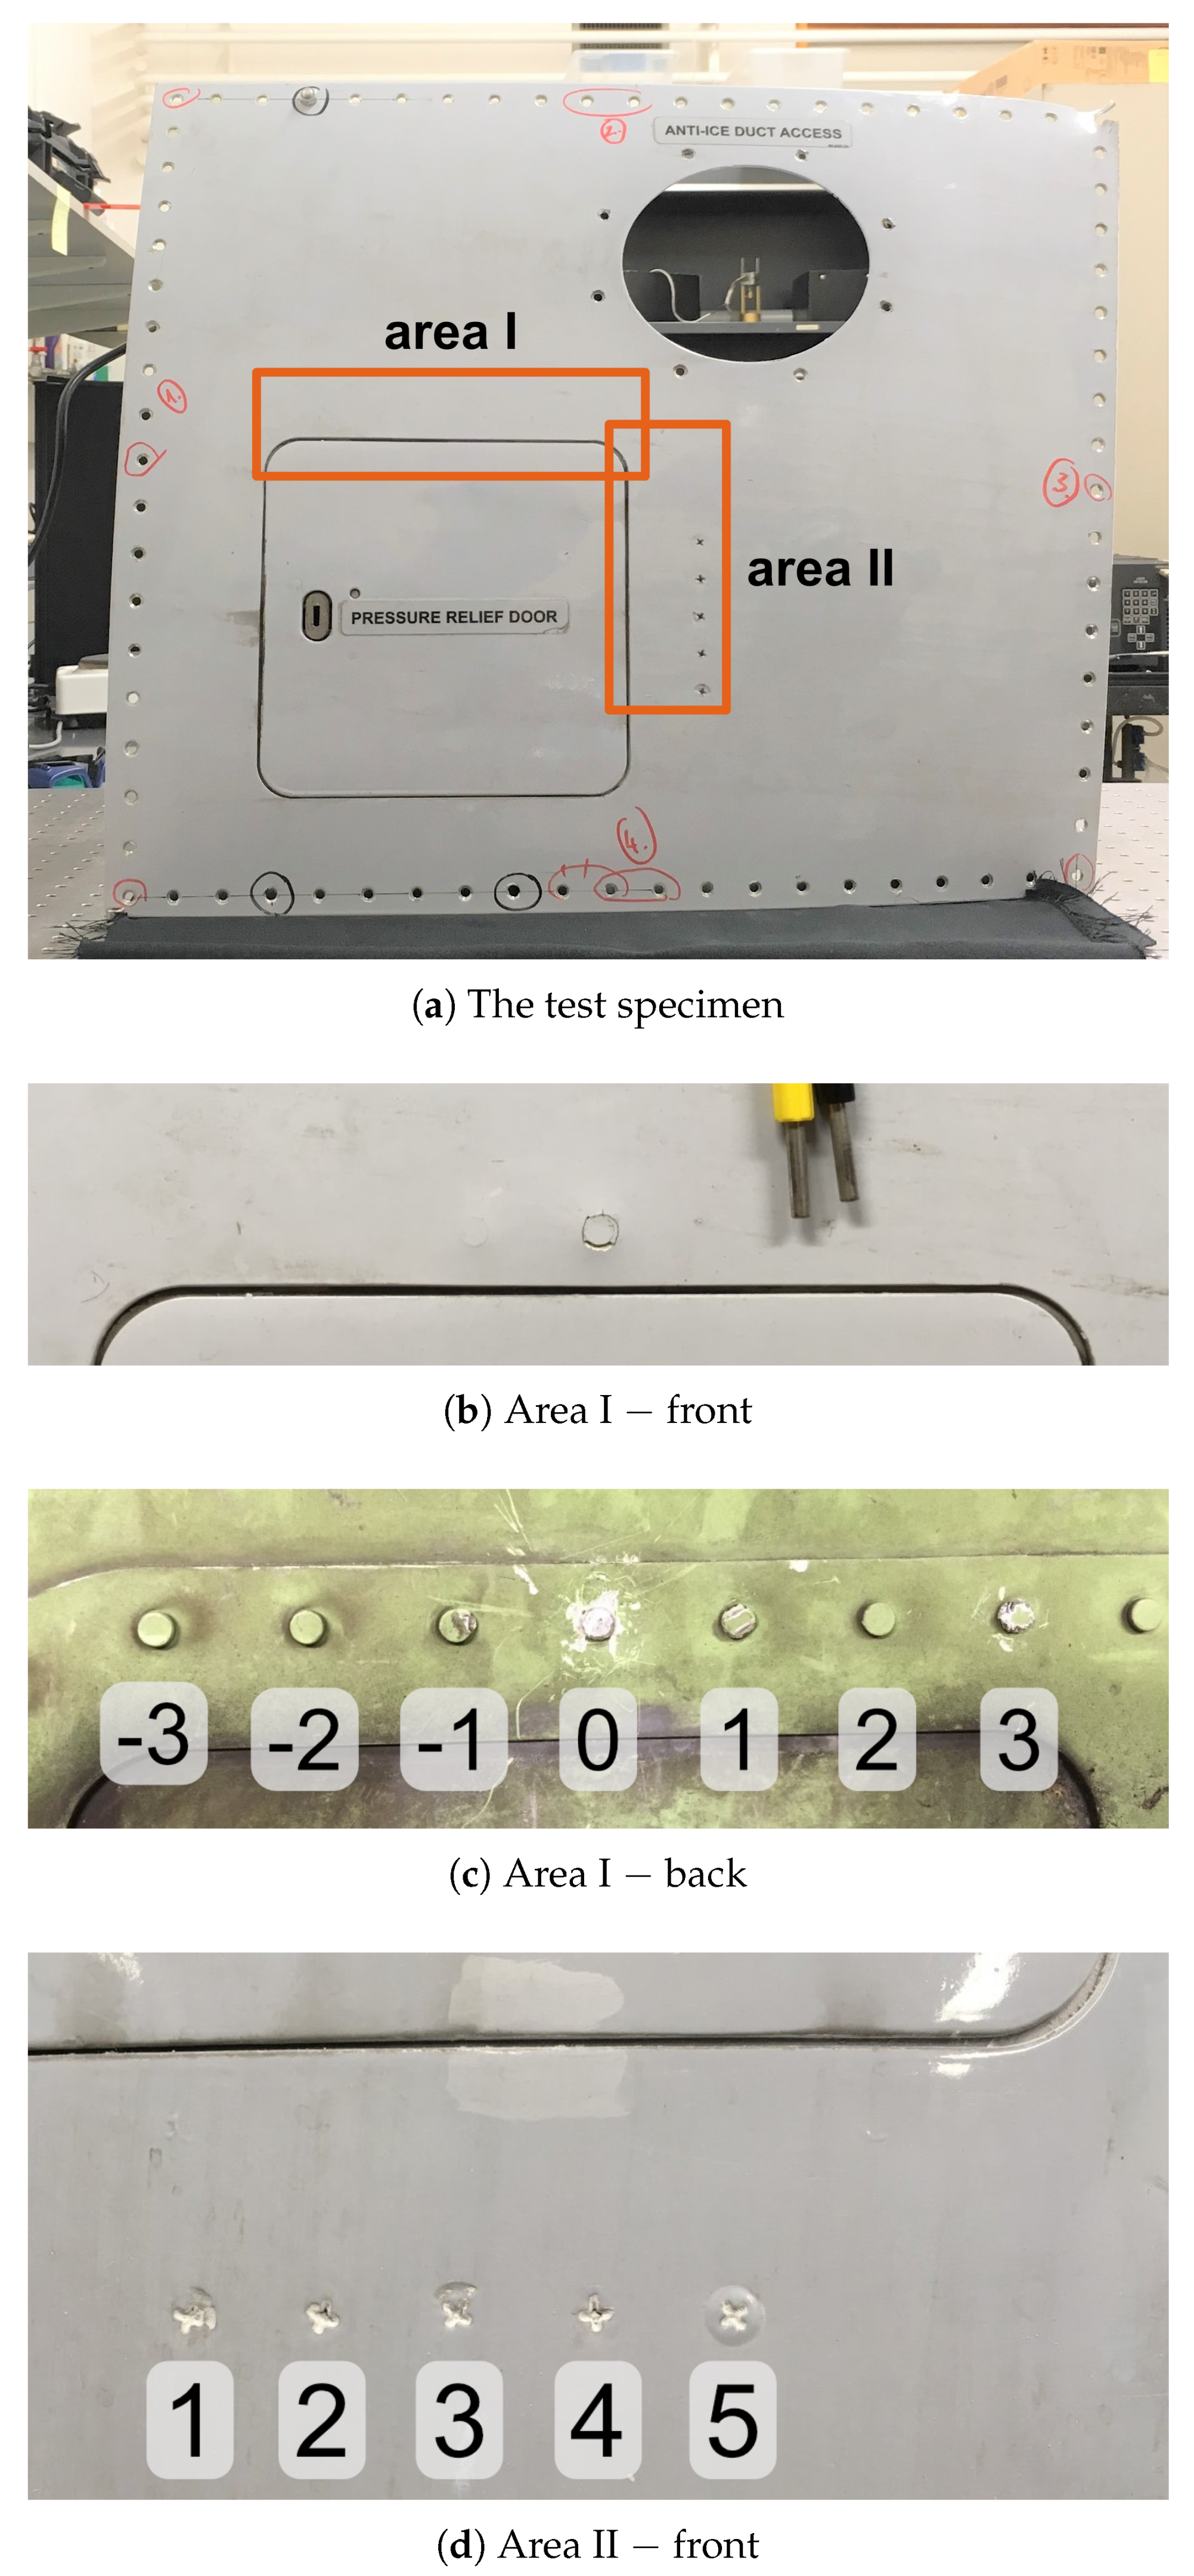
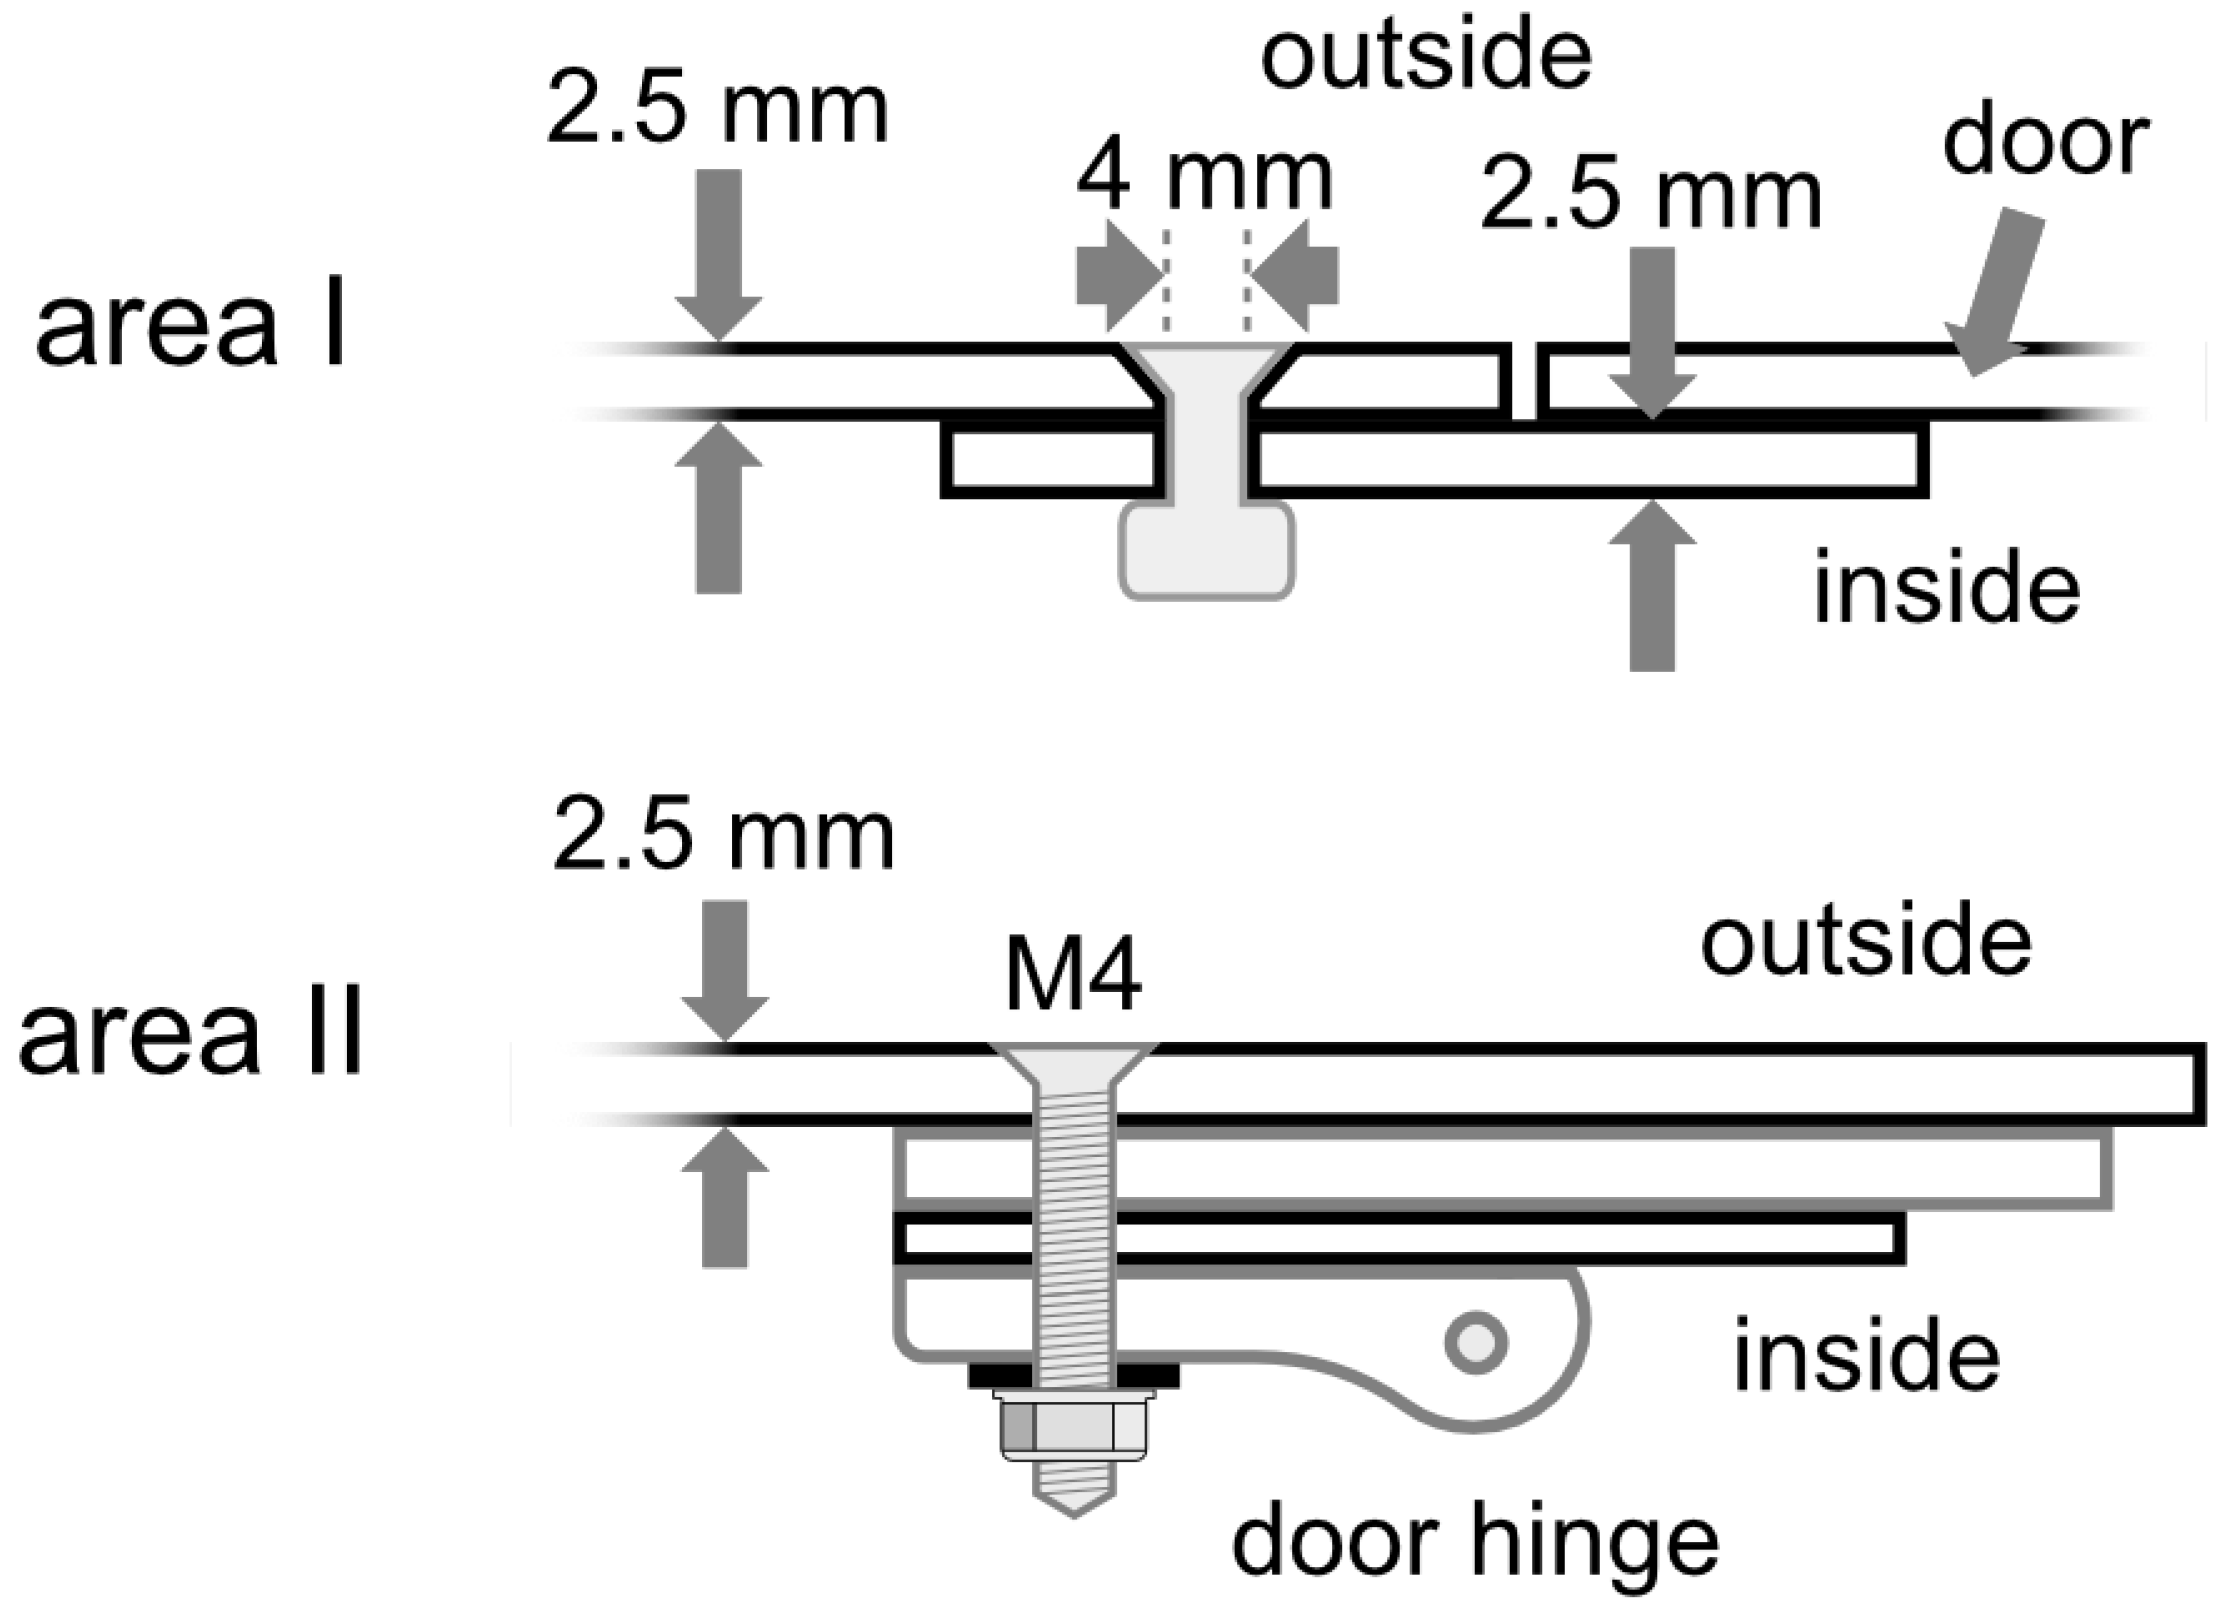
In the following subsections, the riveted plate on which all measurements have been performed and the experimental setups for each of the three methods (IPHWT, ULT and SLDV) which are shown in Figure 2 will be described.

4.1. Riveted Plate

The riveted plate used in this study is a painted panel from an Airbus A230 aircraft fuselage with a little door for accessing a pressure release valve and was used during regular checks of the aircraft. A full view of the test specimen is shown in Figure 3a. At the inner side, visible in Figure 3c, the door cut–out is surrounded by a supporting frame which provides additional stiffness to the panel. The specimen is made from aluminium alloy AL2024-T3 and is painted with a primer after assembling. The outer surface of the panel is painted with a conventional coating used for civil aircraft.
Two spots of the joint supporting frame and panel are intentionally damaged to test the proposed inspection methods. Figure 3b,c show a close-up of area I from the outer and inner side respectively. The middle rivet (“rivet 0”) in area I is hammered from the backside and turned with pliers until the gap between the rivet and the panel is sufficient to move it with the fingers. The neighboring rivets, rivet “−1 and “1”, are not intentionally damaged but have experienced some stress due to the modification of the surrounding region. Additionally, rivet “3” is turned with pliers to loosen the rivet slightly. Figure 3d shows area II with five screws. The nut of the screw “5” is loosened and the screw is slightly hammered (one soft hit) from the back. As visible in Figure 3d, this results in a small gap between the screw and the panel which is visible due to the lifting of the screw. However, the screw is still tight and it is impossible to move or shake it.
Figure 4 shows a sketch of the cross-section of area I and II. Both, the outer skin and the supporting frame have a thickness of d = 2.5   m m . The supporting frame and the panel are riveted with countersunk aluminium rivets and the hinges are joined with countersunk screws and a screw nut from the inside as depicted in Figure 4.

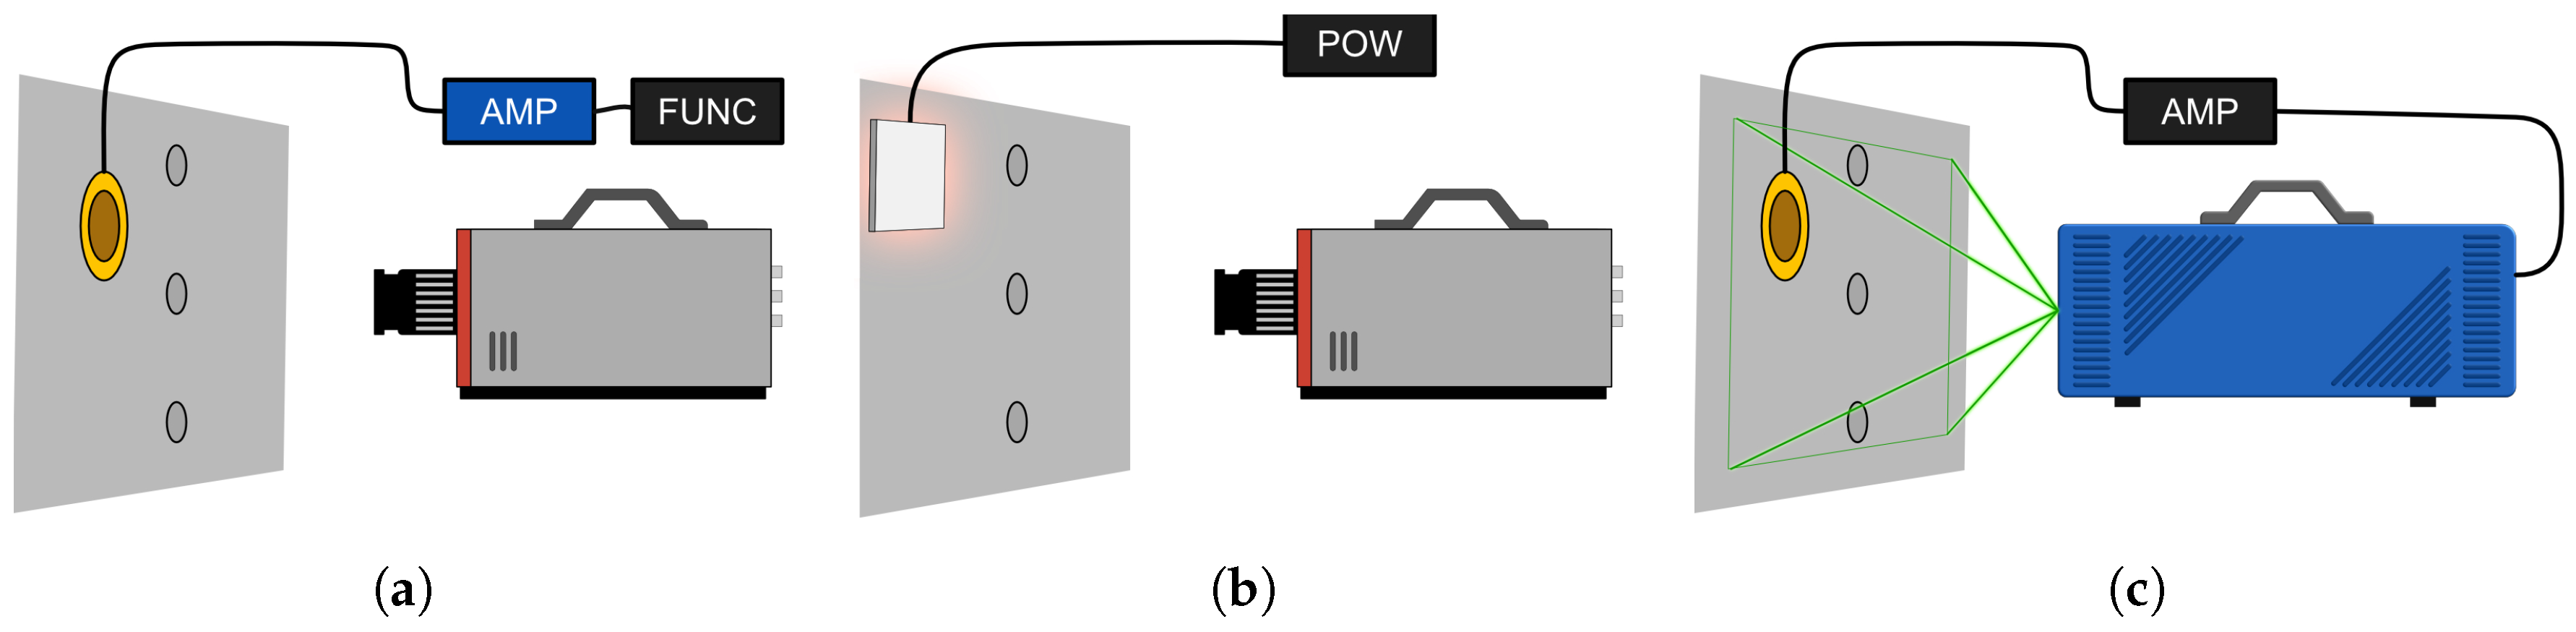
4.2. In-Plane Heatwave Thermography

For the measurements of the IPHWT, a highly sensitive IRC906SLS broadband infrared camera with a spectral response of 2.00 μ m to 11.25 μ m wavelength by IRCameras from the US is used. This camera has a high spatial resolution ( 640 × 512 pixels), low noise-equivalent delta temperature of NETD = 35   m K and was operated with a frame rate of 100 fps [39]. As described in Section 3.1, the heat source is a 40   m m × 40   m m × 3.9   m m large Peltier element by Farnell. The Peltier element is driven with its maximum input current of A m a x = 15.4   A at V i n = 5   V . The absolute temperature rise of the test specimen was not recorded during the measurements as the IPHWT is based on relative temperature changes. The Peltier element is directly clamped to the surface of the test specimen. To increase its efficiency, a brass block is attached to the backside (not attached to the panel) and serves as a thermal reservoir. As the length of the heat pulse (∼10 s) is not crucial for later processing, the Peltier is driven by a power source that can manually be switched on/off. The recorded videos are then processed with Python 3.1 and result in single images for the covariance and local gradient method respectively. As both methods should reveal the loose rivet, the two images can be joined together to achieve a single image as a result of the IPHWT.

4.3. SLDV Setup

For the excitation of the specimen, in the SLDV as well as the ULT setup, a conventional piezoelectric element by Farnell is glued to the surface close to the area of interest (some c m next to the rivet line). The piezoelectric transducer is a circular plate with a thickness d = 0.5   m m and a radius r = 35   m m and has a nominal resonance frequency of f r e s = 2.8   k Hz . It is worth mentioning that this is the designed resonance frequency according to the datasheet provided by the manufacturer.
The SLDV measurements of the fuselage panel were performed with a short wavelength infrared (SWIR) SLDV head from the company Optomet GmbH from Germany. This scanning head has an integrated function generator which simplifies the synchronization between the excitation and data acquisition. With a wavelength of 1550 n m , this scanning head operates in the short-wave infrared range (SWIR) which allows an output power of 10 m W while eye safety laser class 1 is still fulfilled. As mentioned before, SLDV performs point-wise measurements on a predefined grid. The total grid area and points density are linearly influencing the measurement time. In this work, the focus lies on a high spatial accuracy which leads to a high point density of 12 points per mm.
The input signal of the piezoelectric wafer is a τ = 23   m s long linear chirp signal with a frequency of 1 k Hz to 350 k Hz . For every point in the grid, three measurements with a sampling rate of 1.4 M S/ s are recorded and averaged. For each time signals v x , y , the FFT for each point ( FFT ( x , y ) ) is calculated and exported from the operating software for further processing and visualization with Python 3.1. For optimal feature extraction, the data is then frequency filtered before the root mean square (RMS) of each FFT ( x , y ) is calculated and normalized to the maximum RMS in the respective measurement. Additionally, the color bar for the representation of the individual frequency bands is optimized for good visual feature recognition. The lowest 0.8 % of measurement points are shown red and the highest 0.5 % of measurement points are in saturation. This promotes an intuitive judgment of the features like loose or damaged fasteners.

4.4. Ultrasound Lock-in Thermography
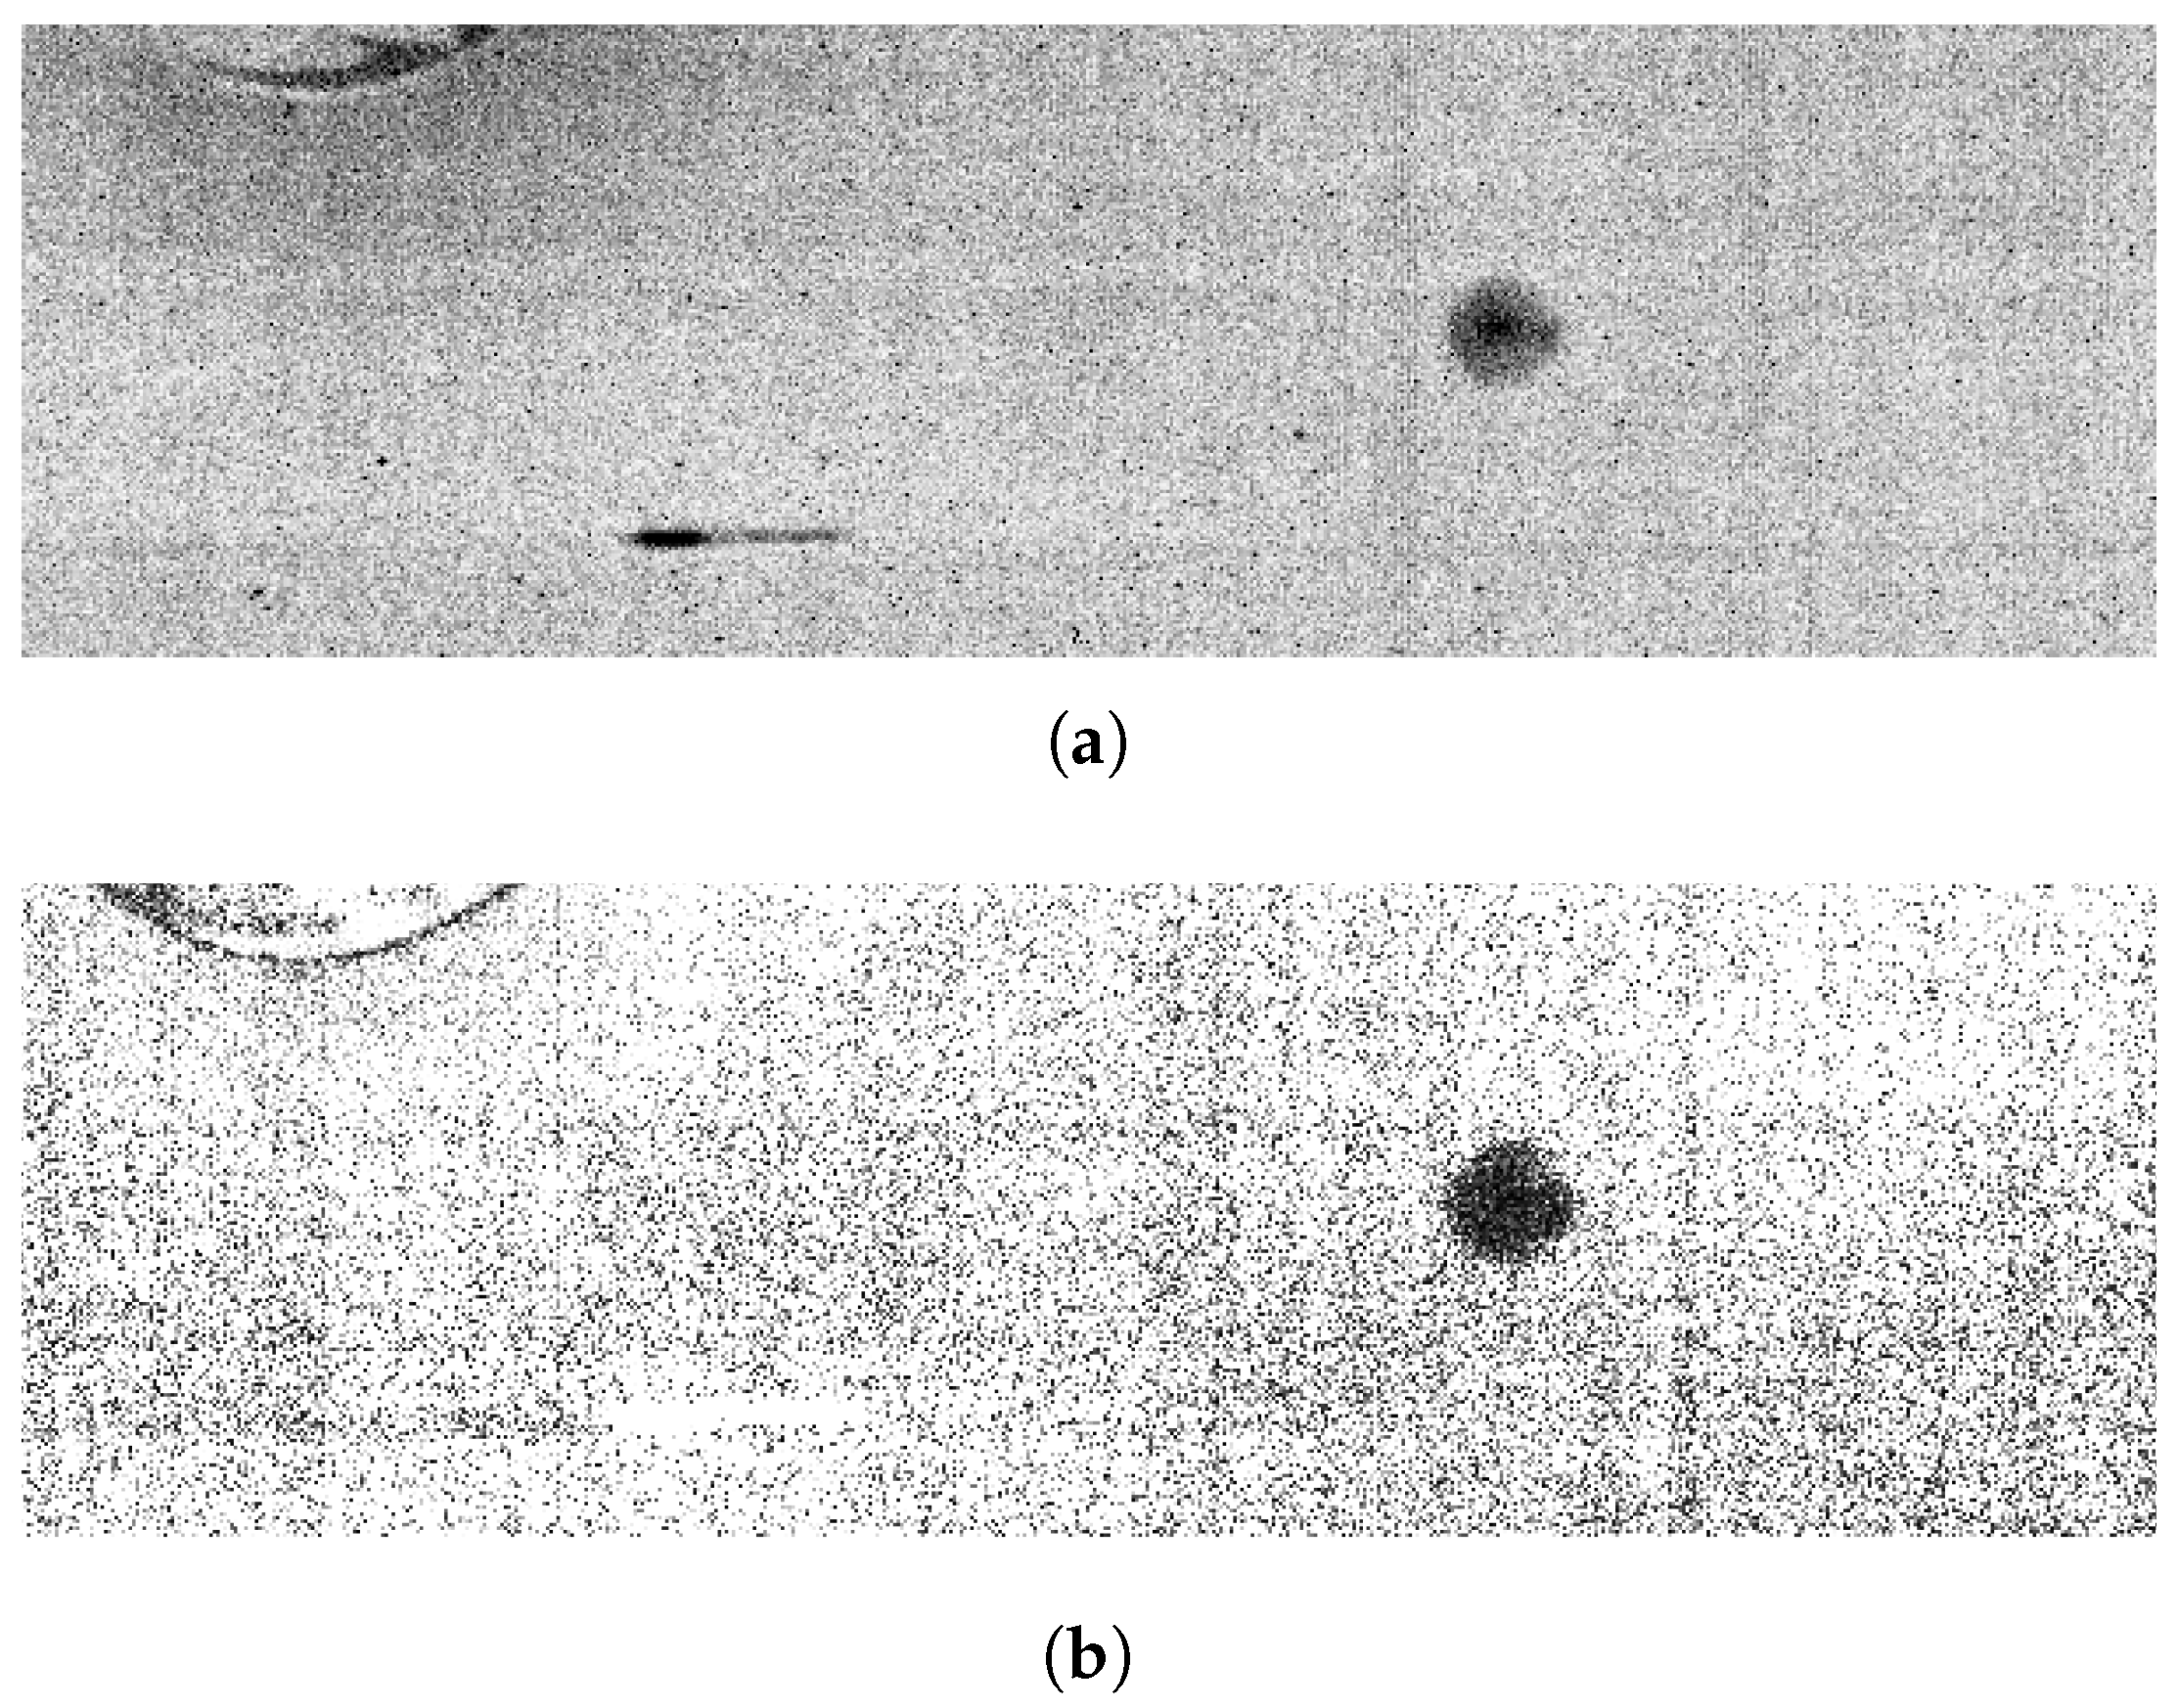
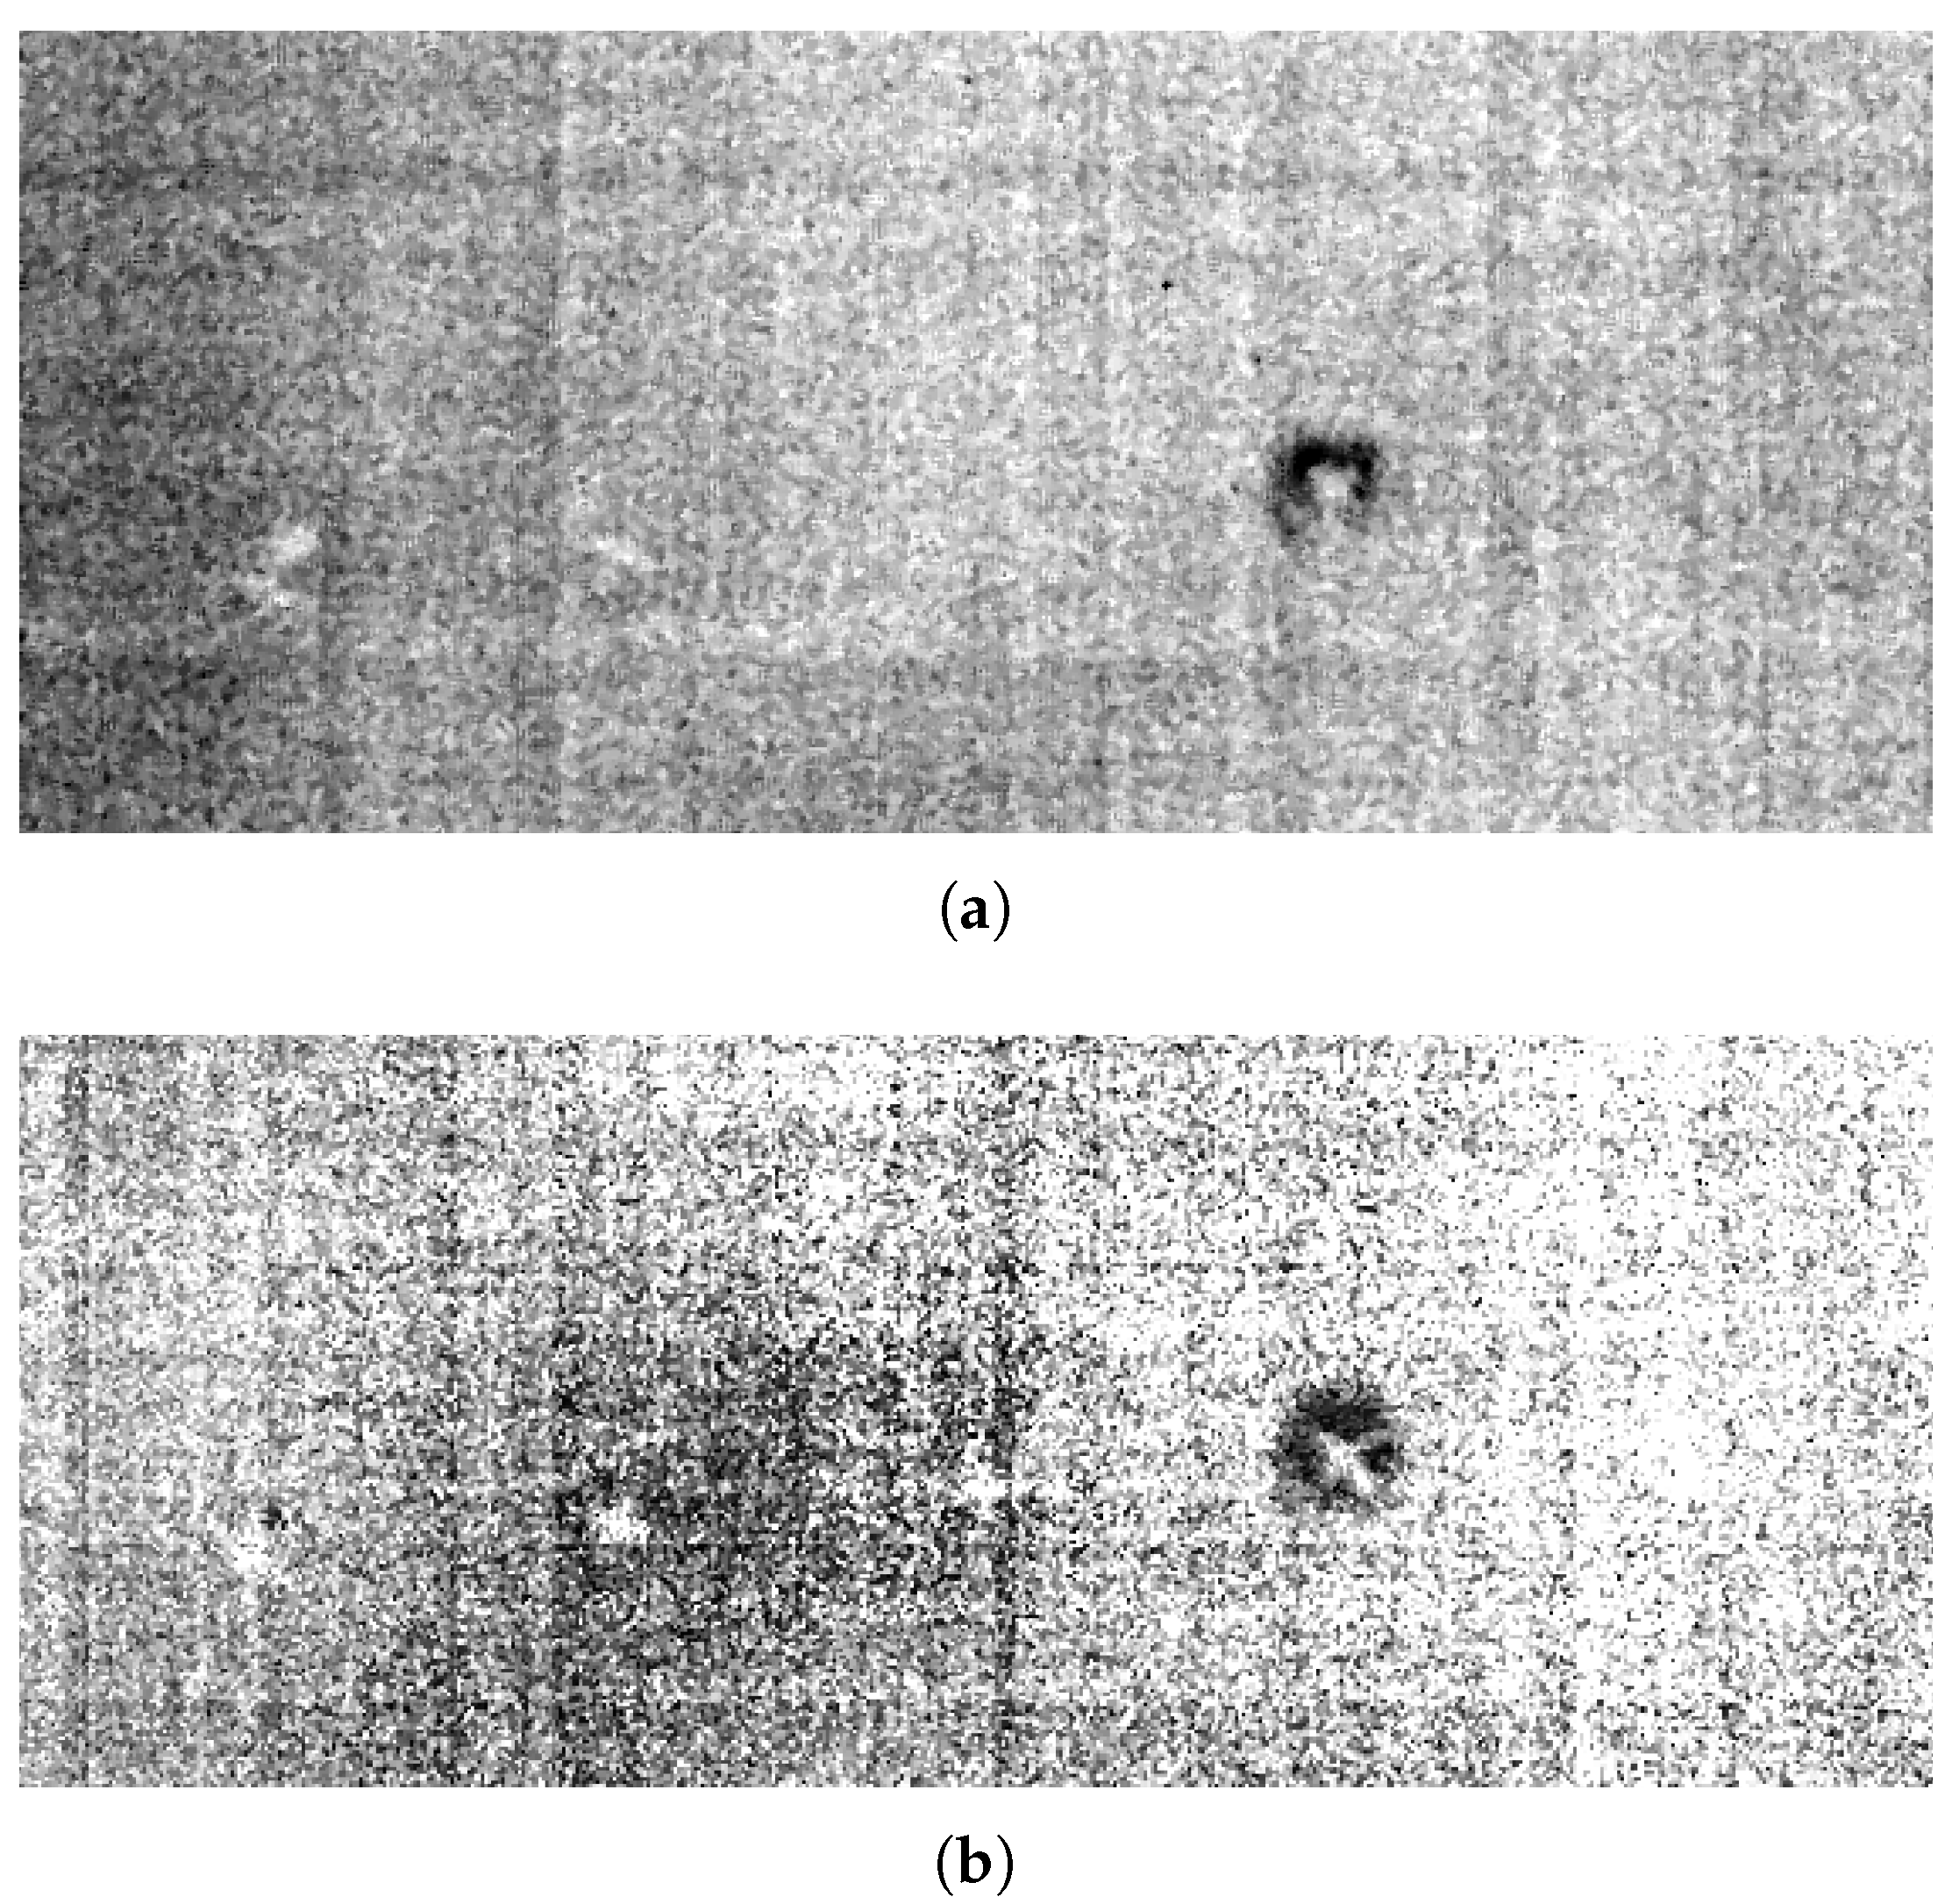
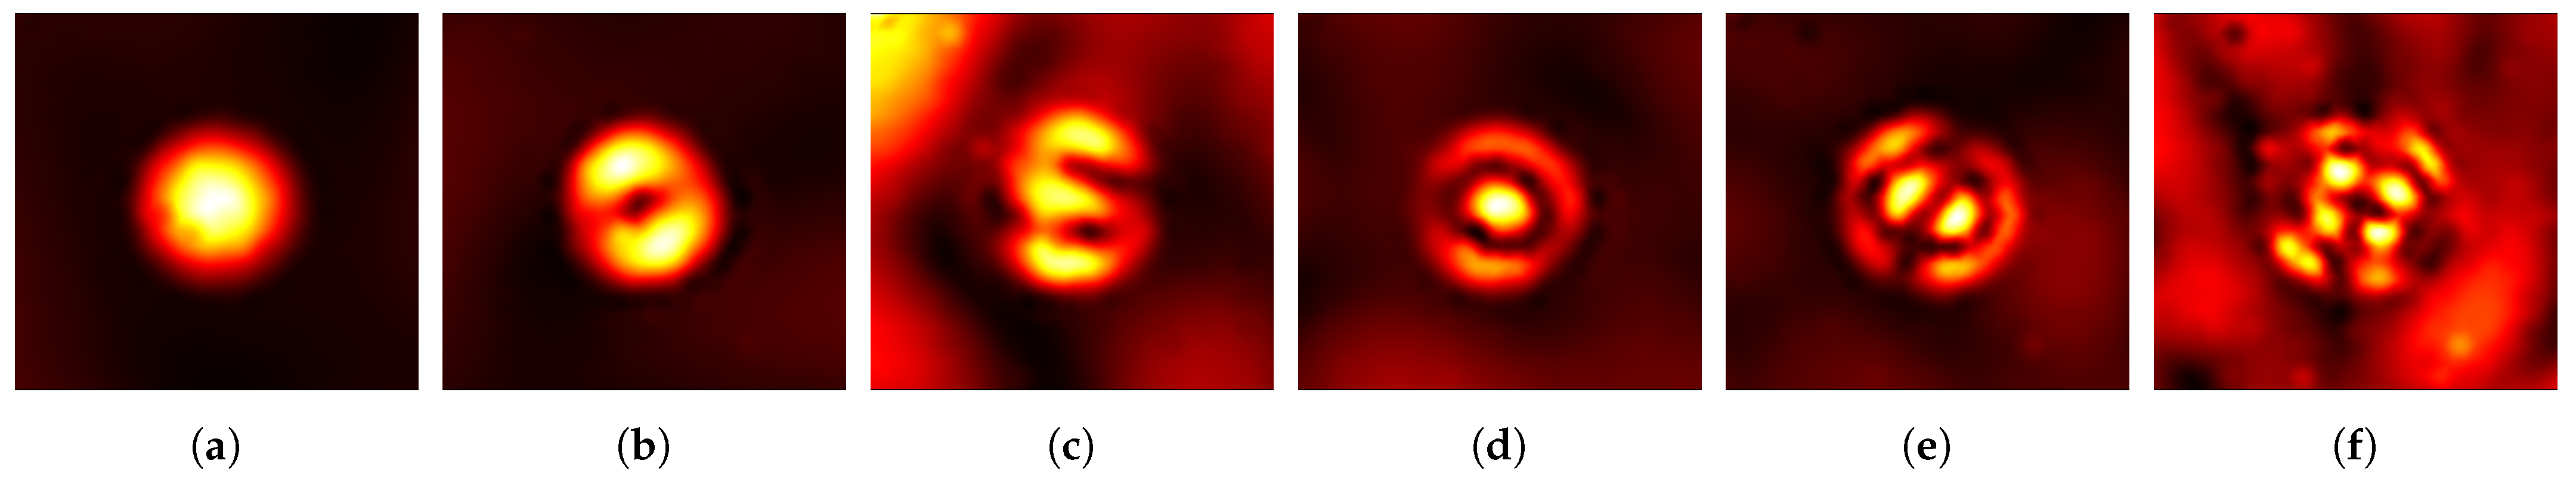
For the ULT, the same piezoelectric transducer as for the SLDV measurements is used to excite the specimen with linear sine chirp signals with a length of τ = 5   s . To excite the defect fasteners in the riveted aluminium plate, measurements with different frequencies between 3 k Hz to 150 k Hz have been performed. The lowest frequency is set to 3 k Hz because of the small excitation time of 5 s which is kept constant for all measurements. Hence, low frequencies will only allow a very limited number of periods in an excitation time window. The higher frequency of 130 k Hz underlies the used electronics and stimulating piezoelectric waver which does not allow a sufficient excitation at higher frequencies. To enhance the signal-to-noise ratio (SNR) despite the high thermal conductivity and heat capacity of the specimen (AL2020-T3), the piezoelectric waver is driven with an input voltage of 100 V which is provided by a piezoelectric driver (FLC Electronics AB FA20). To increase the emissivity of the specimen and capture the low temperature increase at the surface, some chalk spray (KD Check SD-1), which is normally used as the developer in dye penetrant testing, is applied to the surface. This spray is approved to DIN EN ISO 3452-2 and is therefore suitable for the use in an industrial environment.
For the measurement of the surface temperature, the same thermal camera as for the IPHWT which is described above is used. The captured videos are processed with an in-house written plugin for the open-source image processing software platform ImageJ, which calculates the phase and amplitude response of each pixel to the periodic excitation of the specimen based on the thermal video and the chirp length of the excitation signal. In this work, no synchronization between the video capturing and the piezoelectric transducer excitation was necessary as it was not intended to receive accurate phase information but to grasp the general periodic thermal response of the specimen to the excitation signal.

5. Results

In the following, the results of each inspection method will be discussed separately.

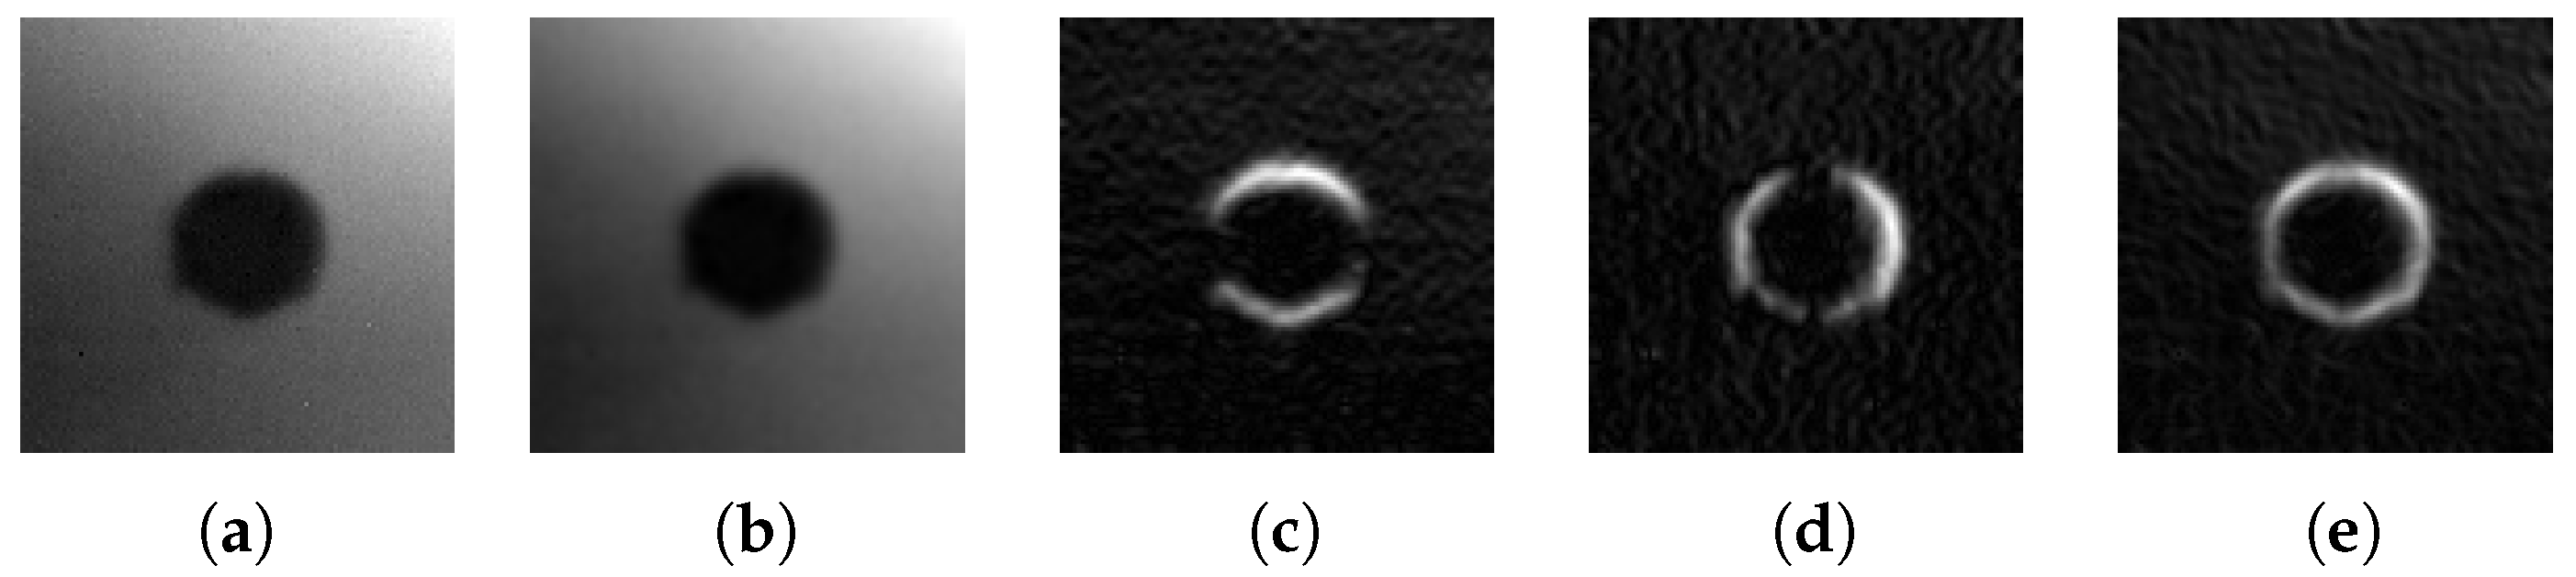
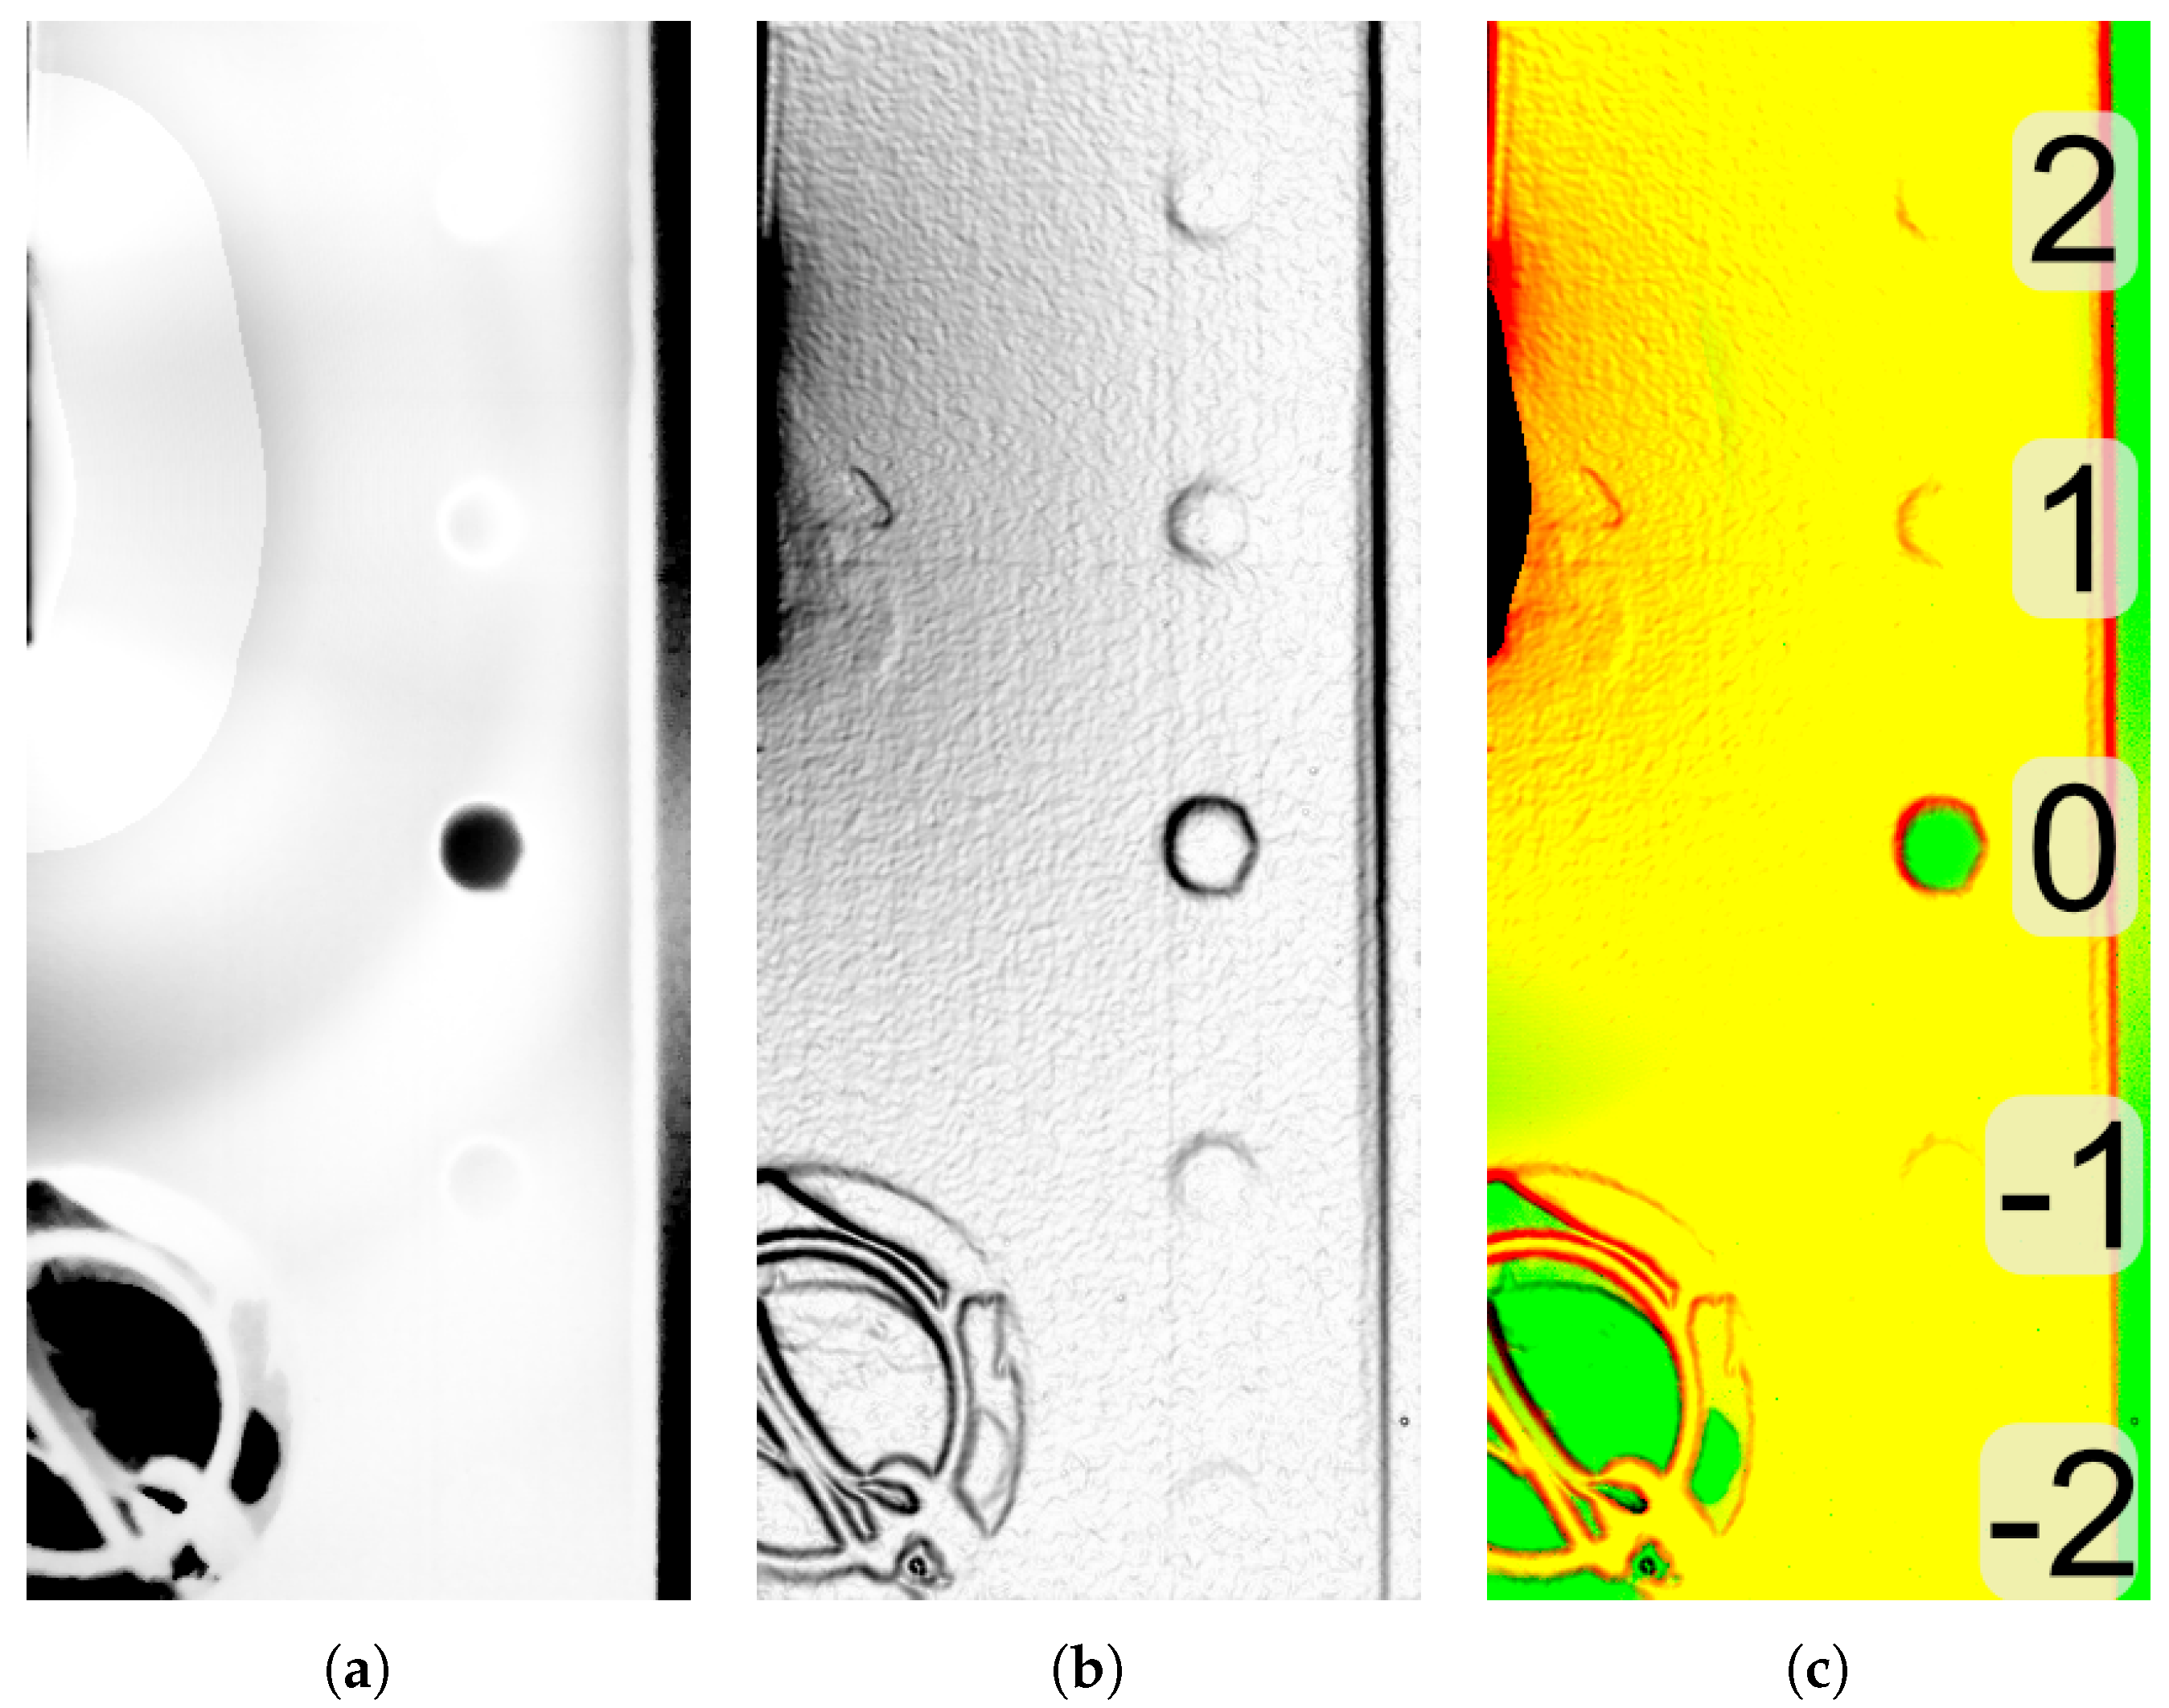
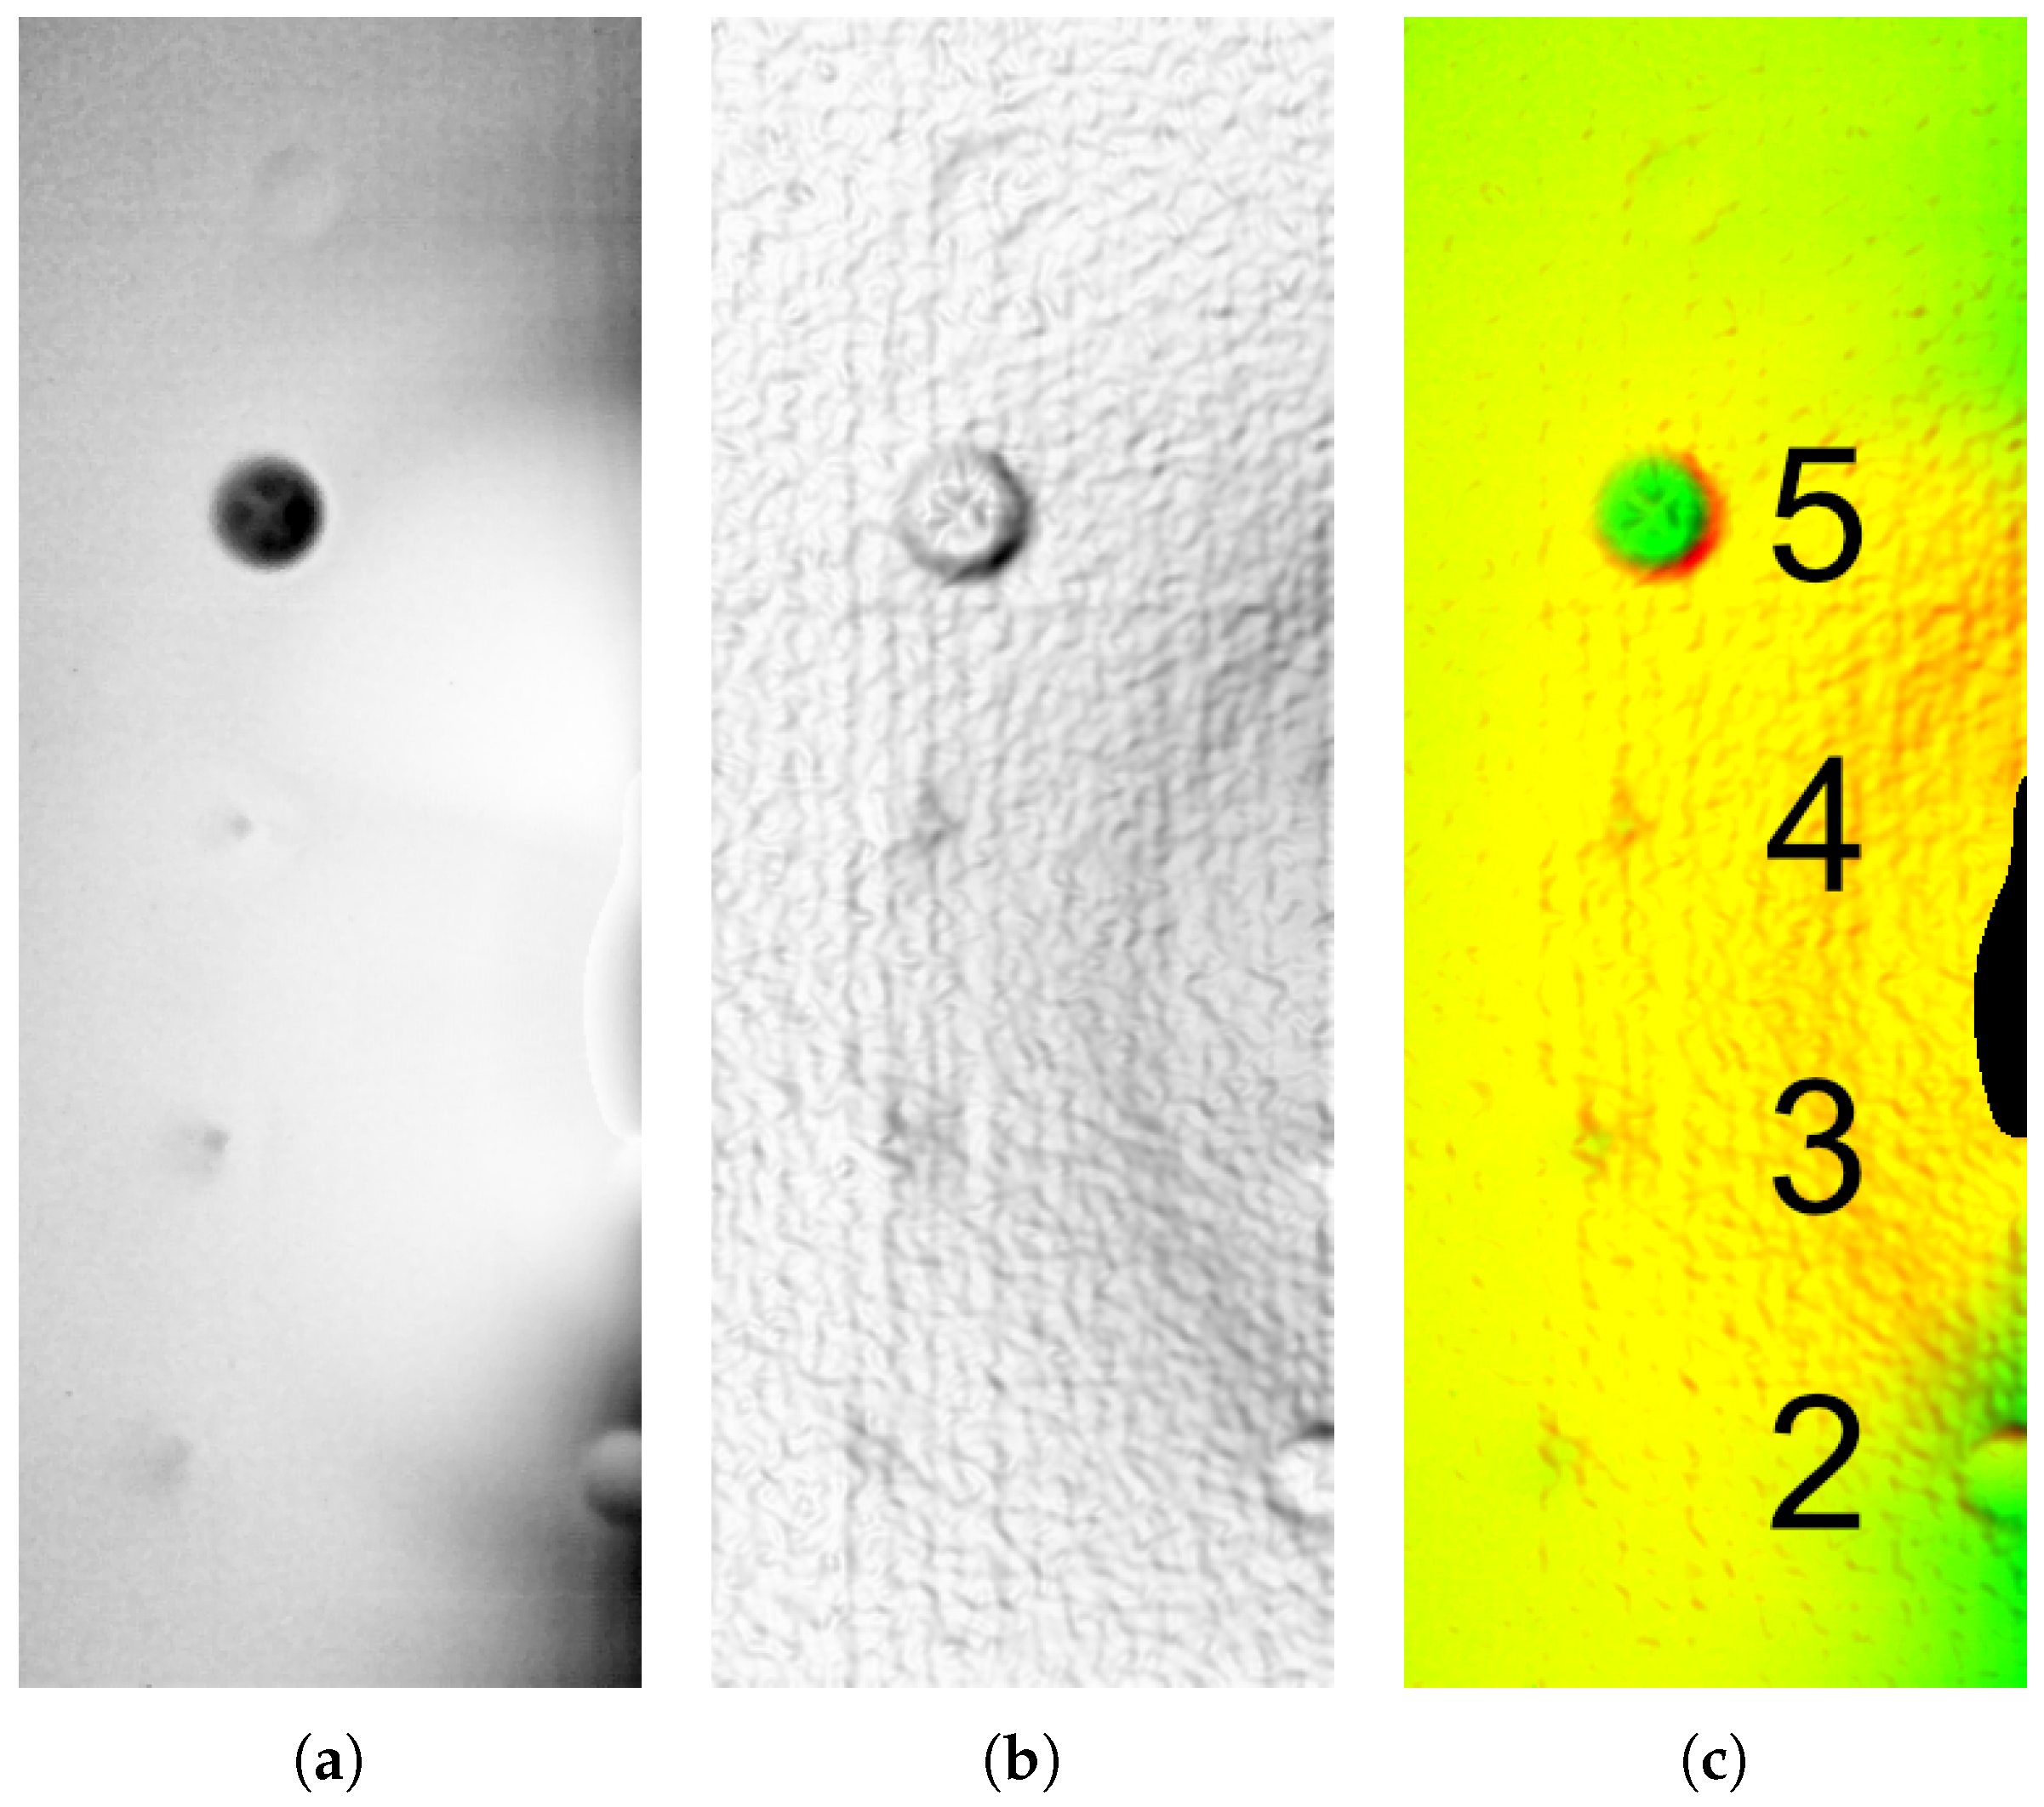
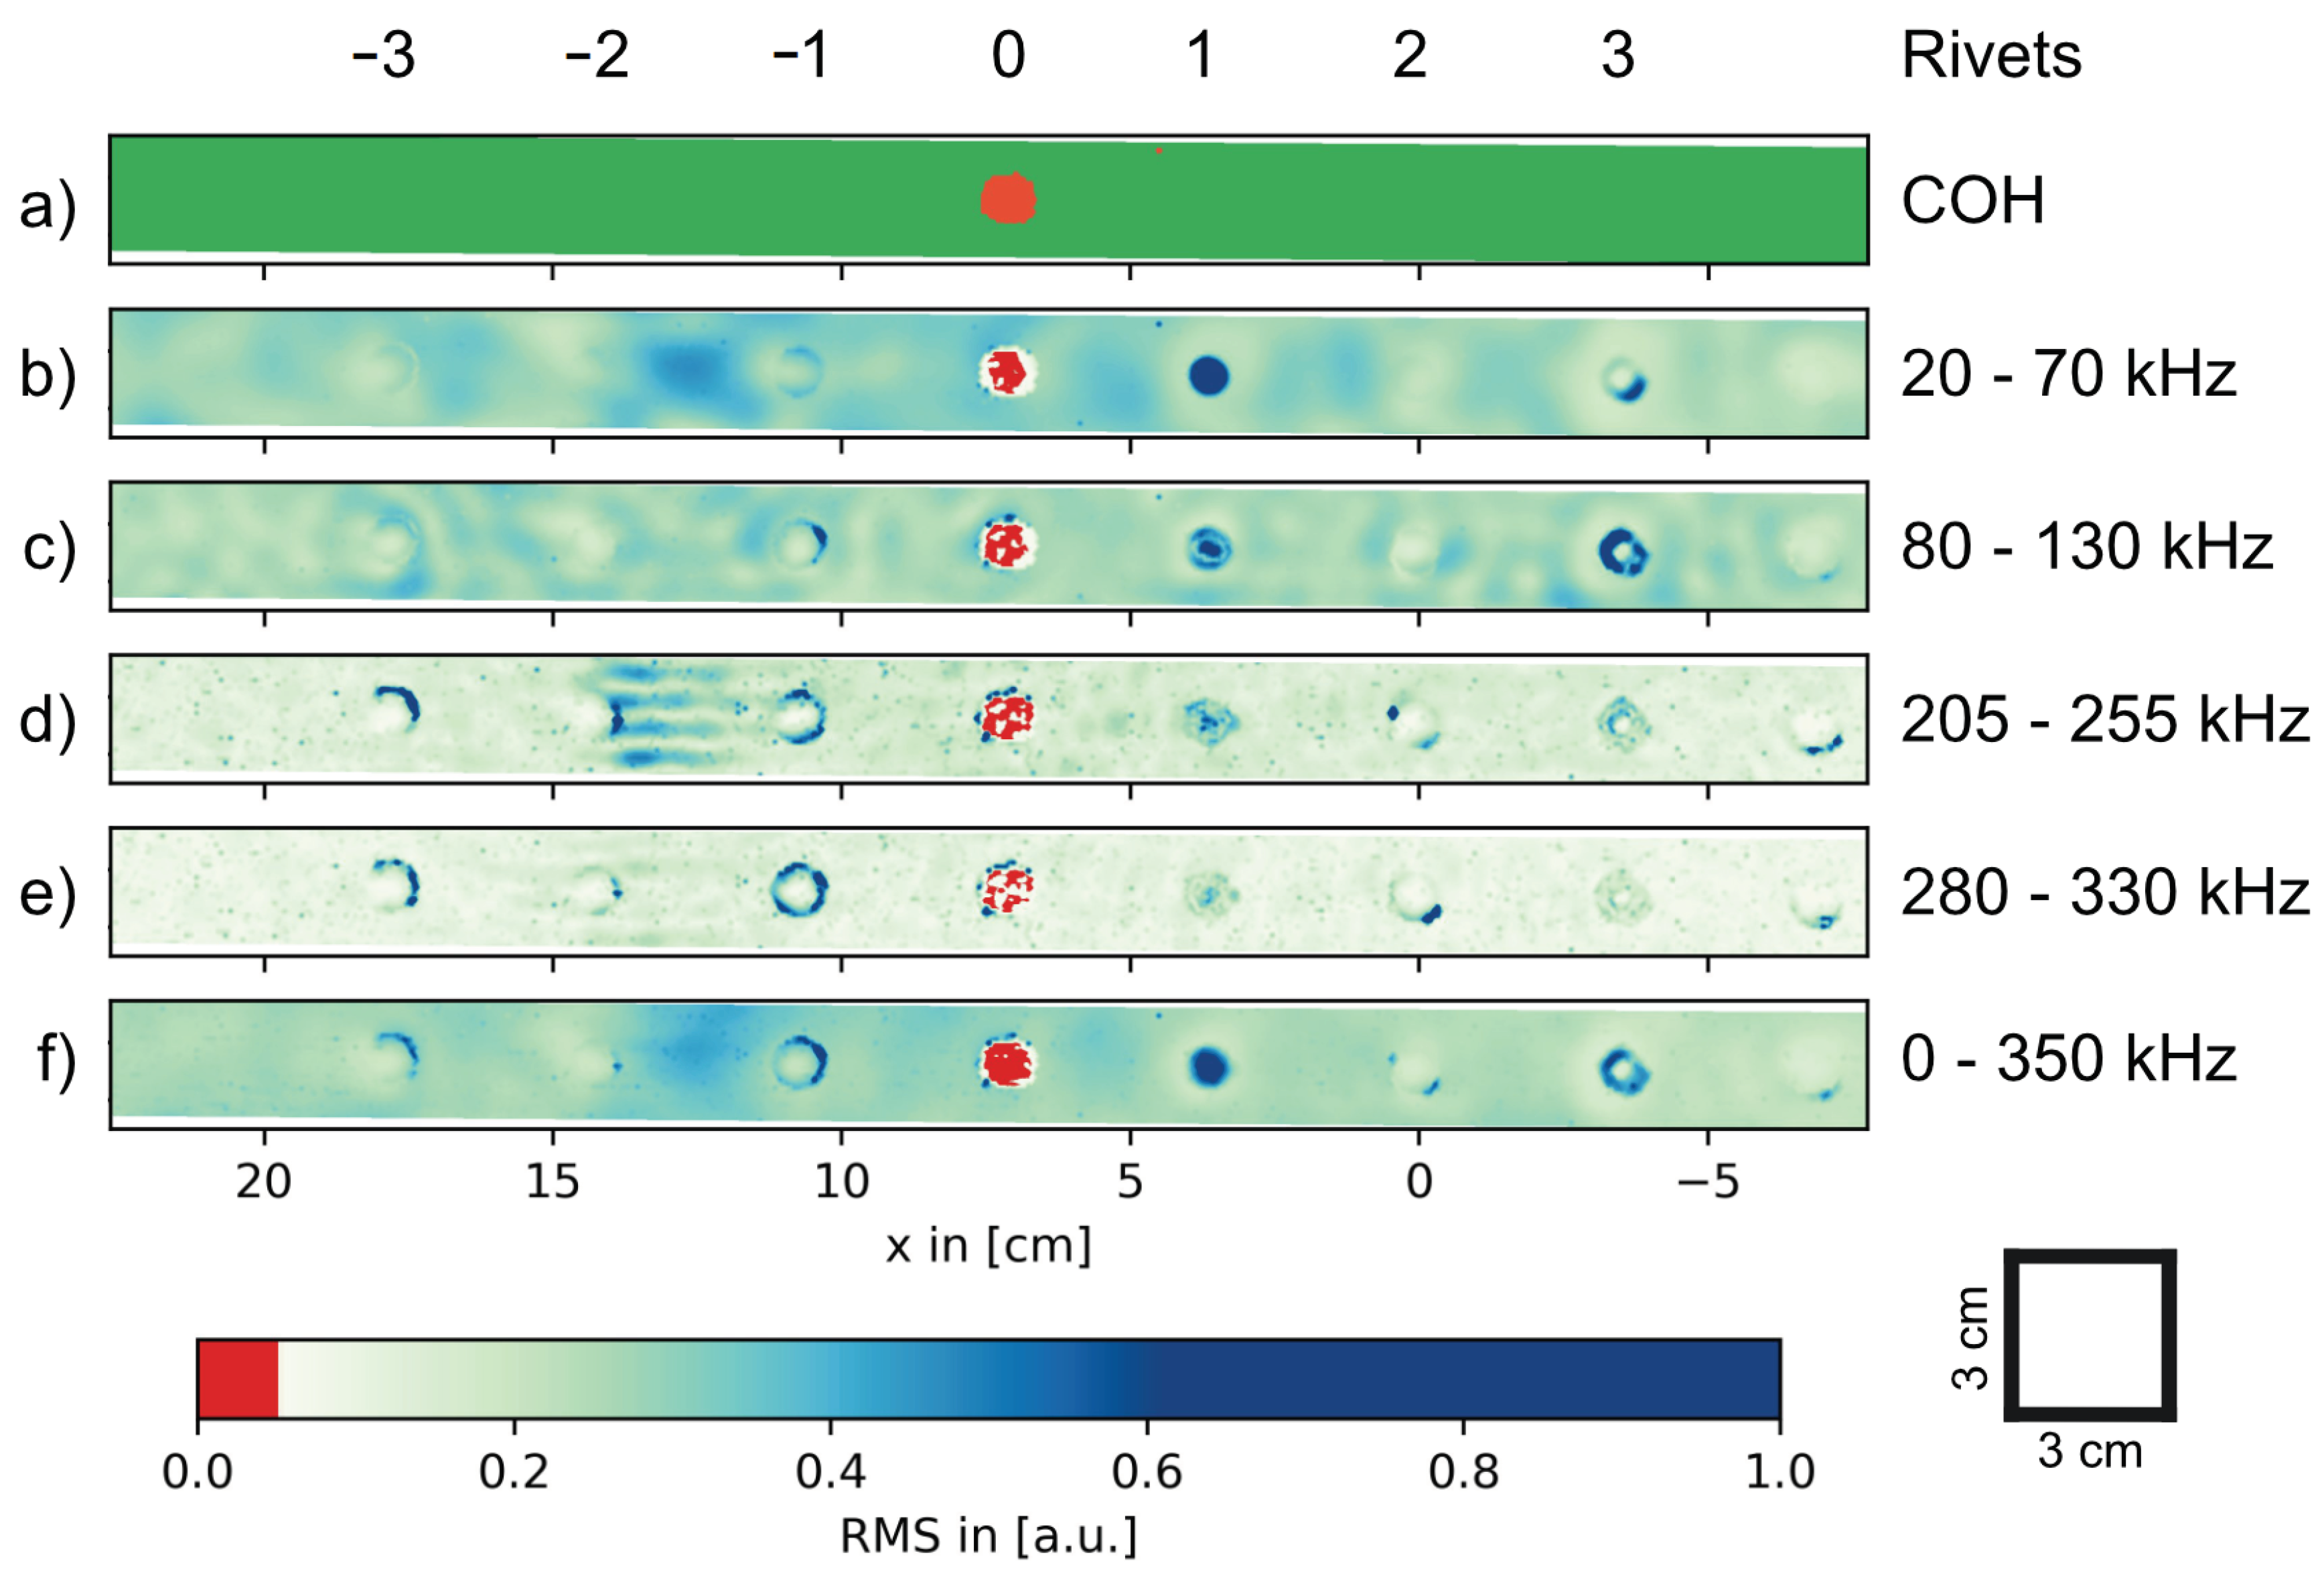
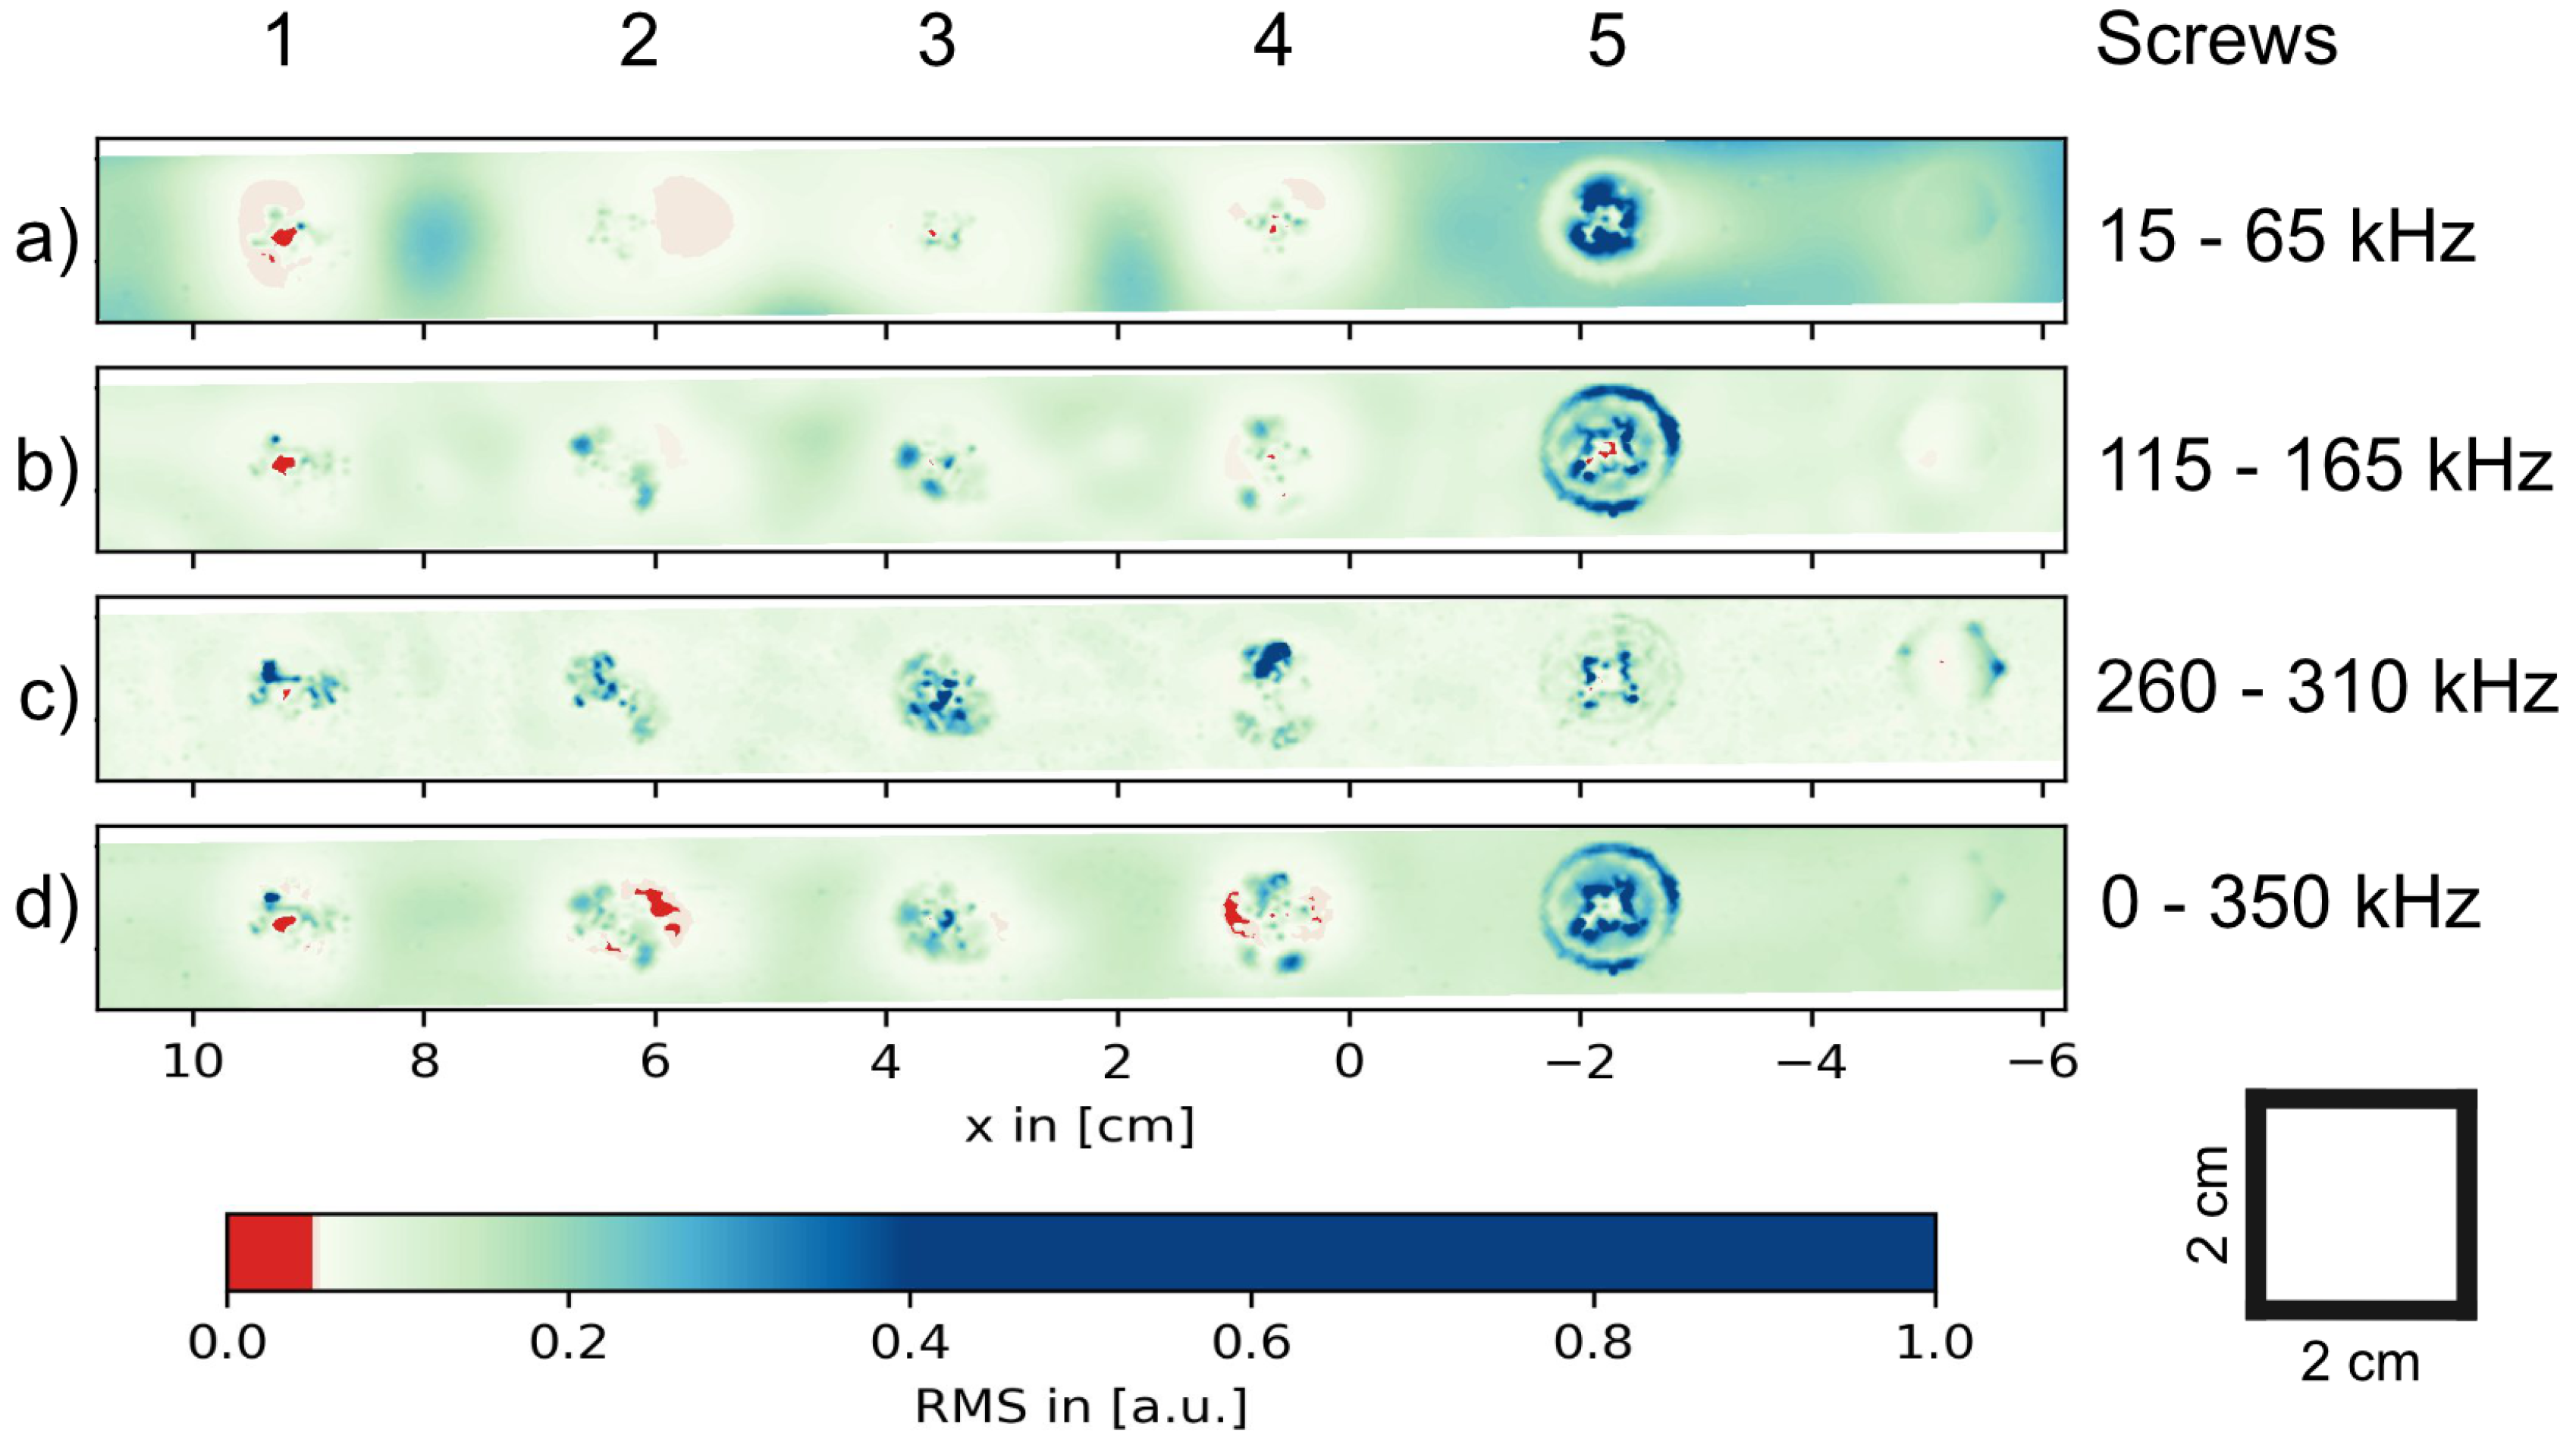
5.1. In-Plane Heatwave Thermography

In Figure 5, the result of IPHWT of area I is shown. The covariance analysis and local gradient methods are shown in Figure 5a,b respectively. In Figure 6c, the two methods are shown in one image where green corresponds to the covariance analysis and the red to the local gradient analysis. Here, also the black region at the top left indicates the identified heating area where the Peltier element is attached to the panel.
The IPHWT is also applied to area II and results are shown in Figure 6. Figure 6a,b show the result of the global covariance and local gradient method respectively and Figure 6c the composed image. All three images show the modified screw 5 as well as the tight screws 2–4. Additionally, a rivet at the left of the heating area indicated in black in Figure 6 bottom is visible. Another rivet at the right of the loose screw is only visible in the result of the global covariance method.

5.2. SLDV

As described in Section 3.2, the analysis of the SLDV data results in one image that depends on the frequency filtering of the calculated FFT for each point. Figure 7a shows the map of coherence of each measurement point with the input signal where a threshold of COH > 0.8 separates the red and green points. Figure 7b–f shows the RMS of the FFT of area I in some representative frequency bands. A detailed discussion about the calculation of the coherence can be found in Reference [40]. Each image indicates different features to a different extent. The most dominant spot in all six images is rivet 0 that appears red in the coherence as well as in all frequency bands. This indicates the low coherence and low RMS of the loose rivet respectively. The other eight rivets are not visible in the coherence representation and are somehow visible in the different frequency bands. In the lowest frequency band, rivet 1 and 3 show resonances and are visible as blue spots corresponding indicating a high vibration amplitude. In Figure 7d, a stripe-like artifact between 10 c m to 15 c m can be seen. The high frequency band with frequencies from 280 k Hz to 330 k Hz also reveals the intact rivets.
The vibration analysis of area II is shown in Figure 8. As stated above, the nut of the screw 5 is loose. However, the screw this still tight in the surrounding plate and no loose parts are visible from the front side. Hence, the analysis of the coherence does not show any features and is not shown here. This can also be conducted from the fact that no or only very small clustered red areas are visible in the frequency filtered RMS images which indicates a good coupling between the piezoelectric transducer patch and all points in this field of view. As in area I, the different frequency bands reveal different features that resonate at different frequencies. At 15 k Hz to 65 k Hz , screw 5 with the loose nut is visible. However, also the other screws, which built a tight connection between the two plates, are visible due to the bright areas around them. As for the rivets, a second vibration mode of screw 5 can be seen at higher frequencies (115 k Hz to 165 k Hz ) where the outer edge and the cross slot in the screw head are visible. At high frequencies above 260 k Hz , all screws become visible and even a sixth feature, a rivet at the right of screw 5 shows some resonance and confirms the characteristic observed in area I.

5.3. ULT

As described in Section 4.4, the ULT measurements have been performed with various frequencies in the range of 3 k Hz to 130 k Hz . However, the lock-in analysis of only a few frequency bands results in an amplitude and phase image that show some features. These frequency bands are 20 k Hz to 30 k Hz and 110 k Hz to 120 k Hz (periodicity: 5 s ) for the area I and area II respectively. The amplitude and phase images for these frequency bands are shown in Figure 9 and Figure 10 and highlight the presence of the resonating and periodical heating defect rivet and screw which have also been visible in Figure 7b and Figure 8a.

6. Discussion

As described before, this work aims to compare three NDT techniques that can detect and quantify loose and damaged rivets and nuts. Multiple measurements on one single specimen being a commercial aircraft fuselage panel allow a great principle comparison of the three techniques. Each technique has its advantages and disadvantages concerning the sensitivity, accuracy and applicability in an industrial environment like an aircraft hangar. These aspects will be discussed and compared in the following.
The results obtained from the measurement of area I which contains a loose, as well as sheared rivets, underline the possibilities of inspections with SLDVs. In this area, the SLDV measurement is able to detect, visualize and distinguish loose, sheared and intact rivets. The loose rivet is badly coupled to the surrounding plate and appears as the red area in a broad frequency range (1 k Hz to 350 k Hz ) associated with low vibration energy. Additionally, the visualization of the coherence between the input signal and the vibration highlights loose parts in the investigated area. At the same time, due to their reduced tightness, sheared and damaged rivets appear as resonances in the low frequency range below 200   k Hz . Reference [41] proposes to call these resonances local defect resonances (LDR). LDRs result from the fact that the presence of a defect leads to a local decrease in stiffness of a certain mass of the material in the area of the resonance. Reference [31] also introduces the so-called effective rigidity K e f f and effective rigidity M of a defect which determine its fundamental resonance frequency f 0 . A higher mass decreases the fundamental resonance frequency f 0 and a higher stiffness increases f 0 .
f 0 = 1 2 π K e f f M .
The LDR behavior of the damaged rivet is confirmed by a close-up at different frequencies which is shown in Figure 11. The different patterns correspond to the different vibrational modes of the system with a fundamental frequency 25(1) kHz and higher harmonics at 51 kHz, 76 kHz, 89 kHz, 125 kHz and 169 kHz.
This is in agreement with the excitement of intact rivets at high frequencies above 200 k Hz . For low as well as intact rivets, the connection between rivet and plate generates a weak spot in the plate-like structures which experiences vibrational excitement. The tighter the connection between rivet and plate, the higher the stiffness and LDR resonance frequency.
This is also confirmed by the measurement results of area II (Figure 8) where the screw with the loose nut as well as the intact screws are visible. Again, the loose screw associated with a low stiffness is visible at low frequencies (15 k Hz to 65 k Hz and 115 k Hz to 165 k Hz ) while the tight screws (high stiffness) are visible at high frequency band images (260 k Hz to 310 k Hz ).
Besides the different frequency range in which intact and damaged connections are visible, also the appearance differs in the two cases. For intact rivets, only a small area at the edge of the rivets becomes visible while the two damaged rivets show large area LDRs. A similar phenomenon can be seen at area II where intact screws show only small LDRs and the loose screw appears as a large area LDR. This can be explained with the increasing excitation frequency that comes with a shorter wavelength. The shorter the wavelength, the smaller LDRs can be exited and appear in the image. Especially the detection of intact rivets and screws should be highlighted as it is of big advantage in an industrial environment. Here, safety and reliability are crucial and the detection of intact parts serves as a evidence that the inspection tool works and is used in the correct way. In such conditions, the inspection of riveted joints will show both, intact and damaged rivets. Hence, the detection of intact rivets serves as a cross-check of the measurement and the likelihood of false negatives is reduced.
Also the ULT measurement of area I reveals the damaged rivet. However, as this technique is based on the heat production due to rubbing and clapping of vibrational exited parts, the loose rivet which experiences no vibrational excitation is not detected. While the SLDV measurement covers a broad frequency spectrum in one measurement, the experimental setting only allows ULT measurements of frequency bands with a bandwidth of 10 k Hz . As the LDR frequencies of damaged rivets are a priori unknown, the scanning of a broad frequency band coming with multiple measurements is required. Such a measurement procedure scanning wide frequency ranges could be automatized for industrial applications but will always increase the inspection time compared to small frequency range measurements. As described before, the high heat conductivity and heat capacity of aluminium is an additional challenge for this technique. Even if lock-in processing leads to a high SNR of the measurement, the defect rivets and screws are barely visible. This could be improved by more sensitive recording IR cameras or an increase of the vibrational excitation which leads to an increase in heat production. Both could potentially be realized with at higher costs due to more expensive equipment.
The presented experiment is performed in laboratory conditions with an IR camera setting that has an NEDT = 35   m K . Taking into account that an industrial environment implies a lot of noise increasing factors like surface reflections, hot or cold air flow and other heat radiating apparatus, it is unlikely to achieve a better SNR while keeping an economical benefit. Hence, an increase of heat production by a higher vibrational excitation should be the aim for further developments. This includes a profound coupling of the exiting piezoelectric transducer to the specimen as well as the proper selection of piezoelectric transducer patch and amplifier. However, even with an improved excitation setup and a sufficient measurement SNR, one critical aspect being the in-service reliability check remains. As discussed earlier, the ULT technique only detects damaged rivets and is not sensitive to intact or loose rivets. Therefore, hardware problems for example, with the coupling of the piezoelectric waver to the specimen easily result in false negative results in which present defects may not be detected. To minimize the risk of false negatives, some kind of calibration during the measurement at the specimen under test is needed to indicate a proper inspection. A removable artificial defect being attached to the specimen could serve this purpose. In this case, measurement is only classified as valid if the artificial defect is visible in the result.
IPHWT visualizes loose, damaged and intact rivets as well as tight and loose screws. As the method relies on the in-plane heat flow and its disturbance due to loose or damaged fasteners, no direct information of the tightness of a fastener is acquired. Without a more profound study including some statistics, it is difficult to distinguish between damaged and intact rivets. In comparison to the SLDV measurement, this method is much faster and the full-field character allows the inspection of large areas in one measurement. The maximum size of the inspected area is dependent on the heat source and the thermal material properties. In the first order, the heatwave generated by a point-like source has a cubic decay with distance from the heat source. A low temperature profile results in a low SNR for both analysis methods and results in a decreasing SNR for larger distances to the heat source. The maximum surface temperature increase depends on the injected energy and the heat capacity of the specimen. As the latter is fixed in industrial applications such as the in-service aircraft inspection, further investigations should focus on the optimization of the stimulating heat source. Although a contactless heat excitation as proposed by Reference [35] has some advantages, this study uses a Peltier element for the local heating of the specimen. The drawback of a Peltier element in comparison to a Laser-excitation is the required access to the surface and its spatial dimension. The latter is much larger than for the focused laser spot used by Reference [35] (∼ 0.35   m m ) which reduces the point-like behavior of the excitation and the resulting heat dispersion.
However, three advantages of the Peltier element outweigh its aforementioned disadvantages. Firstly, Peltier elements are very cheap while being easy and safe to operate which avoids the safety restrictions coming with the use of (high-power) lasers. This point plays an outstanding role for applications in industrial environments like daily aircraft maintenance. Secondly, the thermal energy induced into the specimen by the Peltier element is orders of magnitudes larger than the thermal energy of the laser. This has several benefits like a higher SNR of the data, a possibly large distance from the heat source to the crack and the option to thermally excite thick plates. And thirdly, Peltier elements come with the positive side effect of cooling after switching off. Peltier elements also called the thermoelectric heat pumps, transfer the heat energy from one to the other side. After switching off, the two sides of the element strive for thermal equilibrium which results in a cooling of the hot side. This phenomenon influences the shape of the thermal wave which shows a steep negative slope after the switch-off of the Peltier element.
A sequential multi-point measurement with a relocated heat source could make some of the aforementioned advantages redundant (e.g., large inspection area). A contactless heat source would simplify the technical realization and hence encourage such a measurement procedure. Contactless heat sources are used in most fields of NDT such as flash thermography or Eddy current thermography. Even if most established heating methods come with a more complex hardware setup than a power source and an easy to handle Peltier element, such adaptations could be easily realized.
Another aspect that should be taken into account for the comparison of the different technologies is a potential fusion of them. One hybrid solution could include the IPHWT and ULT measurement as both are based on thermal videos. In such a case, only the excitation unit which is a relatively cheap part of the setup needs to be modified, while the thermal camera can be used for both techniques simultaneously.
Table 1 summarizes the key aspects of the three different technologies being the feasibility to detect intact, loose and damaged fasteners as well as an estimate of the costs in time and money. In addition, Table 1 lists a qualitative estimate of the clarity of detection which includes the interpretation complexity as well as how explicit the measurement data is. The listed costs rating is based on an approximate estimation and only indicates the costs relative to each other. The same holds for the inspection time which highly depends on the hardware setting, the measurement accuracy and procedures and only provides a tendency for each technique. It should be highlighted that these statements are based on the experiments and results presented in this work.
The presented results show the feasibility of detecting and qualifying loose, damaged and intact fasteners in aircraft fuselage lab-joints with state-of-the-art NDT techniques. For possible applications in an industrial environment such as an aircraft hangar, each technology requires further studies to clarify some individual aspects which will be discussed in the following. For all technologies, a comparison study which includes a digital in parallel to a manual inspection by a certified aircraft technician is advisable. This allows the establishment of validated thresholds that are crucial for the automated classification of fasteners. Besides this, every technique requires some specific fine-tuning prior to further commercial exploration.
The SLDV measurements show great potential and enable the distinction between loose, damaged, and intact rivets. However, the coupling of the piezoelectric transducer patch to the fuselage has to be reversible and at the same time provide a reliable connection. As discussed previously, the fundamental LDR resonance frequency of rivets might serve as a parameter that allows a classification of intact and damaged rivets. However, for this, an extended study with sufficient statistics has to establish thresholds that can be used for this classification. Another aspect for further studies is to strive to a fully contactless setting with an air-coupled excitation. This enables fast and automated inspection procedures that can possibly be performed fully remotely by for example, a drone.
The presented ULT results do not show sufficient clarity for industrial applications which might be tackled with some additional post-processing and advanced visualization. By increasing the vibrational power, increased heating of defected fasteners should be targeted in further experiments. This might be realized with a higher input voltage at the piezoelectric transducer as well as an optimization of the exiting actuator which does not necessarily have to be a piezoelectric patch. Hence, it can be said that the presented experimental setup for ULT not easily able to detect loose rivets and provides only limited clarity regarding the detection of damaged rivets.
The most innovative measurement technique in this paper is IPHWT. This technique requires further studies addressing the varying SNR with increasing distance to the heat source and a possible contactless, sequential multi-point excitation approach. Additionally, an advanced combination of the two post-processing methods that reveal different physical properties of the specimen should be investigated. By doing so, the missing distinction between damaged and intact rivets might be realized and the method would become very effective and economically attractive.

7. Conclusions

In this work, the digital assessment of loose, damaged and intact fasteners in riveted lab-joints of commercial aircraft fuselage panels are investigated with three NDT methods. Besides well-established methods being SLDV and ULT, a novel inspection technique based on in-plane propagation of heatwaves, named In-plane Heatwave Thermography is explored and compared with the aforementioned techniques.
The measurements on a serviced aircraft panel serve as a feasibility study under conditions being close to the ones in an industrial environment. In comparison to the thermographic inspection methods, the SLDV measurement provides the clearest results that enable the distinction between loose, damaged and intact rivets. However, this method is also the slowest and most expensive inspection method. In the presented experimental configuration, ULT only detects sheared but tight rivets which appear in the phase as well as amplitude image of the post-processing. The advantage of this method is the full-field character with an equally distributed SNR. In contrast to this, the novel IPHWT has heterogeneous SNR being high close to the heat source and decreasing with increasing distance from the heat source. Nevertheless, the full-field character enables the detection of all kinds of fasteners in a large area and shows a clear signature distinguishing loose from intact and damaged rivets.

Author Contributions

Conceptualization, M.S. and P.K.; Methodology, M.S. and P.K.; Software, M.S. and P.K.; Formal Analysis, M.S. and P.K.; Investigation, M.S. and P.K.; Resources, B.K. and M.W.; Writing—Original Draft Preparation, M.S.; Writing—Review & Editing, B.K., H.P. and M.W.; Visualization, M.S.; Supervision, J.R. and M.W.; Project Administration, H.P., J.R. and M.W.; Funding Acquisition, B.K., H.P., J.R. and M.W. All authors have read and agreed to the published version of the manuscript.

Funding

The research leading to these results has received funding from the “NDTonAIR” project (Training Network in Non-Destructive Testing and Structural Health Monitoring of Aircraft structures) under the action: H2020-MSCA-ITN-2016-GRANT 722134. The work leading to this publication has been funded by the ICON project “DETECT–ION”, which fits in the MacroModelMat (M3) research program, coordinated by Siemens (Siemens Digital Industries Software, Belgium) and funded by SIM (Strategic Initiative Materials in Flanders) and VLAIO (Flemish government agency Flanders Innovation & Entrepreneurship).

Informed Consent Statement

Not applicable.

Data Availability Statement

The data presented in this study are available on request from the corresponding author.

Acknowledgments

The presented work was conducted in close cooperation with Optomet GmbH, Germay who provided measurement equipment as well as technical support. The Brussels Airlines M&E department made this work possible by giving advises and providing the test specimen.

Conflicts of Interest

The authors declare no conflict of interest. The sponsors had no role in the design of the study; in the collection, analyses, or interpretation of data; in the writing of the manuscript, or in the decision to publish the results.

Abbreviations

The following abbreviations are used in this manuscript:
NDTNon-Destructive Testing
AMMAircraft Maintenance Manual
SLDVScanning Laser Doppler Vibrometry
ULTUltrasound Lock-in Thermography
FCFlight Cycle
CFRPCarbon Fibre Reinforced Plastic
IPHWTIn-plane Heatwave Thermography
RMSRoot Mean Square
SWIRShort-Wave Infrared Range
FFTFast Fourier Transform
NEDTNoise Equivalent Temperature Difference
LDRLocal Defect Resonance
SNRSignal-to-noise ratio

References

  1. Skorupa, M. Riveted Lap Joints in Aircraft Fuselage: Design, Analysis and Properties, 1st ed.; Solid Mechanics and Its Applications, 189; Springer Netherlands Imprint: Dordrecht, The Netherlands, 2012. [Google Scholar] [CrossRef]
  2. Mínguez, J.M.; Vogwell, J. Effect of torque tightening on the fatigue strength of bolted joints. Eng. Fail. Anal. 2006, 13, 1410–1421. [Google Scholar] [CrossRef]
  3. Rans, C.; Straznicky, P.V.; Alderliesten, R. Riveting process induced residual stresses around solid rivets in mechanical joints. J. Aircr. 2007, 44, 323–329. [Google Scholar] [CrossRef]
  4. Zhang, K.; Cheng, H.; Yuan, L. Riveting process modeling and simulating for deformation analysis of aircraft’s thin-walled sheet-metal parts. Chin. J. Aeronaut. 2011, 24, 369–377. [Google Scholar] [CrossRef] [Green Version]
  5. Aman, F.; Cheraghi, S.H.; Krishnan, K.K.; Lankarani, H. Study of the impact of riveting sequence, rivet pitch, and gap between sheets on the quality of riveted lap joints using finite element method. Int. J. Adv. Manuf. Technol. 2013, 67, 545–562. [Google Scholar] [CrossRef]
  6. Müller, R.P.G. An experimental and analytical investigation on the fatigue behaviour of fuselage riveted lap joints: The significance of the rivet squeeze force, and a comparison of 2024-T3 and Glare 3. Ph.D. Thesis, Delft University of Technology, Delft, The Netherlands, 1997. [Google Scholar]
  7. Silva, L.F.M.; Gonçalves, J.P.M.; Oliveira, F.M.F.; De Castro, P.M.S.T. Multiple-site damage in riveted lap-joints: Experimental simulation and finite element prediction. Int. J. Fatigue 2000, 22, 319–338. [Google Scholar] [CrossRef]
  8. Li, G.; Shi, G.; Bellinger, N.C. Studies of residual stress in single-row countersunk riveted lap joints. J. Aircr. 2006, 43, 592–599. [Google Scholar] [CrossRef]
  9. Riegert, G.; Pfleiderer, K.; Gerhard, H.; Solodov, I.; Busse, G. Modern Methods of NDT for Inspection of Aerospace Structures; ECNDT: Berlin, Germany, 2006. [Google Scholar]
  10. Schnars, U.; Henrich, R. Applications of NDT methods on composite structures in aerospace industry. In Proceedings of the Conference on Damage in Composite Materials, Stuttgart, Germany, 18–19 September 2006; pp. 1–8. [Google Scholar]
  11. Montalvao, D.; Maia, N.M.M.; Ribeiro, A.M.R. A review of vibration-based structural health monitoring with special emphasis on composite materials. Shock Vib. Dig. 2006, 38, 295–324. [Google Scholar] [CrossRef]
  12. Staszewski, W.J.; Mahzan, S.; Traynor, R. Health monitoring of aerospace composite structures—Active and passive approach. Compos. Sci. Technol. 2009, 69, 1678–1685. [Google Scholar] [CrossRef]
  13. Katnam, K.B.; Da Silva, L.F.M.; Young, T.M. Bonded repair of composite aircraft structures: A review of scientific challenges and opportunities. Prog. Aerosp. Sci. 2013, 61, 26–42. [Google Scholar] [CrossRef]
  14. Gholizadeh, S. A review of non-destructive testing methods of composite materials. Procedia Struct. Integr. 2016, 1, 50–57. [Google Scholar] [CrossRef] [Green Version]
  15. Riegert, G.; Zweschper, T.; Dillenz, A.; Busse, G. Inspection of rivets and cracks in metal using thermography methods. Quant. Infrared Thermogr. 2002, 6, 293–298. [Google Scholar] [CrossRef]
  16. Zweschper, T.; Wu, D.; Busse, G. Detection of loose rivets in aeroplane components using lockin thermography. In Proceedings of the QIRT, Lodz, Poland, 7–10 September 1998; Volume 98, pp. 161–166. [Google Scholar] [CrossRef]
  17. Zweschper, T.; Dillenz, A.; Busse, G. Ultrasound Lockin Thermography–a NDT Method for the Inspection of Aerospace Structures. In Proceedings of the Quantitative Infrared Thermography (QIRT), Champagne-Ardenne, France, 18–21 July 2000. [Google Scholar] [CrossRef]
  18. Vavilov, V. Thermal NDT: Historical milestones, state-of-the-art and trends. Quant. Infrared Thermogr. J. 2014, 11, 66–83. [Google Scholar] [CrossRef]
  19. Maldague, X.; Galmiche, F.; Ziadi, A. Advances in pulsed phase thermography. Infrared Phys. Technol. 2002, 43, 175–181. [Google Scholar] [CrossRef] [Green Version]
  20. Ghoni, R.; Dollah, M.; Sulaiman, A.; Ibrahim, F.M. Defect characterization based on eddy current technique: Technical review. Adv. Mech. Eng. 2014, 6, 182496. [Google Scholar] [CrossRef] [Green Version]
  21. Smith, R.A.; Edgar, D.; Skramstad, J.A. Advances in transient Eddy-current imaging for aerospace applications. In Proceedings of the WCNDT Conference, Montreal, QC, Canada, 30 August–3 September 2004. [Google Scholar]
  22. Underhill, P.R.; Krause, T.W. Eddy current analysis of mid-bore and corner cracks in bolt holes. NDT E Int. 2011, 44, 513–518. [Google Scholar] [CrossRef]
  23. Joubert, P.Y.; Vourc’H, E.; Thomas, V. Experimental validation of an eddy current probe dedicated to the multi-frequency imaging of bore holes. Sens. Actuators A Phys. 2012, 185, 132–138. [Google Scholar] [CrossRef] [Green Version]
  24. Babbar, V.K.; Underhill, P.R.; Stott, C.; Krause, T.W. Finite element modeling of second layer crack detection in aircraft bolt holes with ferrous fasteners present. NDT E Int. 2014, 65, 64–71. [Google Scholar] [CrossRef]
  25. Le Diraison, Y.; Joubert, P.Y.; Placko, D. Characterization of subsurface defects in aeronautical riveted lap-joints using multi-frequency eddy current imaging. NDT E Int. 2009, 42, 133–140. [Google Scholar] [CrossRef]
  26. Lingvall, F.; Stepinski, T. Automatic detecting and classifying defects during eddy current inspection of riveted lap-joints. NDT E Int. 2000, 33, 47–55. [Google Scholar] [CrossRef]
  27. Deng, Y.; Liu, X.; Fan, Y.; Zeng, Z.; Udpa, L.; Shih, W. Characterization of magneto-optic imaging data for aircraft inspection. IEEE Trans. Magn. 2006, 42, 3228–3230. [Google Scholar] [CrossRef]
  28. Fan, Y.; Deng, Y.; Zeng, Z.; Udpa, L.; Shih, W.; Fitzpatrick, G. Aging aircraft rivet site inspection using magneto–optic imaging: Automation and real-time image processing. In Proceedings of the 9th Joint FAA/DoD/NASA Aging Aircraft Conference, Atalanta, GA, USA, 6–9 March 2006. [Google Scholar]
  29. Deng, Y.; Zeng, Z.; Tamburrino, A.; Udpa, L.; Shih, W. Automatic classification of magneto-optic image data for aircraft rivet inspection. Int. J. Appl. Electromagn. Mech. 2007, 25, 375–382. [Google Scholar] [CrossRef]
  30. Rothberg, S.J.; Allen, M.S.; Castellini, P.; Di Maio, D.; Dirckx, J.J.J.; Ewins, D.J.; Halkon, B.J.; Muyshondt, P.; Paone, N.; Ryan, T.; et al. An international review of laser Doppler vibrometry: Making light work of vibration measurement. Opt. Lasers Eng. 2017, 99, 11–22. [Google Scholar] [CrossRef] [Green Version]
  31. Solodov, I.; Rahammer, M.; Derusova, D.; Busse, G. Highly-efficient and noncontact vibro-thermography via local defect resonance. Quant. Infrared Thermogr. J. 2015, 12, 98–111. [Google Scholar] [CrossRef]
  32. Rembe, C.; Dräbenstedt, A. Laser-scanning confocal vibrometer microscope: Theory and experiments. Rev. Sci. Instrum. 2006, 77, 083702. [Google Scholar] [CrossRef]
  33. Mendioroz, A.; Celorrio, R.; Salazar, A. Ultrasound excited thermography: An efficient tool for the characterization of vertical cracks. Meas. Sci. Technol. 2017, 28, 112001. [Google Scholar] [CrossRef]
  34. Gleiter, A.; Riegert, G.; Zweschper, T.; Busse, G. Ultrasound lock-in thermography for advanced depth resolved defect selective imaging. Insight Non Test. Cond. Monit. 2007, 49, 272. [Google Scholar] [CrossRef] [Green Version]
  35. Pech-May, N.W.; Oleaga, A.; Mendioroz, A.; Omella, A.J.; Celorrio, R.; Salazar, A. Vertical cracks characterization using lock–in thermography: I infinite cracks. Meas. Sci. Technol. 2014, 25, 115601. [Google Scholar] [CrossRef]
  36. Celorrio, R.; Omella, A.J.; Pech-May, N.W.; Oleaga, A.; Mendioroz, A.; Salazar, A. Vertical cracks characterization using lock–in thermography: II finite cracks. Meas. Sci. Technol. 2014, 25, 115602. [Google Scholar] [CrossRef]
  37. Busse, G. Nondestructive evaluation of polymer materials. NDT E Int. 1994, 27, 253–262. [Google Scholar] [CrossRef]
  38. Mabrouki, F.; Thomas, M.; Genest, M.; Fahr, A. Frictional heating model for efficient use of vibrothermography. NDT E Int. 2009, 42, 345–352. [Google Scholar] [CrossRef]
  39. IRCameras. IRC906STS Datasheet; IRCameras, LLC: Santa Barbara, CA, USA, 2020. [Google Scholar]
  40. Stamm, M.; Schlemme-Weber, S.; Appl, S.; Köser, J.; Pfeiffer, H. Fast loose rivet detection by using scanning laser doppler vibrometry. In Proceedings of the ISMA2020 and USD2020 —29th International Conference on Noise and Vibration Engineering, Leuven, Belgium, 7–9 September 2020; pp. 2843–2854. [Google Scholar]
  41. Solodov, I.; Bai, J.; Bekgulyan, S.; Busse, G. A local defect resonance to enhance acoustic wave-defect interaction in ultrasonic nondestructive evaluation. Appl. Phys. Lett. 2011, 99, 211911. [Google Scholar] [CrossRef]
Figure 1. One frame from a thermal video showing a rivet in a surrounding plate. In (a), the unfiltered data are shown, in (b) the data after applying a two-dimensional median filter (three pixel window size) and (c,d) show the gradient in x and y direction respectively. Image (e) shows the final result and the edge of the loose rivet.
Applsci 11 00132 g001
Figure 2. A sketch of the three different measurement setups. The setup of the Ultrasound Lock–In Thermography (ULT) (a), the setup of the In-plane Heatwave Thermography (IPHWT) (b) and the setup of the Scanning Laser Doppler Vibrometer (SLDV) measurements (c).
Applsci 11 00132 g002
Figure 3. The two areas of a fuselage panel from an AIRBUS A320 aircraft with modified rivets which are inspected in this study.
Applsci 11 00132 g003
Figure 4. A sketch of the cross section of area I and II.
Applsci 11 00132 g004
Figure 5. The measurement of area I (rotated by 90 ) with the IPHWT results in two images based on the covariance analysis (a) and local gradient method (b). Combining both methods results in an image in which green corresponds to the covariance analysis and red corresponds to the local gradient method (c). Additionally, the identified heating area is indicated in black at the top left region.
Applsci 11 00132 g005
Figure 6. IPHWT of area II with the resulting covariance analysis (a) and local gradient method (b). In (c), both outputs are composed and green corresponds to the covariance analysis and red to the local gradient method. Additionally, the identified heating area is indicated in black at the top right region.
Applsci 11 00132 g006
Figure 7. The coherence analysis (a) and band pass filtered and normalized RMS for different frequencies for area II (bf) of the fuselage panel. The color bar at the bottom refers only to (f) as it is adapted for each filter according to the description above.
Applsci 11 00132 g007
Figure 8. The band pass filtered and normalized RMS heat map for different frequencies (ad) for area I of the fuselage panel. The color bar at the bottom refers only to (d) as it is adapted for each filter according to the description above.
Applsci 11 00132 g008
Figure 9. The amplitude (a) and phase image (b) of area I for a frequency range of 20 k Hz to 30 k Hz and a periodicity of τ = 5   s . The dark spot in both images corresponds to the damaged rivet.
Applsci 11 00132 g009
Figure 10. The amplitude (a) and phase image (b) of area II for a frequency range of 110 k Hz to 120 k Hz and a periodicity of τ = 5   s . The dark spot in both images corresponds to the screw with the loose nut.
Applsci 11 00132 g010
Figure 11. Different vibration modes of the middle left rivet (area I) for the fundamental frequency (a) 25(1) kHz and higher harmonics (bf) 51 kHz, 76 kHz, 89 kHz, 125 kHz and 169 kHz. Additional vibration patterns are shown in Reference [40].
Applsci 11 00132 g011
Table 1. This table summarizes the key aspects for each individual inspection technique as well as the respective detection clarity and cost in time and money. * As described before, IPHWT detects intact and damaged rivets but does not enable the distinction between the two.
Detect FastenersDetectionCosts
MethodIntactDamagedLooseClarityTimeMoney
SLDVyesyesyesgoodslowhigh
ULTnoyesnopoormediummedium
IPHWTyes * yes * yesmediumfastmedium
Publisher’s Note: MDPI stays neutral with regard to jurisdictional claims in published maps and institutional affiliations.

