Article

Computational Method to Optimize Design of Gripping Part of Products via Grasping Motion Simulation to Maximize Gripping Comfort

1
Graduate School of Science and Technology, Niigata University, 8050 Ikarashi 2-no-cho, Nishi-ku, Niigata-shi, Niigata 950-2181, Japan
2
Department of Mechanical Engineering, College of Engineering, Nihon University, 1 Nakagawara, Tokusada, Tamuramachi, Koriyama-shi, Fukushima 963-8642, Japan
3
Product Analysis Center, Panasonic Corporation, 1048 Kadoma, Kadoma-shi, Osaka 571-8686, Japan
*
Author to whom correspondence should be addressed.
Appl. Sci. 2020, 10(9), 3265; https://doi.org/10.3390/app10093265
Submission received: 19 April 2020 / Revised: 2 May 2020 / Accepted: 4 May 2020 / Published: 8 May 2020
(This article belongs to the Special Issue Applied Biomechanics in Sport, Rehabilitation and Ergonomy)

Abstract

:
In this study, a grasping motion simulation method based on finite element analysis was developed for the virtual evaluation of gripping comfort while gripping a cylindrical object. The validity of the grasping motion simulation was verified by comparing the contact pressure distribution generated on the palm of a hand using a finite element model with the measured result obtained via experiments on a human subject. The mean absolute difference between the simulation and experimental results at 23 regions was 7.4 kPa, which was considered to be significantly low and an acceptable value for use in assessment of the gripping comfort score. Furthermore, topology optimization was introduced into the simulation to propose an easy method for obtaining a rough shape of the gripping part of a product that is comfortable to grip. An objective function during the optimization process was defined to minimize the contact pressure concentration level, and this was observed to have a negative correlation with the gripping comfort. The optimization result indicated low element density at the parts in contact with the tips of the index and middle fingers as well as high element density at the parts in contact with the proximal part of the palm. The method allows a designer to evaluate the gripping comfort of a product during the design process and aids in developing a shape that can provide better gripping comfort. Additionally, the method can also be used to reevaluate the gripping comfort of existing products.

1. Introduction

Kansei engineering [1] is an engineering method that considers the user’s psychological feelings or needs. The development of a manufactured product based on this method is required to promote purchase intention by influencing users’ emotional responses to the product. A product should be easy and comfortable to use to impress a user. Gripping comfort includes factors such as “good fit in hand” and “how comfortable the handle feels” [2] and is a crucial Kansei engineering value of manufactured products that is considered for products involving gripping in the hand (e.g., hair dryers, shavers, irons, or telephones). It is expected that improving the gripping comfort of the products can increase the value of the products and also stimulate user interest.
Currently, when designing the gripping part of a product, the comfort evaluation is commonly conducted using human subjects in an experiment by using real-sized physical models (mockups). Based on the evaluation result, the designer then modifies the shape of the gripping part to obtain better gripping comfort. Subsequently, human subject evaluation is performed again using modified mockups. After the process is repeated several times, a shape that is expected to exhibit optimal gripping comfort is finally selected as the final shape of the gripping part of the product. However, the method typically involves significant time and high cost in terms of creating mockups and performing multiple human subject experiments. Furthermore, it is difficult to select an optimal shape based on engineering knowledge because the evaluation result is subjective, qualitative, and susceptible to the conditions of the human subjects and surrounding environments during evaluation. Therefore, an evaluation based on physical parameters, such as contact pressure, is considered to provide more coherent results and decrease costs.
Some physical parameters (e.g., contact pressure and force) were utilized to predict gripping comfort. Kuijt-Evers et al. [3] investigated the relationships between the subjective comfort feeling and objective measurement results such as electromyography (EMG) signals and contact pressure during gripping of a saw. Lin and McGorry [4] observed that the normalized grip force is a significant factor that can be used to predict gripping discomfort when using a pneumatic nutrunner. Furthermore, Kong et al. [5] conducted a linear regression analysis to estimate gripping comfort from the measured gripping exertion force. We also proposed regression equations to predict gripping comfort from the contact pressure distribution on a palm or from finger joint angles while gripping an object in our previous study [6]. Therefore, by using a statistical method such as regression analysis, it is possible to estimate the gripping comfort if physical parameters generated during gripping (e.g., contact pressure) can be obtained.
Conversely, a numerical simulation method including finite element analysis (FEA) is widely utilized in the structural design of a manufactured product due to significant improvements in the performance of computers. By using FEA, it is possible to perform a virtual experiment in a shorter time, and this allows us to obtain results from many simulations considering the effects of many parameters, e.g., geometry, material characteristics, and applied load [7,8,9]. Therefore, the establishment of a grasping motion simulation method using a digital human-hand model (hand finite element model) allows us to simulate the grasping motion against various objects on a computer and quantitatively evaluate the gripping comfort based on physical parameters such as contact pressure. Furthermore, this will aid a designer in designing a product that is comfortable to grasp and reduce time and cost during the design process. Several studies on the development of a digital hand model and a grasping motion simulation are conducted to understand the human grasping behavior and to support the design of a product [10,11,12,13,14]. We also developed a finite element model of a hand and a grasping simulation method, and we investigated the effect of several parameters on the contact pressure distribution during gripping as recorded in a previous study [9]. However, the aforementioned studies did not establish a new method to quantitatively evaluate the gripping comfort based on physical parameters using grasping motion simulations and digital hand models.
Studies on tool handle design considering gripping comfort are also performed to design an optimal shape based on geometric parameters of a human hand. Sancho-Bru et al. [15] investigated the optimal tool diameter using a biomechanical model of a human hand. Eksioglu [16] proposed a criterion based on modified thumb crotch length (TCLm) to design hand-powered tools that provide comfort, safety, and high efficiency for the users. Garneau and Parkinson [17] reported a methodology to optimize the shape of a tool handle using hand anthropometry. Harih and Dolšak [18] offered a design method to develop tool handles using a digital human-hand model. Although several studies examined optimizing the shape of the gripping part (handle), to the best of the authors’ knowledge, there is a paucity of studies on an automatic method to obtain the optimal design of gripping part based on an evaluation using physical parameters. Development of a design method for the gripping part by using a grasping motion simulation and digital hand model can support manufacturers in designing a product that exhibits better gripping comfort under various gripping conditions.
Therefore, in the study, we developed a grasping motion simulation using a hand finite element model [9] to reproduce a typical grasping motion of a human volunteer obtained from an experiment [6] to evaluate the gripping comfort during grasping of a cylindrical object. The simulation method was validated by comparing the contact pressure distribution in the simulation result and experimental result to understand the capability of the method to quantitatively assess the gripping comfort based on the contact pressure. Additionally, we also introduced a topology optimization method into the simulation to propose a procedure to obtain a rough shape of gripping part that is expected to exhibit better gripping comfort.

2. Materials and Methods

2.1. Establishment of Grasping Motion Simulation

2.1.1. Construction of Finite Element Model

The outer surfaces of skin and bones of human hand (right hand) were obtained from the human model database of a computer graphics software Poser 9 (Smith Micro Software Inc., Aliso Viejo, CA, USA). The joint angles of the hand model were adjusted to obtain an initial posture during grasping as shown in Figure 1. The outer surface data in OBJ file format were then checked via a computer-aided design software Rhinoceros (Robert McNeel & Associates, Seattle, WA, USA) and were converted into a polygon model data in STL file format.
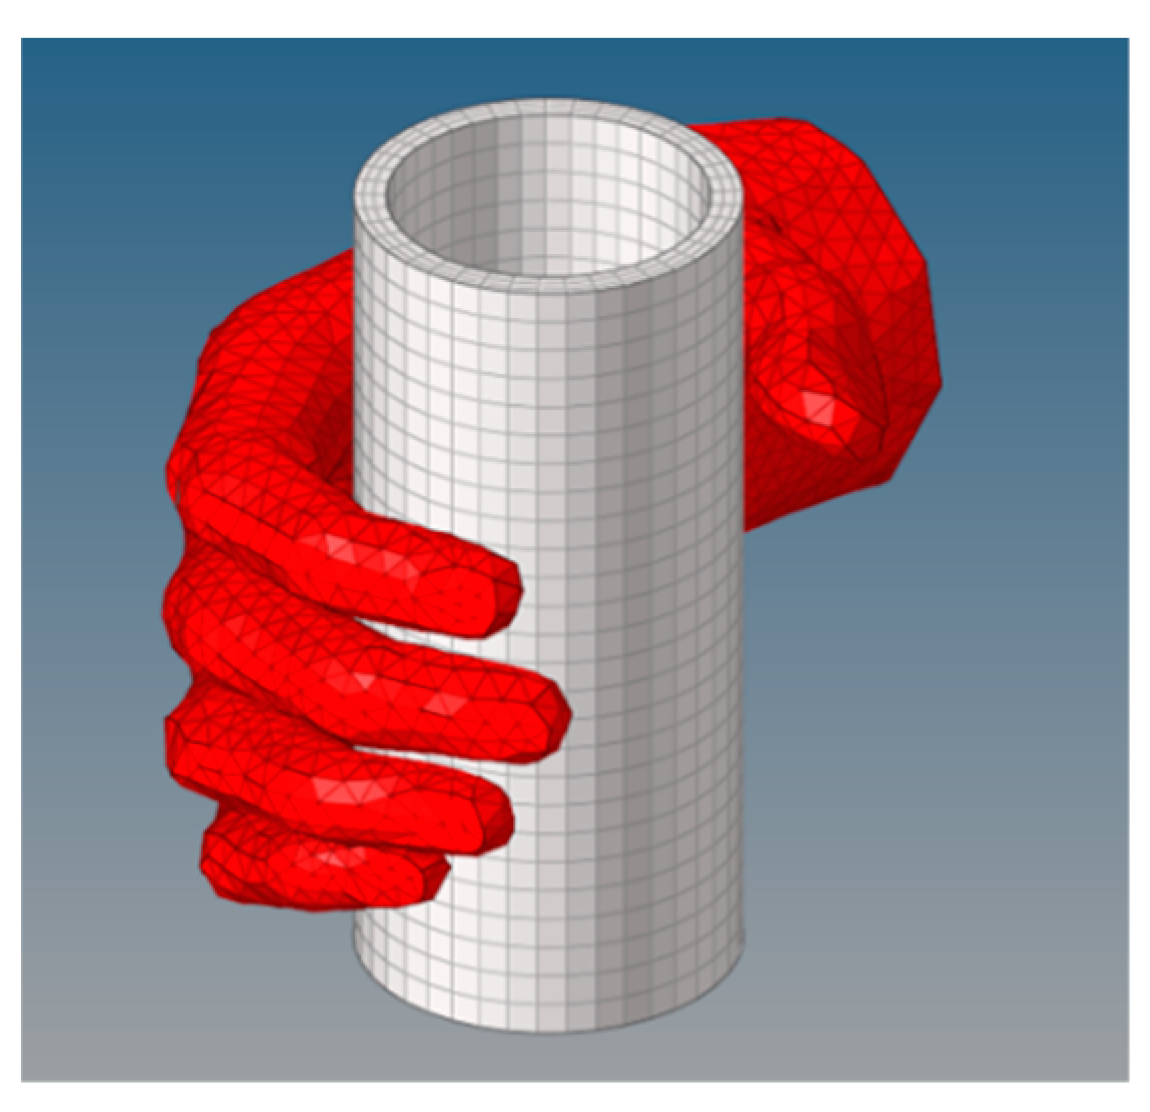
The model data was then imported into a finite element modeling software HyperMesh (Altair Engineering Inc., Troy, MI, USA). A joint cover consisted of triangular shell elements that were constructed to surround apertures between two adjacent bones. The measure was performed to avoid errors due to excessive deformations of subcutaneous soft tissue (fat layer) pinched by the bones. The bones and subcutaneous soft tissue were meshed using tetrahedron solid elements. Nodes on the boundary between bones and subcutaneous soft tissue were shared. Furthermore, a skin model was constructed on the outer surface of the hand model using triangular shell elements. Human finger skin consists of epidermis and dermis. Thus, the skin model was constructed as a one-layer model because the effect of thin epidermis and dermis was considered to be insignificant. The thickness of the skin model corresponded to 1.75 mm as derived from the total thickness of epidermis and dermis [19]. Figure 2 shows the hand finite element (FE) model. The number of elements and nodes for each component are listed in Table 1. Additionally, in the study, bones, subcutaneous soft tissue, and skin were modeled as uniform isotropic materials. Cartilages and ligaments were not modeled in the hand FE model and their role was substituted by rotational joints connecting all adjacent finger bones. Furthermore, since our interest was in the palmar contact pressure and not in the internal response of hand, we considered that cartilages and ligaments could be omitted.
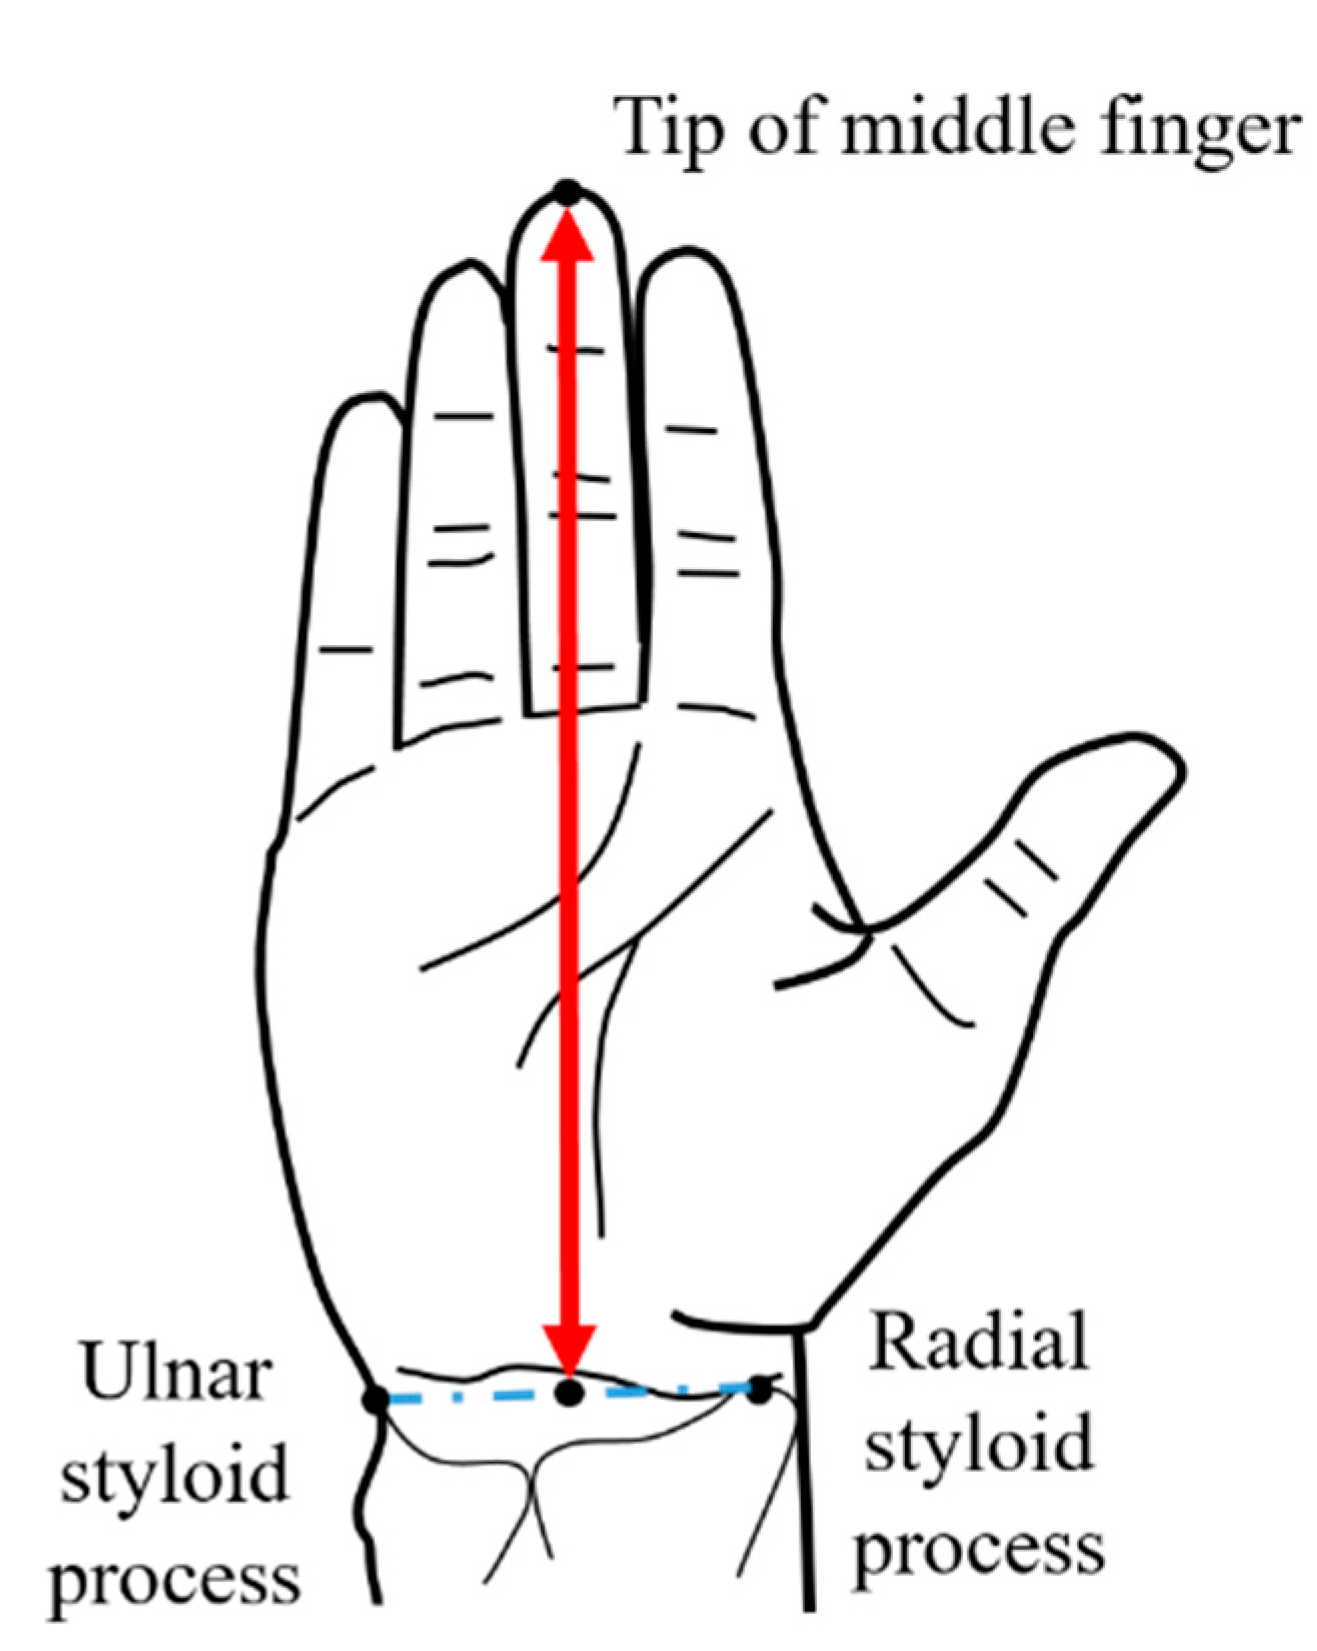
The hand and phalanges lengths of the hand FE model were scaled to those of the subject who participated in the previous experiment [6] to appropriately reproduce the hand shape of the subject. Thus, the hand length (L01) based on the AIST Japanese hand dimensions database [20] of the subject-specific FE model, as shown in Figure 3, exhibits a good agreement with the hand length of the subject (L01 = 202.4 mm). Additionally, the phalanges lengths of the subject-specific FE model almost coincided with the phalange lengths of the subject that were measured from the positions of markers attached on the subject’s joints in the experiment.
A cylinder with a diameter of 60 mm and height of 131 mm was a test object used in the experiment [6] and was selected as a basic grasping object in the study because the typical shape of the gripping part of a product corresponds to a cylinder. Furthermore, the shape was investigated in previous studies [13,21,22,23]. The cylinder FE model exhibits the same dimensions as those of the cylinder used in the experiment and was constructed using hexahedron solid elements as shown in Figure 2. The number of elements and nodes for the cylinder FE model are listed in Table 1.

2.1.2. Material Properties

Material properties were defined via FEA software Radioss (Altair Engineering Inc., Troy, MI, USA). The material properties of each component were based on extant studies [19,24,25] as shown in Table 2. The material of the cylinder FE model was defined as Acrylonitrile Butadiene Styrene resin and was the same as that of the cylinder used in the experiment. The material properties of the skin and cylinder showed linearly elastic behavior. Bones were defined as a rigid body since the deformation can be neglected and have low computational cost. Moreover, the rigid bones allowed more accurate finger motions because they were used in the construction of local coordinate systems that were utilized for modelling the finger joint characteristics and applying joint torques to the joints, as will be described in Section 2.1.3.
Furthermore, Ogden hyperelastic material model was utilized for the subcutaneous soft tissue. The Ogden hyperelastic material model was expected to adequately simulate the deformation behavior of subcutaneous soft tissue. This material model exhibited a good record in the FE simulation of the deformation of soft tissue, as shown in previous studies [8,26]. Based on the expression of the strain energy density W, the Ogden hyperelastic material model is formulated in Equation (1) in Radioss as follows:
W ( λ 1 , λ 2 , λ 3 ) = p μ p α p ( λ 1 ¯ α p + λ 2 ¯ α p + λ 3 ¯ α p 3 ) + K 2 ( J 1 ) 2
λ i = 1 + ε i
J = λ 1 · λ 2 · λ 3
λ i ¯ = J 1 3 λ i
where λi denotes the ith principal stretch (Equation (2)); εi denotes the ith principal engineering strain, J denotes the relative volume (Equation (3)); and λ i ¯ denotes the deviatoric stretch (Equation (4)). Specifically, K denotes the bulk modulus related to Poisson’s ratio ν and is expressed in Equation (5) as follows:
K = μ · 2 ( 1 + ν ) 3 ( 1 2 ν )
where, the shear modulus μ is calculated by using material parameters μp, αp (Equation (6)).
μ = p μ p · α p 2
The material parameters for subcutaneous soft tissue are identified from the result of compression test using porcine fat tissue [26] as listed in Table 3. The appropriate number of parameters was determined via a parametric study. In the study, p = 4 was considered as the appropriate number of parameters that optimally fitted the result of the compression test.
The contact between the skin and the cylinder was defined as surface-to-surface contact using the penalty method with a friction coefficient of 0.3 [27,28,29]. In addition, nodes at the boundary between the bones and the subcutaneous soft tissue as well as nodes at the boundary between the subcutaneous soft tissue and the skin were shared between the two parts.

2.1.3. Finger Joints

As shown in Figure 4, local coordinate systems are constructed at a total of 19 locations between two adjacent bones in the hand FE model to model the finger joint characteristics. First, two sets of three nodes that were used to construct the origin, x-axis, and xy-plane of the local coordinate systems were created at the same location between two adjacent bones. The node sets were used, and two local coordinate systems were constructed in each joint at once. Subsequently, spring elements were created by connecting origins of the two local coordinate systems. Finally, the node sets were incorporated into the rigid body of the two adjacent bones, respectively. The joints allowed rotational motion around each axis and prevented excessive separations between the two adjacent bones during the simulation.

2.1.4. Calculation of Joint Torques

In the study, the grasping motion was reproduced by inputting joint torque to the joints of the hand FE model. We assumed that a static condition exists at the final gripping posture (which corresponds to a last hand posture without any finger motion). Thus, the joint torque Ti (kN·mm) is estimated via an equilibrium equation as shown in the Equation (7) by using the palm contact pressure data obtained from the experiment [6].
T i = P j · A j · x j
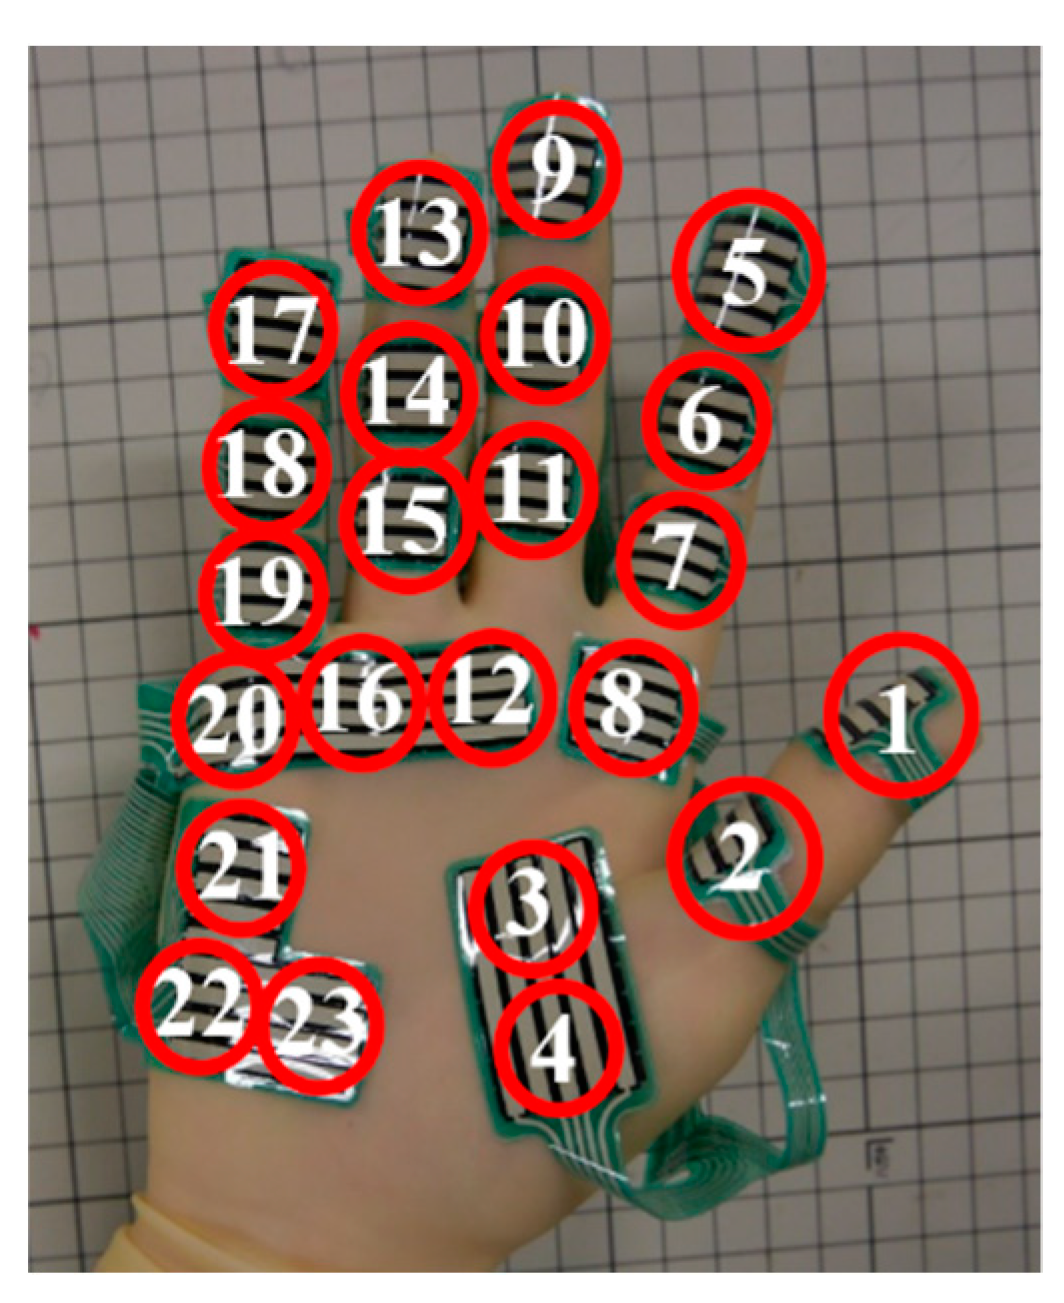
where Pj (kPa) denotes the sum of the contact pressure value obtained from the experiment on j; Aj (mm2) denotes the contact area of j; xj (mm) denotes the moment arm from proximal joint to j (assuming that the normal force associated with contact was generated at the middle of phalanx); i is a joint of 19 joints; and j denotes the region number, as shown in Figure 5. For example, the torque input to IP1 joint was calculated by using the sum of the contact pressure value on region 1, contact area of region 1, and the half-length of the distal phalanx of the thumb. The calculated joint torque is then input into the joint model using a function, as shown in Equation (8).
T i ( t ) = T i · t 5 20 5 + t 5
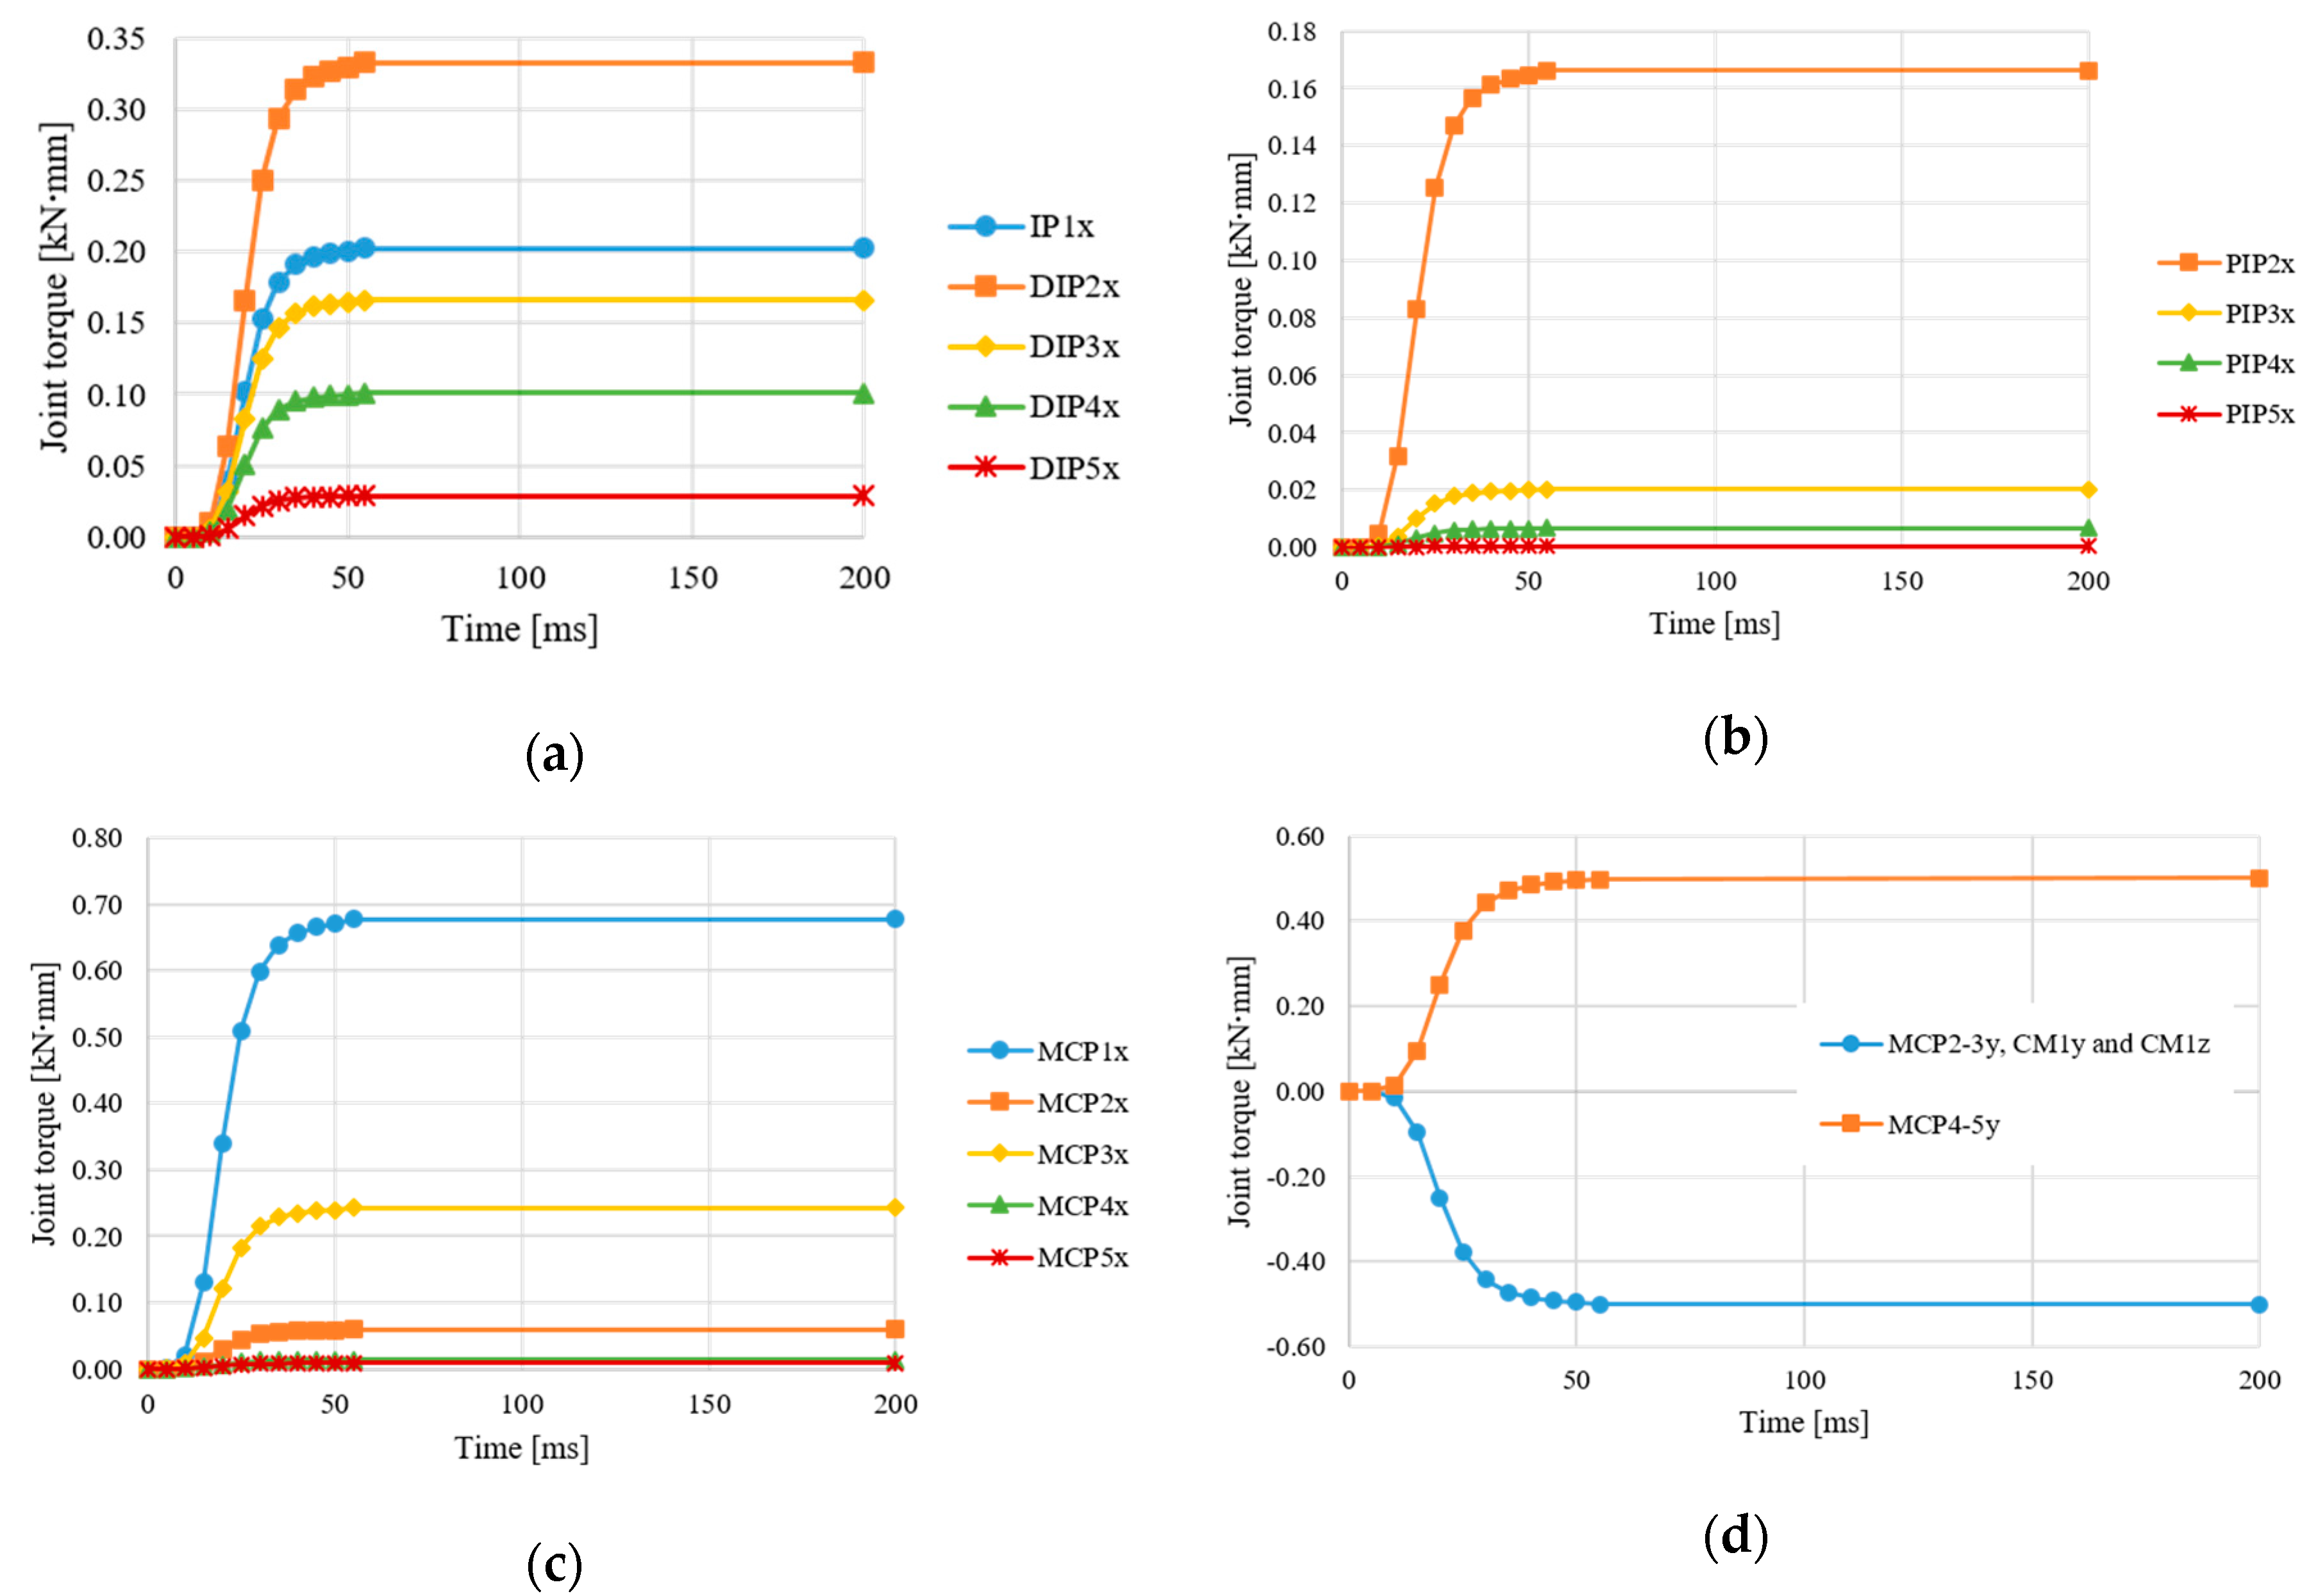
where t (ms) denotes the time duration. The joint torque reaches the calculated value at 55 ms and then became constant after 55 ms toward 200 ms. The behavior of the joint torque is shown in Figure 6. It is noted that the joint torques of MCP2y to MCP5y, CM1y and CM1z joints were determined via the parametric study because it was impossible to estimate the magnitude. Furthermore, the contact pressure data of the regions 8, 12, 16, and 20 to 23 were not utilized because moment arms from the proximal joints to the aforementioned regions were not measured in the experiment.

2.2. Validation of the Grasping Motion Simulation

2.2.1. Evaluation Method

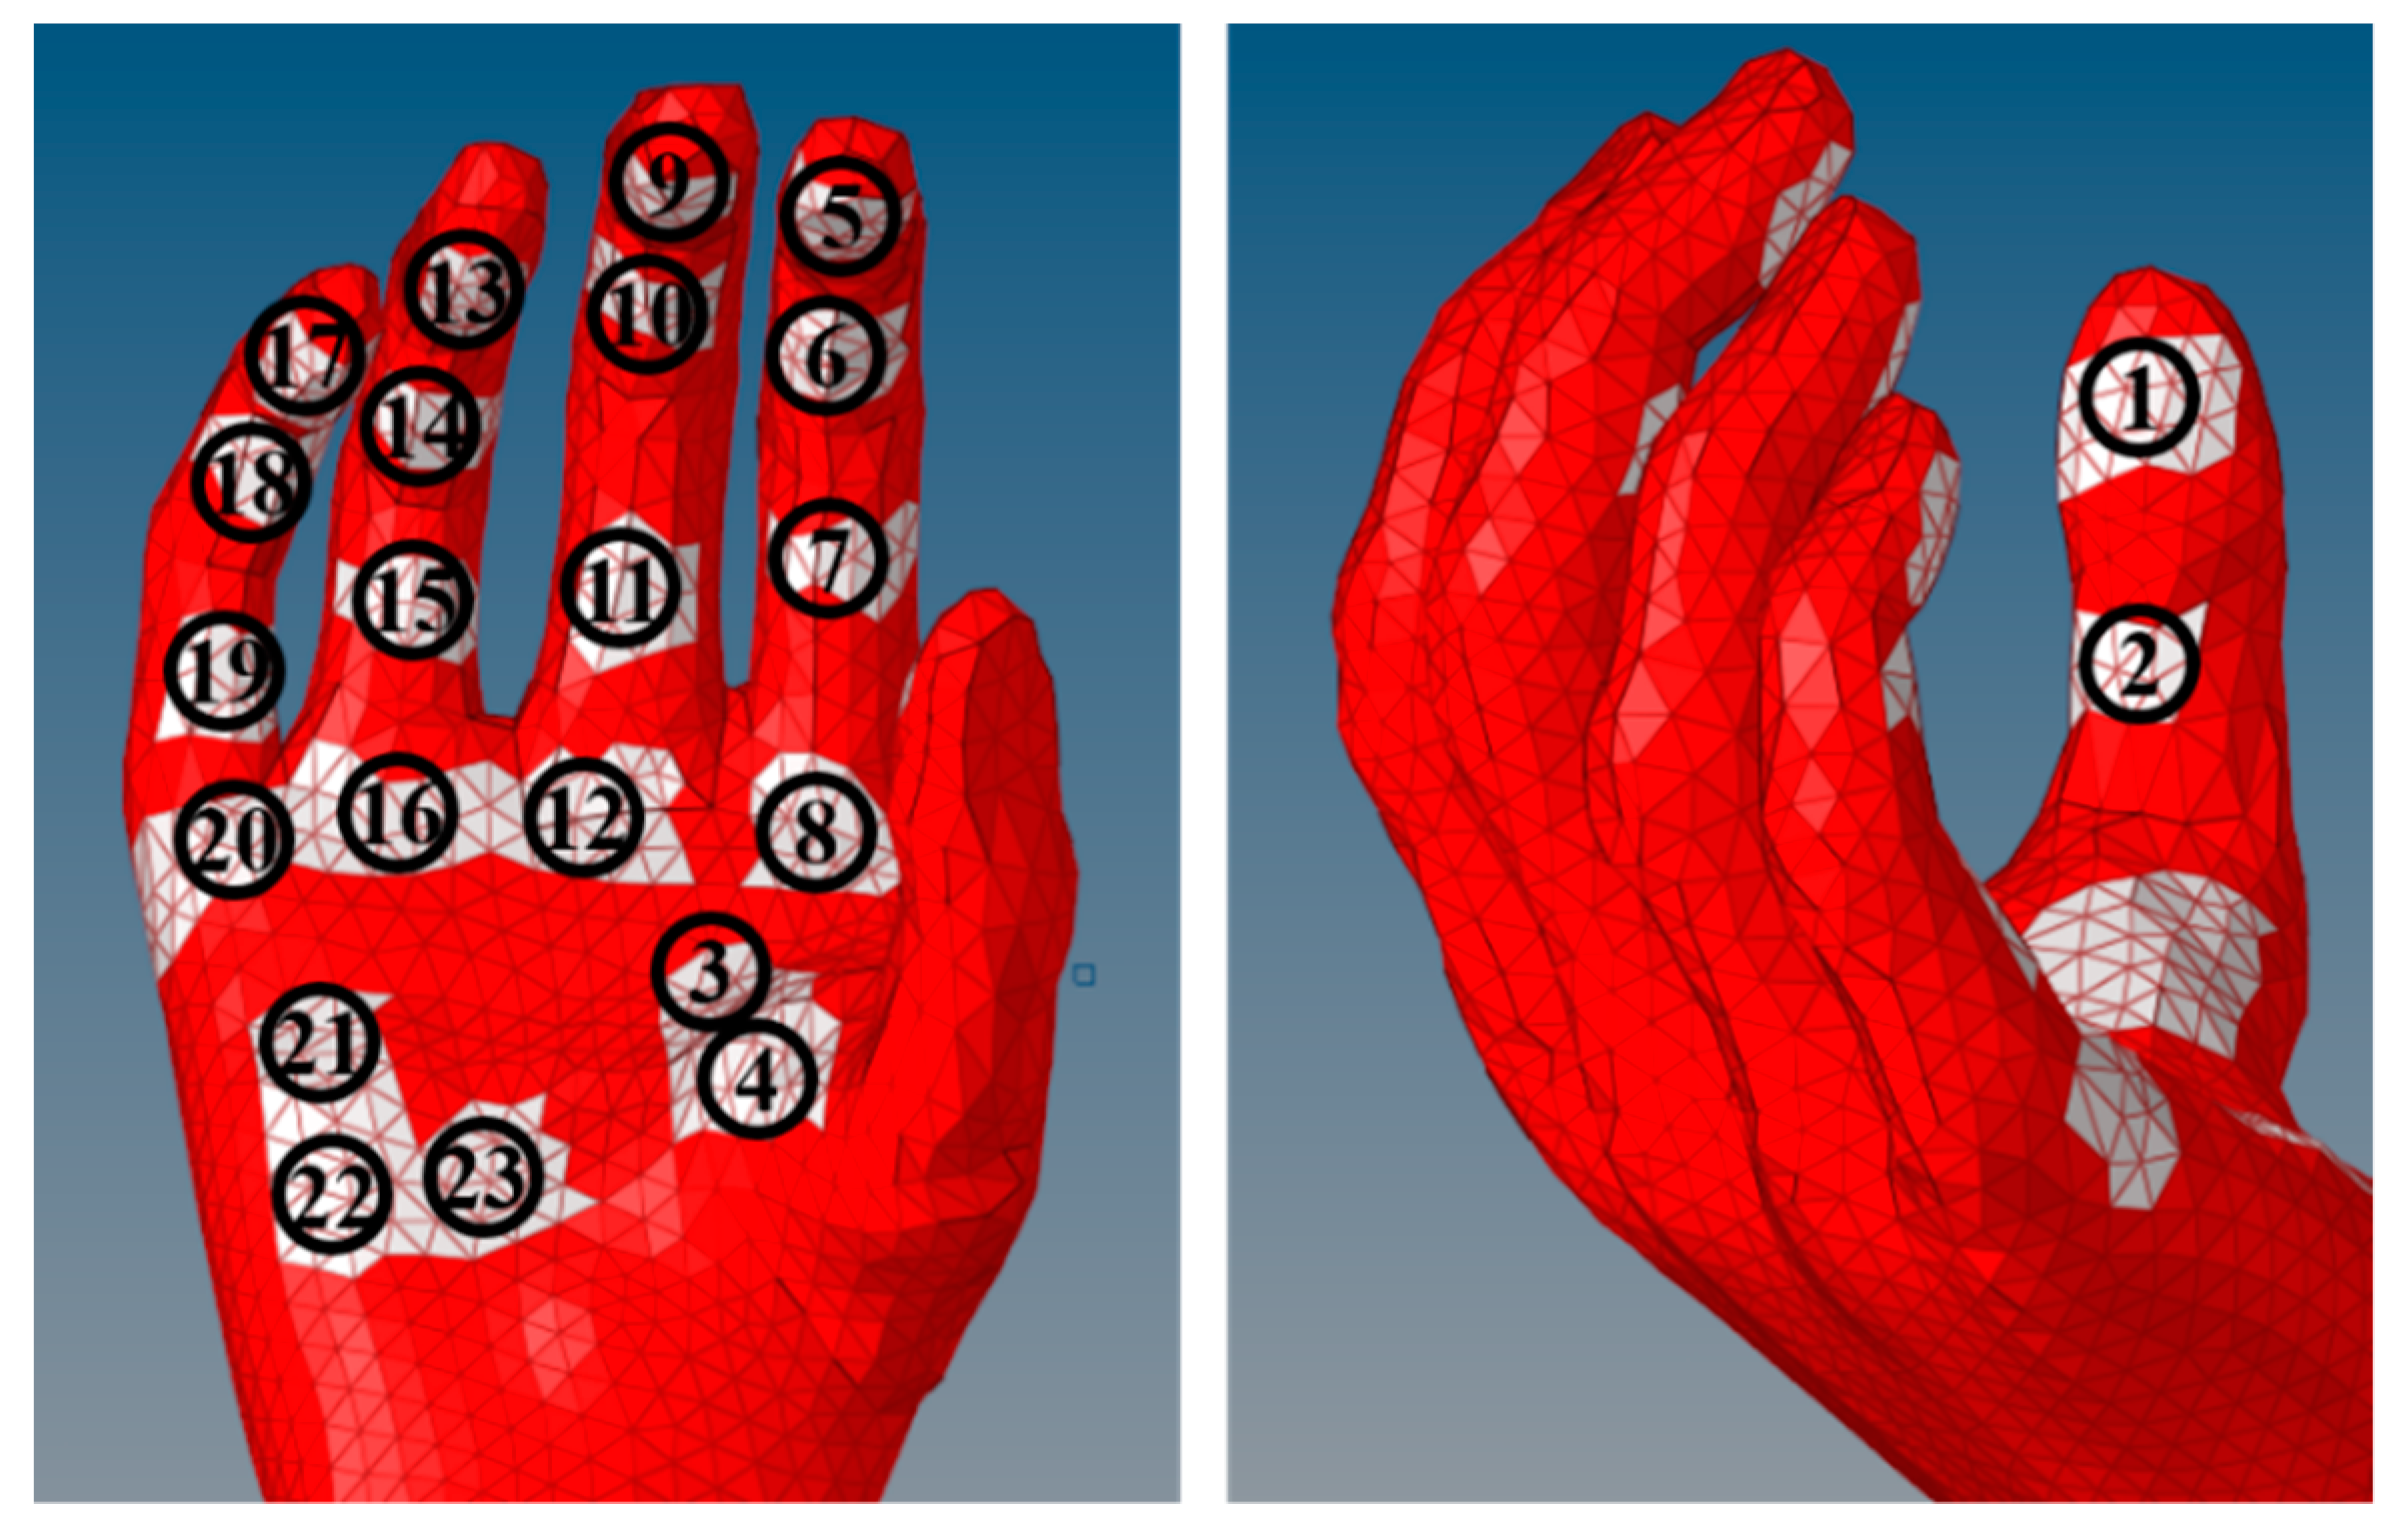
Validity of the grasping motion simulation was quantitatively evaluated by comparing the contact pressure distribution between the FE simulation result and the experimental result obtained from our previous study [6]. In the experiment, the contact pressures of 23 regions were measured as shown in Figure 5. Therefore, it was necessary to select regions on the palm of the hand FE model that is equivalent to the regions on the pressure sensor sheet (Grip System, Tekscan, Inc., Boston, MA, USA) to perform region-to-region comparison. Some elements were selected and grouped into a region in the hand FE model; thus, the selected region exhibited an area that was almost equal to the area of the corresponding region on the pressure sensor sheet. The location of the selected elements in the hand FE model was determined by visually comparing it to the picture of a volunteer’s hand with a pressure sensor sheet attached, as shown in Figure 5. The selected elements and regions are shown in Figure 7.

2.2.2. Evaluation Result of the Grasping Motion Simulation

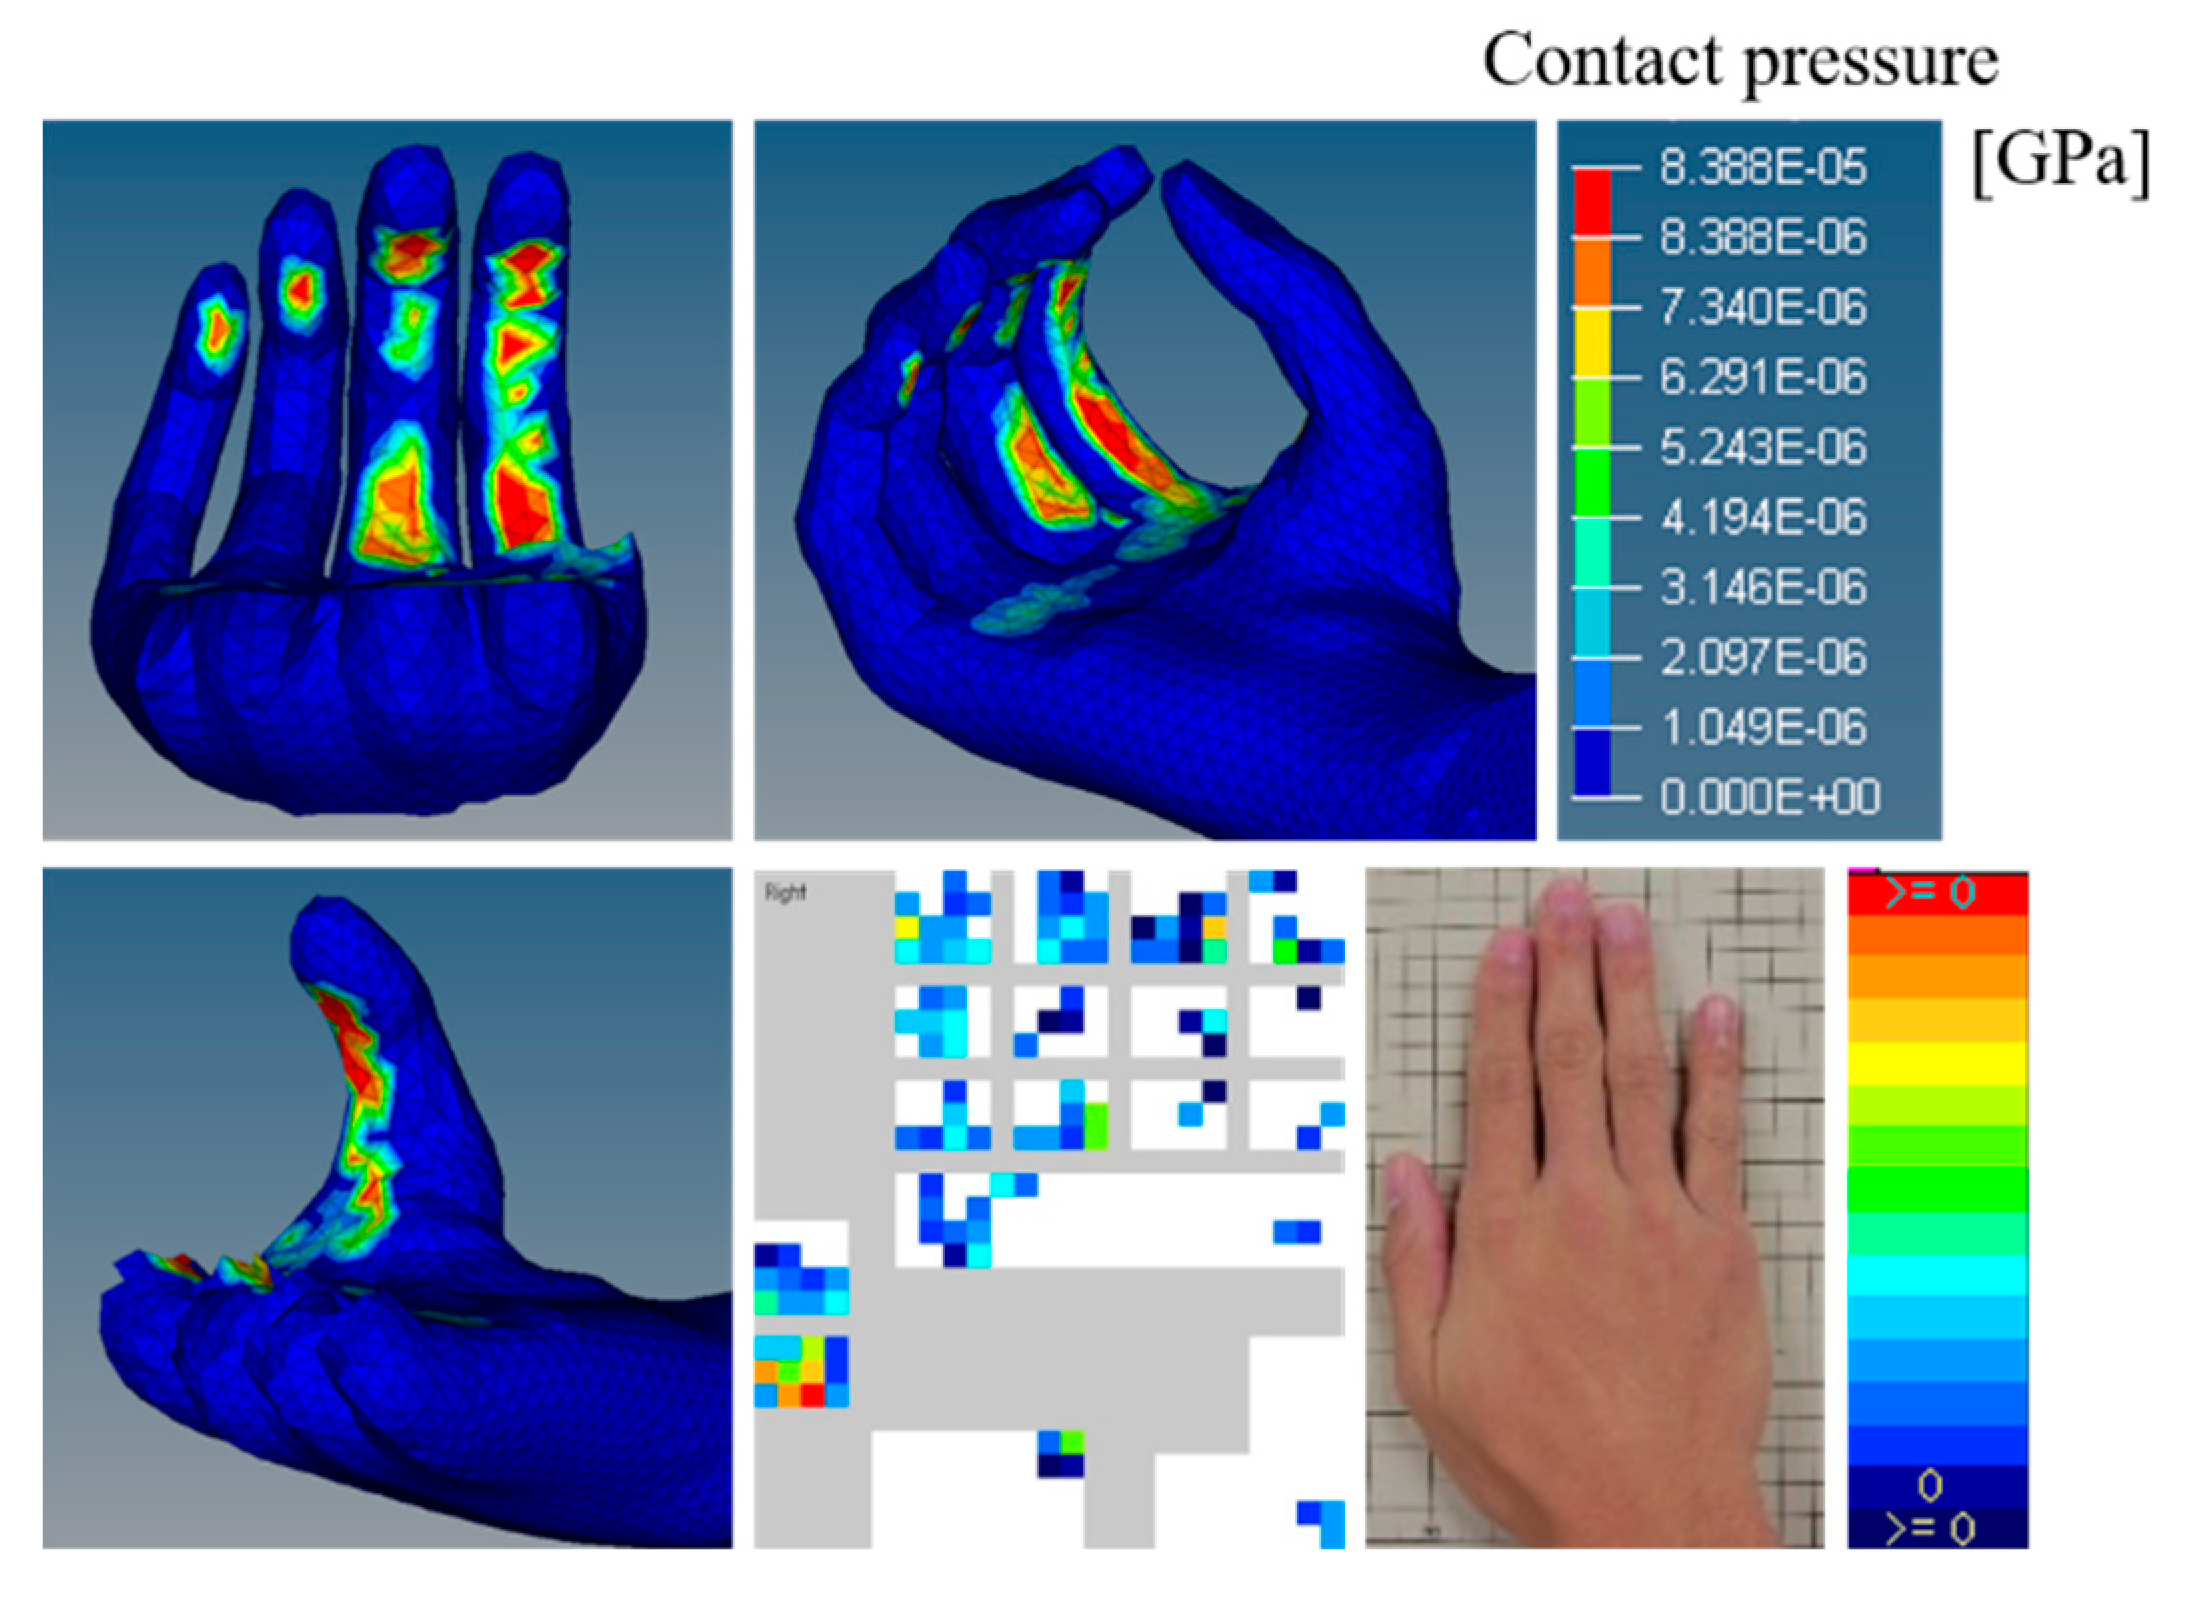
A comparison of the simulation result and experimental result is shown in Figure 8 and Figure 9. A comparison between the final gripping posture and the hand posture in the experiment indicated a significant similarity. Specifically, the postures of the thumb, index finger, and middle finger in the simulation were almost identical to those in the experiment. Conversely, a difference between the simulation result and experimental result corresponded to the posture of the ring finger. In the experiment, the fingertip of the ring finger was approximately in the same position as the fingertip of the middle finger. However, in the simulation, the fingertip of the ring finger was slightly separated from the fingertip of the middle finger.
As shown in the comparison of the contact pressure distribution, the contact pressure at region 2 (which corresponded to the highest pressure in the experiment) was accurately generated in the simulation. Additionally, the contact pressure distribution at the thumb, index finger, middle finger, and fingertip of the ring finger and little finger was also accurately generated in the simulation. Conversely, a difference between the simulation result and experiment result corresponded to the contact pressure distribution at the proximal part of the ring finger and little finger. In the experiment, low contact pressure was produced at the proximal part of the ring finger and little finger. However, in the simulation, contact pressure did not occur at the proximal part of the ring finger and little finger.
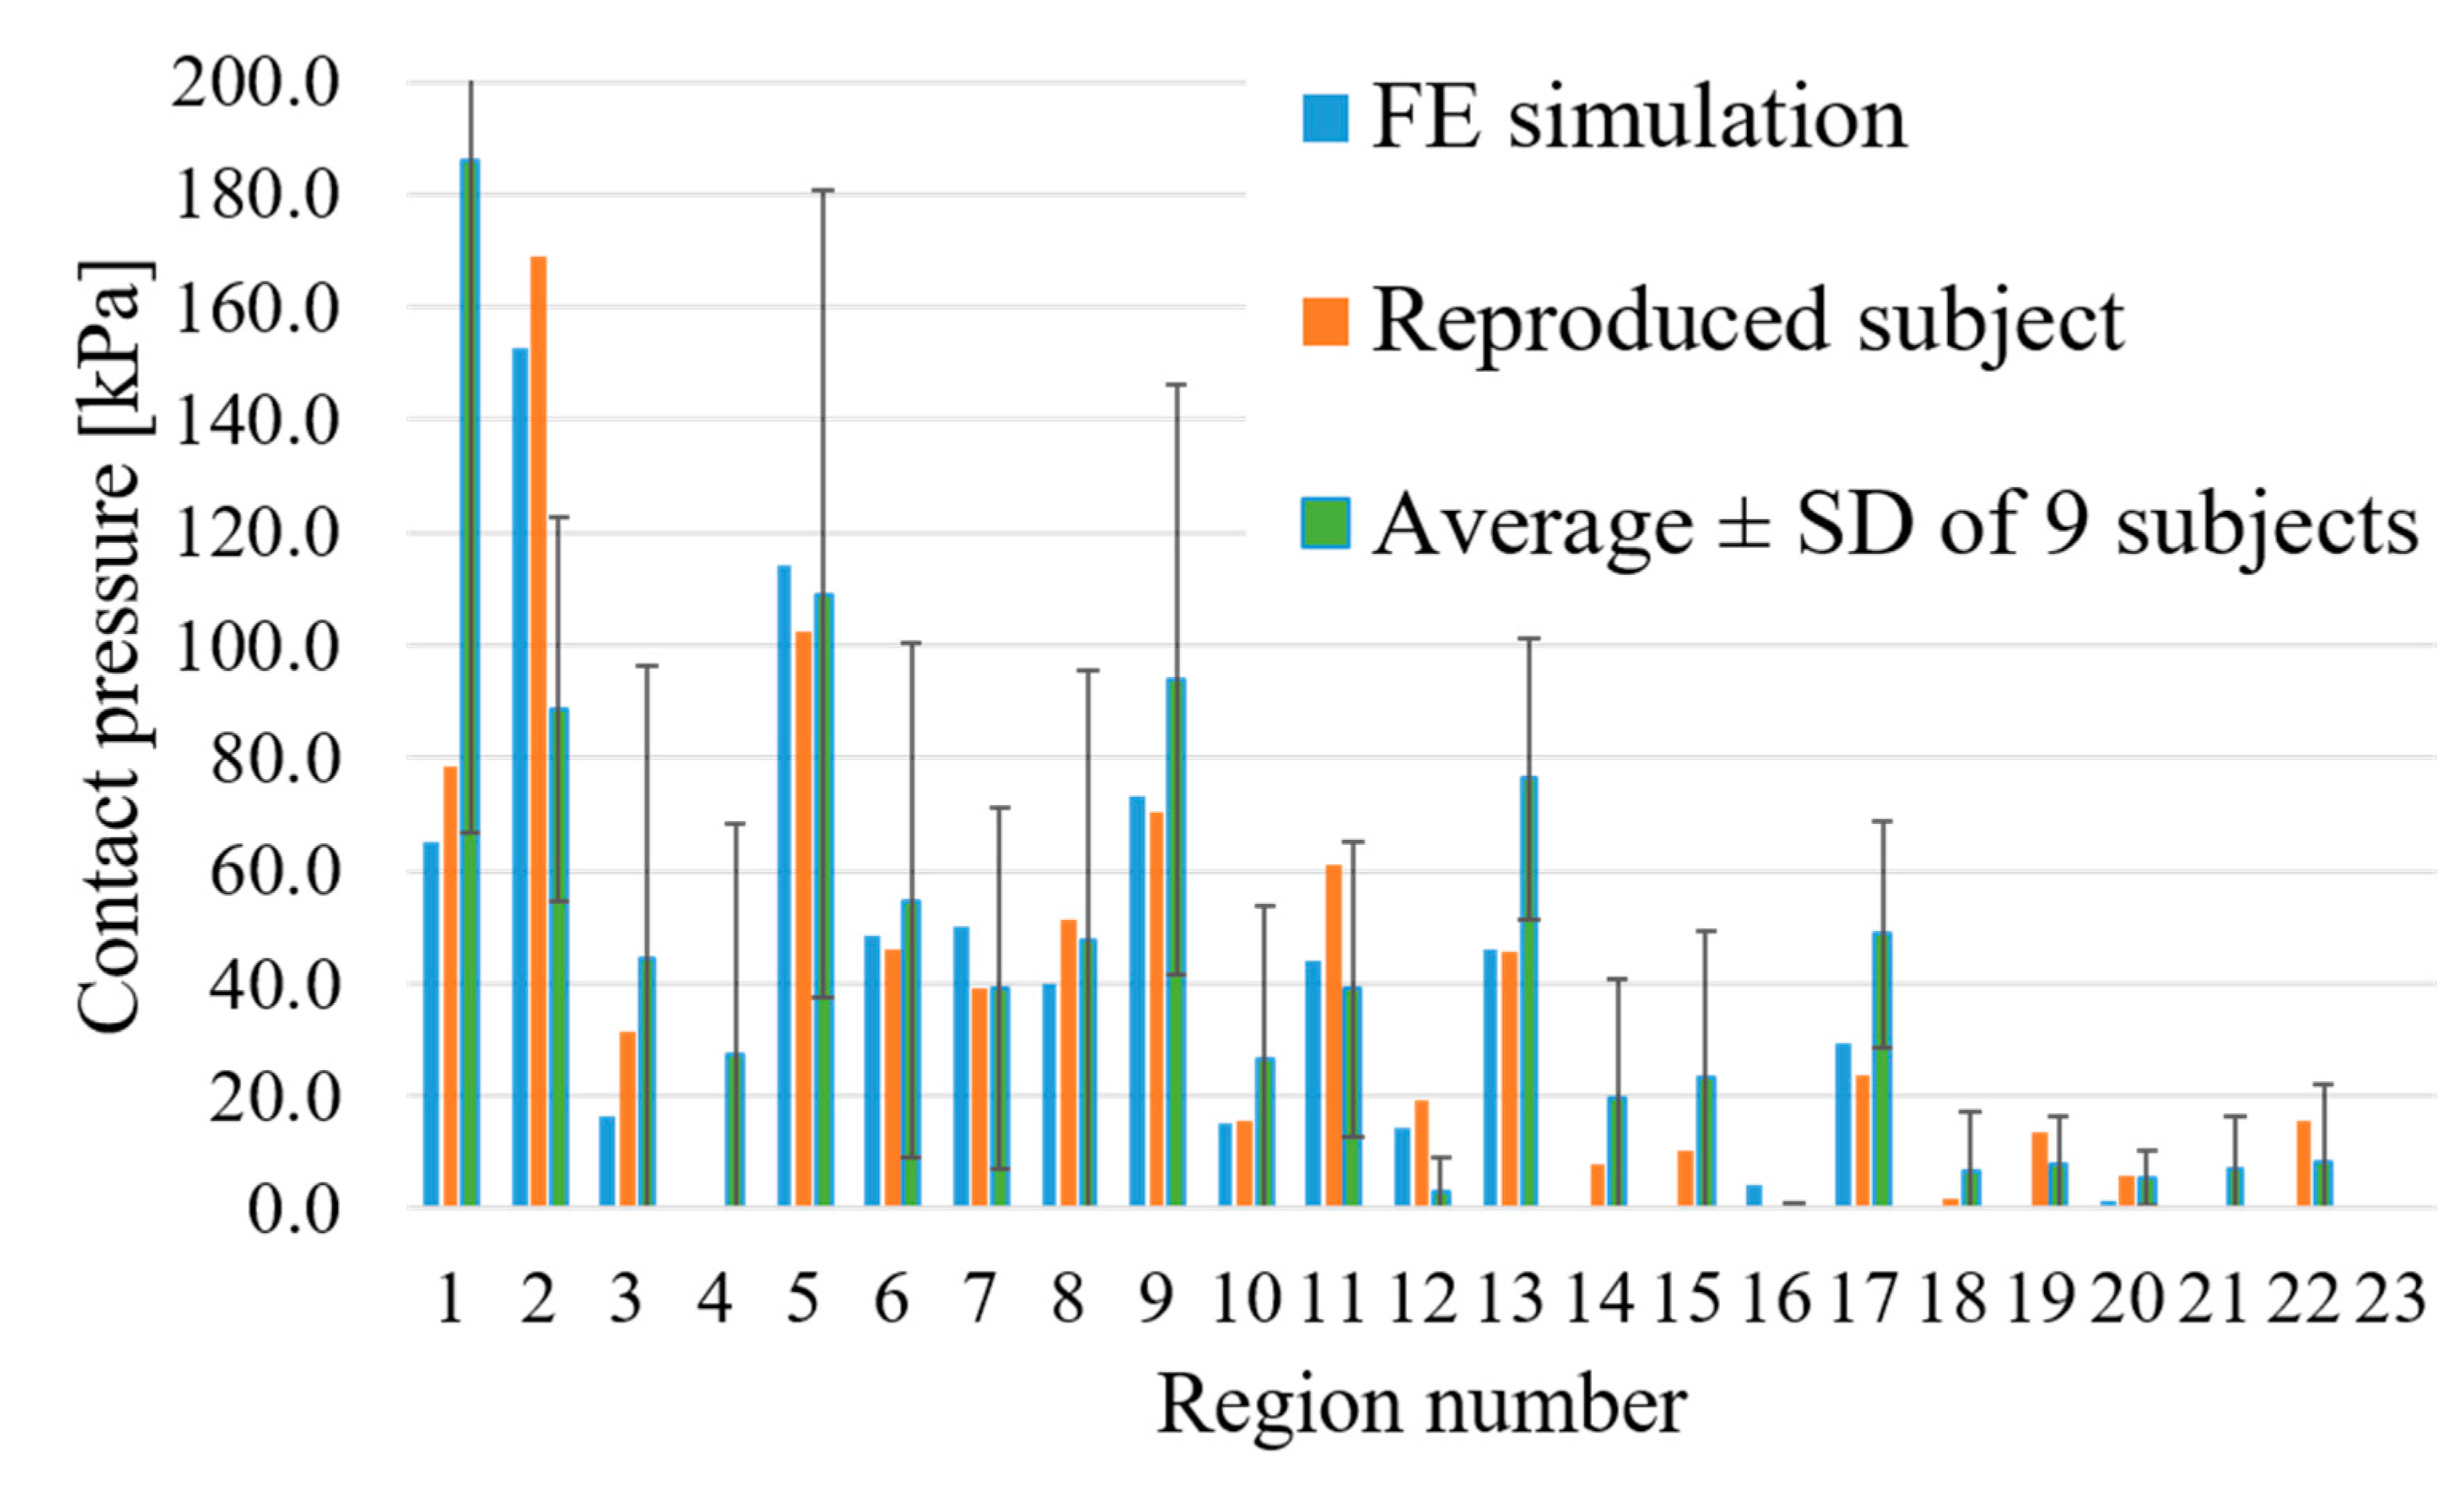
A quantitative comparison of the contact pressure value obtained from the simulation and experiment is shown in Figure 10. The difference between the simulation result and experiment result was evaluated via Mean Absolute Error (MAE) that is calculated by Equation (9).
MAE = 1 n k = 1 n | A j E j |
where n (= 23) denotes the number of regions; Aj [kPa] denotes the contact pressure in the simulation at j; Ei (kPa) denotes the contact pressure in the experiment at j; and j denotes the region number. Thus, MAE corresponded to 7.4 kPa, thereby indicating the average difference in contact pressure among the 23 regions. Additionally, the simulation result was mostly within the average ± standard deviation (SD) of the results of 9 male subjects obtained in our previous experiment [6].
The grasping motion simulation was developed to estimate gripping comfort. Therefore, it is necessary to understand the effect of the difference between the simulation result and experimental result on the gripping comfort estimated via grasping motion simulation. The gripping comfort score was calculated by assigning the contact pressure obtained from the simulation into the regression equation as reported in a previous study [6]. Thus, gripping comfort score was estimated as 0.32. Given that the actual gripping comfort score evaluated by volunteers corresponded to 0.48 in the experiment, the difference between the estimated gripping comfort score and actual gripping comfort score corresponded to 0.16. The gripping comfort evaluation was conducted using the visual analog scale method. The possible range of the gripping comfort score corresponded to −1 (bad) to 1 (good) in continuous values. The gripping comfort score corresponds to a value with a range of 2, and thus the difference of 0.16 is sufficiently low when compared to the range of 2 (less than 10%). Hence, the grasping motion simulation proposed in the study was considered as useful to evaluate gripping comfort during the development process of the gripping part of a product.
The mesh sensitivity study was conducted to find out the optimum mesh sizes for the subcutaneous soft tissue and the skin in the hand model. Three models with different mesh sizes were used for the study. The average difference of contact pressure on the regions that were important for evaluating gripping comfort was selected as the assessment parameter in the study. Numbers of elements and nodes for each model and the differences from the model with a larger mesh size are shown in Table 4. The model with smaller mesh size might provide a more accurate result, but may be more time-consuming compared to those with larger mesh size. Therefore, calculation time should also be considered while selecting optimum mesh size. Since the difference in the model with 4 mm mesh size was less than 10%, we decided to choose the model with 5 mm mesh size for the grasping simulation.

2.3. Gripping Part Design Using Topology Optimization Method

2.3.1. Topology Optimization

Topology optimization is a method to create an optimal layout with limited material and is applied to various structural design problems [30,31,32]. In this study, this method was applied to the grasping motion simulation to obtain the optimal shape of the gripping part that is comfortable for gripping. The topology optimization was conducted using Radioss and an optimized structural analysis software termed as OptiStruct (Altair Engineering Inc., Troy, MI, USA). The design variable of the topology optimization denotes the element density ρe of each element, and this exhibits continuous values between 0.01 and 1.0. The Young’s modulus of the design target changes based on Equation (10) during the optimization process as follows:
E n e w = E o r g × ρ e d + 1
where Enew denotes the new Young’s modulus assigned to each element of the design target during the optimization process; Eorg denotes the original Young’s modulus of the design target; and d denotes a constant, which was set to 1 in the study, to avoid rapid excessive deformation. The Young’s modulus of the design target varies due to the change in ρe, which does not decrease if the corresponding element is considered necessary as a result of the optimization.

2.3.2. Optimization Condition

The design variable used in the study corresponded to the element density as mentioned in the previous section. A column FE model as shown in Figure 11 is constructed by using HyperMesh as the initial design target. The column FE model exhibited the same dimensions and material properties as the cylinder FE model used in the development of grasping motion simulation. The number of nodes and elements (hexahedron) corresponded to 6048 and 5304, respectively. The elements of the column FE model were set as the design space of optimization.
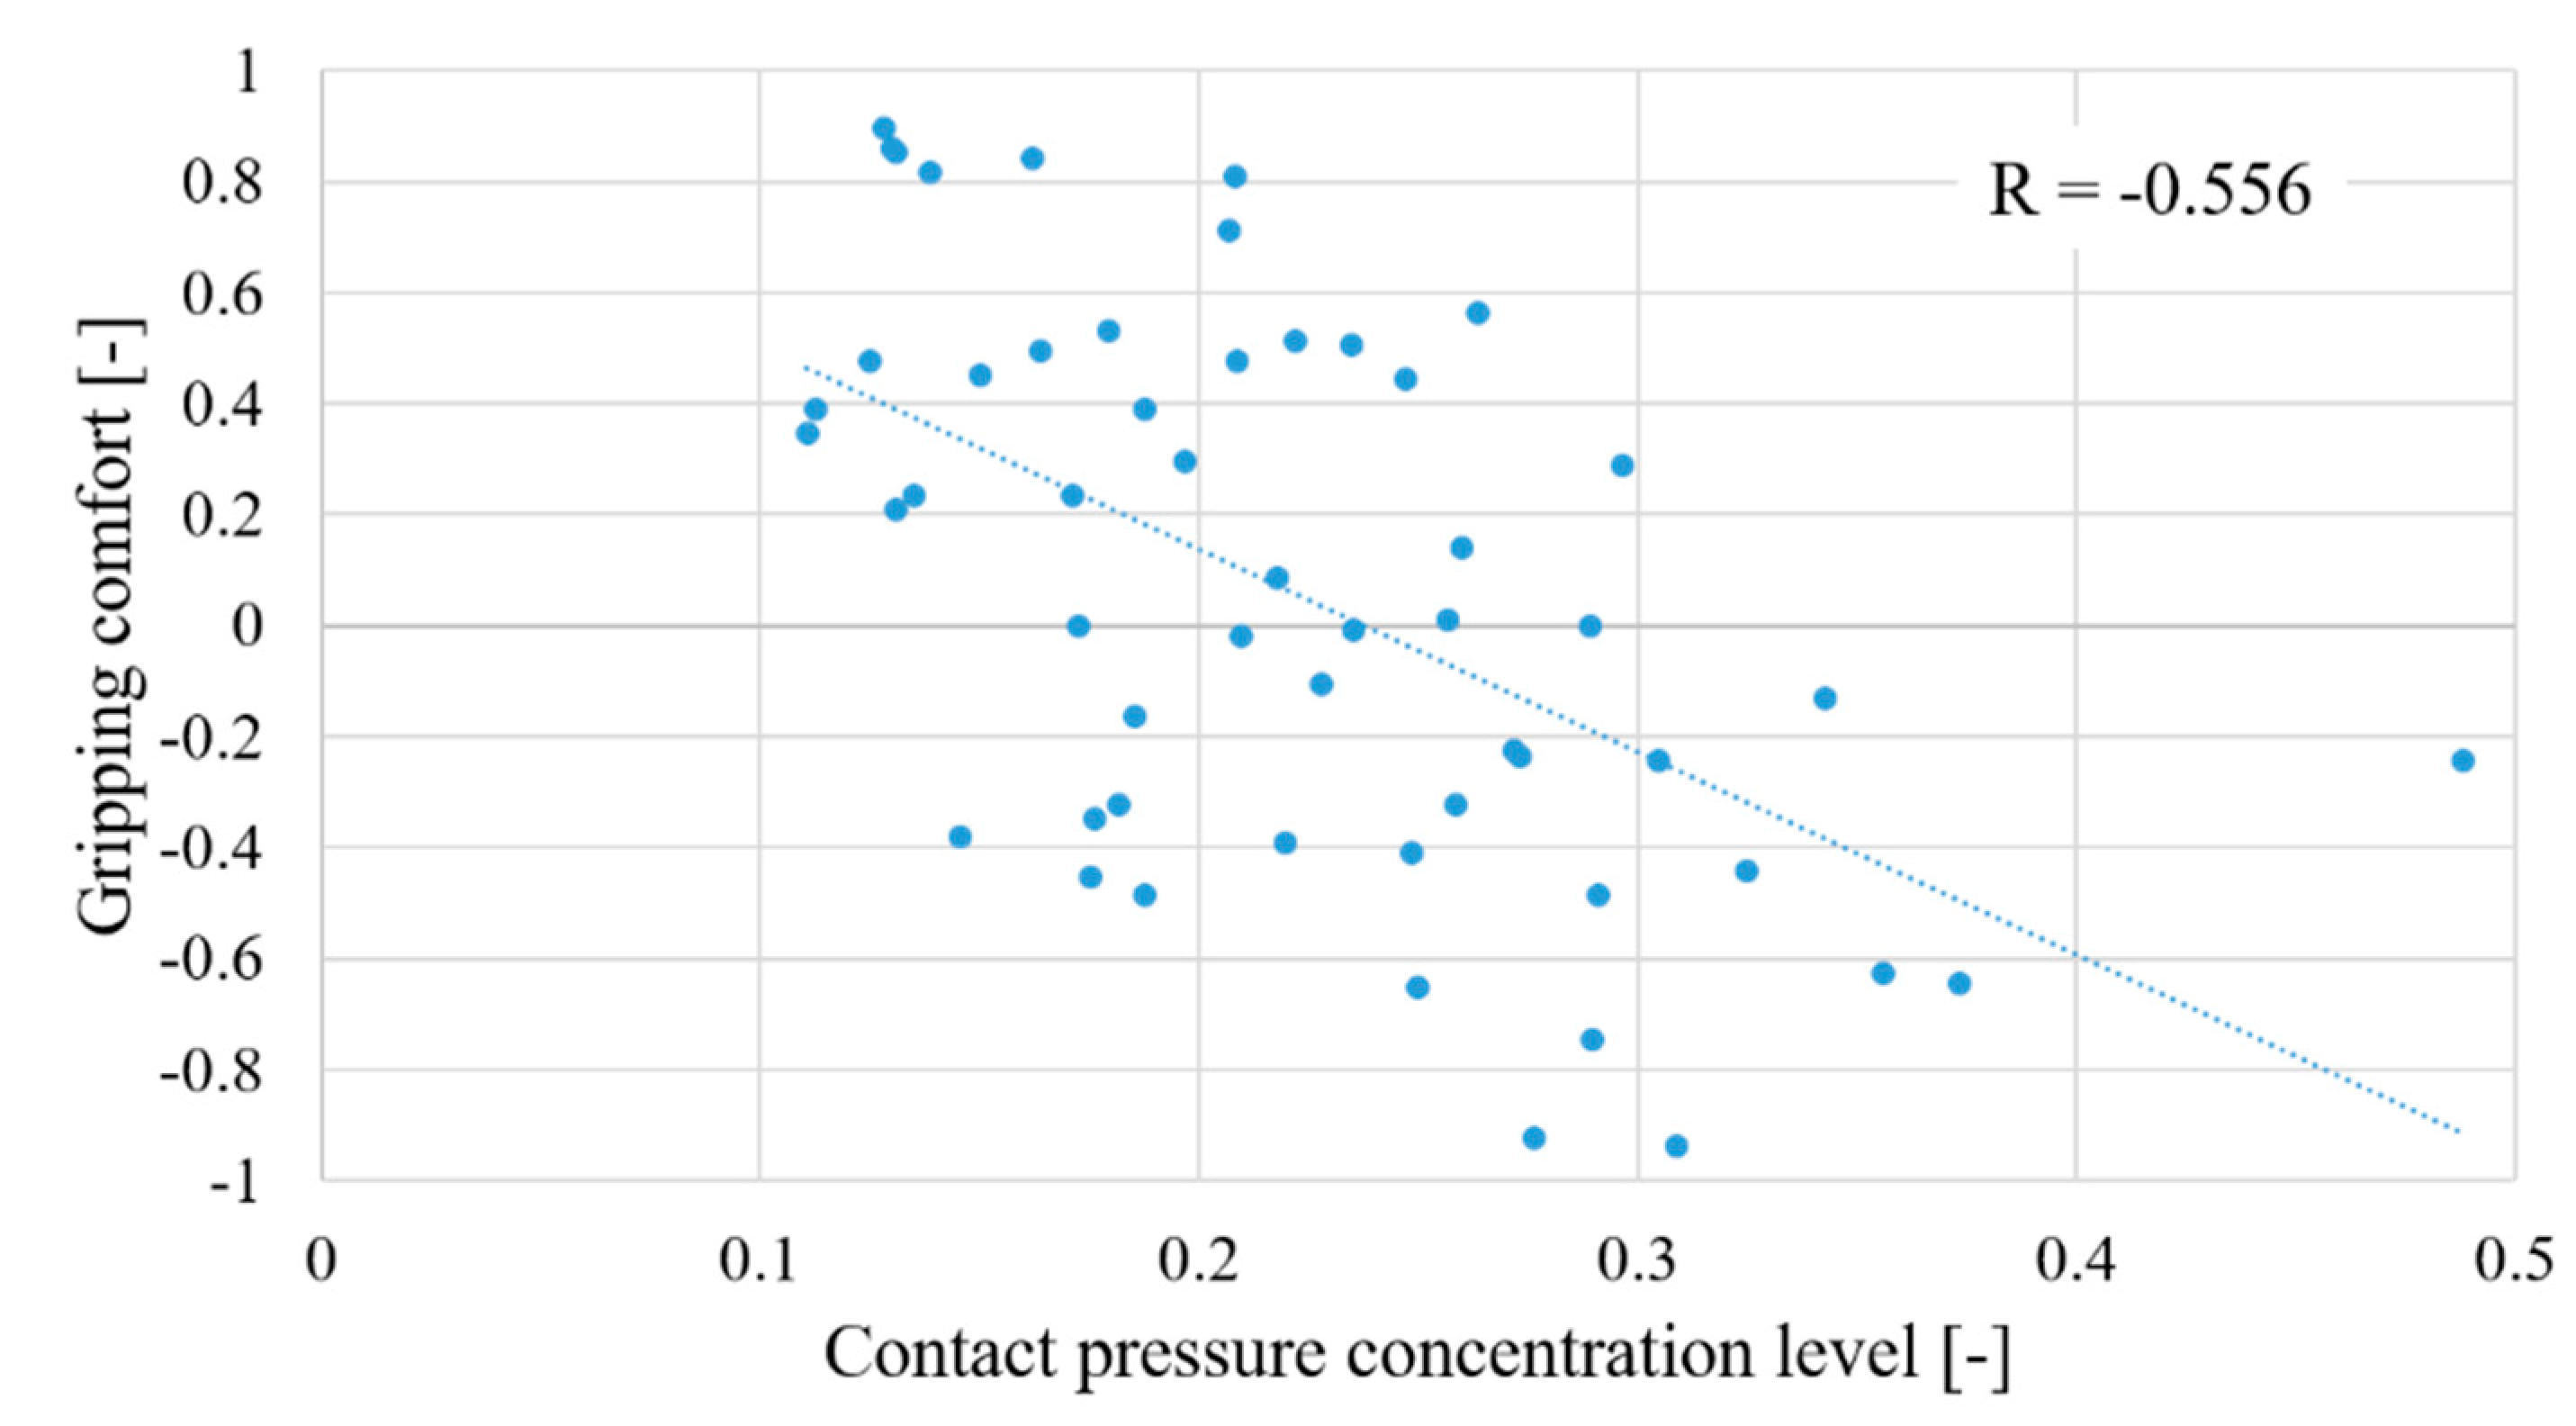
An objective function that minimizes the contact pressure concentration level was adopted in the study. Gripping comfort score is related to the contact pressure concentration level based on our previous study [6], as indicated in Figure 12. Thus, it is expected that gripping comfort score can be increased by decreasing the contact pressure concentration level. The contact pressure concentration level Pc proposed in the study is defined in Equation (11) as follows:
P c = P m a x P t o t a l ,
where Pmax (kPa) denotes the contact pressure of a region that generates the highest pressure among the 23 regions shown in Figure 5; and Ptotal (kPa) denotes the total contact pressure in the 23 regions. By minimizing Pc, it is possible to maximize the gripping comfort score.
Two constraint conditions set in the study corresponded to 49.97 ≤ Pmax ≤ 598.9 kPa and 339.4 ≤ Ptotal ≤ 2714 kPa. The constraint conditions were defined considering realistic contact pressure during gripping a cylinder based on the results measured in the experiment [6].
Given the limitation of Radioss and OptiStruct, it was impossible to use contact pressure as the design response during optimization. Hence, contact pressure was determined via a regression equation based on the minimum principal stress generated in the subcutaneous soft tissue, and this denoted the closest tissue to the skin. The minimum principal stress exhibited high correlation (R = −0.879) with the contact pressure of the skin based on the FE simulation.

3. Results and Discussion

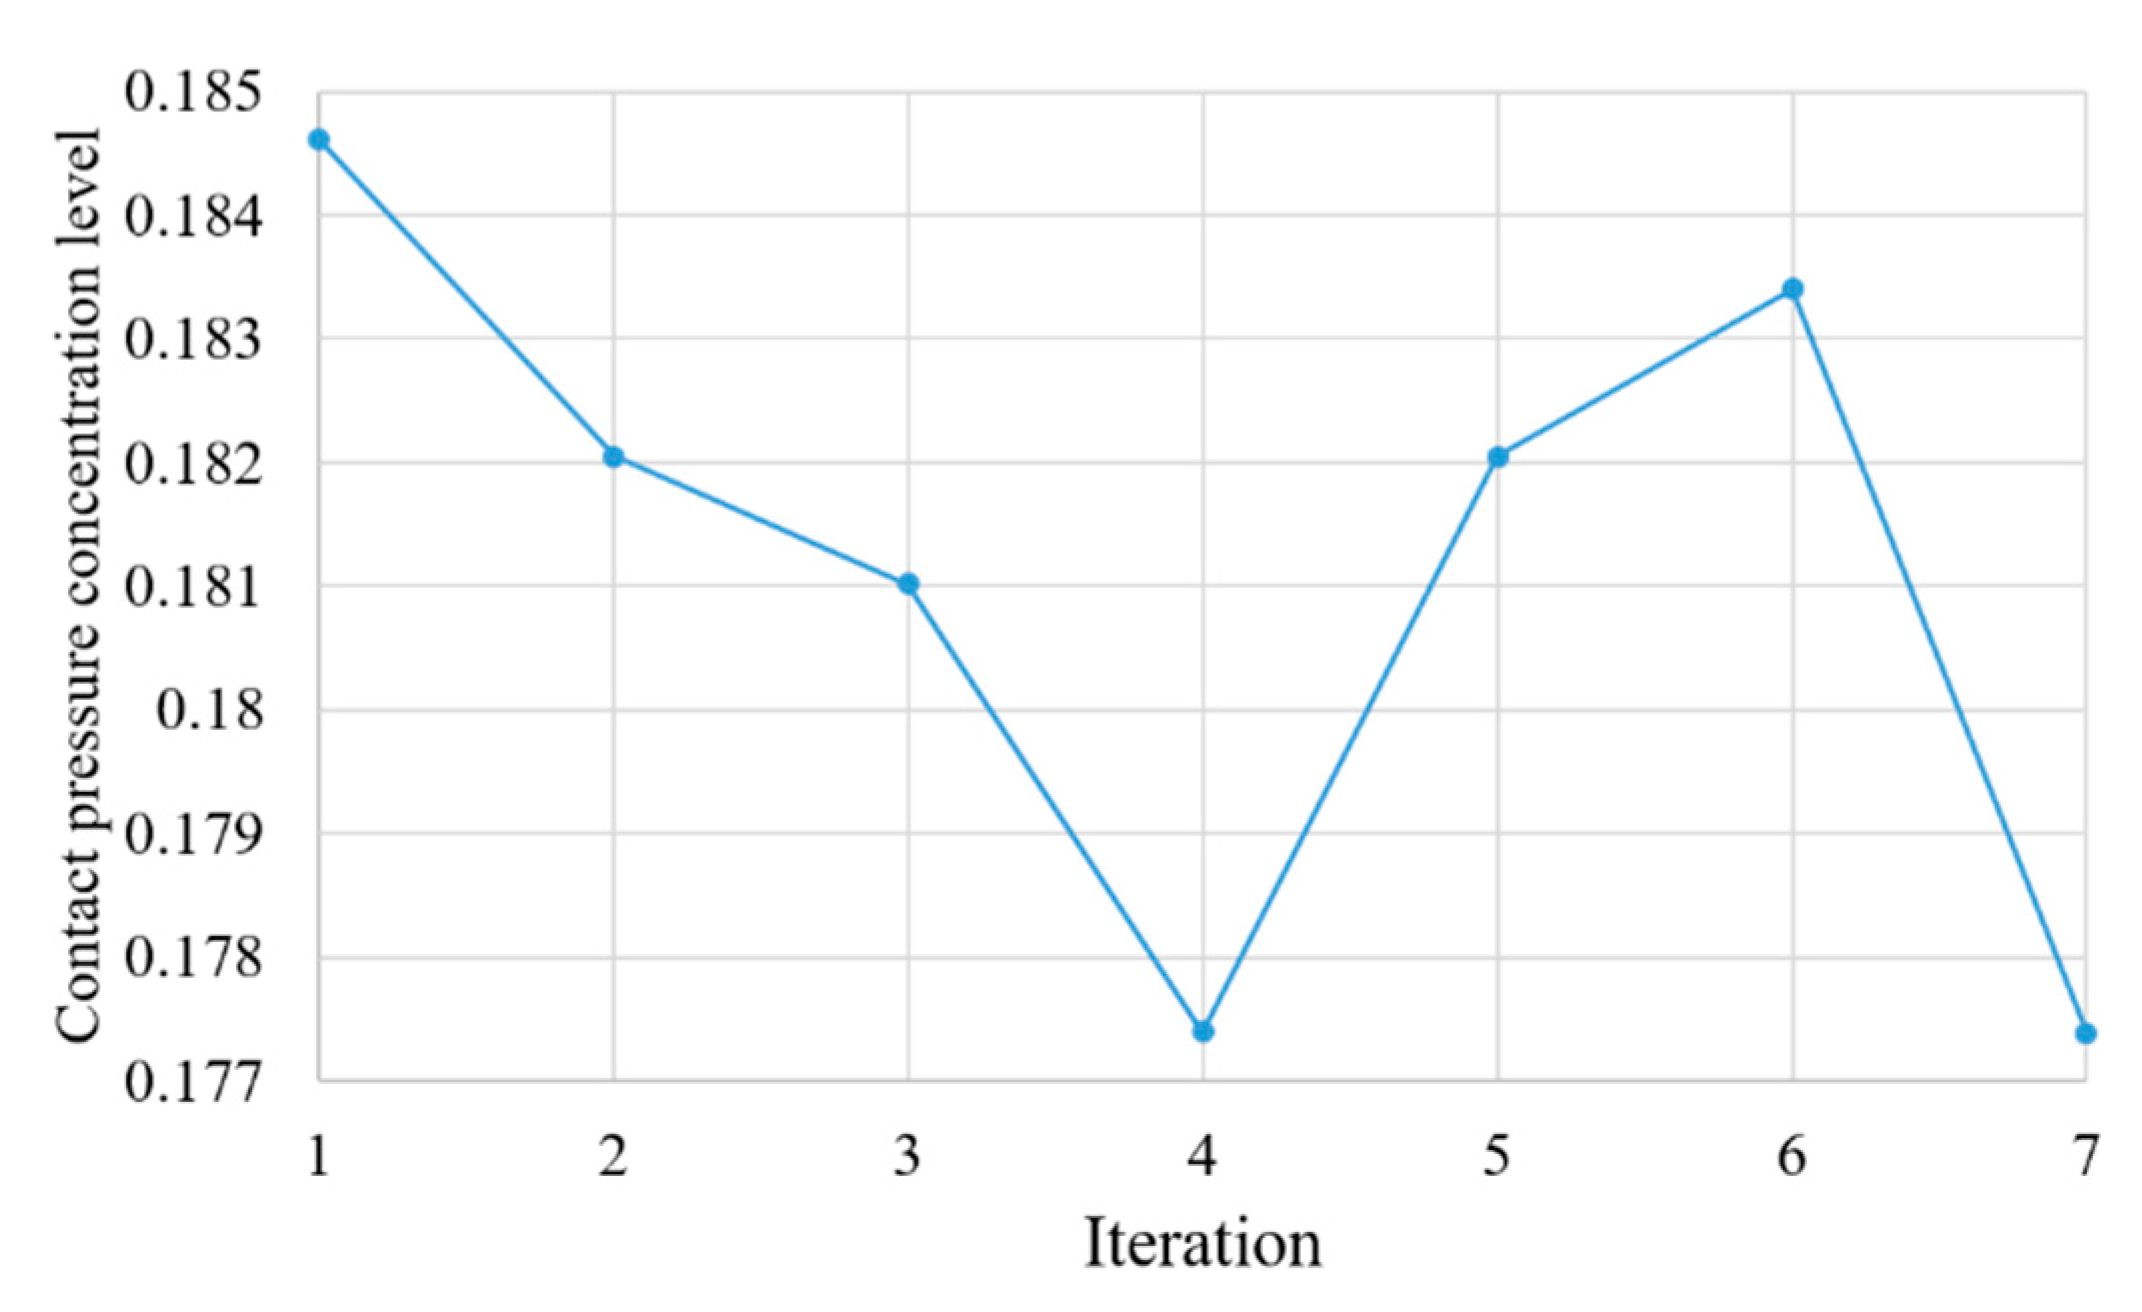
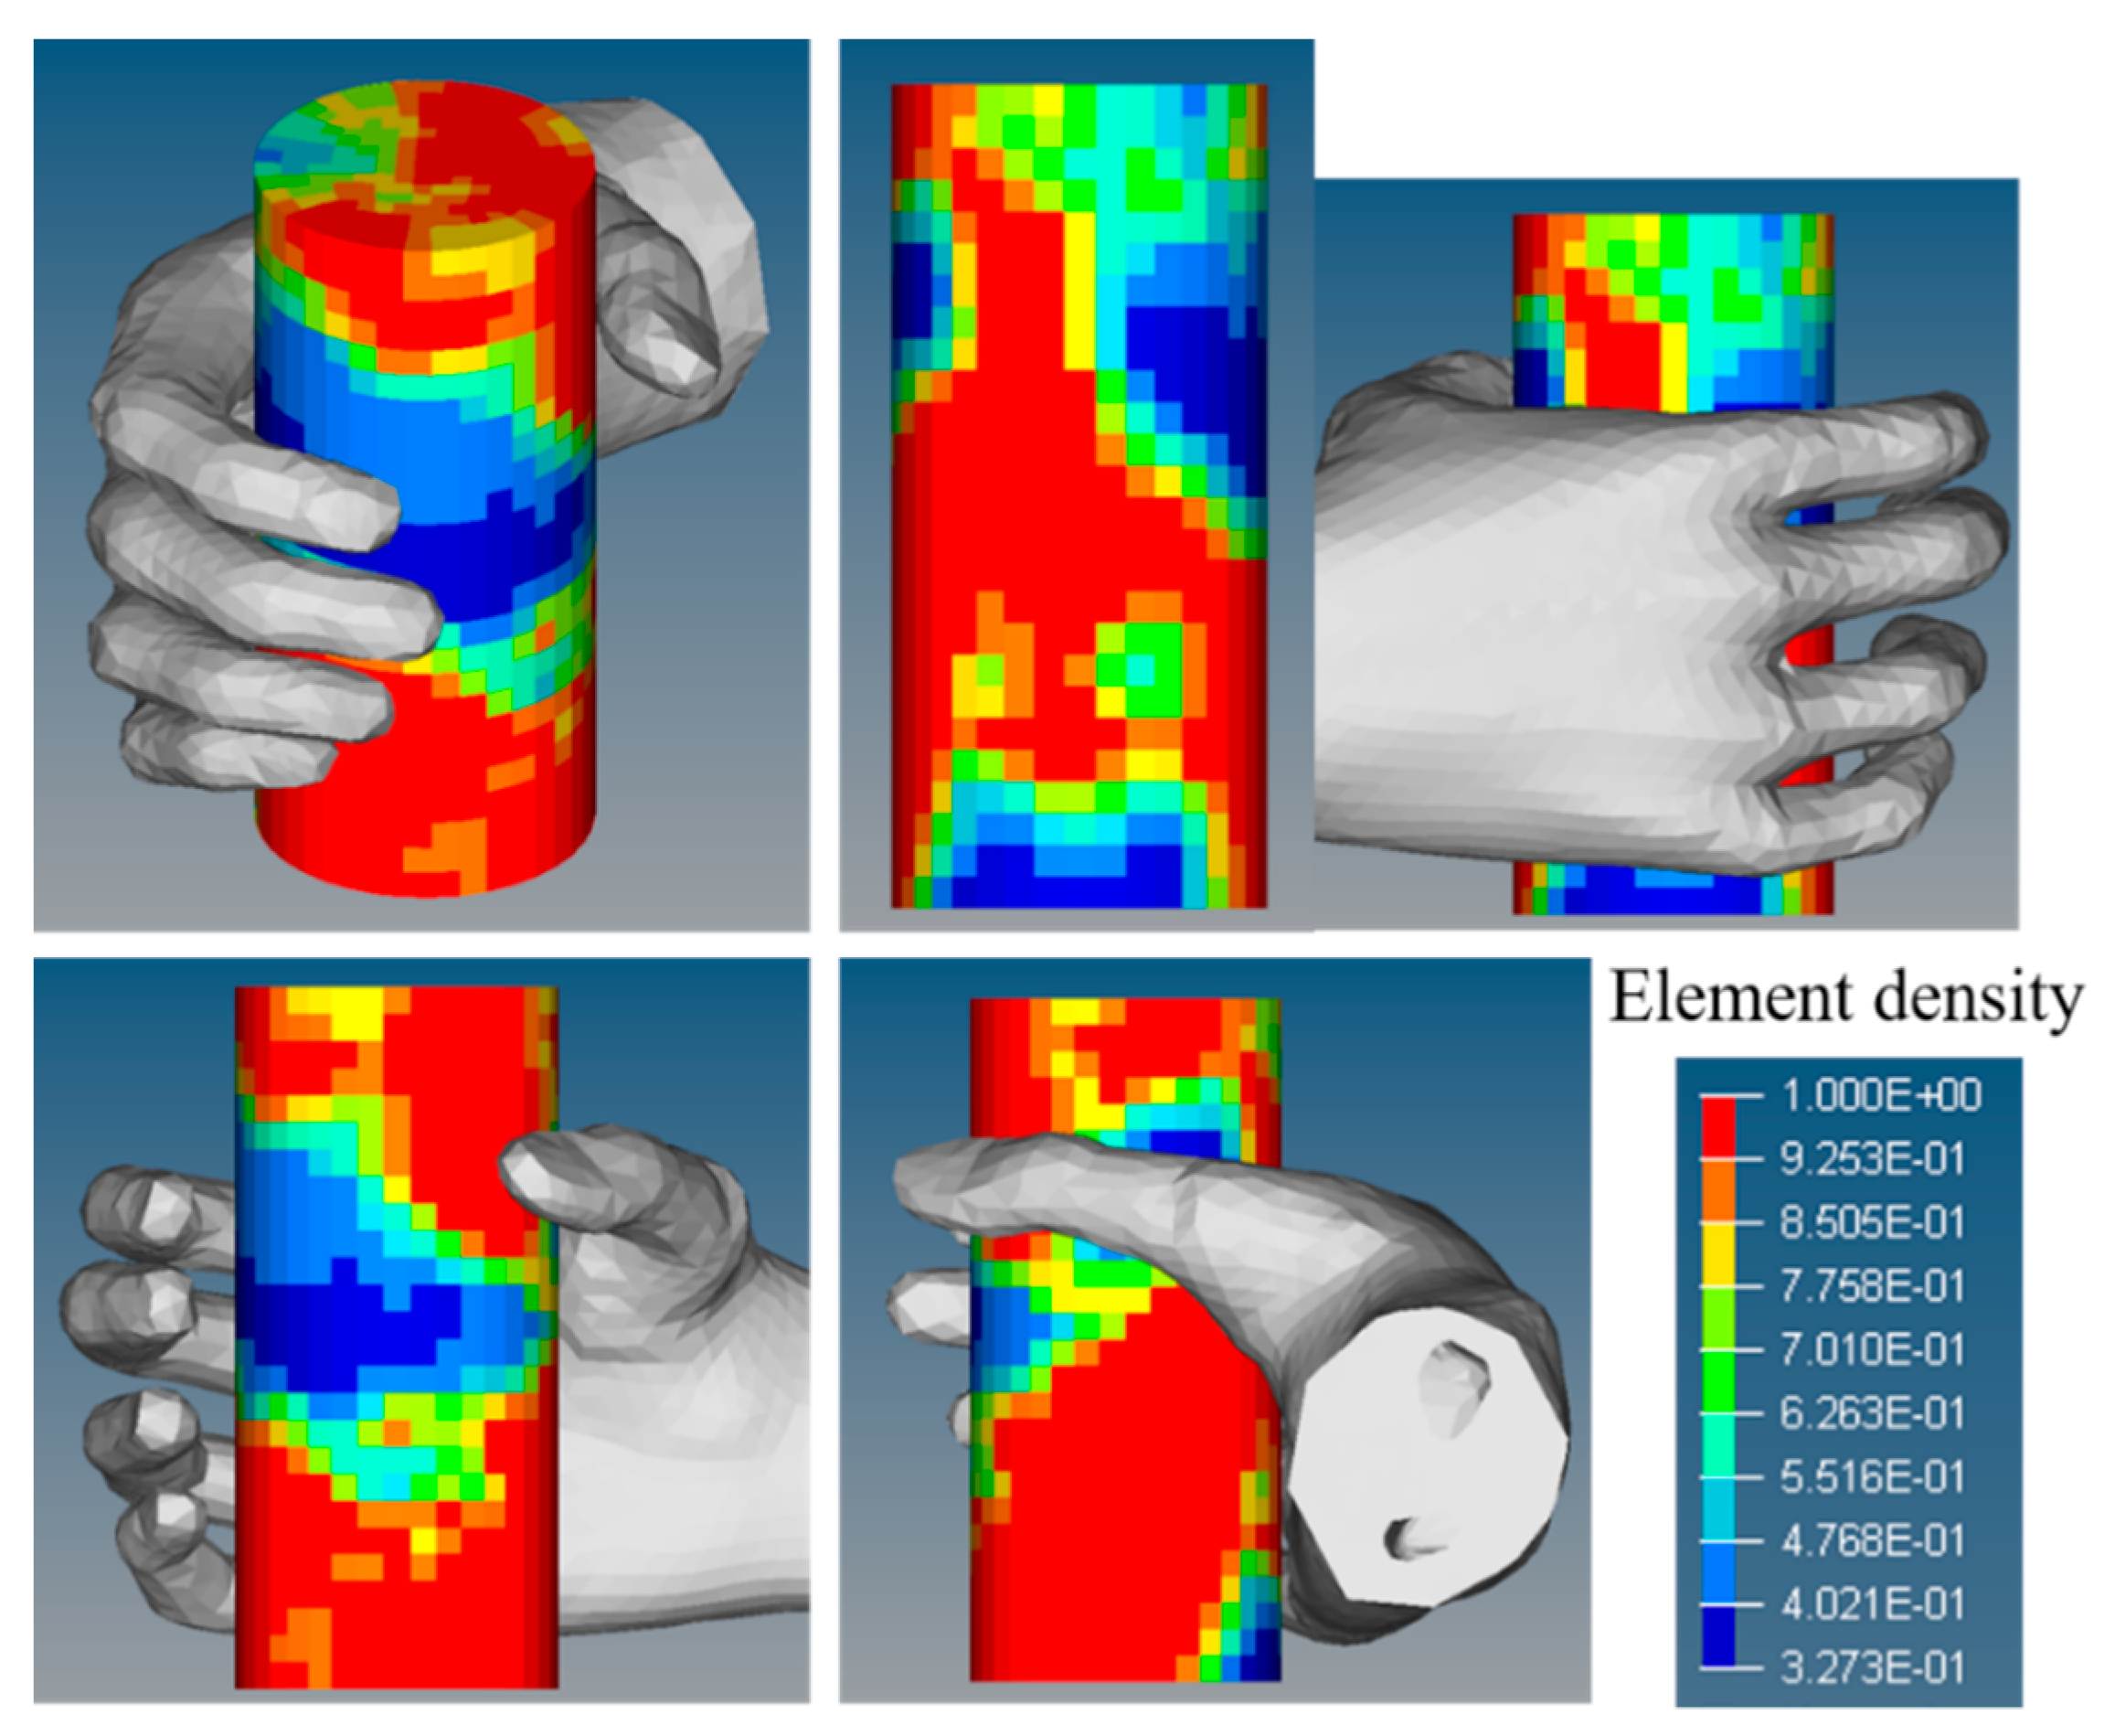
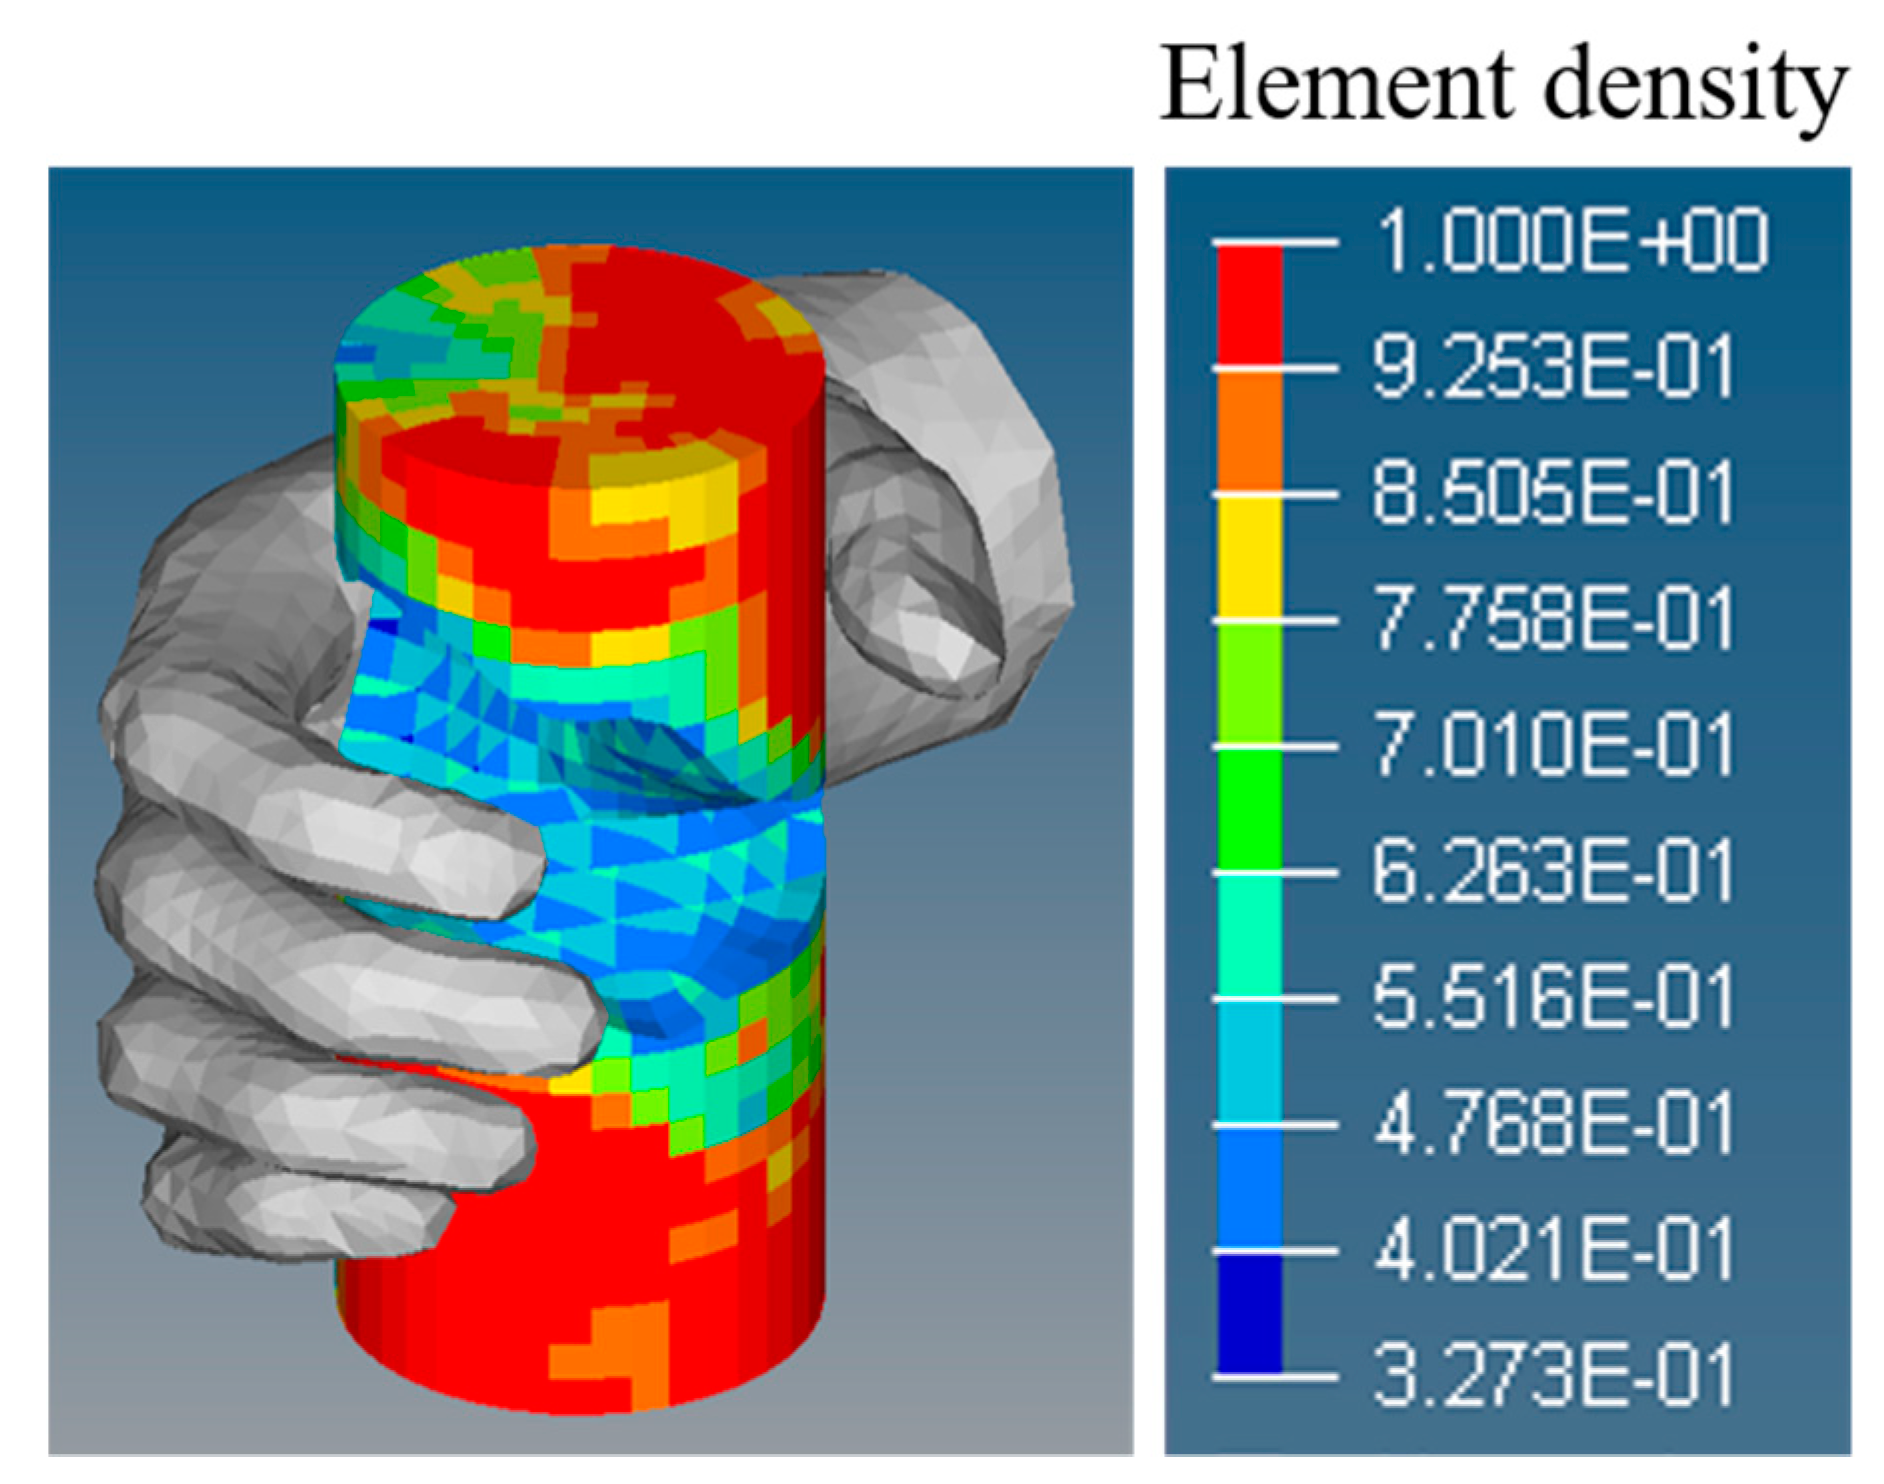
Progress of the topology optimization is shown in Figure 13. It is confirmed that contact pressure concentration level corresponded to a minimum value at the seventh iteration. The element density distribution at the seventh iteration when the optimal result is obtained is shown in Figure 14. As shown in the figure, low element density is identified at the parts where contact with the fingertips of the index finger and middle finger occurs. Conversely, high element density is identified at the part where contacts with the proximal region of the palm occurred.
The result of topology optimization indicated that the parts where contact with the fingertips of the index finger and middle finger tended to exhibit low element density, and this decreased Young’s modulus. Thus, it also implies that the parts should be sufficiently soft to allow a user to perceive a better gripping comfort. The highest contact pressure was confirmed to occur in region 2 in the simulation. Therefore, low element density (low Young’s modulus) in the region is required to minimize the contact pressure concentration level. Low element density (low Young’s modulus) absorbed forces were generated by the index finger and middle finger to push the column FE model, and thus they did not significantly transmit to region 2 on the opposite side.
The contact pressure on the index finger and middle finger was reported as important for evaluating gripping comfort [6]. Furthermore, the index finger and middle finger were also reported to contribute more than the ring finger and little finger while gripping an object [33,34,35]. The result of the optimization study indicated that the response caused by the two fingers was crucial in obtaining a gripping part design with high gripping comfort.
Conversely, the ring finger was reported to contribute more than the index finger based on the handle diameter [36,37,38]. The differences in findings were assumed to be caused by the position of the thumb during gripping of an object. The contact pressure on the index finger is considered to increase when the thumb is on the opposite side of the index finger whereas the contact pressure on the ring finger is considered as higher when the thumb is on the opposite side of the ring finger or little finger while gripping an object. Hence, it is necessary to consider grasp type [39,40,41] including the position of the thumb given that grasp type varies among users.
A new shape of the column where elements with low element density (0.5 or below) are removed is shown in Figure 15. The elements for which low element density was unnecessary were considered as another interpretation of the topology optimization result, as also recommended in other studies, that elements with element density below the threshold can be removed [32]. The optimized shape should be gripped with larger flexion in the index finger and middle finger joints when compared to the initial shape. Handle shape that reflects human-hand anthropometry was proposed to improve a handles’ ergonomics [18,42]. The shape obtained from the study was in good agreement with the shape proposed in a previous study in terms of the concave surface on the object. However, in the study, only the parts in contact with the index finger and middle finger exhibit concave surfaces. However, in a previous study [18,42], all parts in contact with fingers exhibit concave surfaces. The inconsistency is caused by the difference in the methodology to obtain an optimal shape and which fingers were referenced in the study. In the study, the focus was specifically on the index finger and middle finger to minimize the contact pressure concentration level. In a previous study, all fingers were considered to design a handle with a shape that perfectly fits the fingers.
A suitable threshold value for element density that should be removed can be freely decided by a designer. Extant studies reported that the optimal diameter of an object for gaining gripping comfort corresponded to between 27 and 40 mm [15,43]. Additionally, the optimal diameter of an object was also acquired based on the hand anthropometry of the users [17,36]. Therefore, an optimal diameter of the column is achieved via selecting a unique threshold value for element density that should be removed.
The study presented several limitations. The simulation in the study only reproduced a grasp type of a young person (age: 21 years). In the product development, products should be developed to provide gripping comfort for larger populations. Gripping comfort is reported as affected by hand anthropometry [36,43]. Furthermore, grasp type varies among individuals and object shapes and sizes [6,41,44]. Therefore, it is necessary to construct subject-specific hand FE models with various hand shapes considering age and gender and to simulate various grasp types to evaluate gripping comfort under different conditions. Moreover, the regression equation used for gripping comfort evaluation was obtained from nine young male subjects (age: 22.2 ± 0.6 years) [6]. The differences among age groups may affect gripping comfort and contact pressure because the anthropometric characteristic is considered different between elderly and young people. Additionally, perception of comfort may also change according to the age of a subject. Therefore, it is necessary to investigate the difference among age groups in gripping comfort and contact pressure in the future. Additionally, gripping comfort evaluation was performed under a static condition when the hand reached a final posture (a gripping posture without any finger motions), and this is another limitation of the study. Many manufactured products used in daily life, such as dryers, shavers, and irons, require dynamic evaluation including ease to use and muscle fatigue in a certain time span. Hence, a dynamic gripping comfort evaluation method should be developed by conducting a muscle activity measurement using Electromyography (EMG) as well as by developing a hand musculoskeletal simulation in the future to obtain a gripping part shape that is comfortable for all users.

4. Conclusions

In this study, we used FEA to develop a simulation that reproduces the grasping motion of a human volunteer in an experiment to evaluate the gripping comfort while gripping an object. The grasping motion simulation qualitatively reproduced the gripping posture and contact pressure distribution obtained from the experiment. Furthermore, the difference in contact pressure at 23 regions between the simulation and experiment results was considered to be low; thus, gripping comfort can be evaluated by determining the gripping comfort score from the analyzed contact pressure. Additionally, we proposed a gripping part design method using a combination of the grasping motion simulation and topology optimization to obtain a shape that can provide better gripping comfort. The results indicated that the combined method is useful for designing a comfortable gripping part for a manufactured product in a short time.
Future studies will consider various grasp types and hand sizes in the method to enhance its capability to cover variations in a large population. The method proposed in this study will allow manufacturers to efficiently design gripping parts of products offering better gripping comfort and to easily evaluate the gripping comfort of existing products (mockups) on a computer.

Author Contributions

Conceptualization, K.H., J.A.P., M.I., K.O. and Y.T.; methodology, K.H., J.A.P. and M.I.; validation, K.H.; formal analysis, K.H.; investigation, K.H.; resources, J.A.P.; data curation, K.H. and J.A.P.; writing—original draft preparation, K.H. and J.A.P.; writing—review and editing, K.H., J.A.P., M.I., K.O. and Y.T.; visualization, K.H.; supervision, J.A.P., M.I. and Y.T.; project administration, K.H., J.A.P. and M.I.; funding acquisition, J.A.P., M.I. and K.O. All authors have read and agreed to the published version of the manuscript.

Funding

This research did not receive any specific grant from funding agencies.

Conflicts of Interest

No potential conflict of interest was reported by the authors.

References

  1. Nagamachi, M. Kansei Engineering: A new ergonomic consumer-oriented technology for product development. Int. J. Ind. Ergon. 1995, 15, 3–11. [Google Scholar] [CrossRef]
  2. Kuijt-Evers, L.F.M.; Groenesteijn, L.; de Looze, M.P.; Vink, P. Identifying factors of comfort in using hand tools. Appl. Ergon. 2004, 35, 453–458. [Google Scholar] [CrossRef] [PubMed]
  3. Kuijt-Evers, L.F.M.; Bosch, T.; Huysmans, M.A.; de Looze, M.P.; Vink, P. Association between objective and subjective measurements of comfort and discomfort in hand tools. Appl. Ergon. 2007, 38, 643–654. [Google Scholar] [CrossRef] [PubMed]
  4. Lin, J.H.; McGorry, R.W. Predicting subjective perceptions of powered tool torque reactions. Appl. Ergon. 2009, 40, 47–55. [Google Scholar] [CrossRef]
  5. Kong, Y.K.; Kim, D.M.; Lee, K.S.; Jung, M.C. Comparison of comfort, discomfort, and continuum ratings of force levels and hand regions during gripping exertions. Appl. Ergon. 2012, 43, 283–289. [Google Scholar] [CrossRef]
  6. Hokari, K.; Pramudita, J.A.; Ito, M.; Noda, S.; Tanabe, Y. The relationships of gripping comfort to contact pressure and hand posture during gripping. Int. J. Ind. Ergon. 2019, 70, 84–91. [Google Scholar] [CrossRef]
  7. Coelho, R.M.; Alves de Sousa, R.J.; Fernandes, F.A.O.; Teixeira-Dias, F. New composite liners for energy absorption purposes. Mater. Des. 2013, 43, 384–392. [Google Scholar] [CrossRef]
  8. Harih, G.; Dolšak, B. Recommendations for tool-handle material choice based on finite element analysis. Appl. Ergon. 2014, 45, 577–585. [Google Scholar] [CrossRef]
  9. Hokari, K.; Arimoto, R.; Pramudita, J.A.; Ito, M.; Noda, S.; Tanabe, Y. Palmar Contact Pressure Distribution During Grasping A Cylindrical Object: Parameter Study Using Hand Finite Element Model. Adv. Exp. Mech. 2019, 4, 135–140. [Google Scholar] [CrossRef]
  10. Miller, A.; Allen, P.; Santos, V.; Valero-Cuevas, F. From robotic hands to human hands: A visualization and simulation engine for grasping research. Ind. Robot 2005, 32, 55–63. [Google Scholar] [CrossRef]
  11. Miyata, N.; Shimizu, Y.; Motoki, Y.; Maeda, Y.; Mochimaru, M. Hand MoCap using an individual model with a skeleton and a surface skin. Int. J. Hum. Factors Model. Simul. 2012, 3, 147–168. [Google Scholar] [CrossRef]
  12. Sancho-Bru, J.L.; Mora, M.C.; León, B.E.; Pérez-González, A.; Iserte, J.L.; Morales, A. Grasp modelling with a biomechanical model of the hand. Comput. Methods Biomech. Biomed. Eng. 2014, 17, 297–310. [Google Scholar] [CrossRef] [Green Version]
  13. Chamoret, D.; Bodo, M.; Roth, S. A first step in finite element simulation of a grasping task. Comput. Assist. Surg. 2016, 21 (Suppl. 1), 22–29. [Google Scholar] [CrossRef] [Green Version]
  14. Harih, G.; Tada, M. (Eds) Grasping Simulations Using Finite Element Digital Human Hand Model. In Proceedings of the 20th Congress of the International Ergonomics Association (IEA 2018), Florence, Italy, 26–30 August 2018; pp. 117–127. [Google Scholar] [CrossRef]
  15. Sancho-Bru, J.L.; Giurintano, D.J.; Pérez-González, A.; Vergara, M. Optimum Tool Handle Diameter for a Cylinder Grip. J. Hand Ther. 2003, 16, 337–342. [Google Scholar] [CrossRef]
  16. Eksioglu, M. Relative optimum grip span as a function of hand anthropometry. Int. J. Ind. Ergon. 2004, 34, 1–12. [Google Scholar] [CrossRef]
  17. Garneau, C.J.; Parkinson, M.B. Optimization of Tool Handle Shape for a Target User Population. In Proceedings of the ASME 2009 International Design Engineering Technical Conferences & Computers and Information in Engineering Conference, San Diego, CA, USA, 30 August–2 September 2009; pp. 1029–1036. [Google Scholar] [CrossRef]
  18. Harih, G.; Dolšak, B. Tool-handle design based on a digital human hand model. Int. J. Ind. Ergon. 2013, 43, 288–295. [Google Scholar] [CrossRef]
  19. Maeno, T.; Kobayashi, K.; Yamazaki, N. Relationship between the Structure of Human Finger Tissue and the Location of Tactile Receptors. JSME Int. J. Ser. C 1998, 41, 94–100. [Google Scholar] [CrossRef] [Green Version]
  20. Kouchi, M. AIST Japanese Hand Dimensions Data. Available online: www.airc.aist.go.jp/dhrt/hand/index.html (accessed on 17 November 2016).
  21. Napier, J.R. The prehensile movements of the human hand. J. Bone Joint Surg. 1956, 38, 902–913. [Google Scholar] [CrossRef] [Green Version]
  22. Mason, C.R.; Gomez, J.E.; Ebner, T.J. Hand synergies during reach-to-grasp. J. Neurophysiol. 2001, 86, 2896–2910. [Google Scholar] [CrossRef]
  23. Aldien, Y.; Welcome, D.; Rakheja, S.; Dong, R.; Boileau, P.E. Contact pressure distribution at hand–handle interface: Role of hand forces and handle size. Int. J. Ind. Ergon. 2005, 35, 267–286. [Google Scholar] [CrossRef]
  24. Saga, N.; Tesen, S.; Dobashi, H.; Nagase, J. Design of a peristaltic crawling robot using 3-D link mechanisms. Int. J. Biomechatronics Biomed. Robot. 2013, 2, 111–117. [Google Scholar] [CrossRef]
  25. Pramudita, J.A.; Kamiya, S.; Ujihashi, S.; Choi, H.Y.; Ito, M.; Watanabe, R.; Crandall, J.R.; Kent, R.W. Estimation of conditions evoking fracture in finger bones under pinch loading based on finite element analysis. Comput. Methods Biomech. Biomed. Eng. 2017, 20, 35–44. [Google Scholar] [CrossRef] [PubMed]
  26. Ito, M. Construction of integrated head laceration prediction method in infant fall using the evaluation methods of protective reaction and skin laceration. Ph.D. Thesis, Tokyo Institute of Technology, Tokyo, Japan, 2017. [Google Scholar]
  27. Zhang, M.; Mak, A.F. In vivo friction properties of human skin. Prosthet. Orthot. Int. 1999, 23, 135–141. [Google Scholar] [CrossRef] [PubMed] [Green Version]
  28. Ramírez, J.F.; Pavón, J.J.; Toro, A. Experimental assessment of friction coefficient between polypropylene and human skin using instrumented sclerometer. Proc. Inst. Mech. Eng. Part J J. Eng. Tribol. 2014, 229, 259–265. [Google Scholar] [CrossRef]
  29. Wu, J.Z.; Welcome, D.E.; McDowell, T.W.; Xu, X.S.; Dong, R.G. Modeling of the interaction between grip force and vibration transmissibility of a finger. Med. Eng. Phys. 2017, 45, 61–70. [Google Scholar] [CrossRef]
  30. Dühring, M.B.; Jensen, J.S.; Sigmund, O. Acoustic design by topology optimization. J. Sound Vib. 2008, 317, 557–575. [Google Scholar] [CrossRef]
  31. Liu, J.; Ma, Y. A survey of manufacturing oriented topology optimization methods. Adv. Eng. Softw. 2016, 100, 161–175. [Google Scholar] [CrossRef]
  32. Mirzendehdel, A.M.; Suresh, K. Support structure constrained topology optimization for additive manufacturing. Comput Aided Des. 2016, 81, 1–13. [Google Scholar] [CrossRef] [Green Version]
  33. Radhakrishnan, S.; Nagaravindra, M. Analysis of hand forces in health and disease during maximum isometric grasping of cylinders. Med. Biol. Eng. Comput. 1993, 31, 372–376. [Google Scholar] [CrossRef]
  34. Goislard De Monsabert, B.; Rossi, J.; Berton, E.; Vigouroux, L. Quantification of hand and forearm muscle forces during a maximal power grip task. Med. Sci. Sports Exerc. 2012, 44, 1906–1916. [Google Scholar] [CrossRef]
  35. Rossi, J.; Berton, E.; Grélot, L.; Barla, C.; Vigouroux, L. Characterisation of forces exerted by the entire hand during the power grip: Effect of the handle diameter. Ergonomics 2012, 55, 682–692. [Google Scholar] [CrossRef] [PubMed]
  36. Kong, Y.K.; Lowe, B.D. Optimal cylindrical handle diameter for grip force tasks. Int. J. Ind. Ergon. 2005, 35, 495–507. [Google Scholar] [CrossRef]
  37. Vigouroux, L.; Rossi, J.; Foissac, M.; Grélot, L.; Berton, E. Finger force sharing during an adapted power grip task. Neurosci. Lett. 2011, 504, 290–294. [Google Scholar] [CrossRef] [PubMed]
  38. Nicholas, J.W.; Corvese, R.J.; Woolley, C.; Armstrong, T.J. Quantification of hand grasp force using a pressure mapping system. Work 2012, 41 (Suppl. 1), 605–612. [Google Scholar] [CrossRef] [Green Version]
  39. Kamakura, N.; Matsuo, M.; Ishii, H.; Mitsuboshi, F.; Miura, Y. Patterns of static prehension in normal hands. Am. J. Occup. Ther. 1890, 34, 437–445. [Google Scholar] [CrossRef] [Green Version]
  40. Vergara, M.; Sancho-Bru, J.L.; Gracia-Ibáñez, V.; Pérez-González, A. An introductory study of common grasps used by adults during performance of activities of daily living. J. Hand Ther. 2014, 27, 225–233. [Google Scholar] [CrossRef] [Green Version]
  41. Lee, K.S.; Jung, M.C. Three-dimensional finger joint angles by hand posture and object properties. Ergonomics 2016, 59, 890–900. [Google Scholar] [CrossRef]
  42. Harih, G.; Dolšak, B. Comparison of subjective comfort ratings between anatomically shaped and cylindrical handles. Appl. Ergon. 2014, 45, 943–954. [Google Scholar] [CrossRef]
  43. Yakou, T.; Yamamoto, K.; Koyama, M.; Hyodo, K. Sensory Evaluation of Grip Using Cylindrical Objects. JSME Int. J. Ser. C 1997, 40, 730–735. [Google Scholar] [CrossRef] [Green Version]
  44. Lee, K.S.; Jung, M.C. Common patterns of voluntary grasp types according to object shape, size, and direction. Int. J. Ind. Ergon. 2014, 44, 761–768. [Google Scholar] [CrossRef]
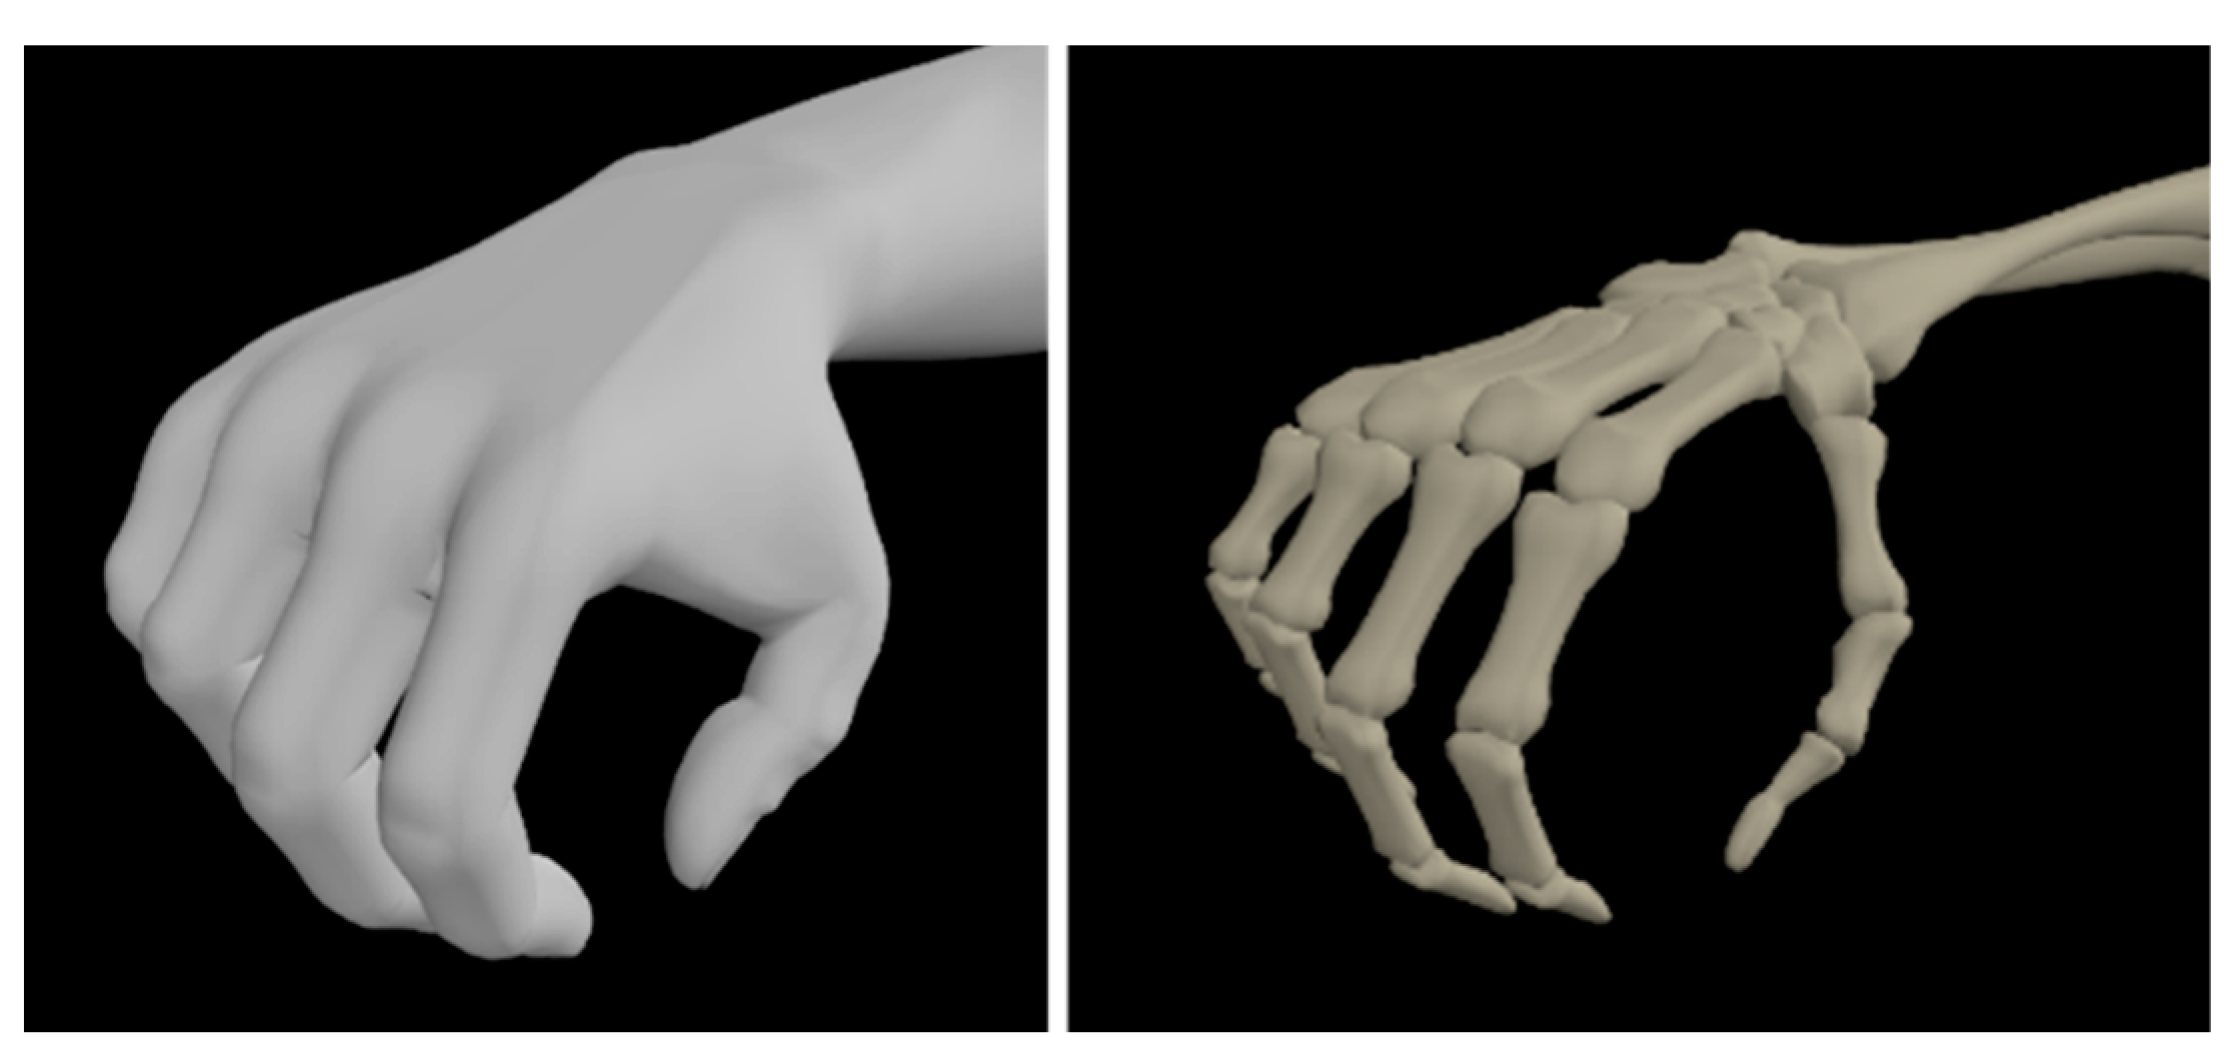
Figure 1. Outer surfaces of skin (left) and bones (right) at the initial hand posture.
Applsci 10 03265 g001
Figure 2. Hand FE model and cylinder FE model.
Applsci 10 03265 g002
Figure 3. Definitions of the hand length (L01) based on the AIST Japanese hand dimensions database [20].
Applsci 10 03265 g003
Figure 4. Local coordinate systems constructed at the finger joints of the hand FE model.
Applsci 10 03265 g004
Figure 5. Regions on the pressure sensor sheet used in the experiment [6].
Applsci 10 03265 g005
Figure 6. Joint torques inputted into the joints of the hand FE model. (a) IP1x and DIP2x to DIP5x joints. (b) PIP2x to PIP5x joints. (c) MCP1x to MCP5x joints. (d) MCP2y to MCP5y, CM1y and CM1z joints.
Applsci 10 03265 g006
Figure 7. Regions on the hand FE model used in validation. White color denotes selected elements belonging to 23 regions.
Applsci 10 03265 g007
Figure 8. Comparison of final grasping posture while gripping a cylinder. (a) FE simulation. (b) Volunteer experiment.
Applsci 10 03265 g008
Figure 9. Comparison of the contact pressure distribution between the FE simulation result and experimental result. Red color denotes high contact pressure while blue–black color denotes low contact pressure.
Applsci 10 03265 g009
Figure 10. Comparison of the contact pressure value between the FE simulation result and experimental result. Contact pressure of reproduced subject and average ± SD of 9 male subjects were obtained from our previous study [6].
Applsci 10 03265 g010
Figure 11. Column FE model used for topology optimization.
Applsci 10 03265 g011
Figure 12. Relationship between the gripping comfort score and contact pressure concentration level.
Applsci 10 03265 g012
Figure 13. Changes in the value of objective function during the optimization process.
Applsci 10 03265 g013
Figure 14. Element density (−) distribution of the column FE model after the 7th iteration. Red color denotes high element density and the blue–black color denotes low element density. The hand model is in the initial posture.
Applsci 10 03265 g014
Figure 15. Column FE model with an element density (−) of 0.5 or above (elements with element density of below 0.5 are removed). The hand model is in the initial posture.
Applsci 10 03265 g015
Table 1. Number of elements and nodes as well as type of element used in the hand FE model and cylinder FE model.
ComponentNumberElement Type
ElementsNodes
Skin53622693Triangular shell
Subcutaneous soft tissue30,4807979Tetrahedron solid
Bones13,6334677Tetrahedron solid
Cylinder31984428Hexahedron solid
Table 2. Mechanical properties used in the hand FE model and cylinder FE model.
Density [kg/mm3]Young’s Modulus [GPa]Poisson’s RatioLiterature
Skin0.90 × 10−68.00 × 10−50.48[19,25]
Subcutaneous soft tissue0.90 × 10−6-0.48[25]
Bones1.80 × 10−6--[25]
Cylinder 1.04 × 10−62.000.39[24]
Table 3. Ogden material model parameters for subcutaneous soft tissue used in the study.
p1234
μp [GPa]15.79.32−15.7−9.32
αp−1.219.34−1.219.34
Table 4. Numbers of elements and nodes for three models used in mesh sensitivity study, average differences of contact pressures from the model with larger mesh size on the regions that were important for evaluating gripping comfort, and calculation times required for a grasping simulation.
Element SizeNumber ofAverage Differences of Contact PressuresCalculation Time [h]
SkinSubcutaneous Soft Tissue
ElementsNodesElementsNodes
4 mm7918397138,85410,0707.8% against 5 mm7.9
5 mm5362269330,480797926% against 6 mm4.2
6 mm4112208125,3276820-3.3