Article

Study on Passenger Comfort Based on Human–Bus–Road Coupled Vibration

1
School of Civil Engineering, Zhengzhou University, Zhengzhou 450001, China
2
College of Civil Engineering, Hunan University, Changsha 410082, China
3
Key Laboratory for Damage Diagnosis of Engineering Structures of Hunan Province, Hunan University, Changsha 410082, China
*
Author to whom correspondence should be addressed.
Appl. Sci. 2020, 10(9), 3254; https://doi.org/10.3390/app10093254
Submission received: 8 April 2020 / Revised: 2 May 2020 / Accepted: 3 May 2020 / Published: 7 May 2020
(This article belongs to the Special Issue Computational Methods in Vibration Problems and Wave Mechanics)

Abstract

:
Nowadays, the comfort of drivers and passengers is drawing more and more attention. The interaction between vehicles and the asphalt road can cause coupled vibration and reduce the comfort of passengers. Therefore, the research on human–vehicle–road coupled vibration and the comfort of passengers is of great importance. In this paper, the three-dimensional human–bus–road coupled vibration system is established, including the bus model, the parallel biomechanical human model with 2 degrees-of-freedom (DOF), and road surface roughness condition. The proposed coupled model was then used to study the dynamic response of the system and the comfort evaluation of the human body. In the comfort evaluation, the annoyance rate based method was proposed to consider the randomness of passenger vibration, the difference of the psychosensory vibration, and the fuzziness of evaluation indicators. Compared to the fuzzy evaluation based on the ISO 2631 standard, the proposed annoyance rate based method gives a quantitative evaluation of human comfort. Not only the degree of comfort can be evaluated, but the percentage of people feeling uncomfortable can also be obtained. Finally, parametric studies were conducted to investigate the effects of road surface roughness, interlayer bonding condition, bus weight, bus speed, and sitting position. It is found that the road surface roughness has the most significant effect on human comfort.

1. Introduction

Nowadays, much attention has been drawn to the comfort of drivers and passengers. The interaction between vehicles and asphalt road can cause coupled vibration due to the road surface roughness, which will reduce the comfort of passengers. Therefore, the research on human–vehicle–road coupled vibration and the comfort of passengers is of great importance.
Regarding the study of human–vehicle–road coupled vibration, most researchers mainly consider the vehicle–road coupled model and focus on the dynamic responses of the pavement [1,2,3]. Sawant [1] established the coupled model of vehicle and concrete pavement, considering the transverse shear and bending deformation, and analyzed the dynamic response of pavement considering the influence of slab thickness, soil modulus, and vehicle speed. Lu et al. [2] analyzed the effects of a heavy-duty truck with different speeds and axle weights on the vibration of the subgrade. The vertical stress and acceleration of subgrades in different depths were analyzed, and the simulation results were in good agreement with field measurements. Auersch [3] presented an integrated model for the computation of vehicle–track interaction and ground vibration of passing trains. A combination of the finite element method and boundary element method was used to calculate the dynamic compliance of the track on real soil.
In order to study the human response, a few human biomechanical models have been proposed [4,5]. Carroll et al. [4], according to 31 active markers on humans, proposed a biomechanical model of human front motion, which was used to study the mechanism of human–structure interaction and explained the characteristics of human balance response to the base excitation. The experiment was validated by the humans–oscillating treadmill interaction. Kim et al. [5] proposed a 5-degrees-of-freedom (DOF) model with 23 parameters to describe the human–seat interaction. The resonant frequencies yielded by the model yielded are close to experimental observations. In general, the existing research has rarely considered the human body effect in the case of human–vehicle–road coupled vibration. Therefore, the present study proposes a three-dimensional (3D) human–bus–road coupled model, including 2 DOF human biomechanical model, a 3D bus model, and a 3D road model that was considered the interlayer bonding condition.
Passenger comfort is mostly evaluated based on the evaluation standard, i.e., the International Organization for Standardization (ISO) 2631-1:1997 [6,7,8,9]. Sharma [6] used the Lagrangian method to formulate the vertical–lateral coupled mathematical models of rail/road vehicles, and used the ISO 2631 normative method to analyze the vehicle ride quality and human comfort. Wang and Li [7] established a vehicle model with 7 DOF and used the ISO 2631-1:1997 evaluation standard to study human comfort, considering factors such as the vehicle speed and vehicle weight. Wolfgang and Burgess-Limerick [8] evaluated the driver comfort of haul trucks exposed to long-term vibration. Thirty-two whole-body vibration measurements were obtained from haul trucks under a range of normal operating conditions, and the health risk assessment of drivers was carried out according to the health guidance caution zone defined by ISO 2631-1. Duarte and Melo [9] focused their study on the influence of road type and vehicle speed on the measured whole-body vibration (WBV) level, by considering three different types of vehicles driving on two different types of roads (i.e., asphalt and stone-paved roads). The recommended health and safety values in ISO 2631-1:1997 was used to study the impact of vehicle WBV on human health and comfort in a controlled environment. However, the ISO 2631-1:1997 does not consider the randomness of human body vibration and the fuzziness caused by the unclear judgment standard. Therefore, the uncertainty of human body vibration is considered, and an evaluation index of annoyance rate is proposed in this paper.
In the present study, the human–bus–road coupled vibration system is proposed to study the interaction between human, bus, and road. A bus model, a parallel biomechanical human model with 2 DOF, and a 100-m standard expressway were created to form the human–bus–road model with the road surface roughness condition simulated by the Fourier inverse transformation (FIT) method. The human–bus–road model was then used to study the dynamic response of the system and the comfort of passengers. In the comfort evaluation, the randomness of passenger vibration, the difference of the psychosensory vibration, and the fuzziness of evaluation indicators were also considered. The psychophysical statistical method was used to establish the annoyance rate model, and the proportion of unacceptable human in any environment was quantitatively analyzed. Finally, the effects of the interlayer bonding condition of the pavement, bus weight, bus speed, and sitting position on the passenger comfort were investigated.

2. Human–Bus–Road Coupled Vibration System

2.1. Human–Bus–Road Model

In order to study the interaction between human, bus, and road, the coupled vibration model is necessary. The human–bus–road model includes components such as the road model, road surface roughness, and the human–bus model. The details of each component are elaborated as follows.

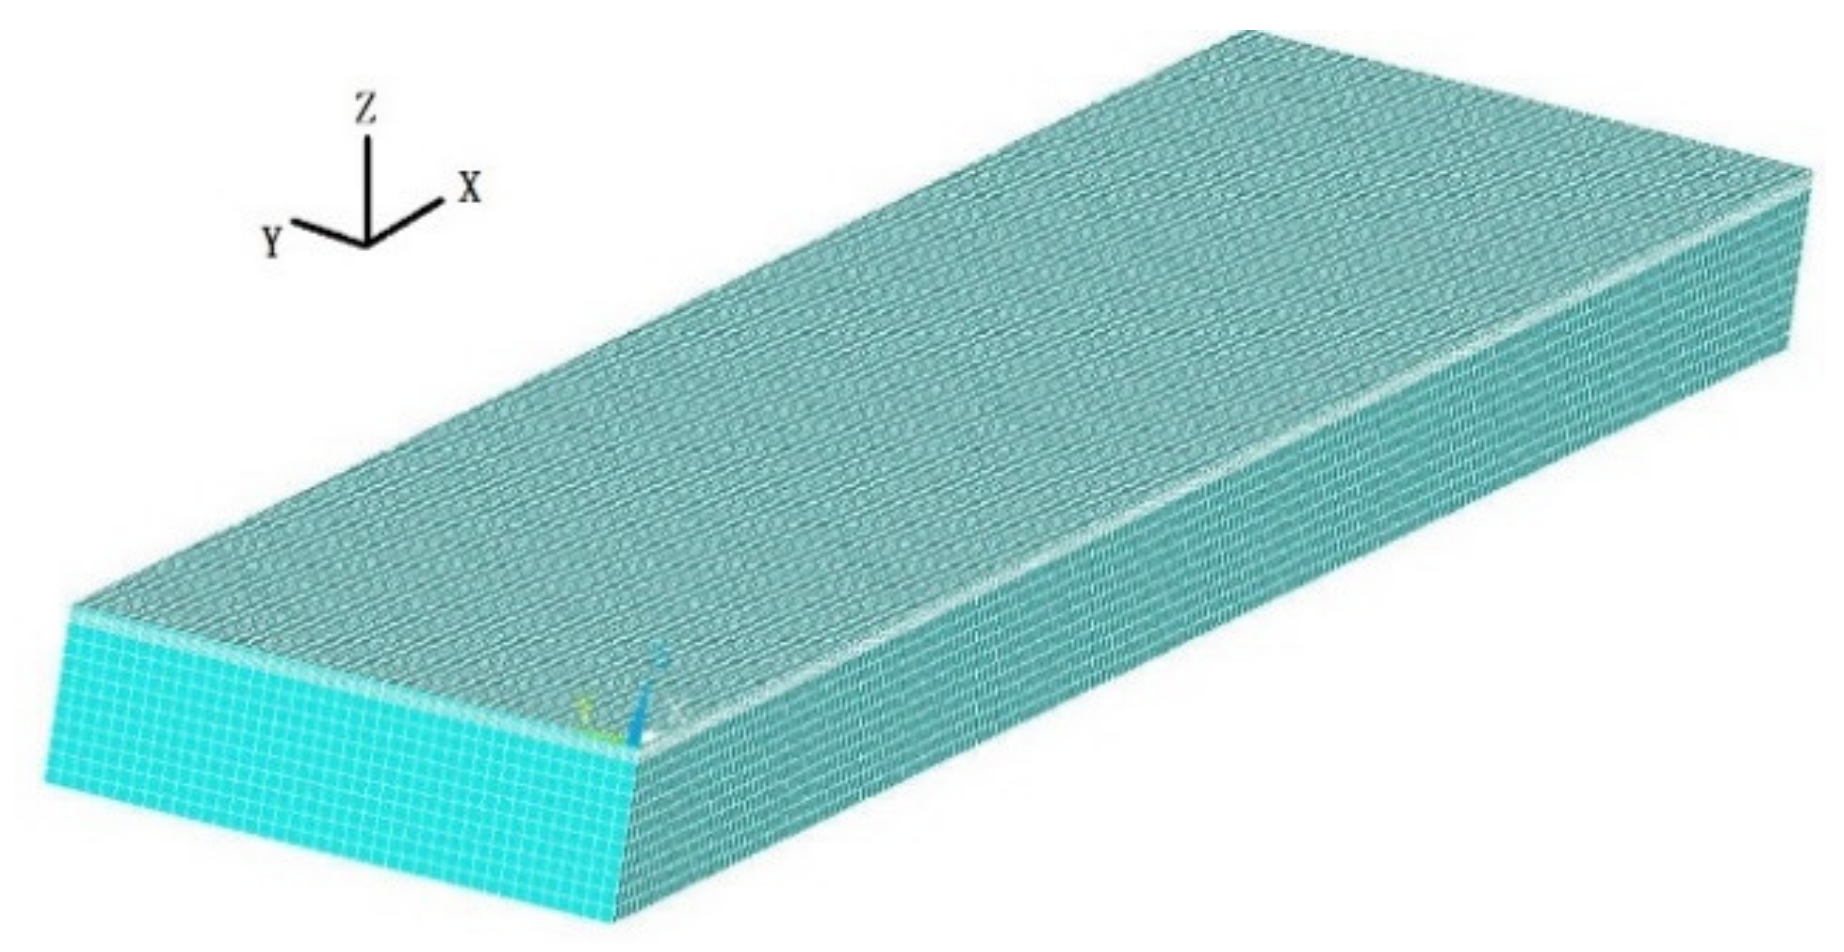
2.1.1. Asphalt Road Model

An expressway section with a length of 100 m is taken as an example to demonstrate the 3D finite element model of asphalt road [10]. The expressway has six lanes in two directions, with a width of 22.5 m and a depth of 6 m. The road is vertically divided into four structural layers, including the surface layer, base, subbase, and soil foundation.
The asphalt road model is a distributed parameter system and discretized using the finite element method. The equation of motion of the asphalt road is expressed as follows:
M r Z ¨ r t + C r Z ˙ r t + K r Z r t = F r b t
where M r , C r , and K r are the mass matrix, damping matrix, and stiffness matrix of the asphalt road, respectively; F r b t is the vector of the wheel–road contact forces on the road; Z r t is the displacement vector of the asphalt road.

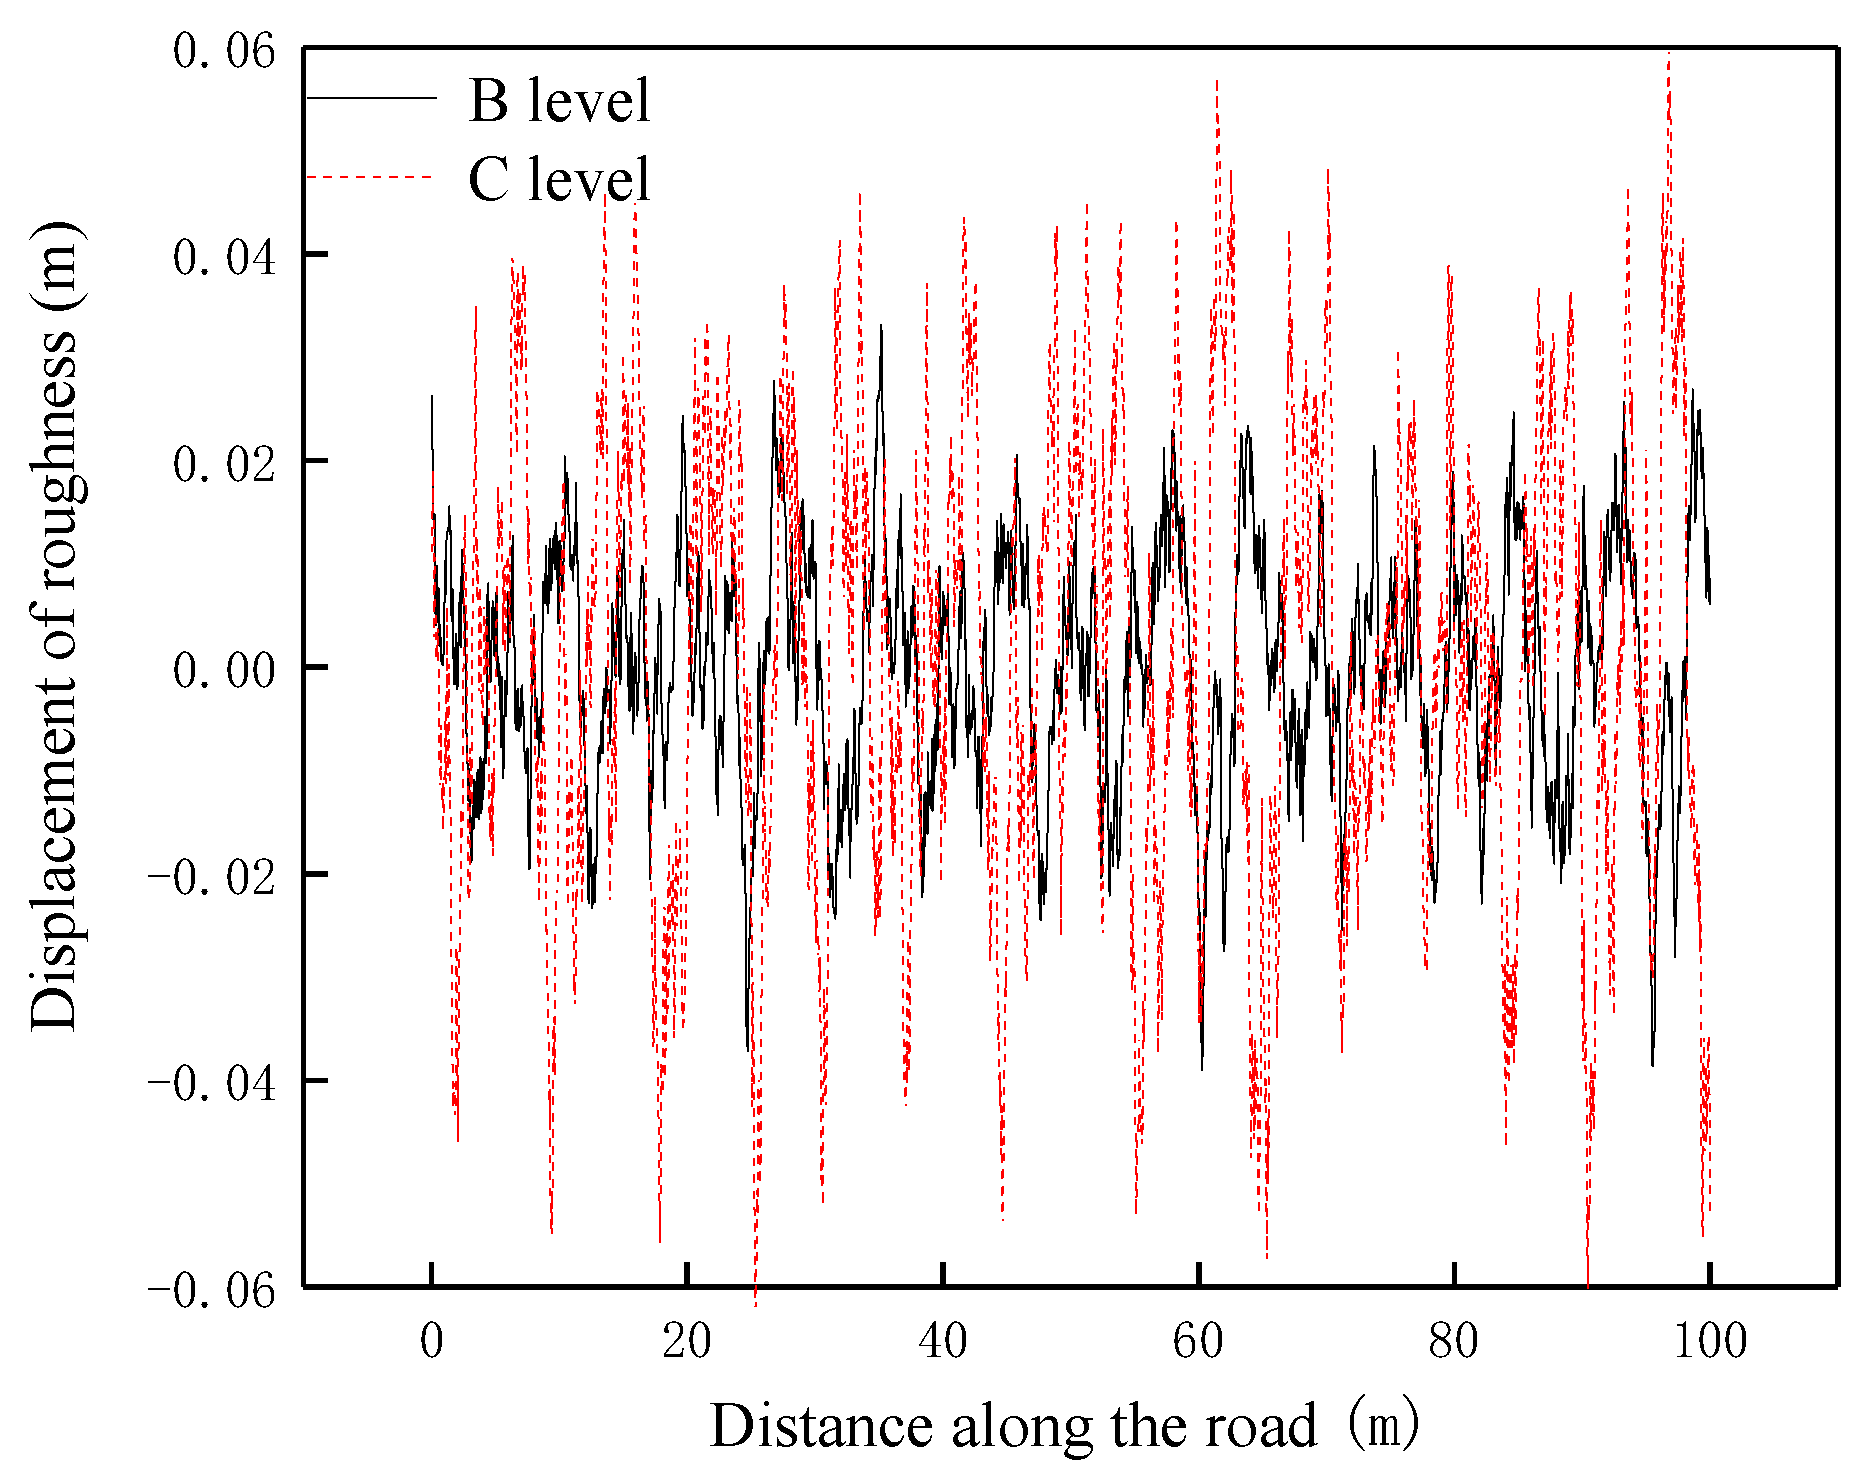
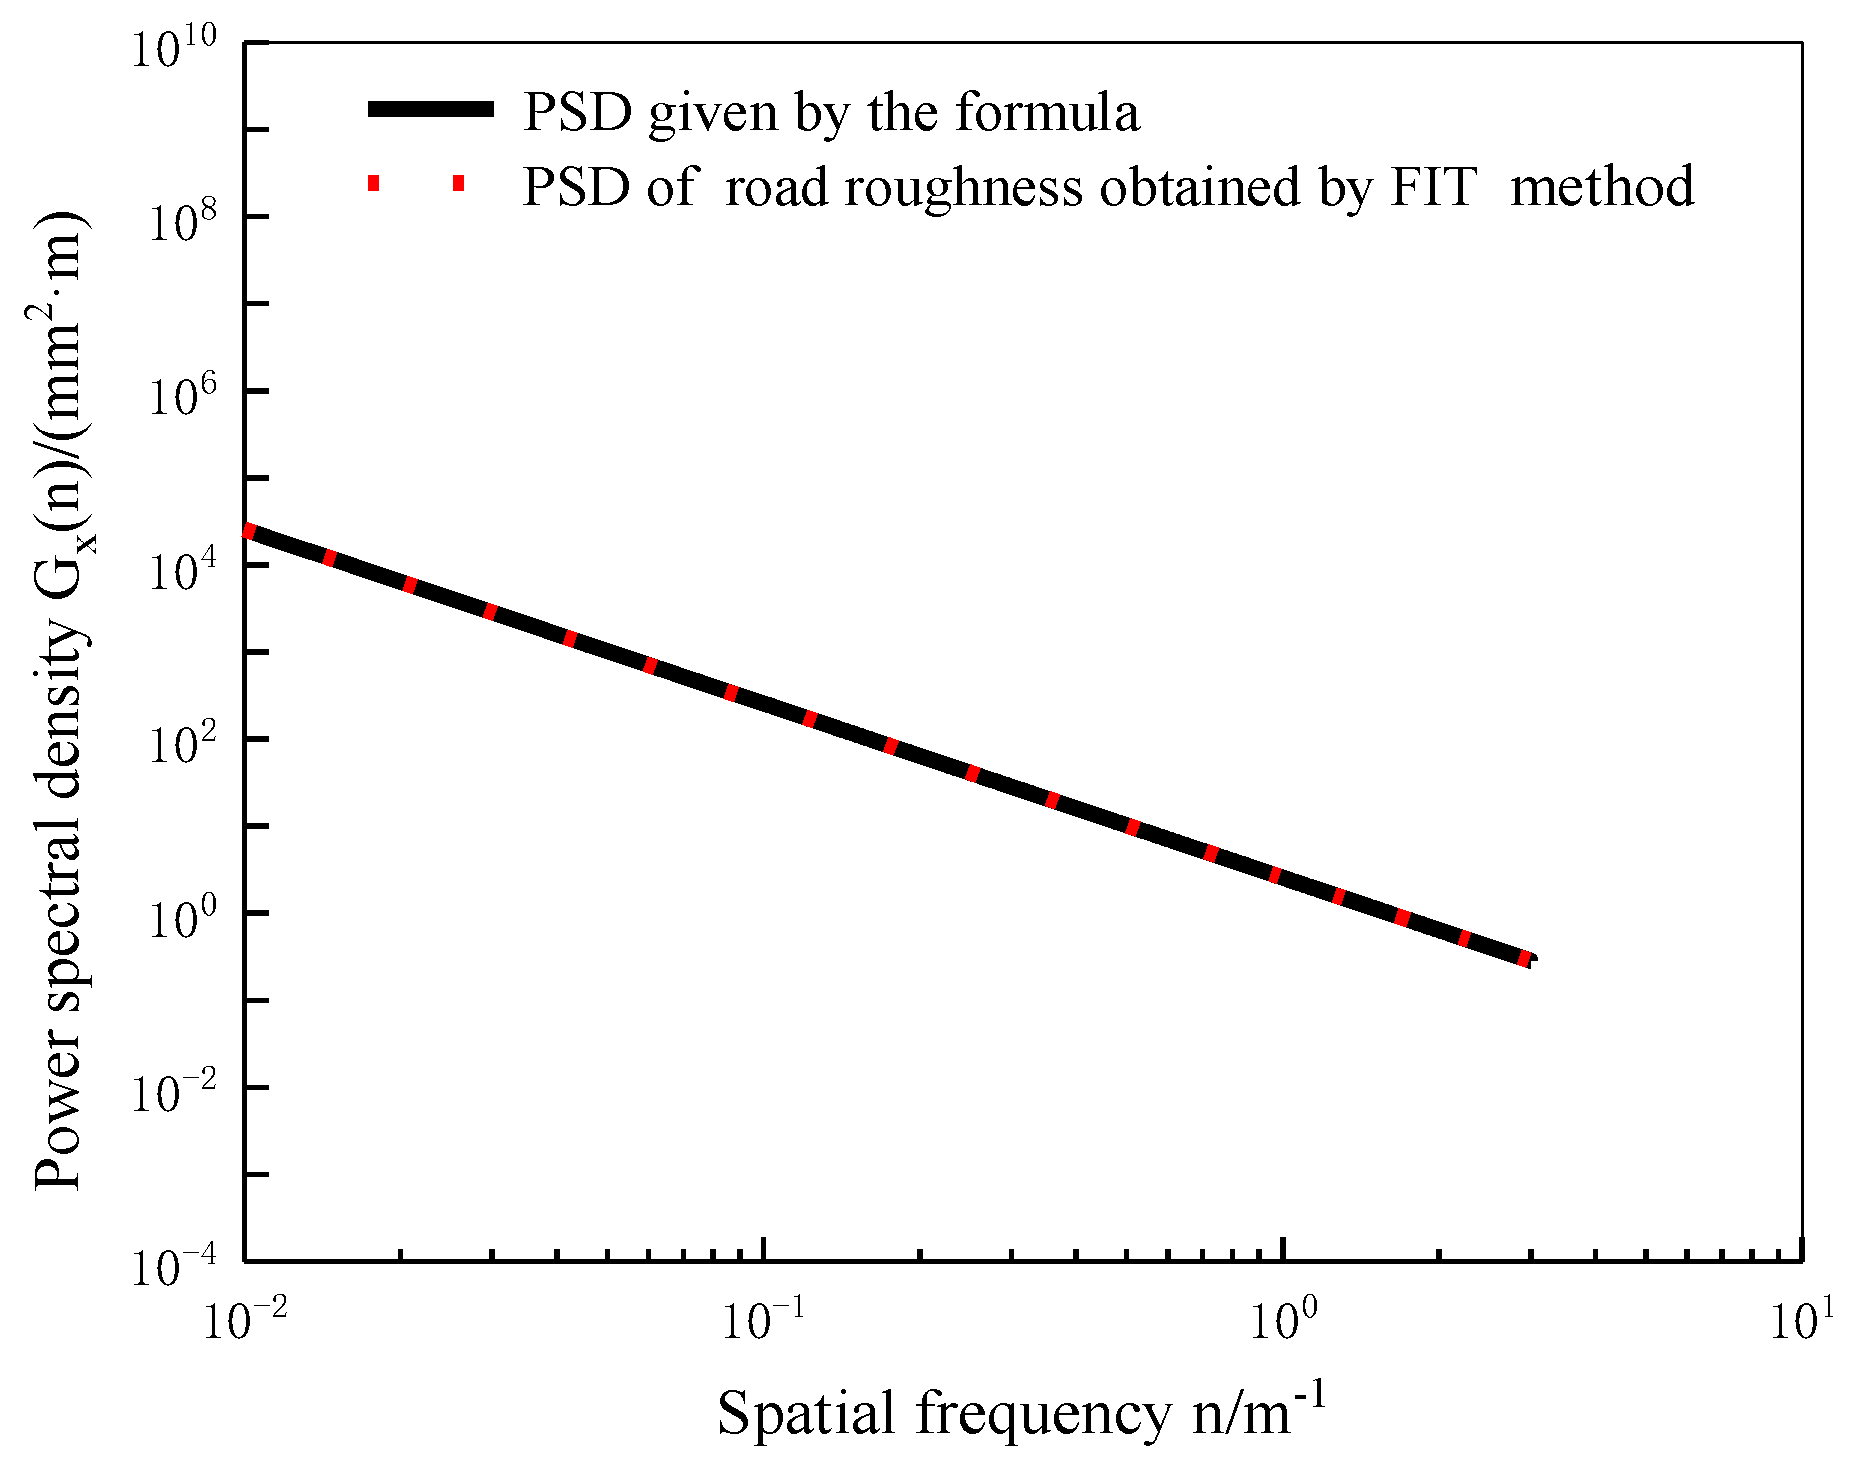
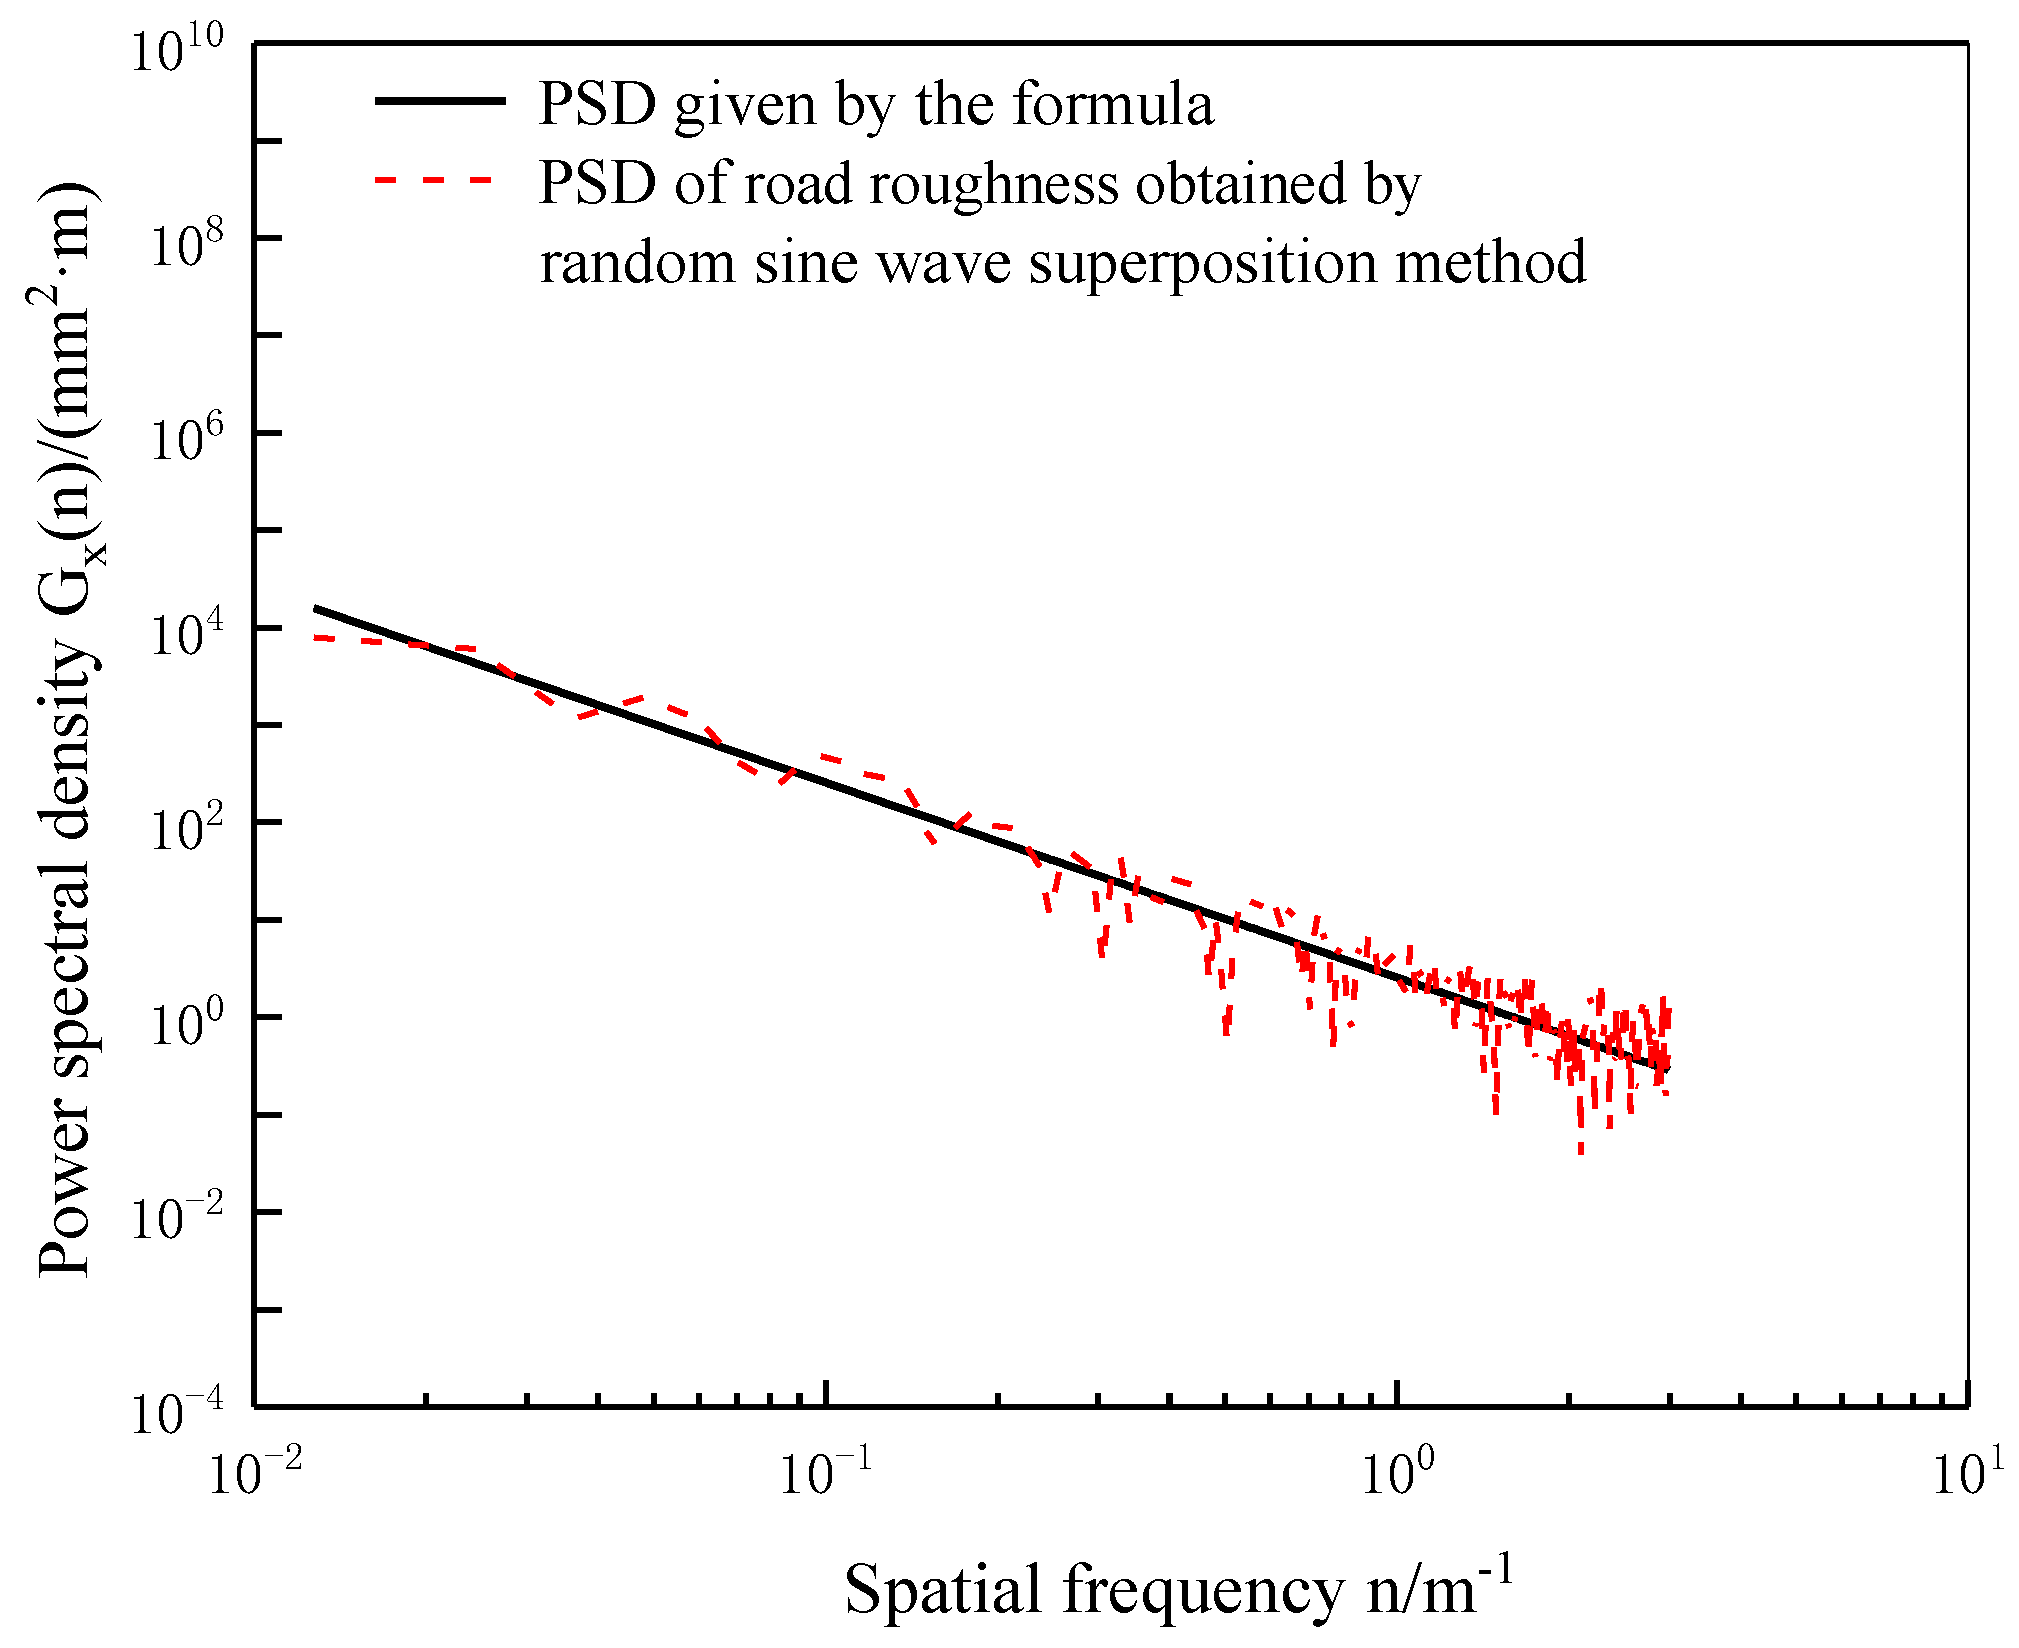
2.1.2. Road Surface Roughness Condition

The most commonly used methods to simulate the road surface roughness are the random sine wave superposition method and the Fourier inverse transformation (FIT) method [11,12]. The present study adopted the FIT method to simulate the road surface roughness. The power spectral density (PSD) of the road surface profile adopted in the International Organization for Standardization is [13]
G x n = G x n 0 n n 0 W
where n is the spatial frequency; n0 is the discontinuity spatial frequency; G x n 0 is the reference PSD of the spatial frequency, also known as the roughness coefficient; w is the frequency index; G x n is the PSD function for the road surface elevation (m3/cycle).
After G x n is obtained, the spectral modulus X k of the road surface roughness sequence can be obtained as
X k = N 2 Δ l G x n k   ( k = 0 , 1 , , N 2 )
where Δ l is the sampling distance, and N is the number of sampling points.
The spectral complex sequence X k can be obtained by performing the random transformation on X k . The discrete Fourier transform is then applied on X k to obtain the random roughness x m in the time domain as
x m = 1 N k = 0 N 1 X k e i 2 π k m N       m = 0 , 1 , , N 1  
where   i is an imaginary unit; X k is the spectrum value; x m is the discrete value of road surface roughness; subscripts k and m are related to sampling point N.

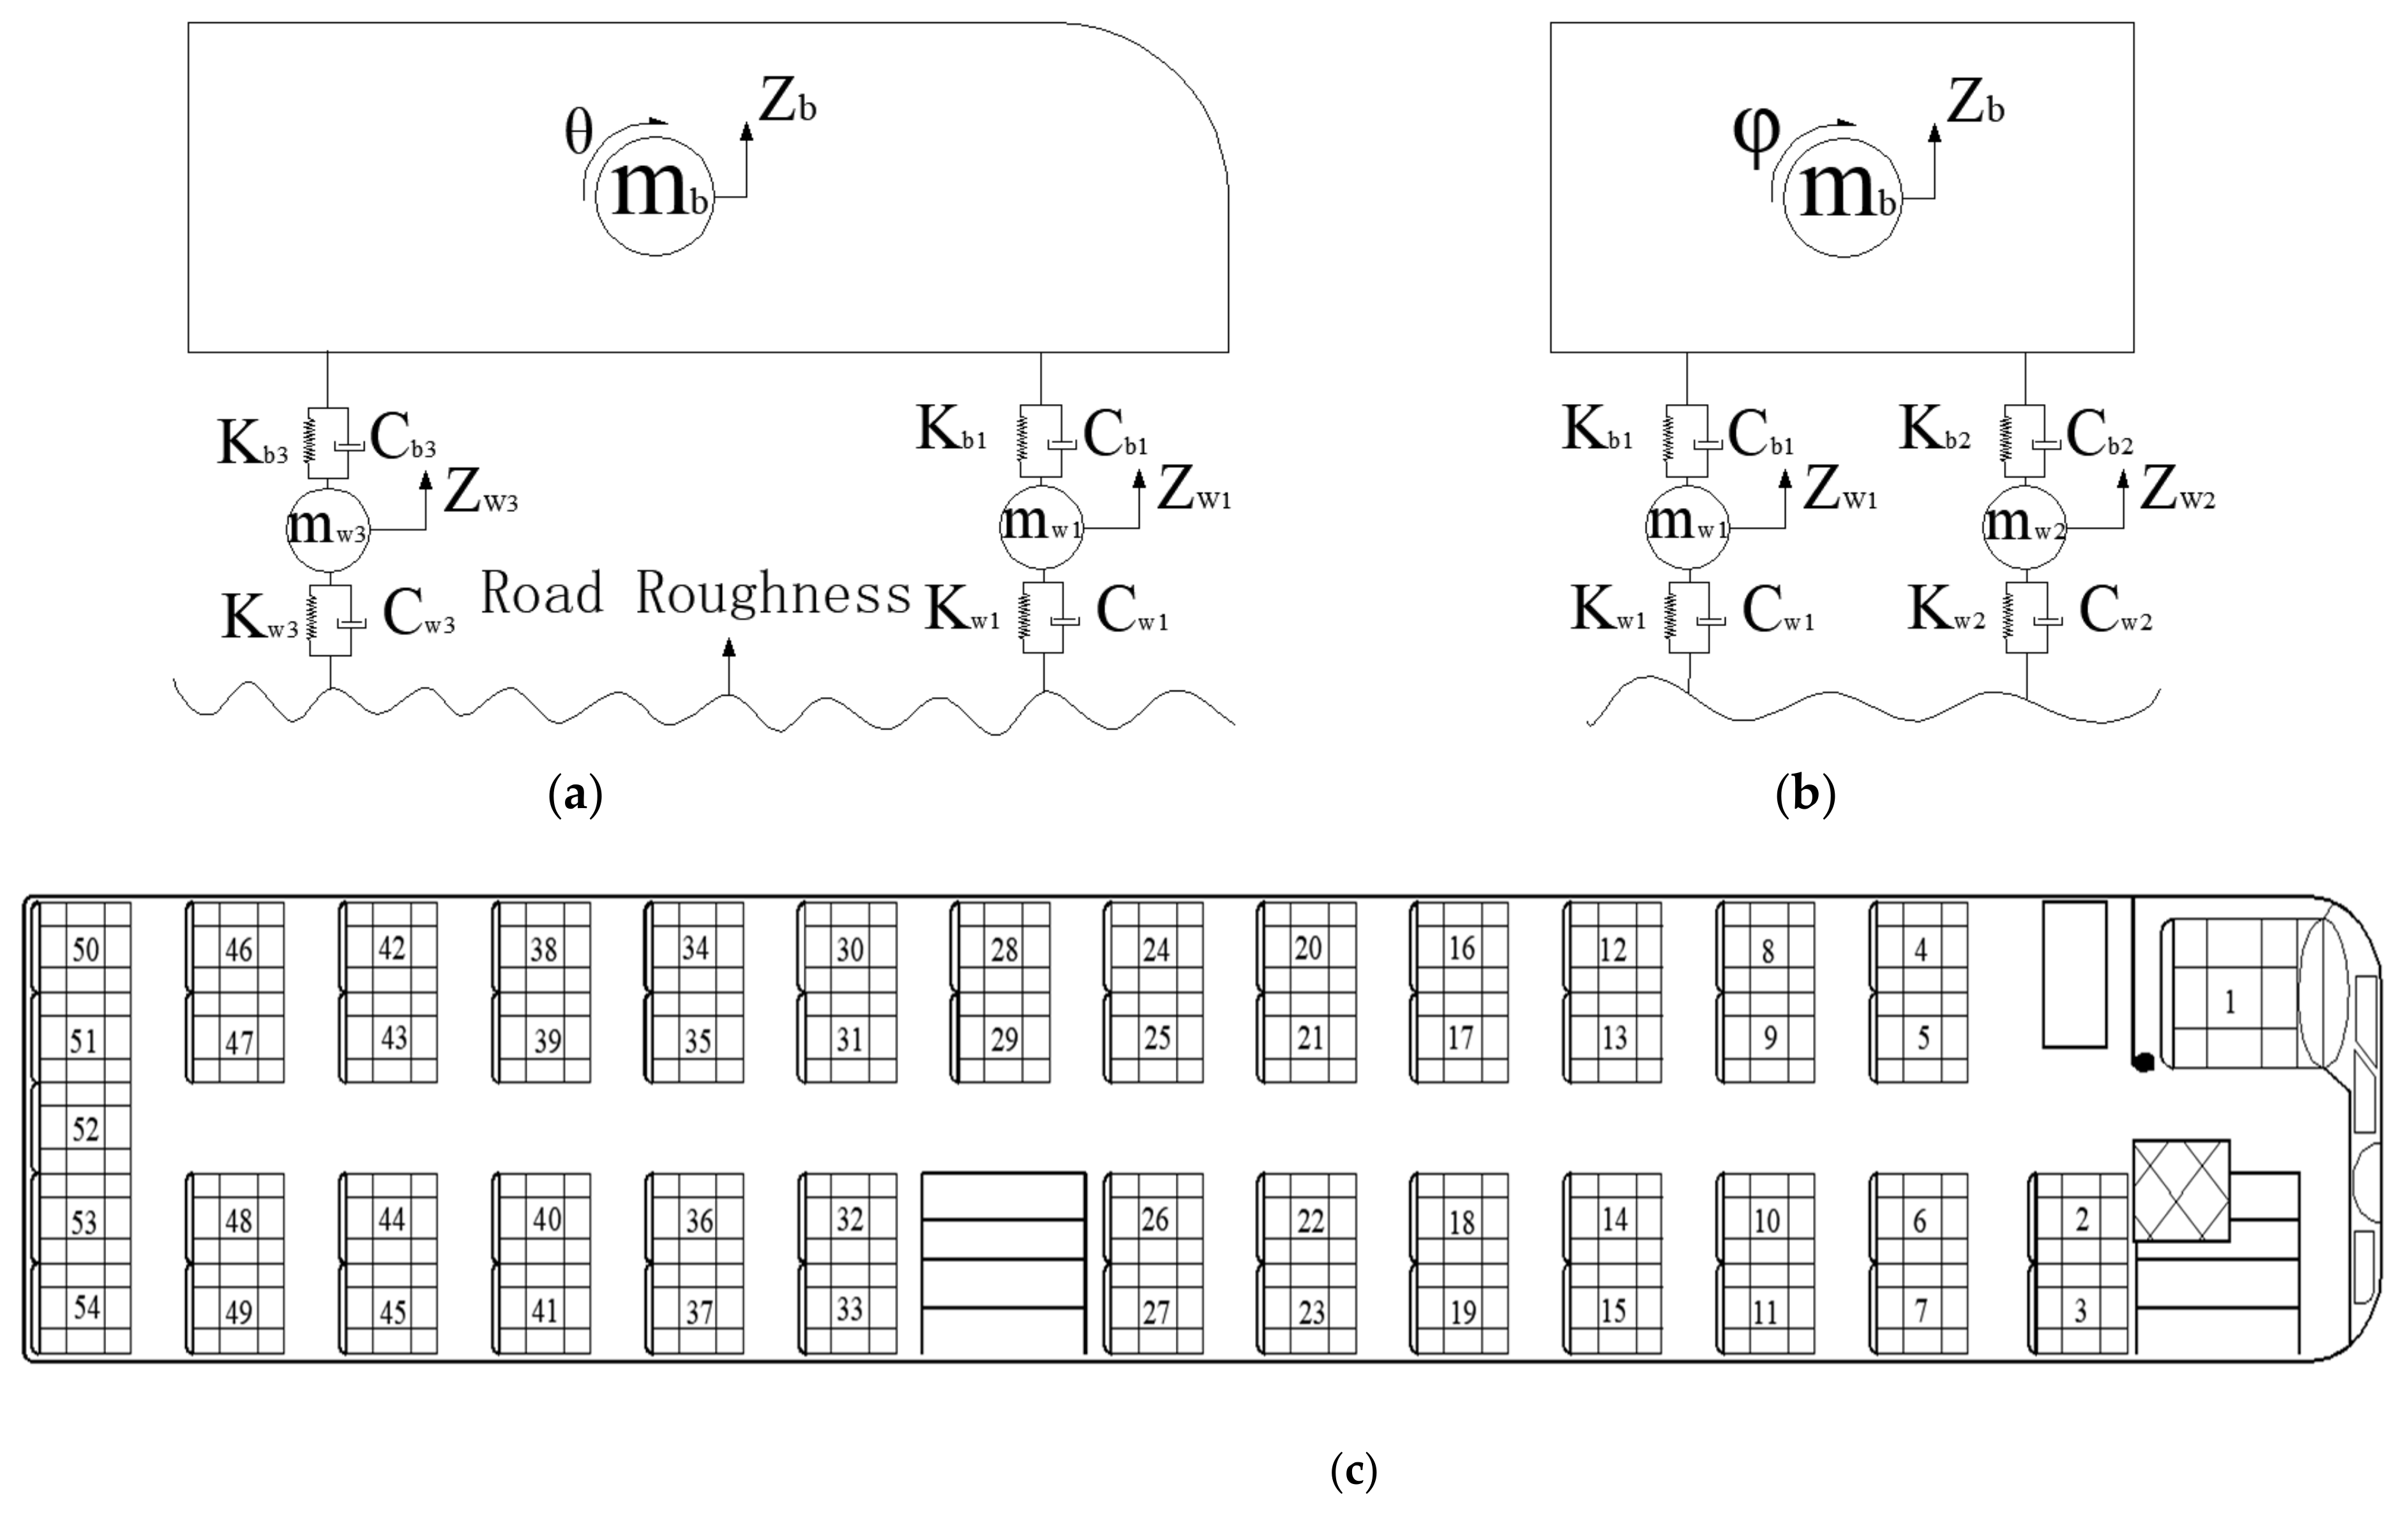
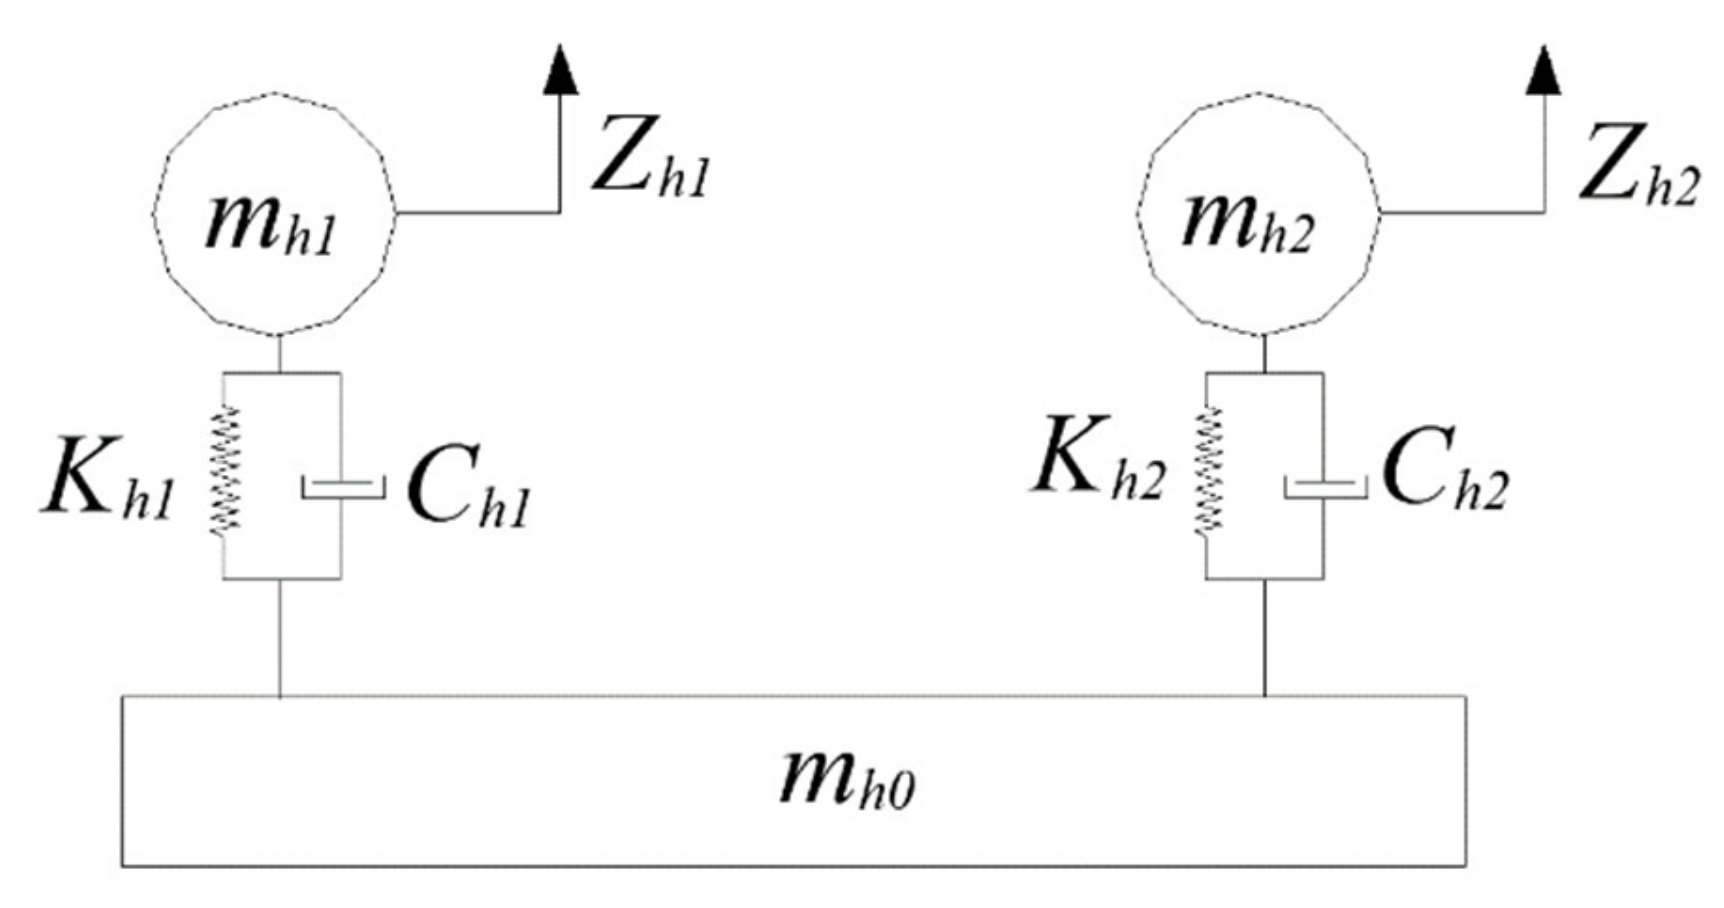
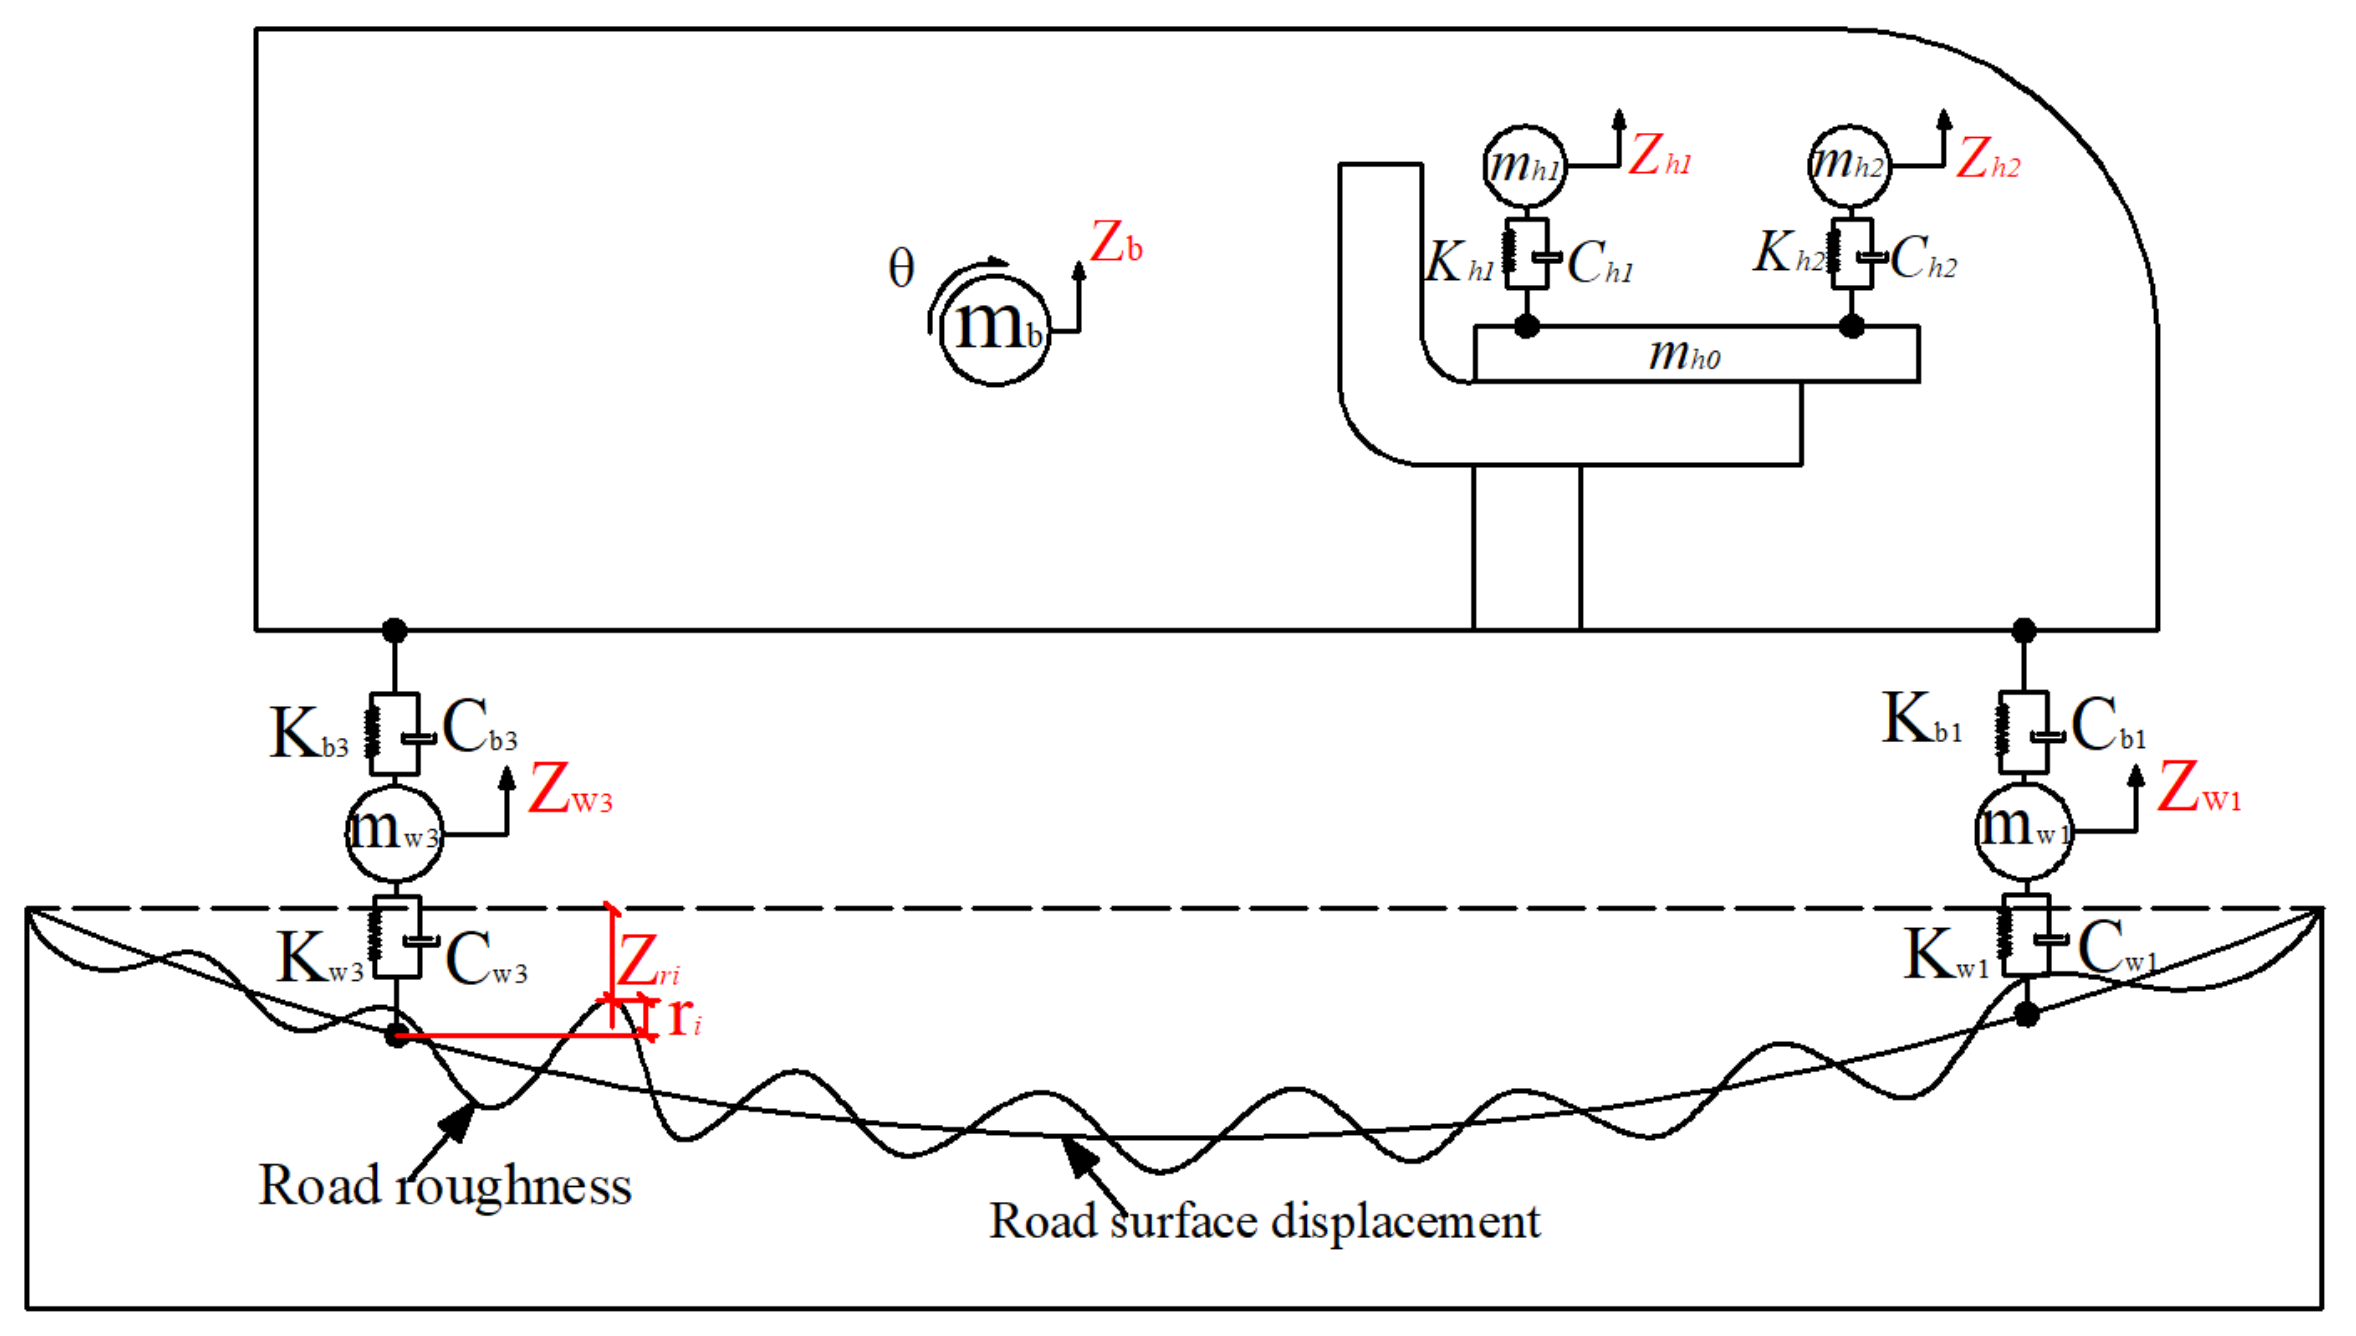
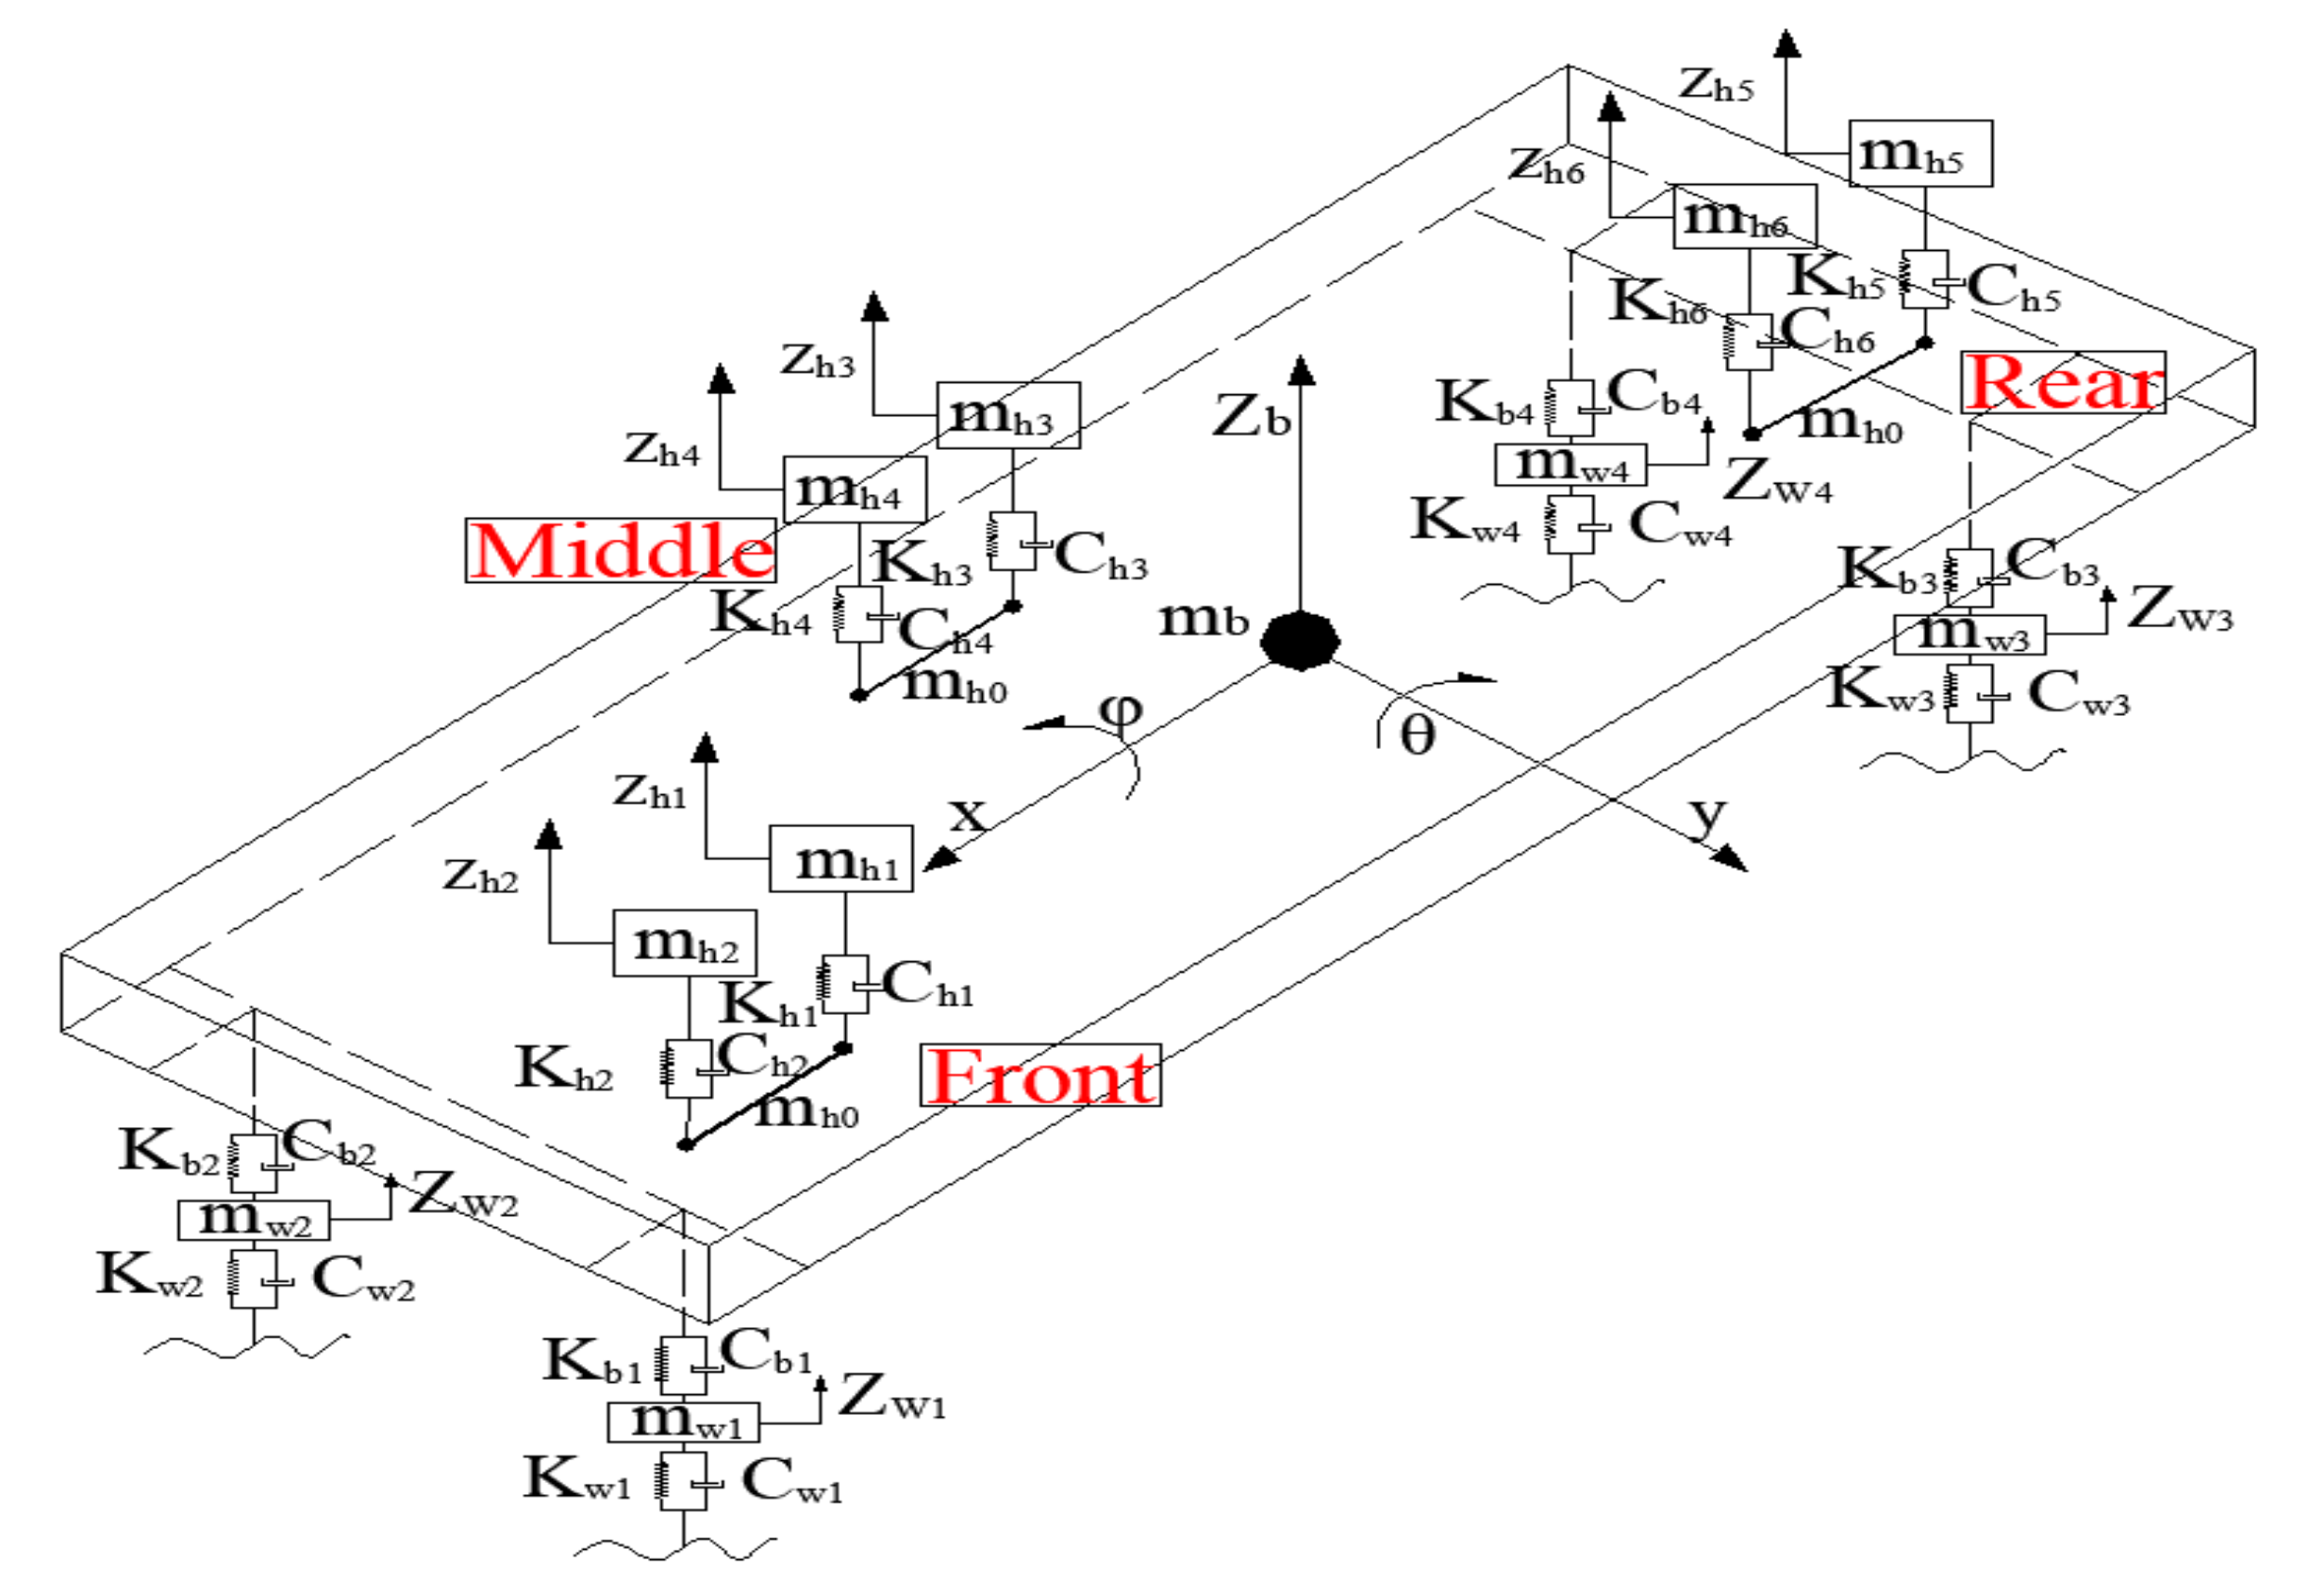
2.1.3. 3D Human–Bus Model

The bus model is comprised of five rigid bodies, i.e., one for the bus body and four for the four wheels, as shown in Figure 1. The bus body is assigned three degrees of freedom with respect to its gravity center: the vertical displacement (Zb), the rotation about the width-axis (pitch angle θ), and the rotation about the length-axis (roll angle φ ). Each wheel as one rigid body is assigned one degree in the vertical displacement ( Z w i ). There are 7 DOF in total for the bus [14,15]. In order to consider the spatial effect of passengers on the bus, a refined bus body model with seat arrangement is created, as shown in Figure 1c, which is applicable to study the response of passengers in different locations on the bus. The human body is connected to the bus body using the spring-damper system. It is worth to note that the road surface roughness is the main source for the vehicle vibration in the human–bus–road vibration. Therefore, the flexibility of the bus body and the engine vibration is not considered in this study, although they are also factors affecting passenger comfort.
According to the D’Alembert principle, the equation of motion for the bus is given as
M b Z ¨ b t + C b Z ˙ b t + K b Z b t = F b G + F b r t + F b h t
where M b , C b , and K b are the mass, damping, and stiffness matrixes of the bus, respectively; Z b t is the displacement vector of the bus; F b r t is the vector of the wheel–road contact forces on the bus; F b h t is the vector of contact forces between the bus body and the human body; F b G is the self-weight vector of the bus.
For the purpose of comfort evaluation, a human biomechanical model with two vertical DOF is adopted for each passenger, as shown in Figure 2. The biomechanical model is created based on the relationship between the main resonance frequency and the mechanical characteristics of the human body [16,17].
The equation of motion for all the passengers on the bus is expressed as
M h Z ¨ h t + C h Z ˙ h t + K h Z h t = F h G + F h b t
where M h , C h , and K h are the mass, damping, and stiffness matrices of the human, respectively; Z h t is the displacement vector of the human body; F h b t is the vector of the contact force between the bus body and the human body; F h G is the gravity force vector of the human. If n passengers are considered, the rank of the matrix or vector is 2n.

2.2. Differential Equations of Human–Bus–Road Coupled Vibration

The human–bus–road coupled system can be divided into three subsystems, i.e., the human, bus, and road. The interaction between the wheel and road surface and the interaction between the bus body and the human body are achieved through the contact points. That is, the displacement compatibility condition and the force equilibrium condition are used in the process of solving the differential equation of vibration [18]. It is noteworthy that only the vertical displacement and force are transmitted between the bus wheel and the road surface, which is the same for the interaction between the human body and the bus body.
(1) Displacement compatibility condition. The vertical displacement of the human–bus–road model is shown in Figure 3. Assuming that the wheel always keeps close contact to the road surface and the human body is always attached to the bus body, the relative vertical displacements are as follows:
Δ b r i ( t ) = z w i ( t ) z r i ( t ) r i x
Δ b h j ( t ) = z b ( t ) z h j ( t )
where Z w i t is the vertical displacement of the ith-wheel; Z r i t is the vertical displacement of the road at the point where the ith-wheel locates; Z b t is the vertical displacement of the bus body; Z h j t is the displacement of the jth-human body; r i x is the road surface roughness at the contact point; Δ b r i t is the relative vertical displacement between the road surface and the ith-wheel; Δ b h j t is the relative vertical displacement between the bus body and the jth-human body.
(2) Force equilibrium condition: The interaction force follows Newton’s third law, that is, the contact forces between wheel and road, between the bus body and the human body, are equal in magnitude and opposite in the direction:
F b r i ( t ) = F r b i ( t ) = c w i ( Δ ˙ b r i ( t ) ) + k w i ( Δ b r i ( t ) )
F b h j ( t ) = F h b j ( t ) = c h j ( Δ ˙ b h j ( t ) ) + k h j ( Δ b h j ( t ) )
where F b r i and F r b i are the contact force between the road surface and the ith-wheel; F b h j and F h b j are the contact force between the bus body and the jth-human body; C W i is the ith-wheel damping; k W i is the ith-wheel stiffness; C h j is the jth-human body damping; k h j is the jth-human body stiffness; Δ ˙ b r i t and Δ ˙ b h j t are the first-order derivative of Δ b r i t and Δ b h j t to time.
These above motion equations of the human, bus, and road are coupled through the displacement compatibility condition and force equilibrium condition. The combined equation is as follows:
M r 0 0 0 M b 0 0 0 M h Z ¨ r t Z ¨ b t Z ¨ h t + C r + C r r C r b 0 C b r C b C b h 0 C h b C h Z ˙ r t Z ˙ b t Z ˙ h t + K r + K r r K r b 0 K b r K b K b h 0 K h b K h Z r t Z b t Z h t = F r b t F b G + F b r t + F b h t F h G + F b r t
In comparison with Equations (1), (5), and (6), c r r , c r b , c b r , K r r , K r b , K b r , F r b and F b r are due to the wheel–road contact forces; c b h , c h b , K b h , K h b , F b h and F h b are due to the interaction forces between the bus body and the human body. When the bus is moving on the road, the positions of contact points, as well as the values of the forces, change with the bus location.
Human–bus–road interaction is a complex time-varying process, and the stepwise iterative method can be used to obtain numerical solutions in the time domain. Using the Newmark-β method, the time t is divided into n equal parts, and the displacement, velocity, and acceleration at time t n are calculated according to the terms at the previous time t n 1 . With the known displacement, velocity, and acceleration at the initial time t 0 , the dynamic response at the time t n can be obtained.
In the iterative calculation, each step is subjected to the convergence judgment. The displacement and force convergence criteria of the stepwise iterative method are expressed as
Z i Z i 1 Z i ε
F i F i 1 F i ε
where Z i , Z i 1 are the displacement vectors of the road at its contact position with the wheel at the ith and i−1th iterations, respectively. F i 1 , F i are the force vectors at the contact point between the road and the wheel at the ith and i−1th iterations, respectively. F i represents the norm of   F i . ε is the control parameter, adopted as 0.01.

3. Comfort Evaluation of Human Body

3.1. Calculation of Root Mean Square (RMS) Acceleration

The human body mainly vibrates in three directions, i.e., vertical, roll, and pitch. The acceleration time-history in each direction can be calculated by the above human–bus–road coupled program, and the weighted acceleration root mean square (RMS) of the human body is calculated using the ISO 2631-1:1997 standard method [19]. For convenience, it is assumed that the pitch and roll accelerations of the human body are consistent with those of the bus seat. However, the connection between the 2 DOF human body and the seat in the vertical direction is simplified as two spring-damping systems. Therefore, the vertical acceleration of the human body is not equal to that of the bus body. The total weighted acceleration RMS is obtained by multiplying the average acceleration of each direction with the corresponding weight coefficient k i .
a v = i = 1 N k i 1 T 0 T a v i 2 t d t 2 = k 1 1 T 0 T a v 1 2 t d t 2 + k 2 1 T 0 T a v 2 2 t d t 2 + k 3 1 T 0 T a v 3 2 t d t 2
where N is the total DOF number; k i is the weight coefficient of the i-th DOF; k 1 , k 2 , and k 3 are weight coefficients of the human vertical, roll, and pitch vibration, respectively, where k 1 is 1, k 2 is 0.40 m/rad, and k 3 is 0.63 m/rad.

3.2. Comfort Evaluation Based on ISO 2631 Standard

The ISO 2631 standard is commonly used to evaluate human comfort in terms of the obtained weighted RMS of human accelerations, as shown in Table 1 [20]. The standard classifies the human reaction to vibration into six levels based on the acceleration values. The lower and upper bounds of each level are determined based on the assumption that all the passengers have the same feeling on the vibration, which is actually not true. The reaction or feeling of vibration differs from human to human. Therefore, it is necessary to consider the uncertainty due to individual diversity.

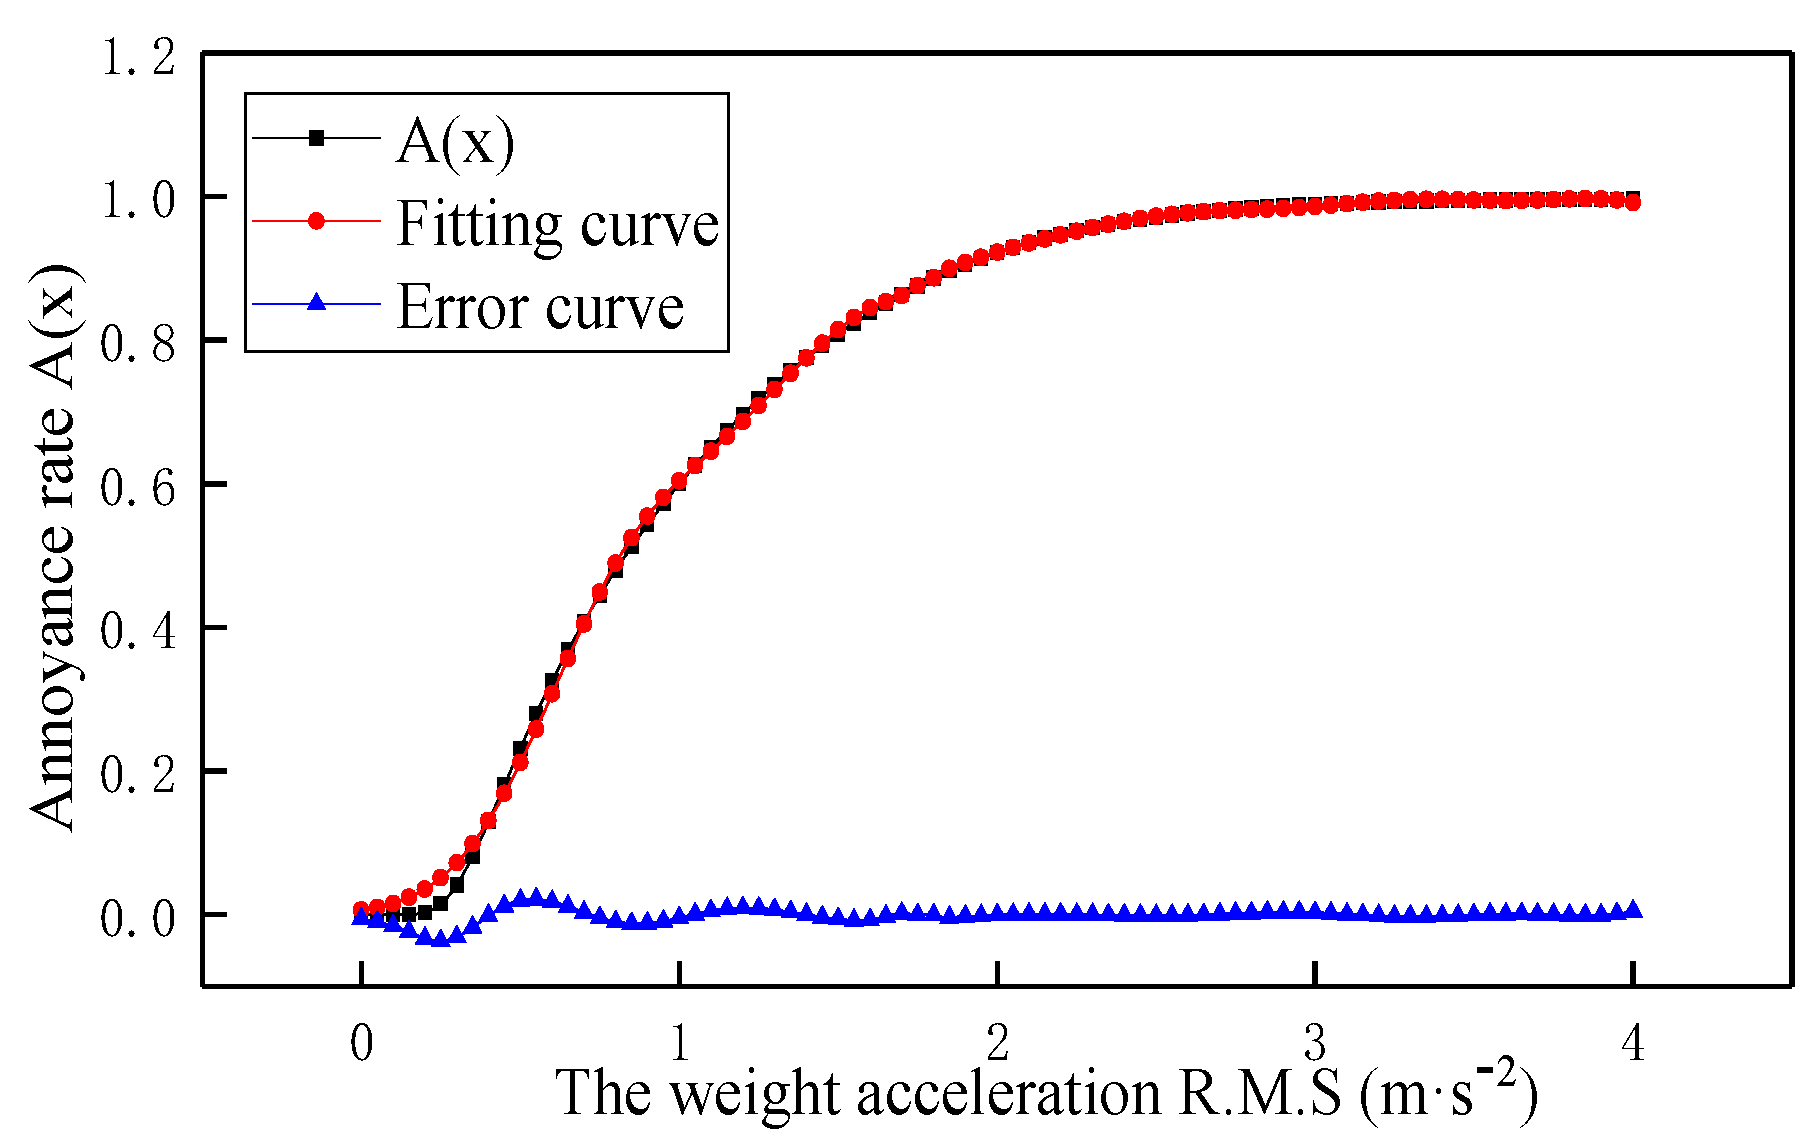
3.3. Comfort Evaluation Based on Annoyance Rate

In order to consider the uncertainty caused by individual diversity, the annoyance rate model was adopted [21]. The model uses the psychophysical signal detection theory to analyze the randomness of the human perception of vibration. The model creates the relationship between the fuzzy membership and the human acceleration and analyzes the fuzziness of human perception [22,23]. The annoyance rate model is then used to evaluate passenger comfort, considering the human variety.
The annoyance rate refers to the percentage of humans who feel unacceptably annoyed. The human subjective response to vibration includes two steps: perceive the vibration signal (randomness) and make judgments on the sensed signal (fuzziness). According to the centralization statistical method and the principle of the psychological annoyance rate, the annoyance rate of any vibration acceleration can be expressed as
A ( x ) = u min w ( x | u ) v ( u ) d u
where w ( x | u ) characterizes the sensitivity variation of the human body; v u is the fuzzy membership function; A x is the annoyance rate.
The sensitivity varies from person to person, which can be described in the form of a lognormal distribution.
w ( x | u ) = 1 2 π u σ exp ( ln u x + 0.5 σ 2 ) 2 2 σ 2
where u is the vibration intensity; x represents a statistical average of u; δ is the coefficient of variation; σ 2 is the variance, σ 2 = l n 1 + δ 2 . Equation (16) gives out the vibration acceleration felt by a person under a certain vibration stimulation.
The Fechner’s law given in psychophysics reveals that the membership of subjective response v u is proportional to the logarithm of the vibration acceleration rate u [24,25], such that
v ( u ) = a ln u + b
where Equation (17) establishes a relationship between the subjective human response and the objective vibration acceleration.

4. Case Study

4.1. Description of Numerical Example

A numerical study was conducted to investigate human comfort under different road levels. Road surface roughness is the main excitation of human–bus–road coupled vibration, which has a great impact on human comfort. The parameters of the numerical example: the road is a two-way highway with six lanes, the interlayer friction coefficient of the asphalt pavement is 0.5, the bus speed is 36 km/h, and the weight of the bus is 15.89 t. The influence of four road surface roughness levels, i.e., Levels A, B, C, and D on human–bus–road dynamic response is analyzed.
The asphalt road model is established according to the layered method. For the asphalt road with large thickness and high modulus of elasticity, the surface layer, base, and subbase can be regarded as linear elasticity, and the stress–strain relationship meets Hooke’s law. The soil foundation is regarded as an elastoplastic body, and its stress–strain relationship follows the Drucker–Prager criterion. Since the elastic modulus of the surface layer, base, and subbase are close, the interlayer contact can be considered as flexible–flexible contact. Assuming that the elastic modulus of the subbase is much higher than that of the soil foundation, the contact between the subbase and the soil foundation can be considered as rigid–flexible contact. Each layer is simulated with the Solid186 element in the ANSYS program. The contact between layers is simulated using a pair of contact elements, i.e., Targe170 (3D) and Conta173 (3D), where the surface with larger stiffness is the target surface [26]. The road model consists of 162,000 elements and 178,006 nodes. The boundary conditions of the road are determined by Saint-Venant’s principle. The nodes of the road model are symmetrically constrained in X and Y directions, and the nodes on the bottom surface of the soil foundation are fixed. The finite element model of the asphalt road is shown in Figure 4. The structural parameters of the asphalt road are shown in Table 2.
The road surface roughness is classified into eight levels, i.e., A–H [27]. B and C levels are the most common road surface conditions, accounting for a large proportion. For demonstration, the road surface roughness of a 100-m road in B and C levels is generated with a sampling distance of 0.05, as shown in Figure 5.
The PSD of road surface roughness is obtained using the FIT method, as shown in Figure 6. Meanwhile, the PSD using the random sine wave superposition method is also obtained, as shown in Figure 7. It is found that the PSD obtained from the random sine wave superposition method has a large error, especially at high frequencies, while the PSD obtained from the FIT method is consistent with the value calculated from Equation (4).
The human–bus model with 13 DOF is shown in Figure 8. The bus has 7 DOF, that is, pitch, roll, vertical motion of the bus body, and vertical motions of the four wheels. Three passengers are considered on the bus with two vertical DOF for each passenger. The bus parameters are based on the intercity bus IK-301 in the literature, and the mass, stiffness, and damping values are shown in Table 3 [28]. The human biomechanical model is composed of three parts as mh0, mh1, and mh2 in Figure 2. It is noteworthy that each part does not correspond to the actual human body parts. The parameters referred from the literature [29] are mh0 = 8.2, mh1 = 33.7, mh2 = 18.1 kg, with a total mass of 60.0 kg. The spring stiffness and damping parameters are kh1 = 32,178, ch1 = 714, kh2 = 505,114, and ch2 = 543 Nsm−1.
The vehicle flow on the road can be simulated as a random process [30]. The current common methods for simulating vehicle space are Lognormal distribution, Weibull distribution, and Gamma distribution [31]. The Lognormal distribution with the advantages of simple calculation and good fitting results is used here to simulate the random traffic flow on the road as
f ( x ) = 1 2 π σ ln x exp ln x μ ln x 2 2 σ ln x 2
where x is the vehicle spacing; l n x follows the normal distribution, i.e., l n x ~ N μ l n x , σ l n x 2 ; μ l n x is the average; σ l n x is the standard deviation.

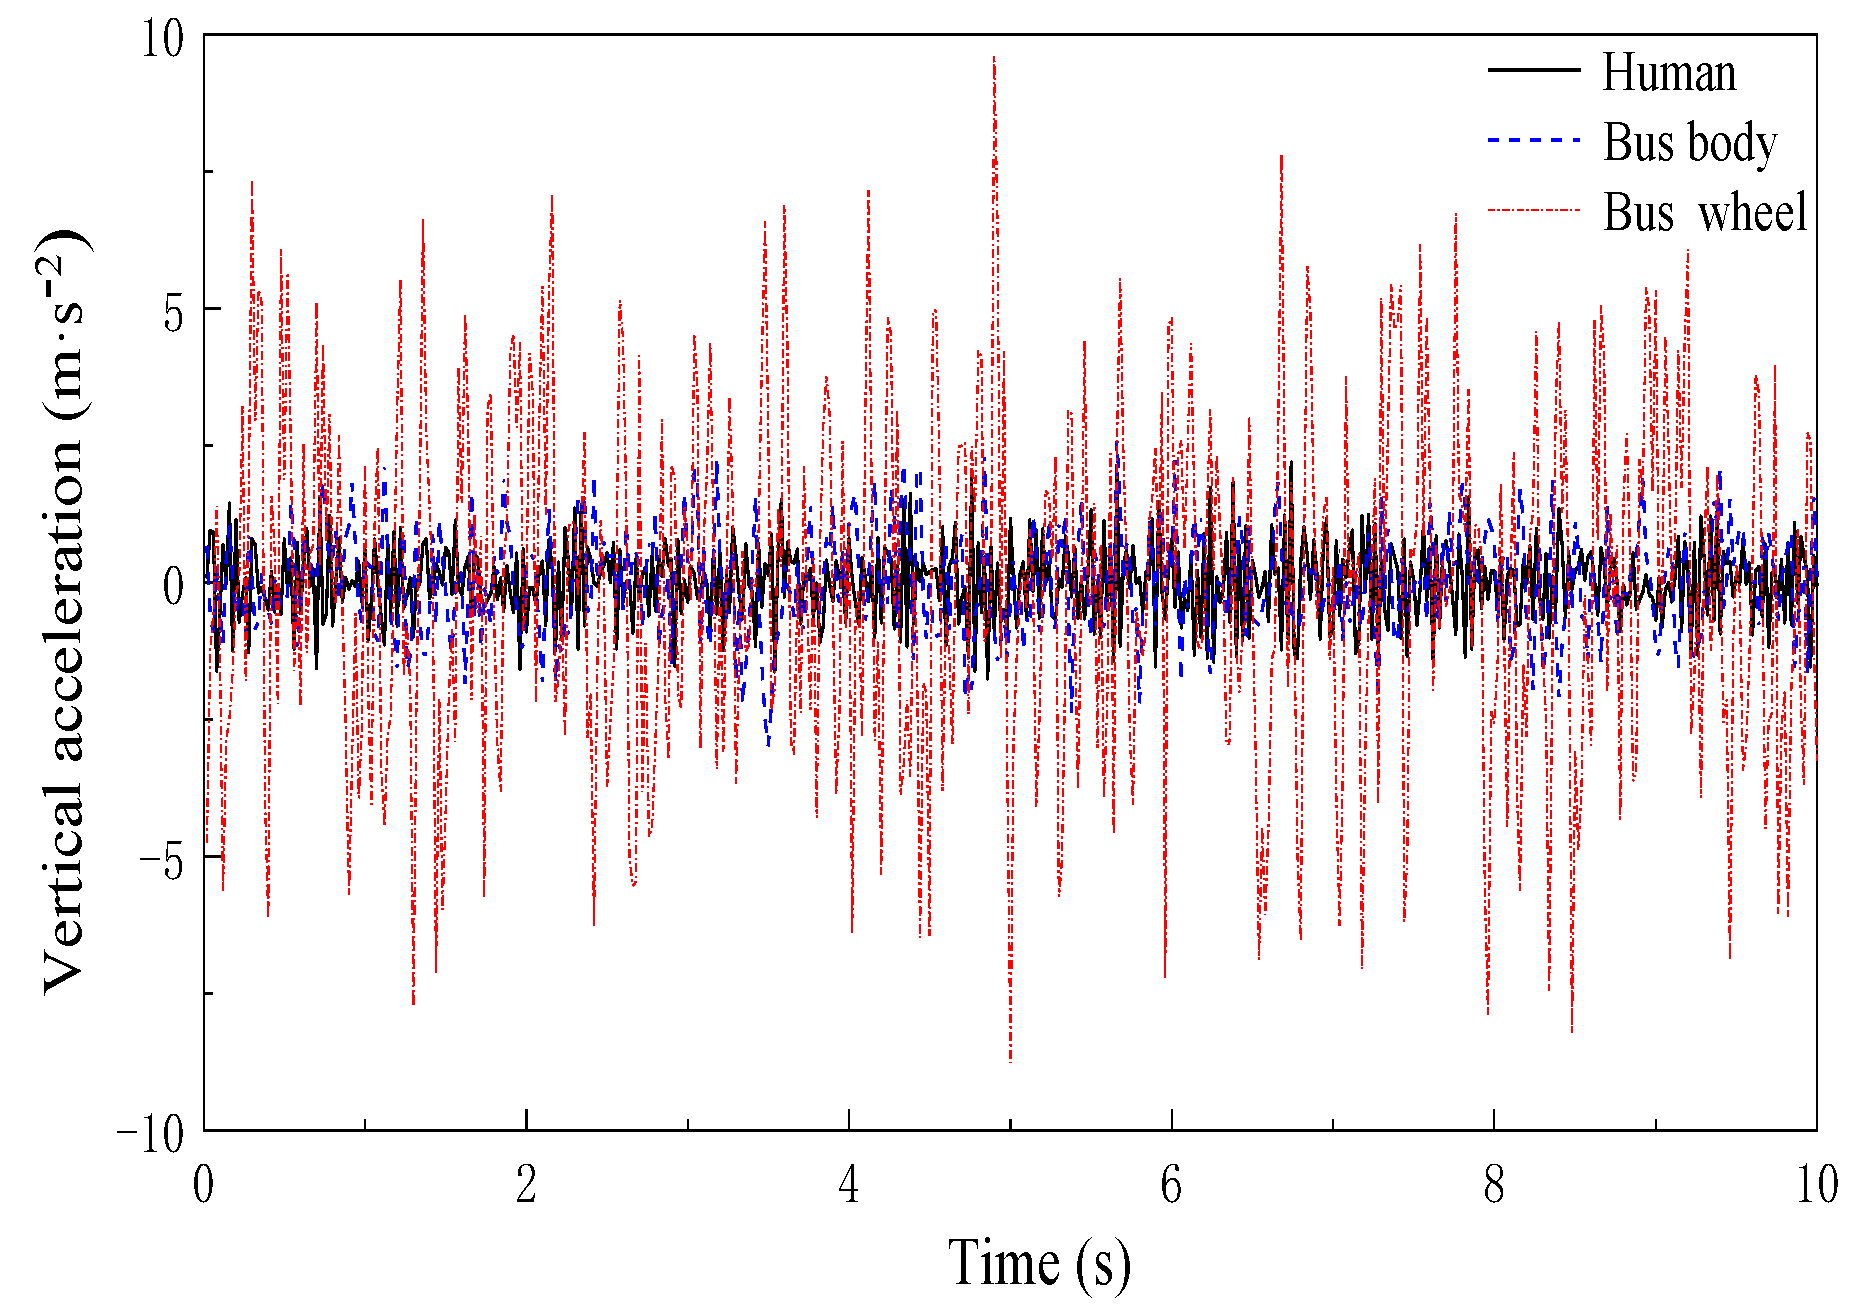
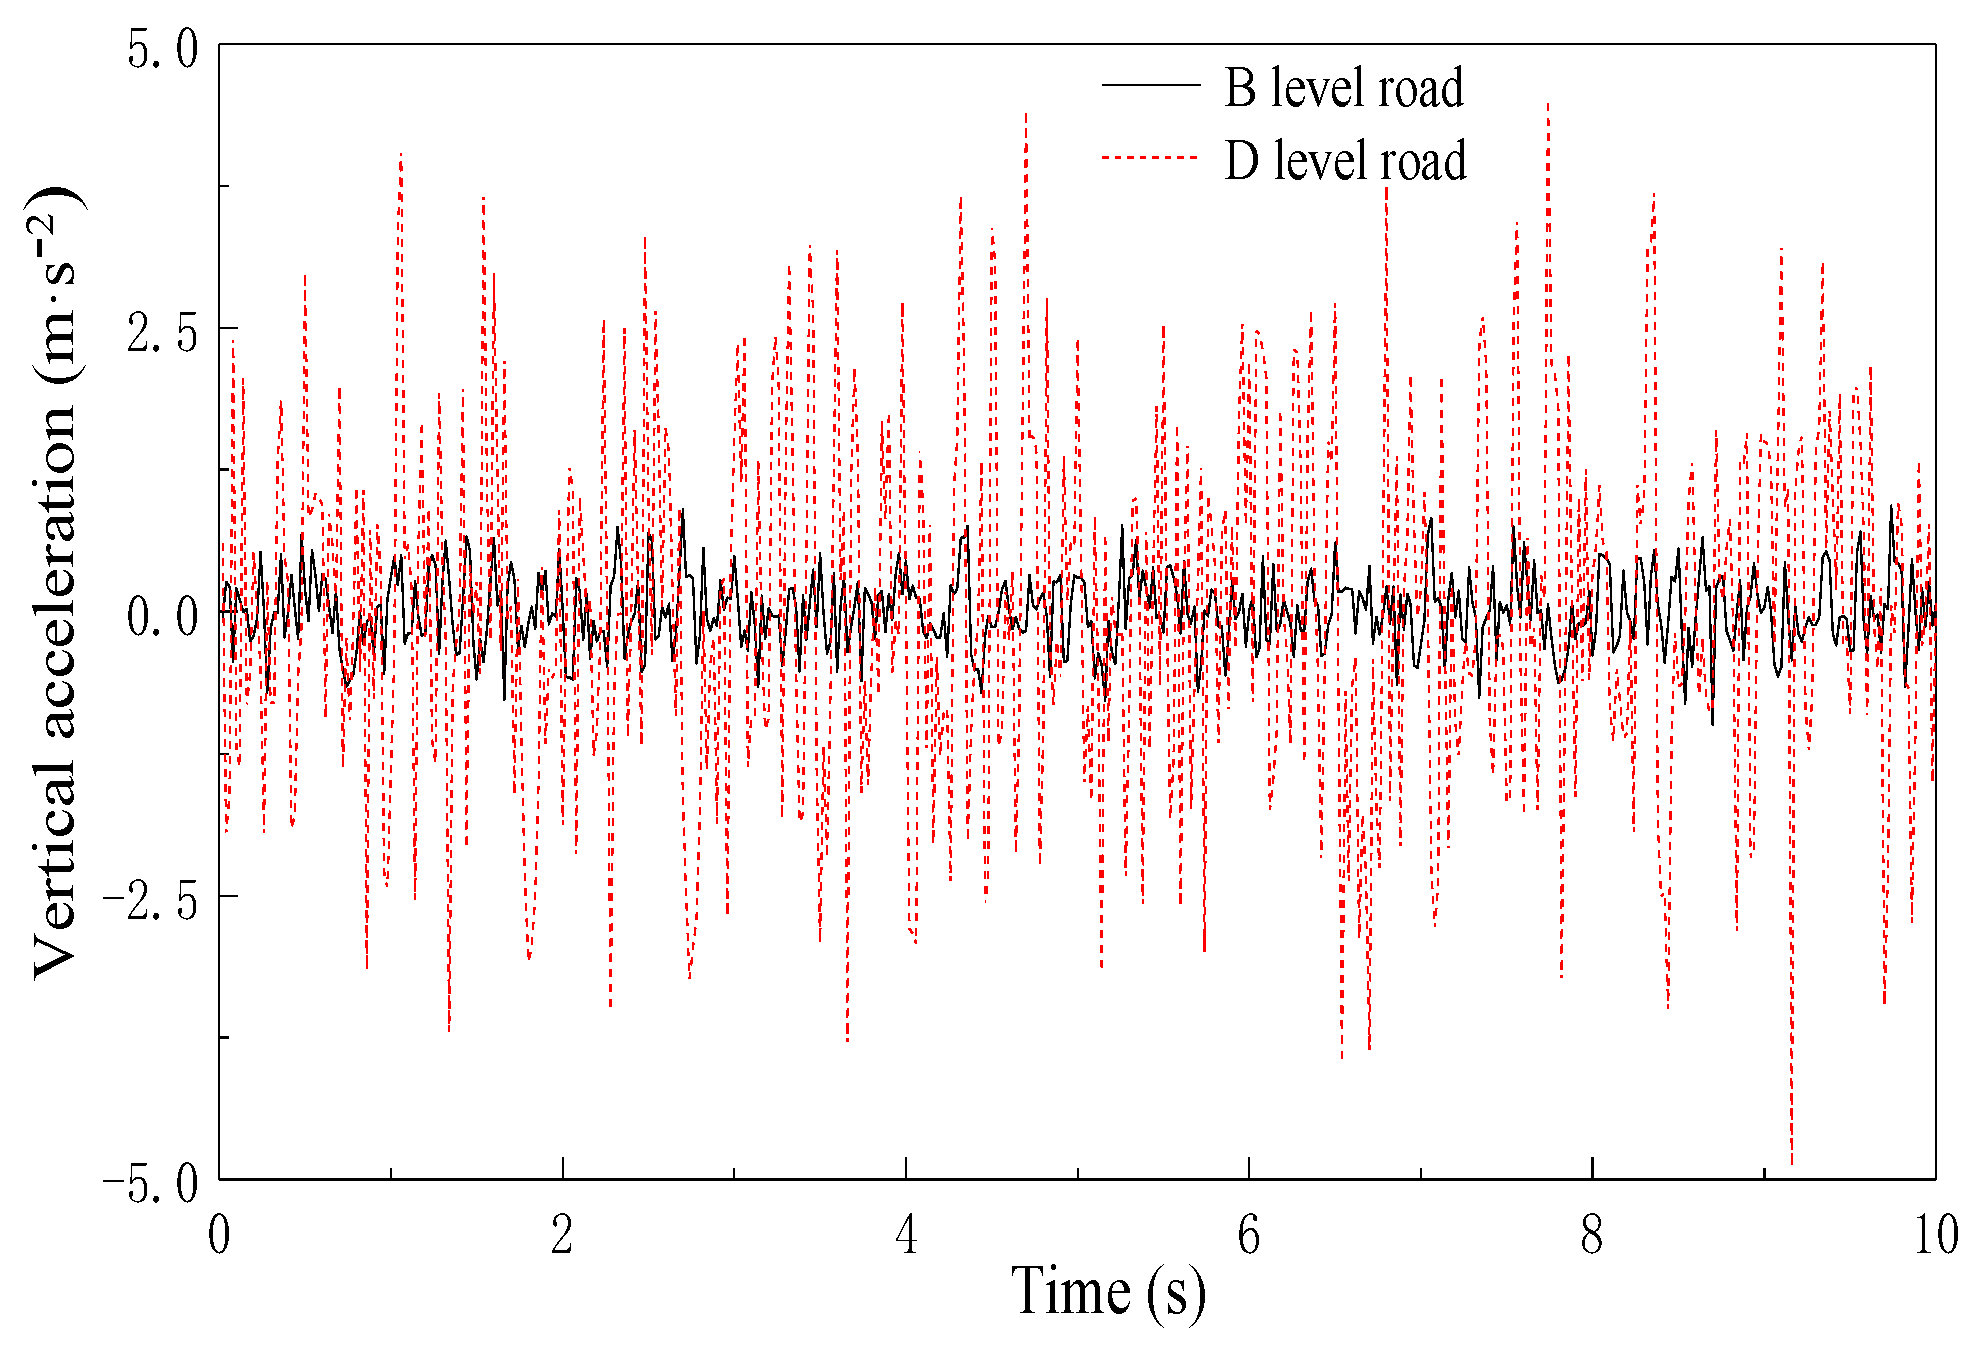
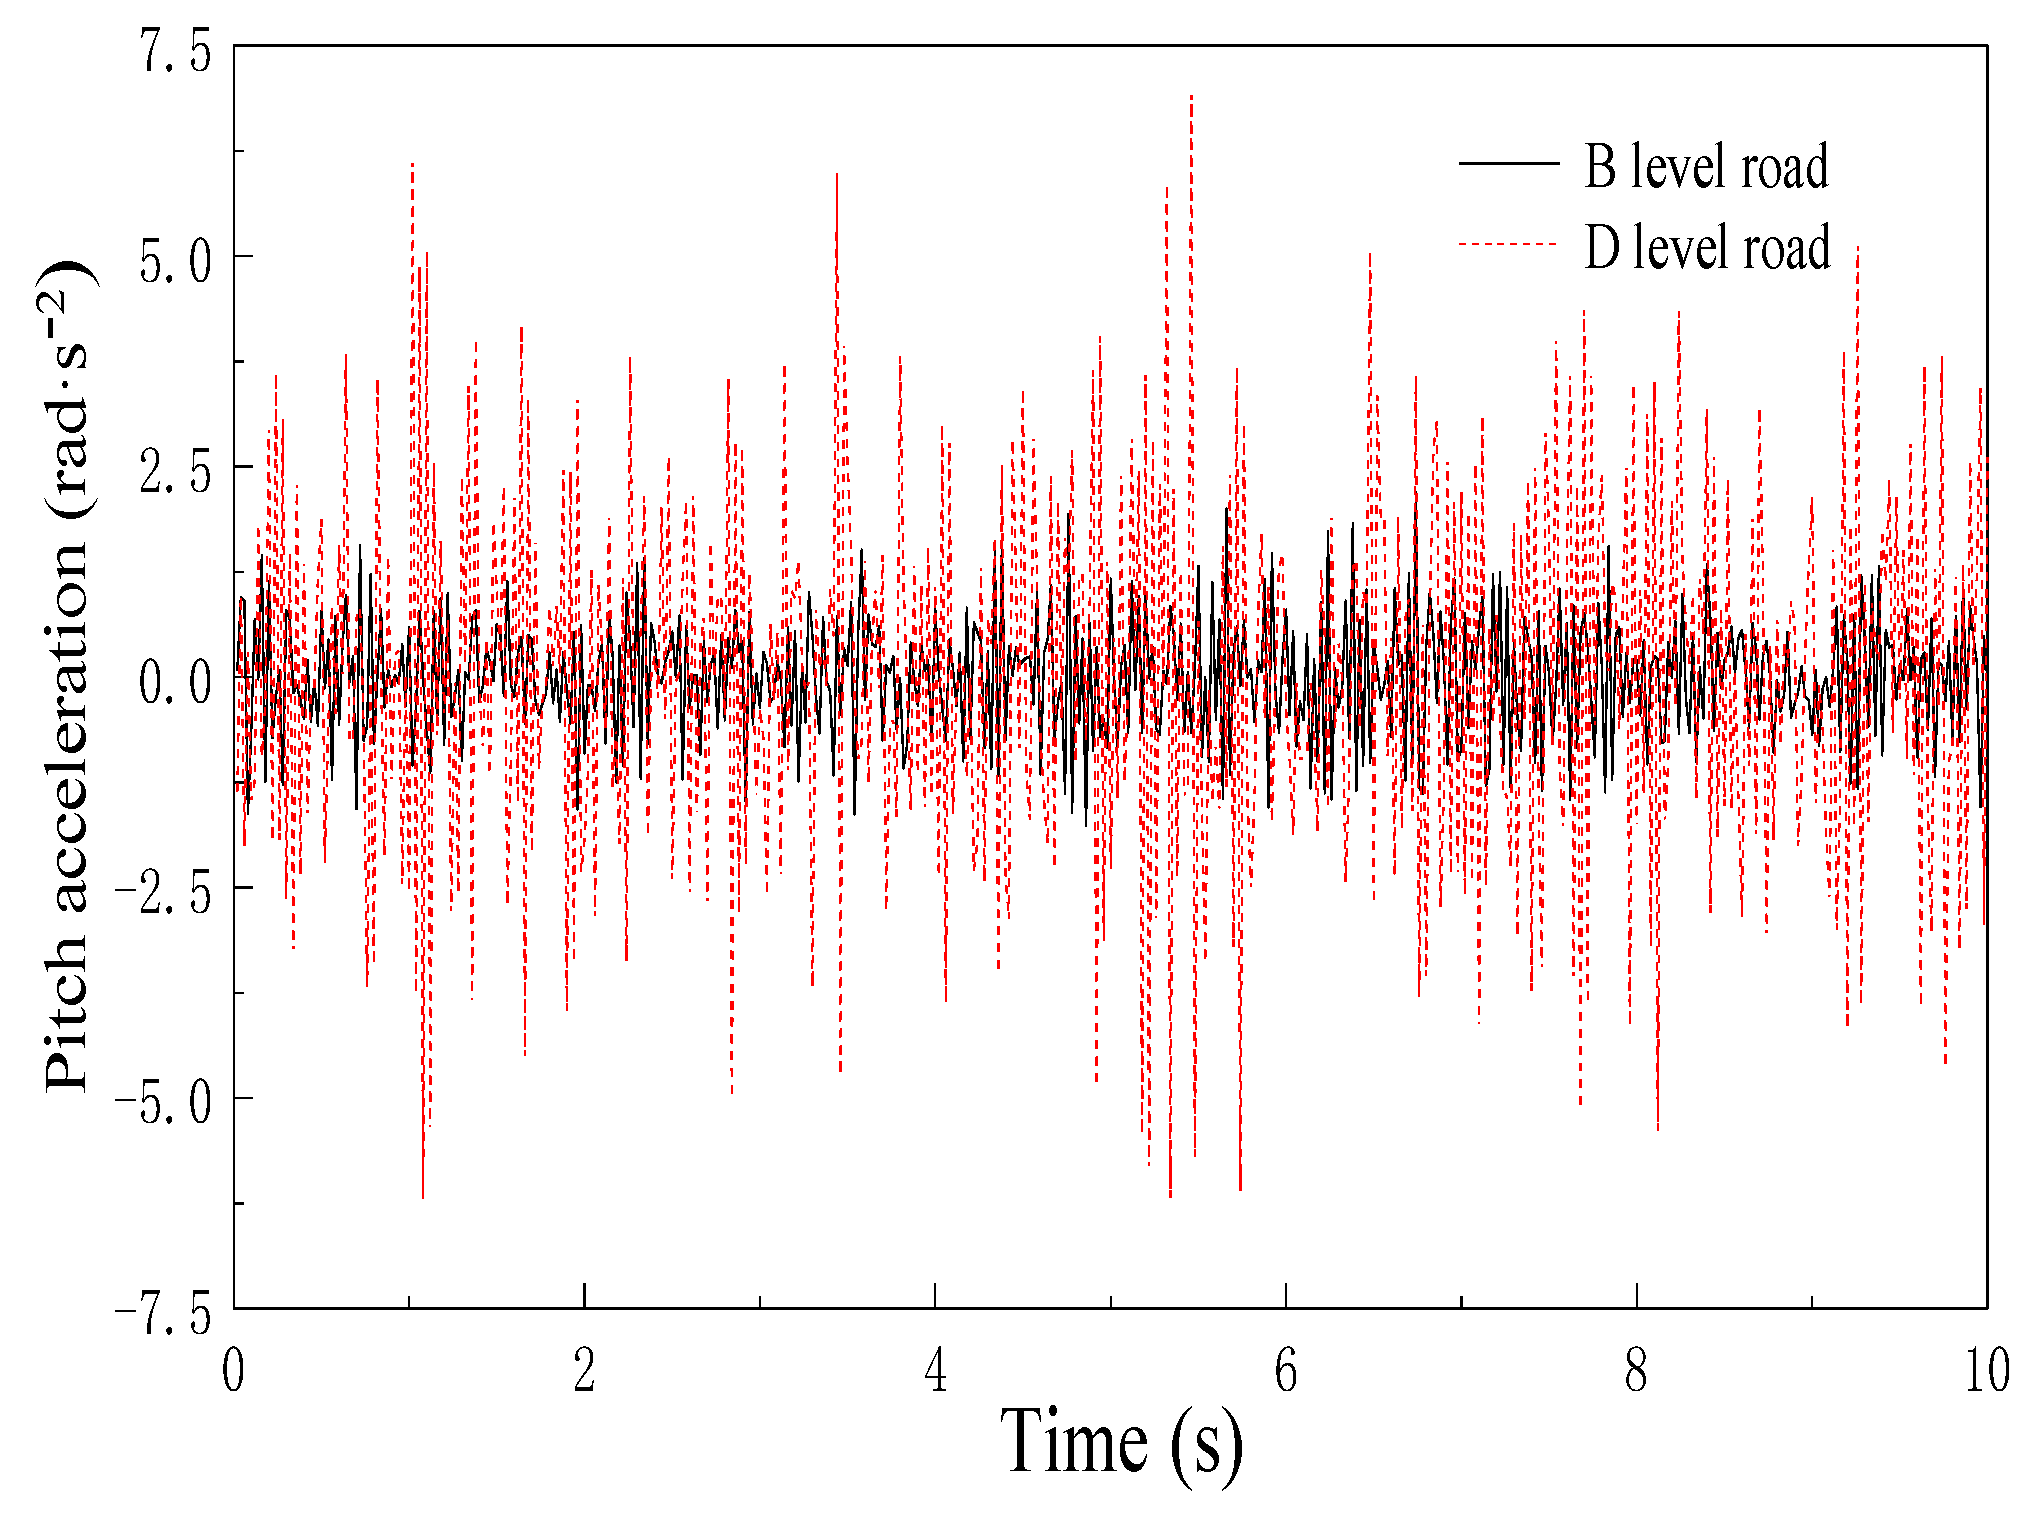
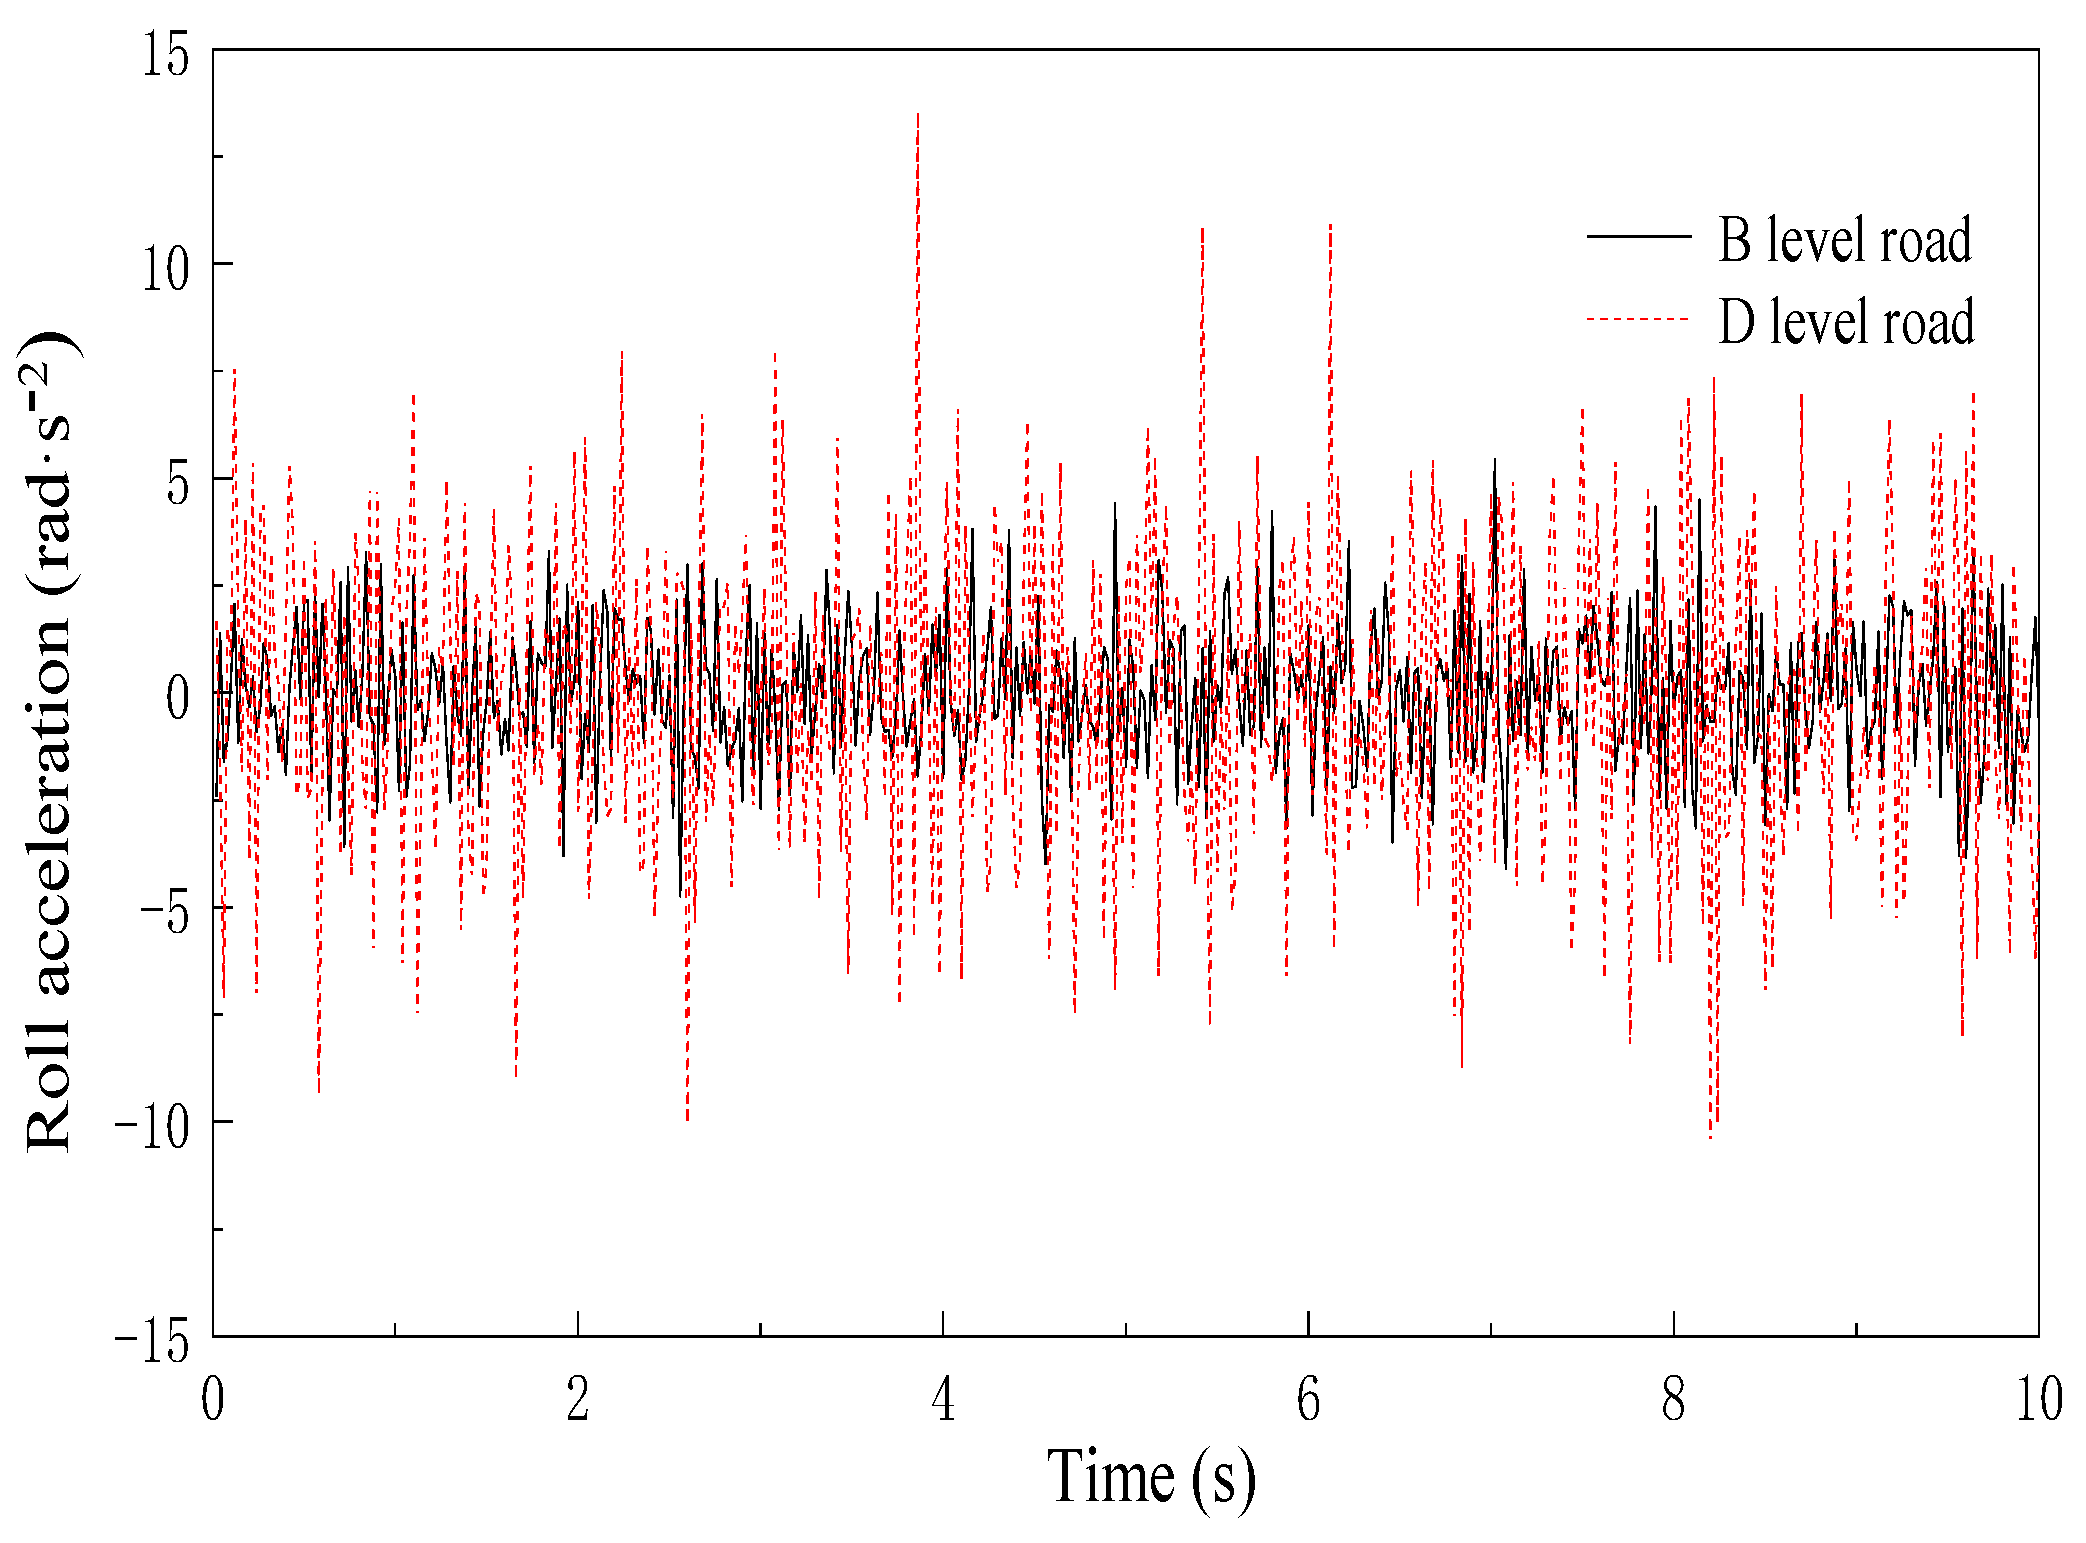
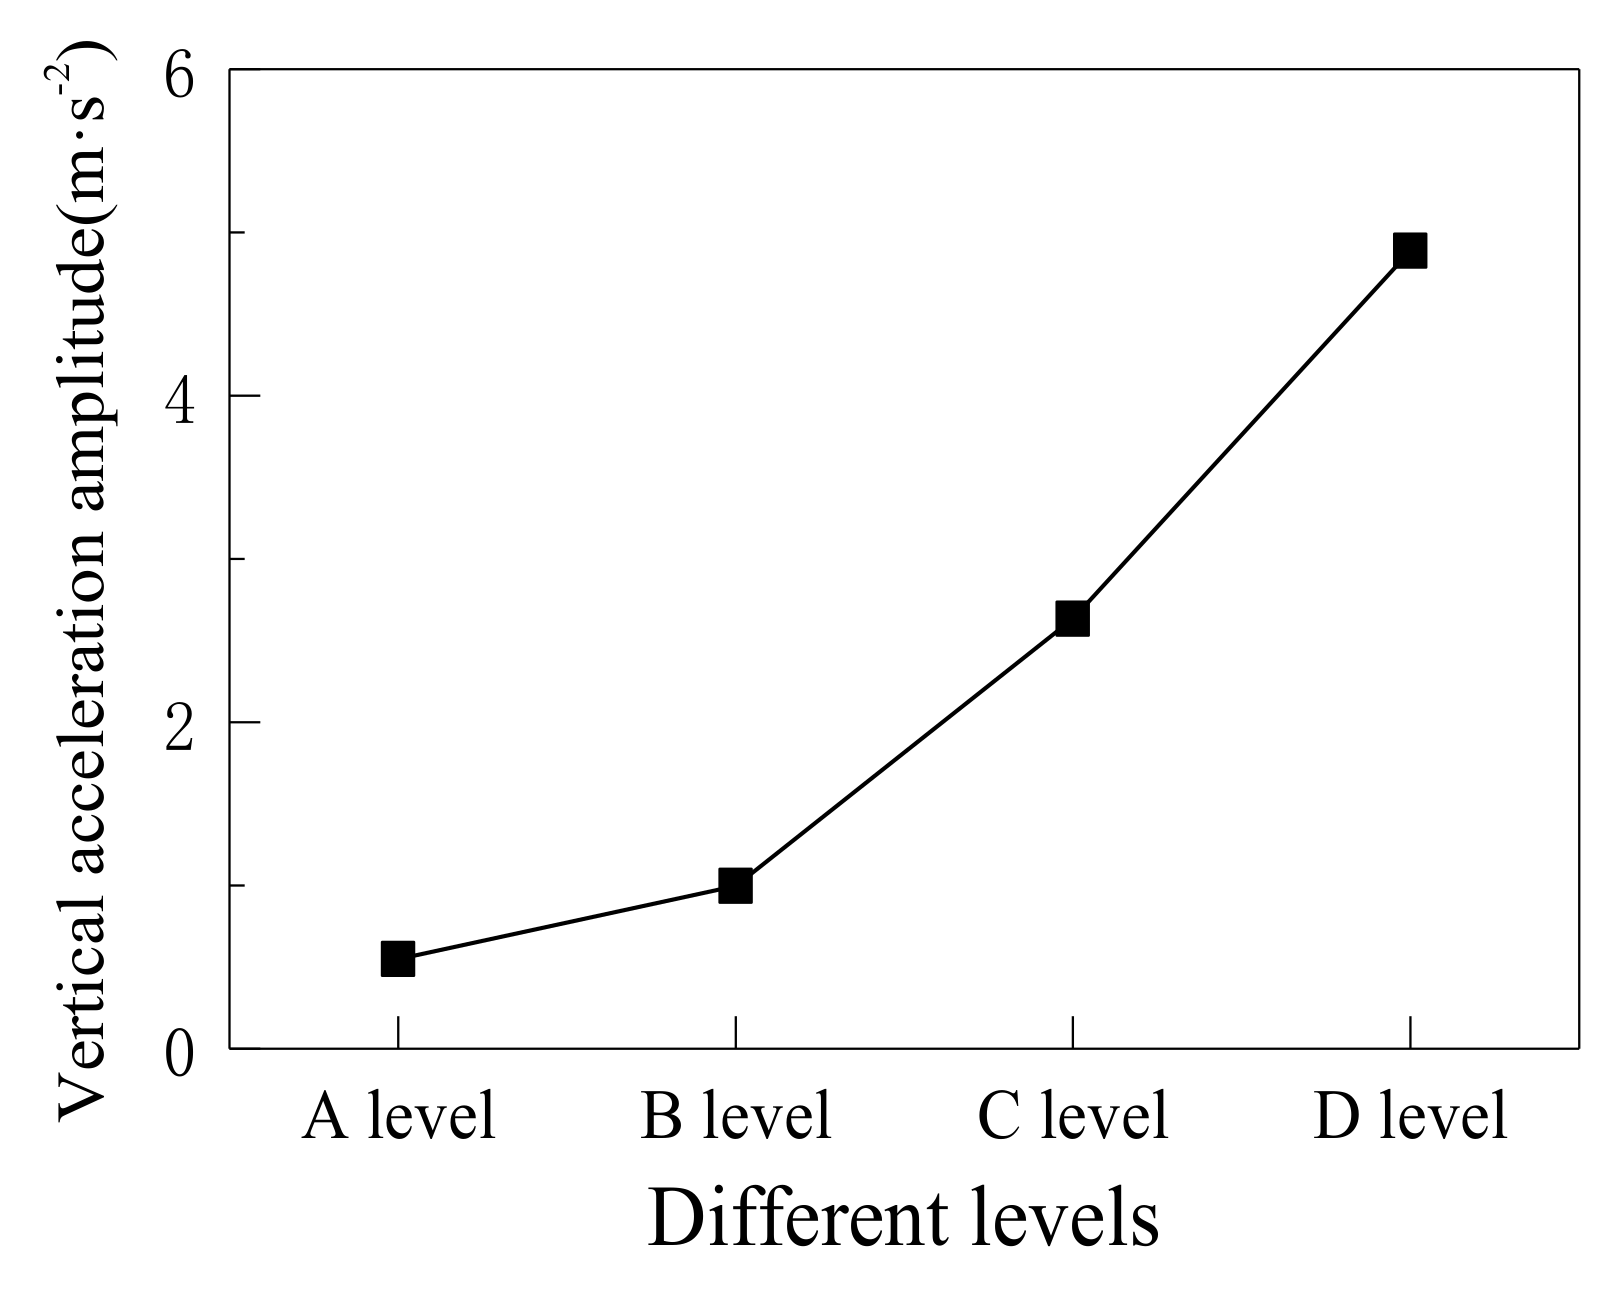
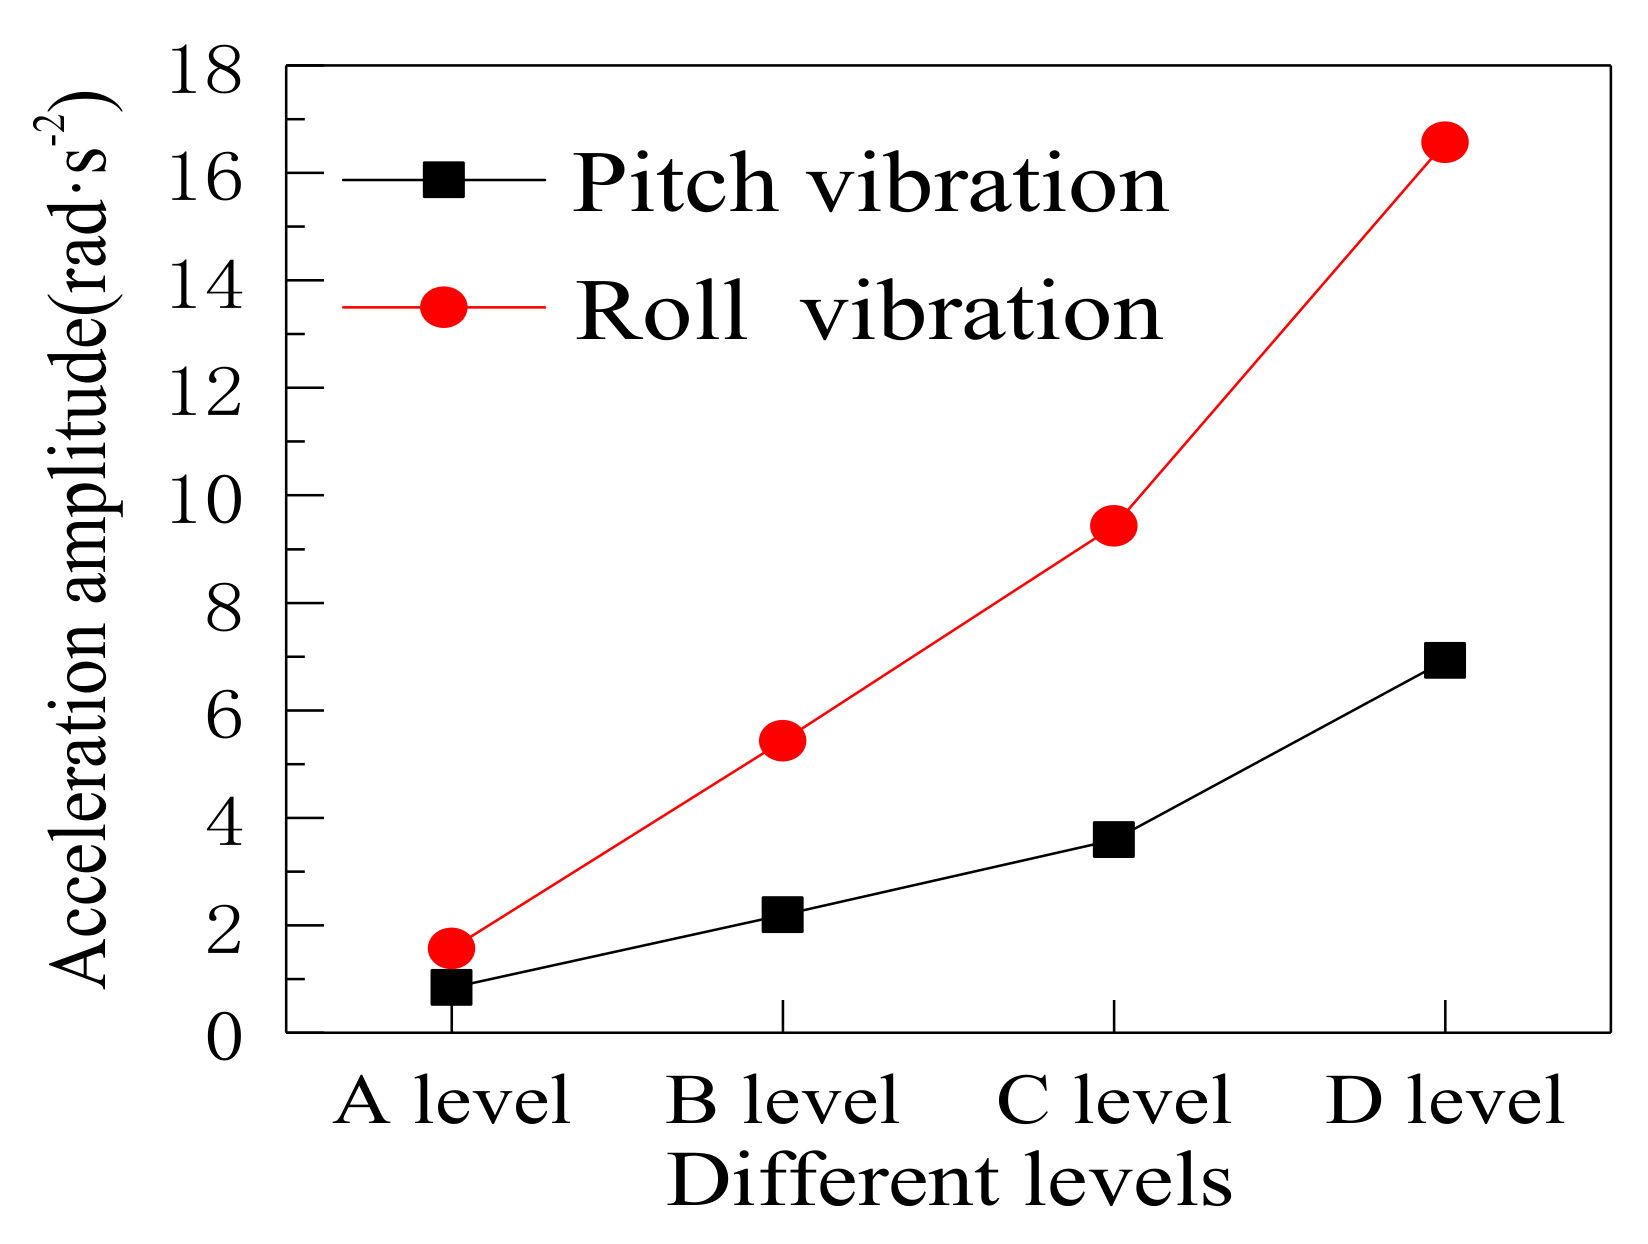
4.2. Dynamic Responses

The above road model, road surface roughness, and the bus–human model were combined to form the human–bus–road coupled vibration system, and the self-developed program was used to solve the equations of motion to obtain the dynamic response of the system. The results are detailed as follows.
Figure 9 is the vertical acceleration time-history curves of the wheel, the bus body, and the human body in the case of B-level road surface roughness. It can be seen that the vertical acceleration amplitude of the wheel is the largest, the bus body is the second, and the human body is the smallest. The values are 9.662, 3.006, and 0.9966 m/s2, respectively. Compared with the acceleration amplitude of the wheel, the acceleration amplitudes of the bus body and the human body were reduced by 68.89% and 89.68%, respectively, which is due to the spring-damping systems between the wheel and the bus body, and between the bus body and the human body. The spring-damping system is beneficial to the improvement of passenger comfort.
Figure 10, Figure 11 and Figure 12 show the time-history curves of the vertical, pitch, and roll accelerations of the human body under B- and D-level road surface roughness. Figure 13 and Figure 14 show the maximum acceleration amplitude of the A-, B-, C-, and D-level road surface conditions.
It is found in Figure 10, Figure 11, Figure 12, Figure 13 and Figure 14 that the acceleration of the human body in all directions increases with the deterioration of the road surface condition. Corresponding to B-level and D-level roads, the vertical acceleration amplitude is 0.996 and 4.887 m/s2, the pitch acceleration amplitude is 2.192 and 6.928 rad/s2, and the roll acceleration amplitude is 5.434 and 13.566 rad/s2, respectively. It is observed that the vertical acceleration of the human body is more sensitive to the change of road surface roughness than the pitch and roll accelerations. However, it should be noted that the amplitudes of pitch and roll accelerations are still large, and their impact on human comfort cannot be ignored.

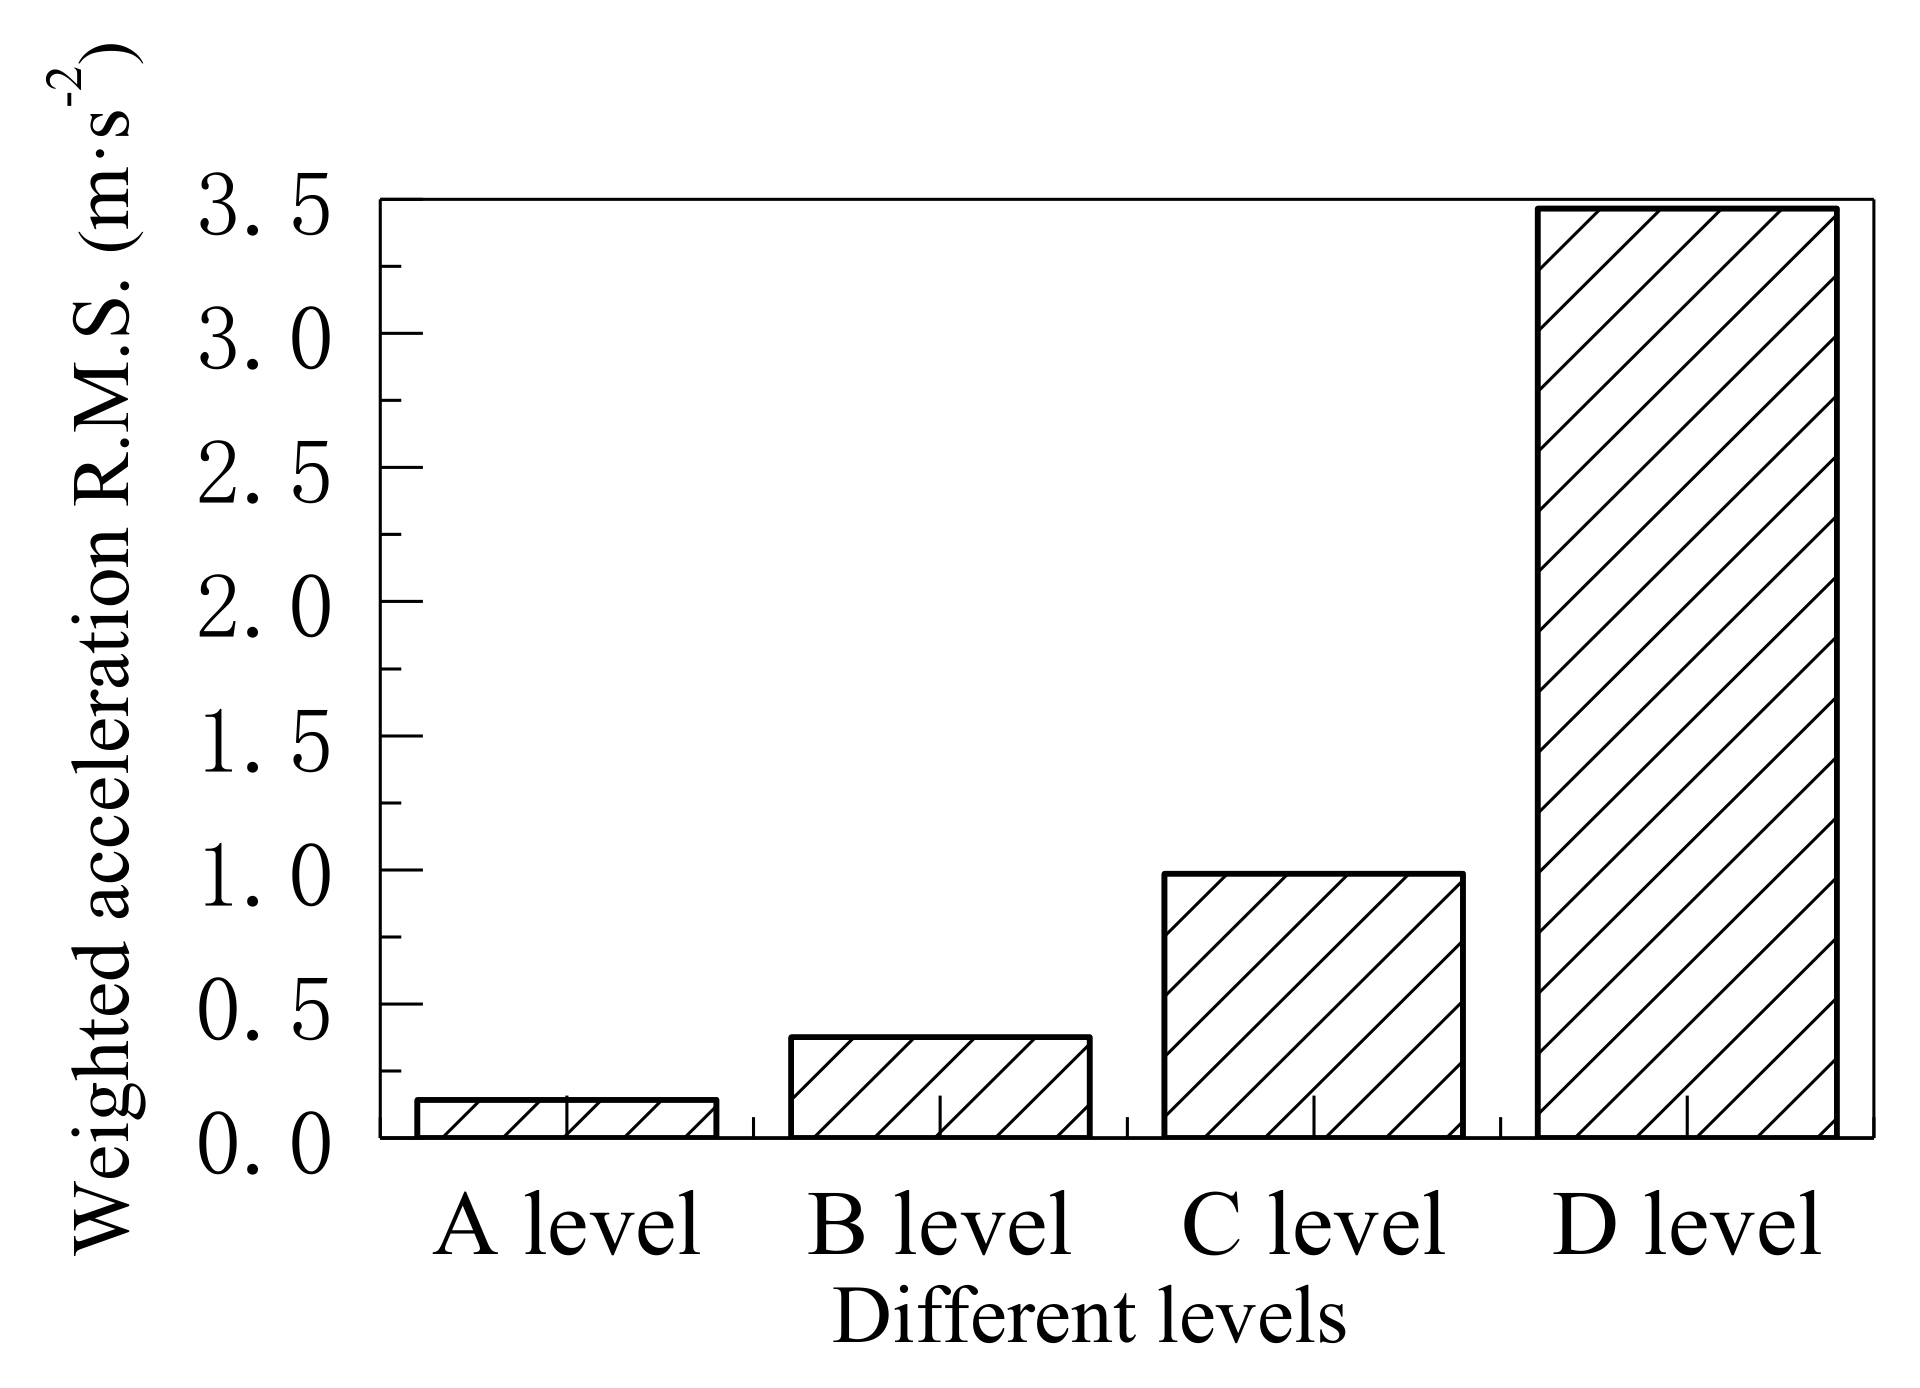
4.3. Comfort Evaluation

The weighted acceleration RMS of the human body considering different road surface roughness conditions can be calculated using Equation (14), and the annoyance rate can then be obtained using Equation (15). The steps for calculating the annoyance rate are as follows. According to the data listed in Table 1, the human annoyance rate function based on the coupled human–bus–road vibration can be established. The logarithmic relationship between the fuzzy membership function v ( u ) and the vibration acceleration u is expressed as
v ( u ) = 0 u < u min a ln u + b u min u u max 1 u > u max
According to Table 1, u min = 0.315 m/s2 and u max = 2.5 m/s2, which are substituted into Equation (19) as
a ln ( u min ) + b = 0 a ln ( u max ) + b = 1
Solving the above formula, the coefficients are obtained as a = 0.4827 and b = 0.5577. Therefore, the annoyance rate of passengers considering the coupled vibration of human–bus–road can be obtained as
A ( x ) = u min 1 2 π u σ exp ( ln ( u / x ) + 0.5 σ 2 ) 2 2 σ 2 × ( 0.4827 ln u + 0.5577 ) d u
The numerical way to obtain A(x) in Equation (21) generally requires interpolation, which is inconvenient for application. The logarithmic normal distribution curve can be used to fit the annoyance curve for better application. The fitting curve and the error curve are shown in Figure 15. The maximum error is 2.17%, which satisfies the requirements of evaluation accuracy.
According to the fitting curve, the human annoyance rate under different road surface roughness conditions is calculated. The results includint the weighted acceleration RMS and the annoyance rate are shown in Figure 16 and Figure 17, respectively. As can be seen in Figure 16 and Figure 17, the weighted acceleration RMS of the human body increases rapidly with the deterioration of the road surface. The annoyance rate has the same trend and exceeds 50% under C- and D-level road surface conditions.
Human comfort is evaluated using both the ISO 2631 standard and the annoyance rate, as listed in Table 4. For example, in the case of C-level road surface condition, the weighted RMS acceleration of the human body is 0.9862. According to the evaluation standard of ISO 2631, the reaction of the human body is “uncomfortable”, which only gives out a qualitative and fuzzy judgment. However, as seen in the table, the annoyance rate of the human body is 52.9%. It indicates that 52.9% of passengers feel uncomfortable, which gives out a quantitative evaluation of the uncomfortable degree of the human body. In addition, as listed in Table 1, when the weighted acceleration RMS is 0.5~1.0, the human reaction is “fairly uncomfortable”, and 0.8~1.6 is evaluated as “uncomfortable”. Based on that, the weighted acceleration RMS under C-level road surface condition, i.e., 0.9862, could be evaluated as either “fairly uncomfortable” or “uncomfortable”. The overlap between the ranges of two classifications results in the fuzzy judgment based on the standard evaluation, while the evaluation based on the annoyance rate index can avoid this issue and gives out an accurate classification. That is, a more accurate evaluation can be obtained for passenger comfort.

5. Parametric Study

The parametric study was conducted to investigate the effect of various conditions on human comfort, including the interlayer bonding condition of asphalt pavement, bus weight, bus speed, and sitting position of the passenger.

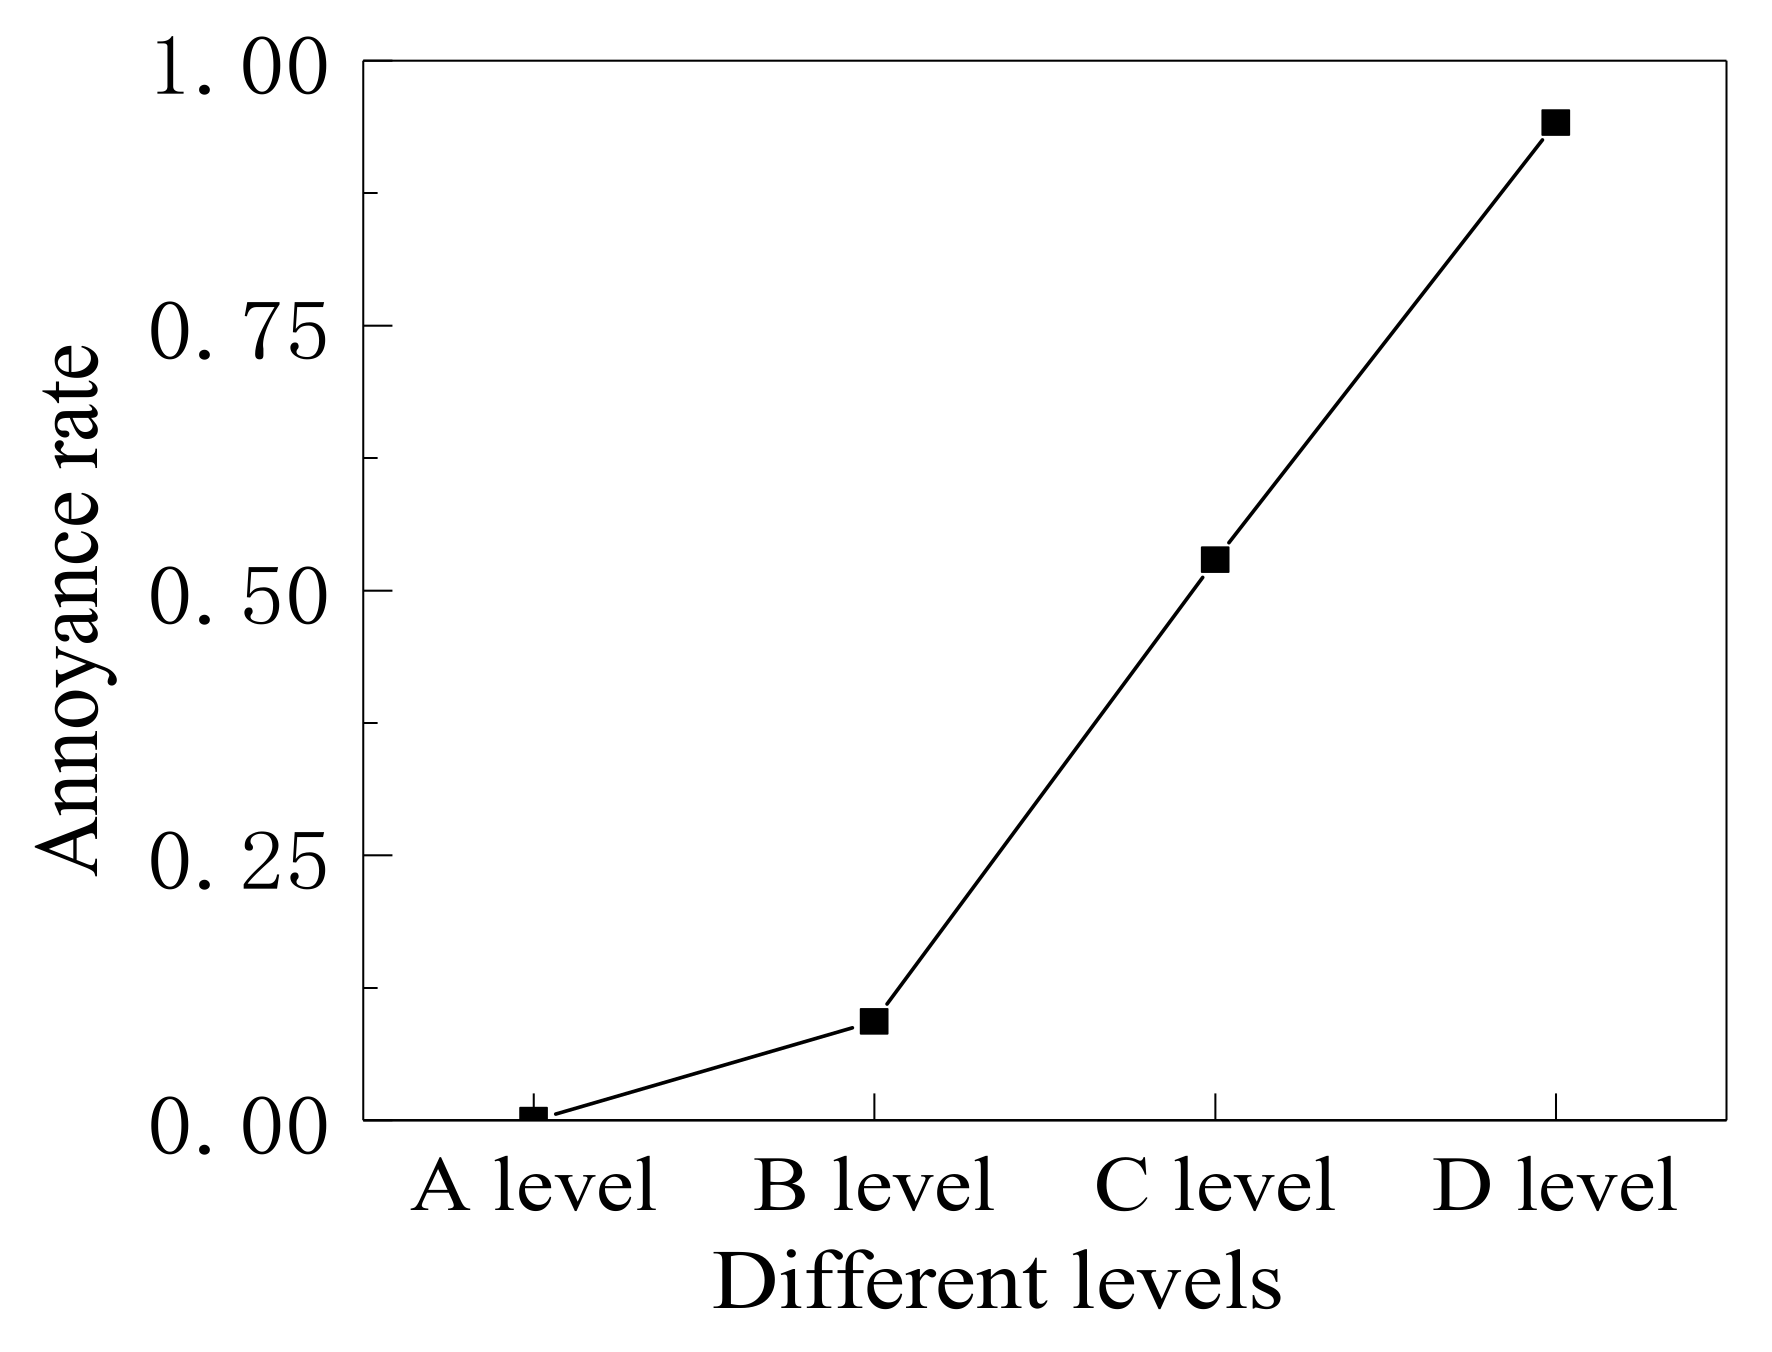
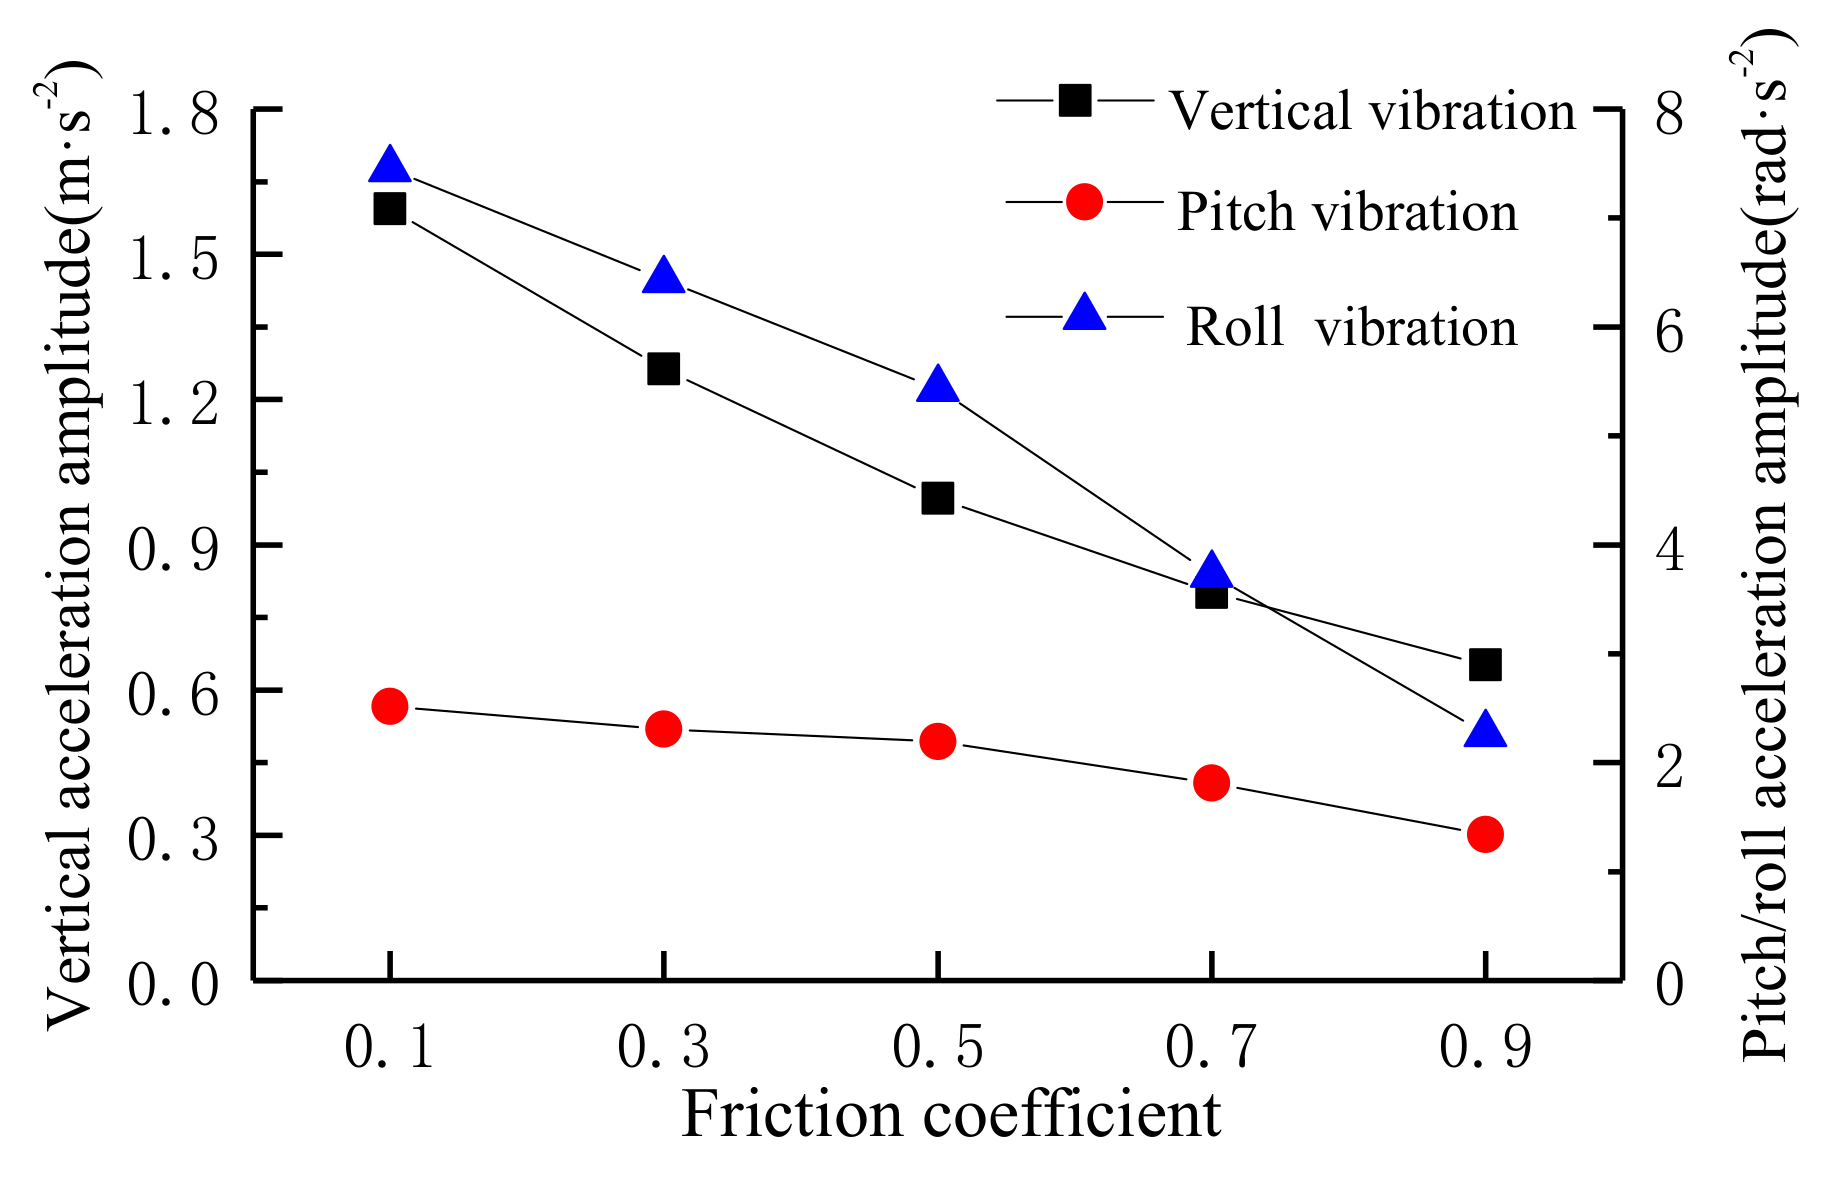
5.1. Effect of Interlayer Bonding Condition of Asphalt Pavement

In the Specification for Design of Highway Asphalt Pavement [10], the adjacent layers of the asphalt pavement are assumed to be in two extreme conditions: full-bond and no-bond. However, during the service of the asphalt road, the real interlayer bonding condition lies somewhere between full-bond condition and no-bond condition, and the stress and displacement are transmitted between the layers through the interface. The friction coefficient between layers is selected as 0.1, 0.3, 0.5, 0.7, and 0.9, respectively, which corresponds to the five bonding conditions: extremely poor, poor, medium, good, and excellent. Figure 18 shows the vertical, pitch, and roll acceleration amplitudes of a human under the five bonding conditions.
As can be seen in Figure 18, the human acceleration decreases with the increasing of interlayer friction coefficient. Compared with the case with a friction coefficient of 0.9, the vertical acceleration, pitch acceleration, and roll acceleration in the case with a friction coefficient of 0.1 are increased by 2.44, 1.88, and 3.31 times, respectively. It indicates that the influence of the interlayer bonding condition on the acceleration of the human body is obvious.
The weighted acceleration RMS and annoyance rate of the human body, considering different interlayer bonding conditions, were obtained, as shown in Figure 19. With the increase of the interlayer friction coefficient, the weighted RMS acceleration of the human body decreases, and the annoyance rate of the human body decreases gradually, which means human comfort becomes better.
Human comfort is evaluated according to both the ISO 2631 standard and the annoyance rate indicator, as shown in Table 5. In the cases with friction coefficients of 0.7 and 0.9, the weighted acceleration RMSs are 0.278 and 0.227 m/s2, respectively, which are less than 0.315 m/s2, and there is “not uncomfortable according to the ISO 2631 evaluation standard. However, the annoyance rate results show that there are still 2.48% and 0.69% of passengers feeling uncomfortable, even though the evaluation result is “not uncomfortable” according to the ISO 2631 standard. In summary, the increase of the interlayer friction coefficient will increase the strength and integrity of the asphalt road and eventually increase the comfort of passengers.

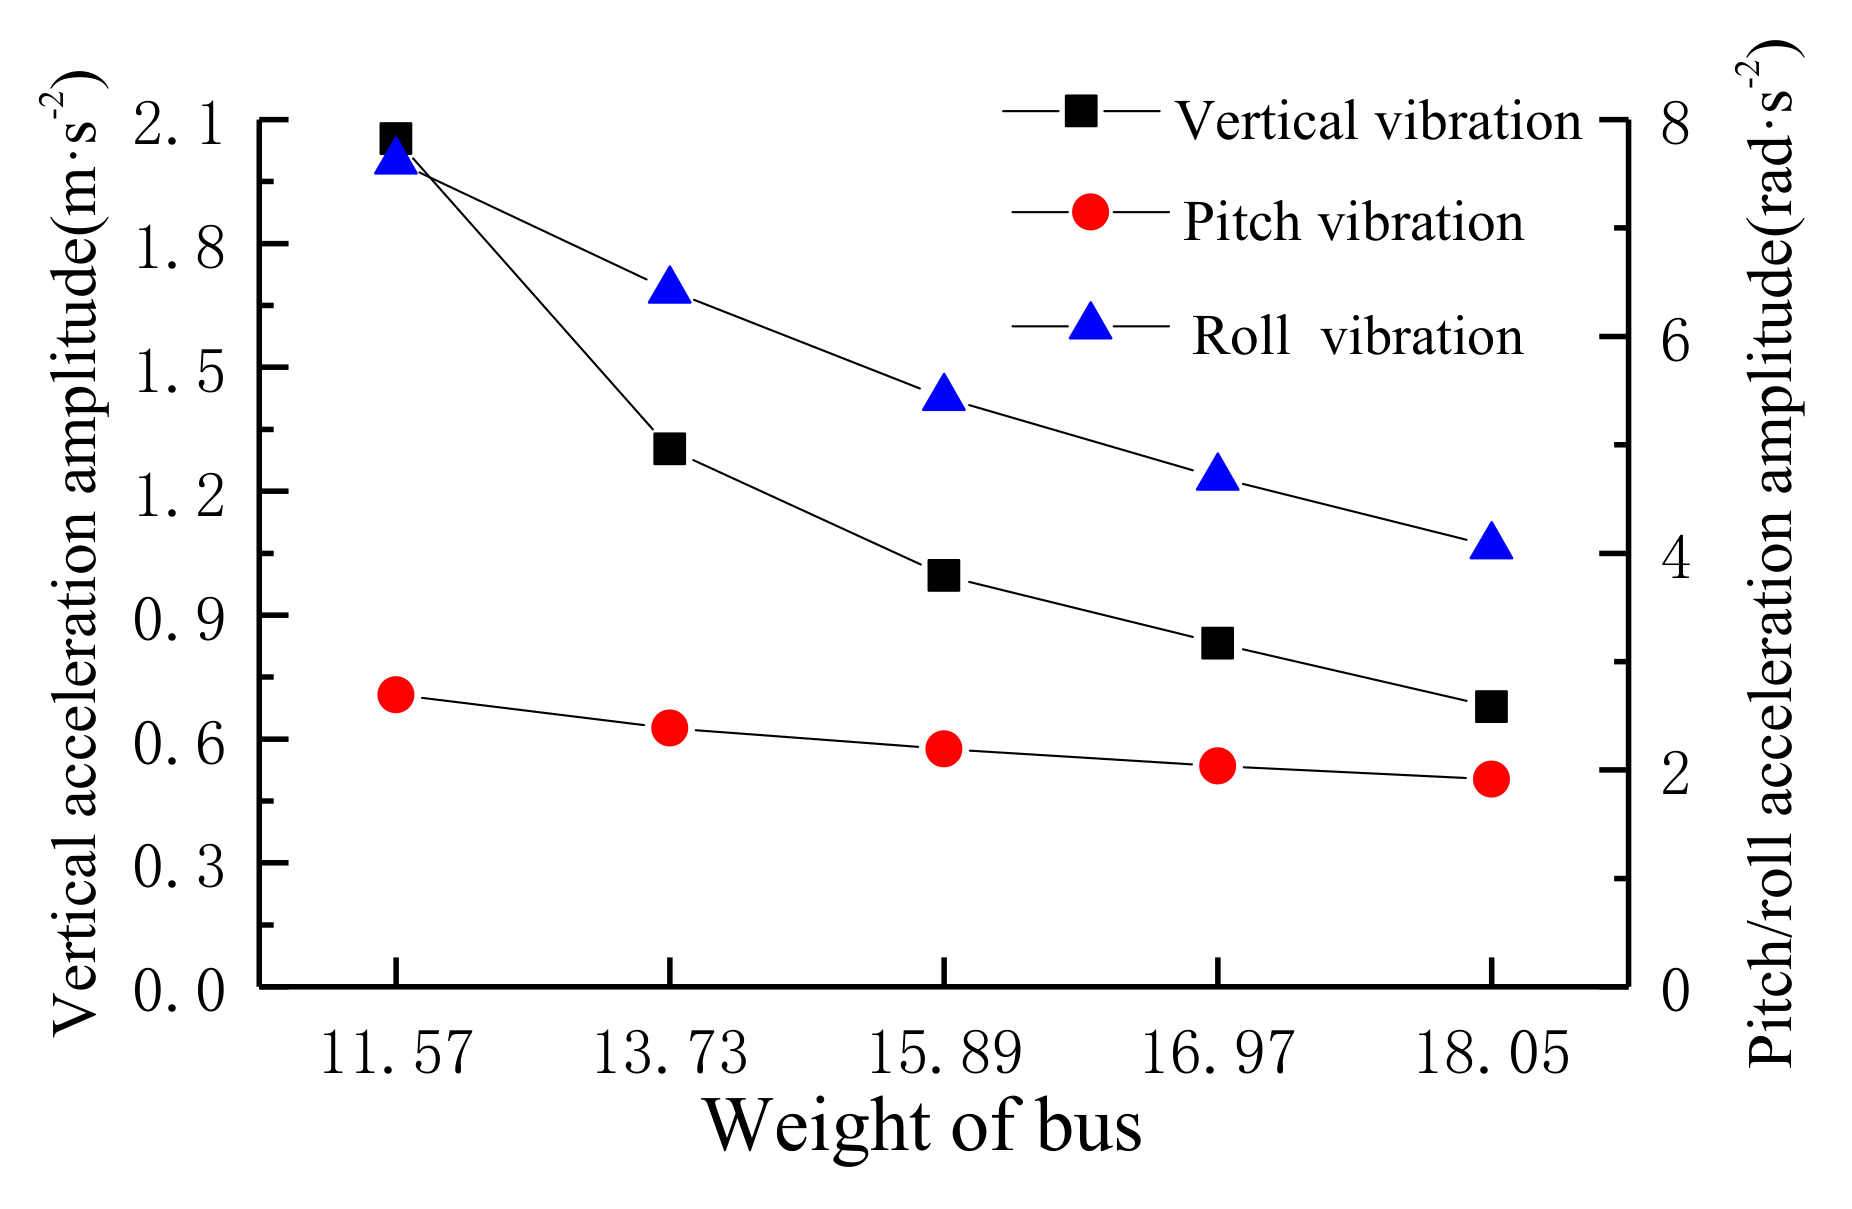
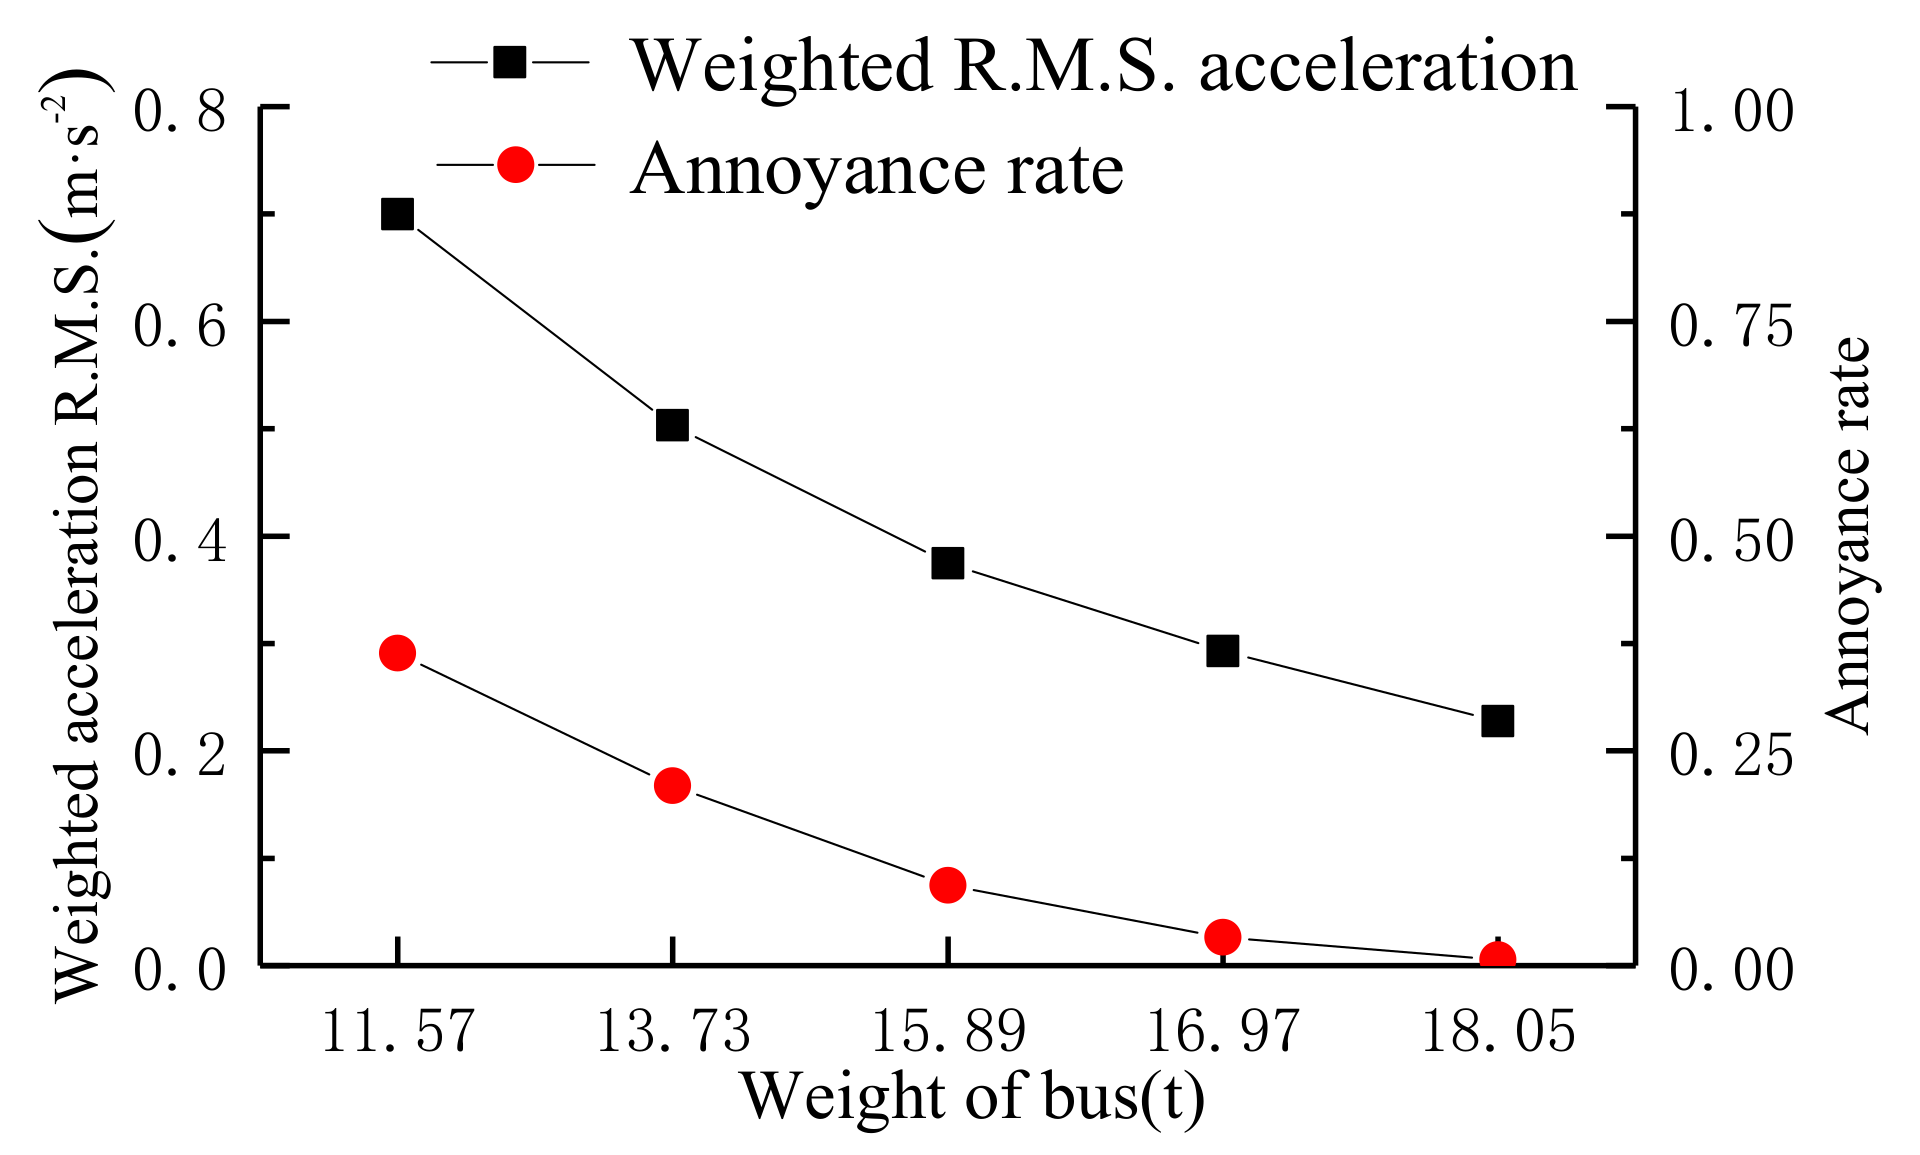
5.2. Effect of Bus Weight

Assume that the driver mass is 70 kg, the passenger mass is 60 kg, and the baggage carried by each passenger is 20 kg. Depending on the total number of passengers on the bus, five situations are considered for the bus weight: no-load, half-load, full-load, 25% overload, and 50% overload. The weights of the bus are considered as 11.57, 13.73, 15.89, 16.97, and 18.05 t.
As can be seen in Figure 20 and Table 6, the vertical, roll, and pitch acceleration of the human body decrease with the increase of bus weight. When the bus weight is 18.05 t, the vertical, pitching, and roll accelerations increase by 3.03, 1.41, and 1.87 times, respectively, compared with the bus weight of 11.57 t. This shows that the load provided by the weight of the bus is mainly along the vertical direction, so the increase of the vertical acceleration of the human body is the largest, followed by the roll acceleration, and the pitch acceleration is small.
As can be seen in Figure 21, with the increase of bus weight, the weighted acceleration RMS of the human body decreases gradually, and the annoyance rate caused by the human body decreases continuously. When the weight of the bus ranges from 15.89–18.05 t, there are small changes in the values of weighted RMS acceleration and annoyance rate.
When the weights of the bus are 16.97 and 18.05 t, there is “not uncomfortable” according to the ISO 2631 evaluation standard. However, in the evaluation of the annoyance rate, the annoyance rates are 3.27% and 0.71%, respectively. Although this proportion is very small, it cannot be completely ignored. When the weight of the bus becomes larger, the dynamic response of the bus body in all directions will be reduced, and human comfort will be improved. However, the increased bus weight will increase the inertia of the bus, and thus increase the braking distance.

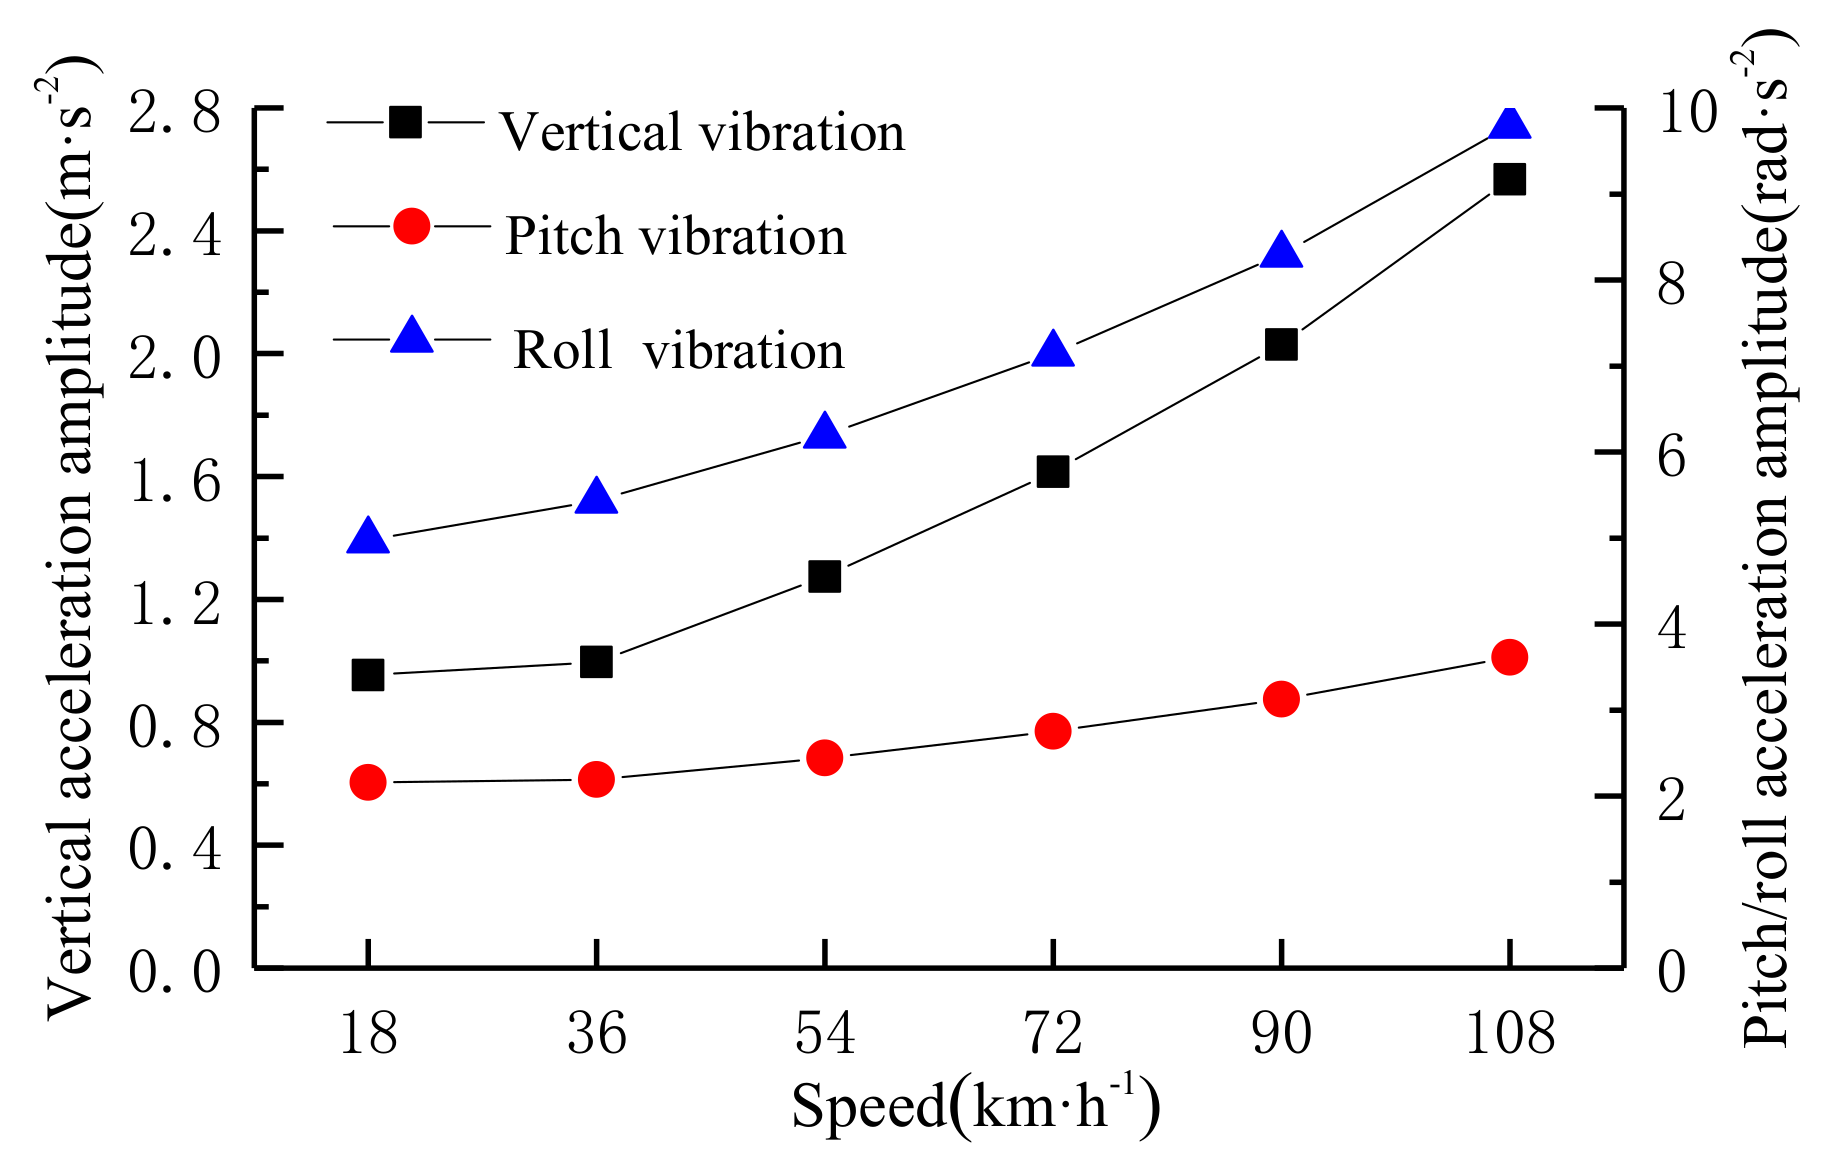
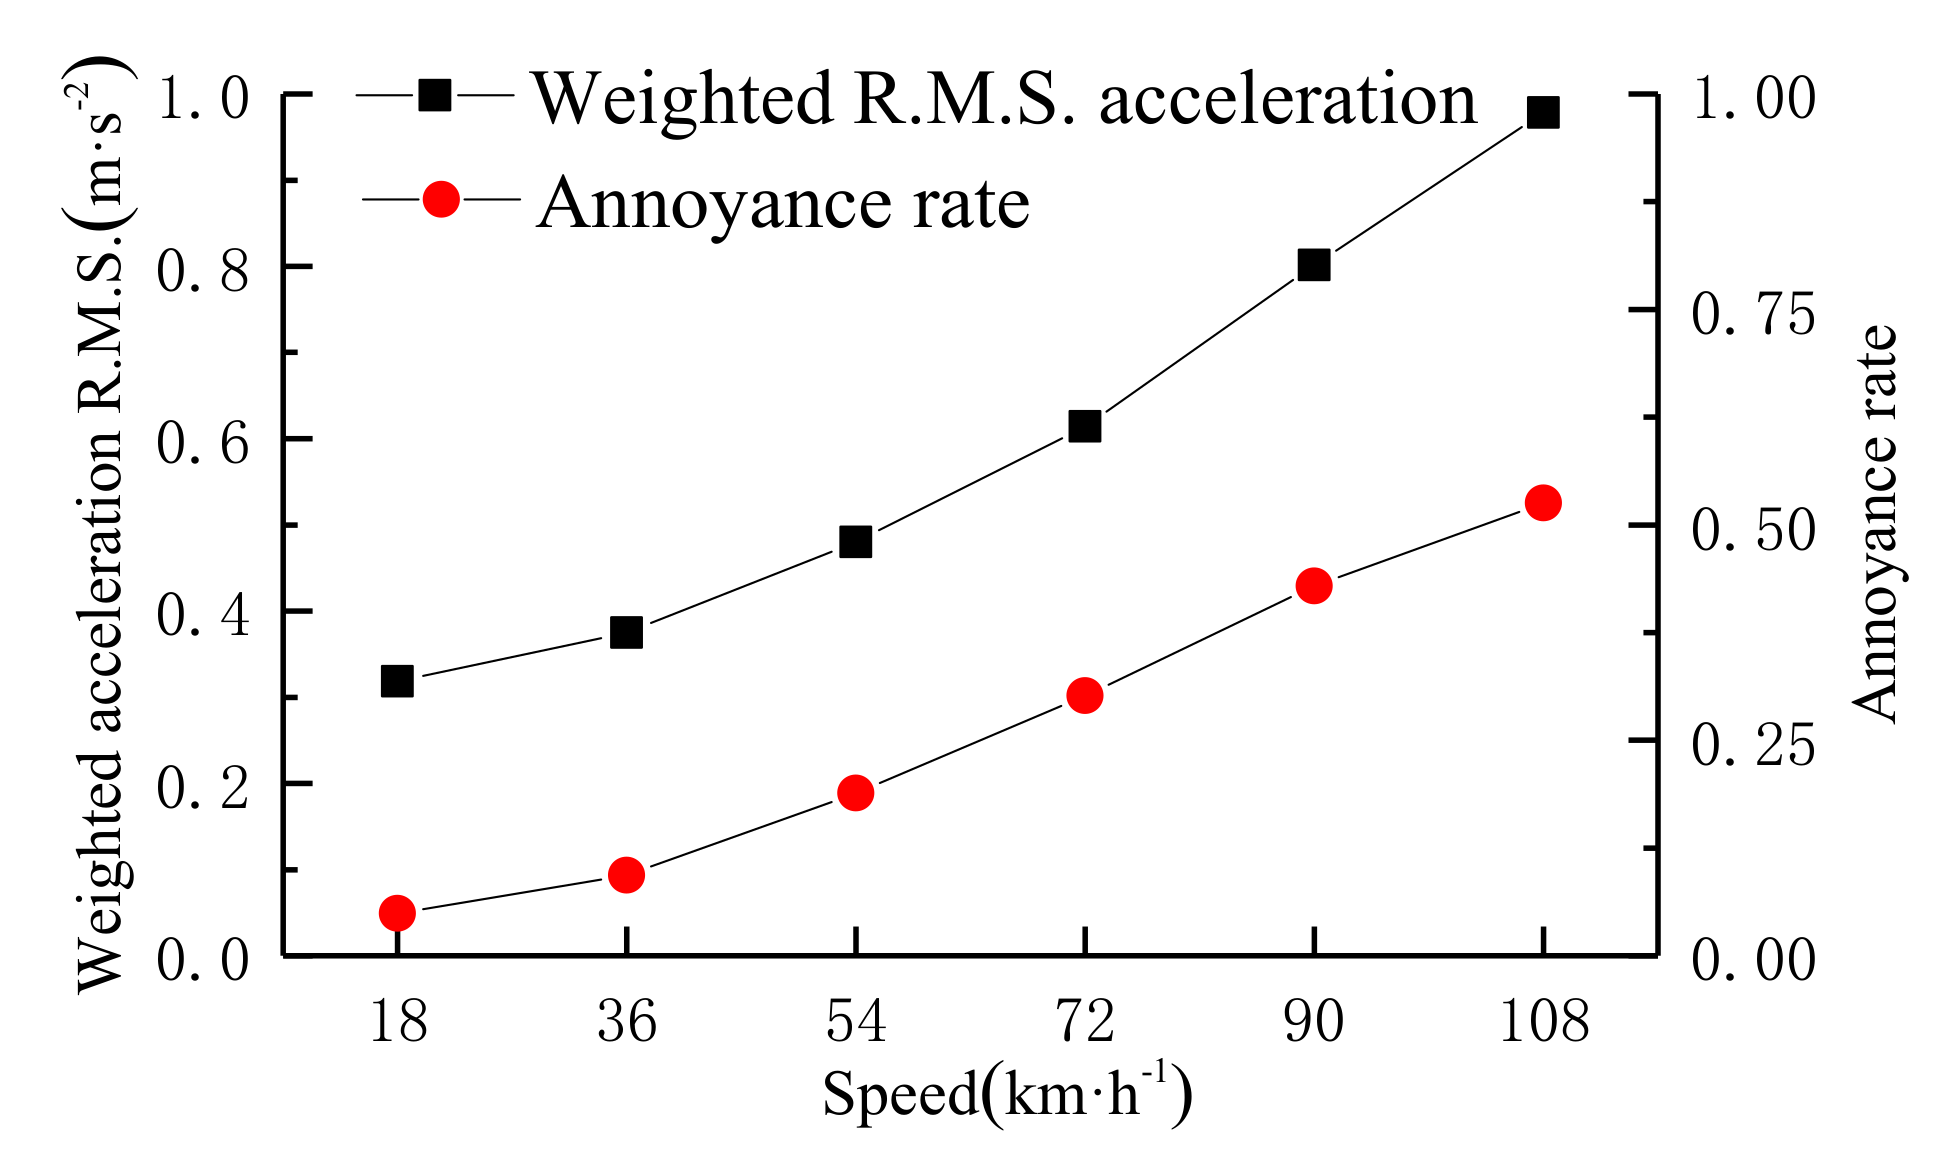
5.3. Effect of Bus Speed

The bus speed is an important factor affecting passenger comfort. Since the common bus speed is less than 120 km/h, the human comfort analysis was carried out at speeds of 18, 36, 54, 72, 90, and 108 km/h, respectively.
It can be seen in Figure 22 and Table 7 that with the gradual increase of the bus speed, the acceleration trend of the human body is consistent, showing an increasing trend. Compared with 18 km/h, the vertical acceleration, pitch acceleration, and roll acceleration at 108 km/h increased by 2.69, 1.68, and 1.97 times, respectively.
It is found in Figure 23 that as the bus speed increases, the weighted acceleration RMS of the human body gradually increases, and the annoyance rate also increases, that is, the comfort gradually decreases. The weighted acceleration RMS and the annoyance rate of the human body both show nonlinear growth.
When the bus speed is 72 km/h, the weighted acceleration RMS of the human body is 0.6142 m/s2. The weighted acceleration RMS of the human body is in the range of 0.5 to 0.8 m/s2, which is “uncomfortable” according to the ISO 2631 evaluation standard. However, the ISO 2631 evaluation results are not as intuitive as numbers; 30.16% of passengers feel uncomfortable in the annoyance rate evaluation. The annoyance rate quantifies each interval so as to make the result more intuitive and clearer.

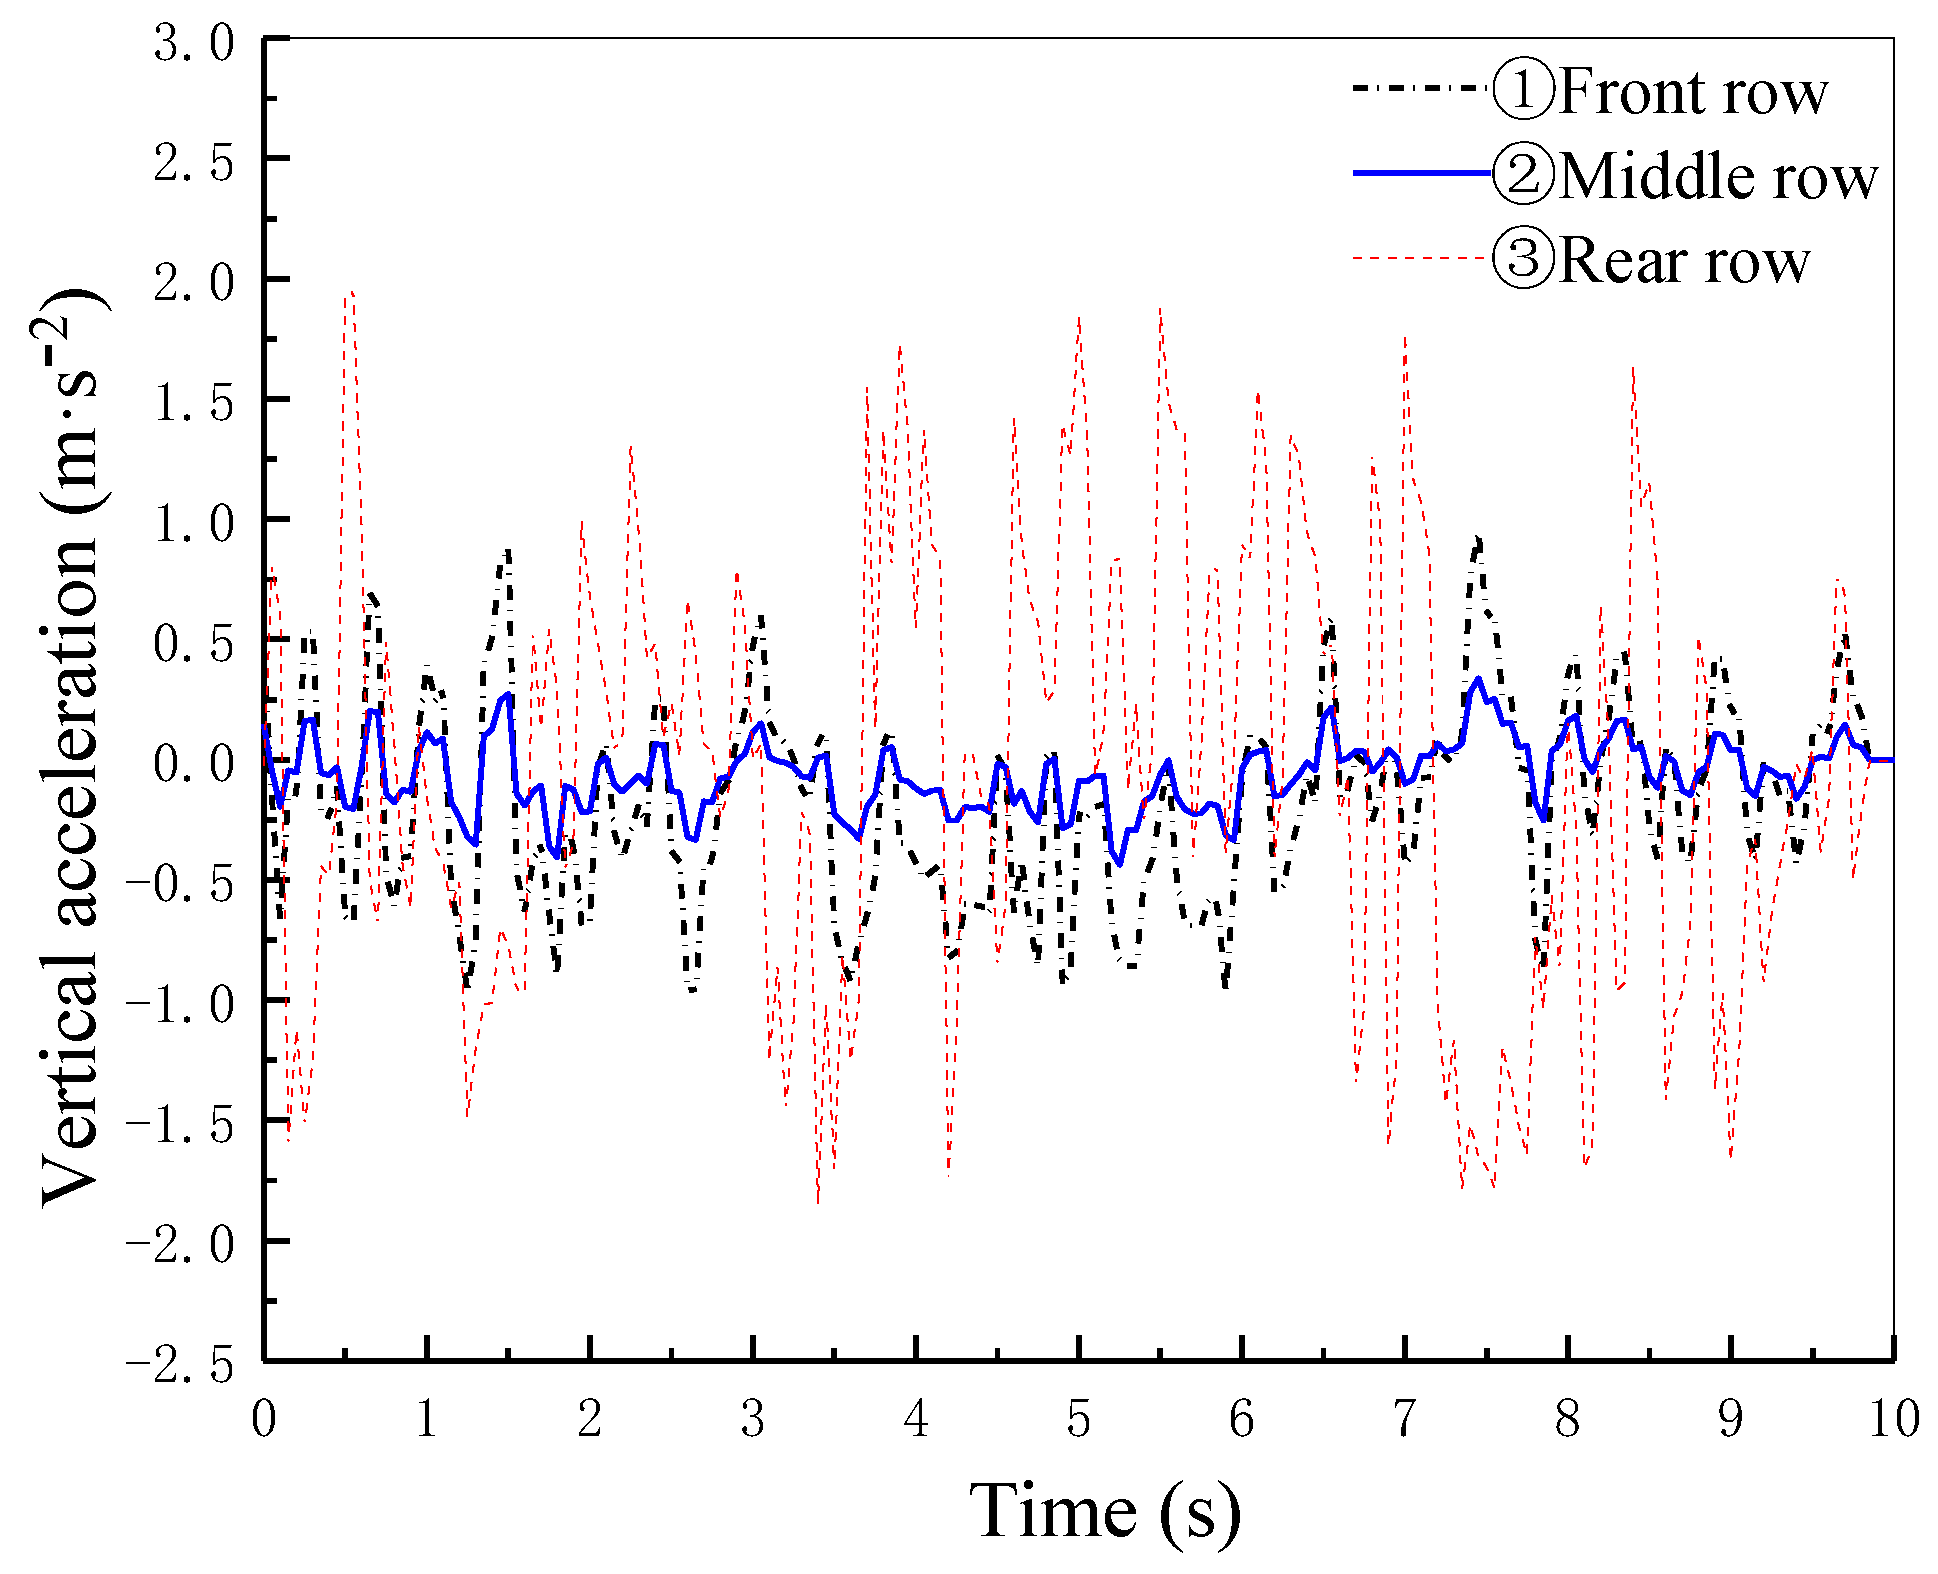
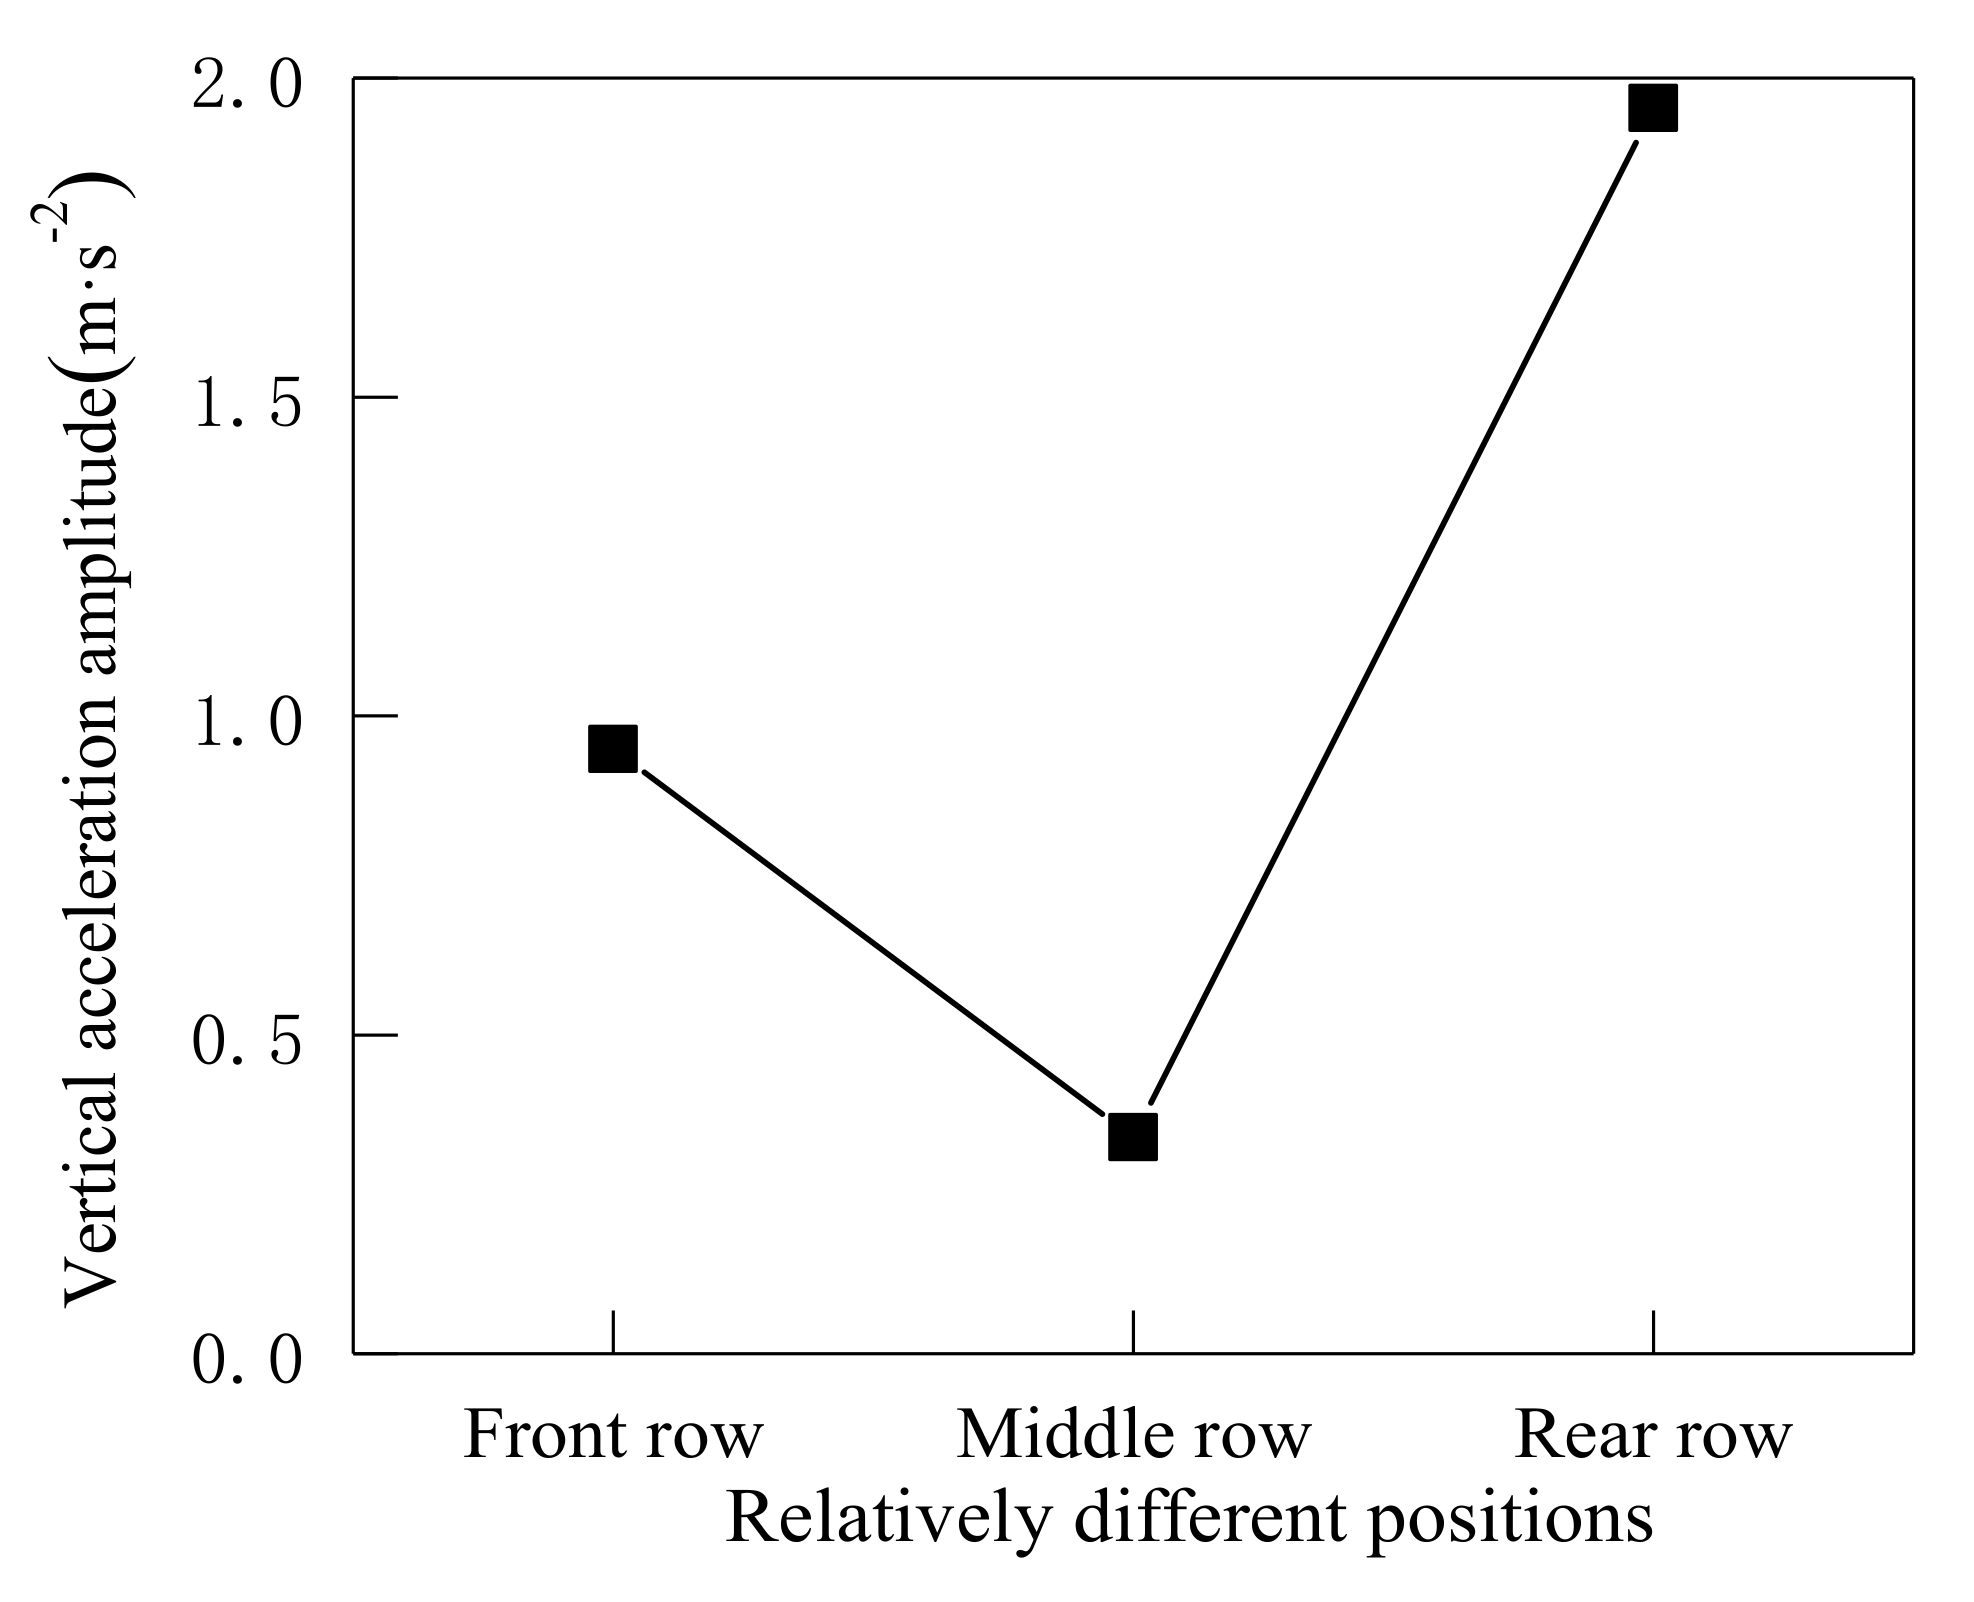
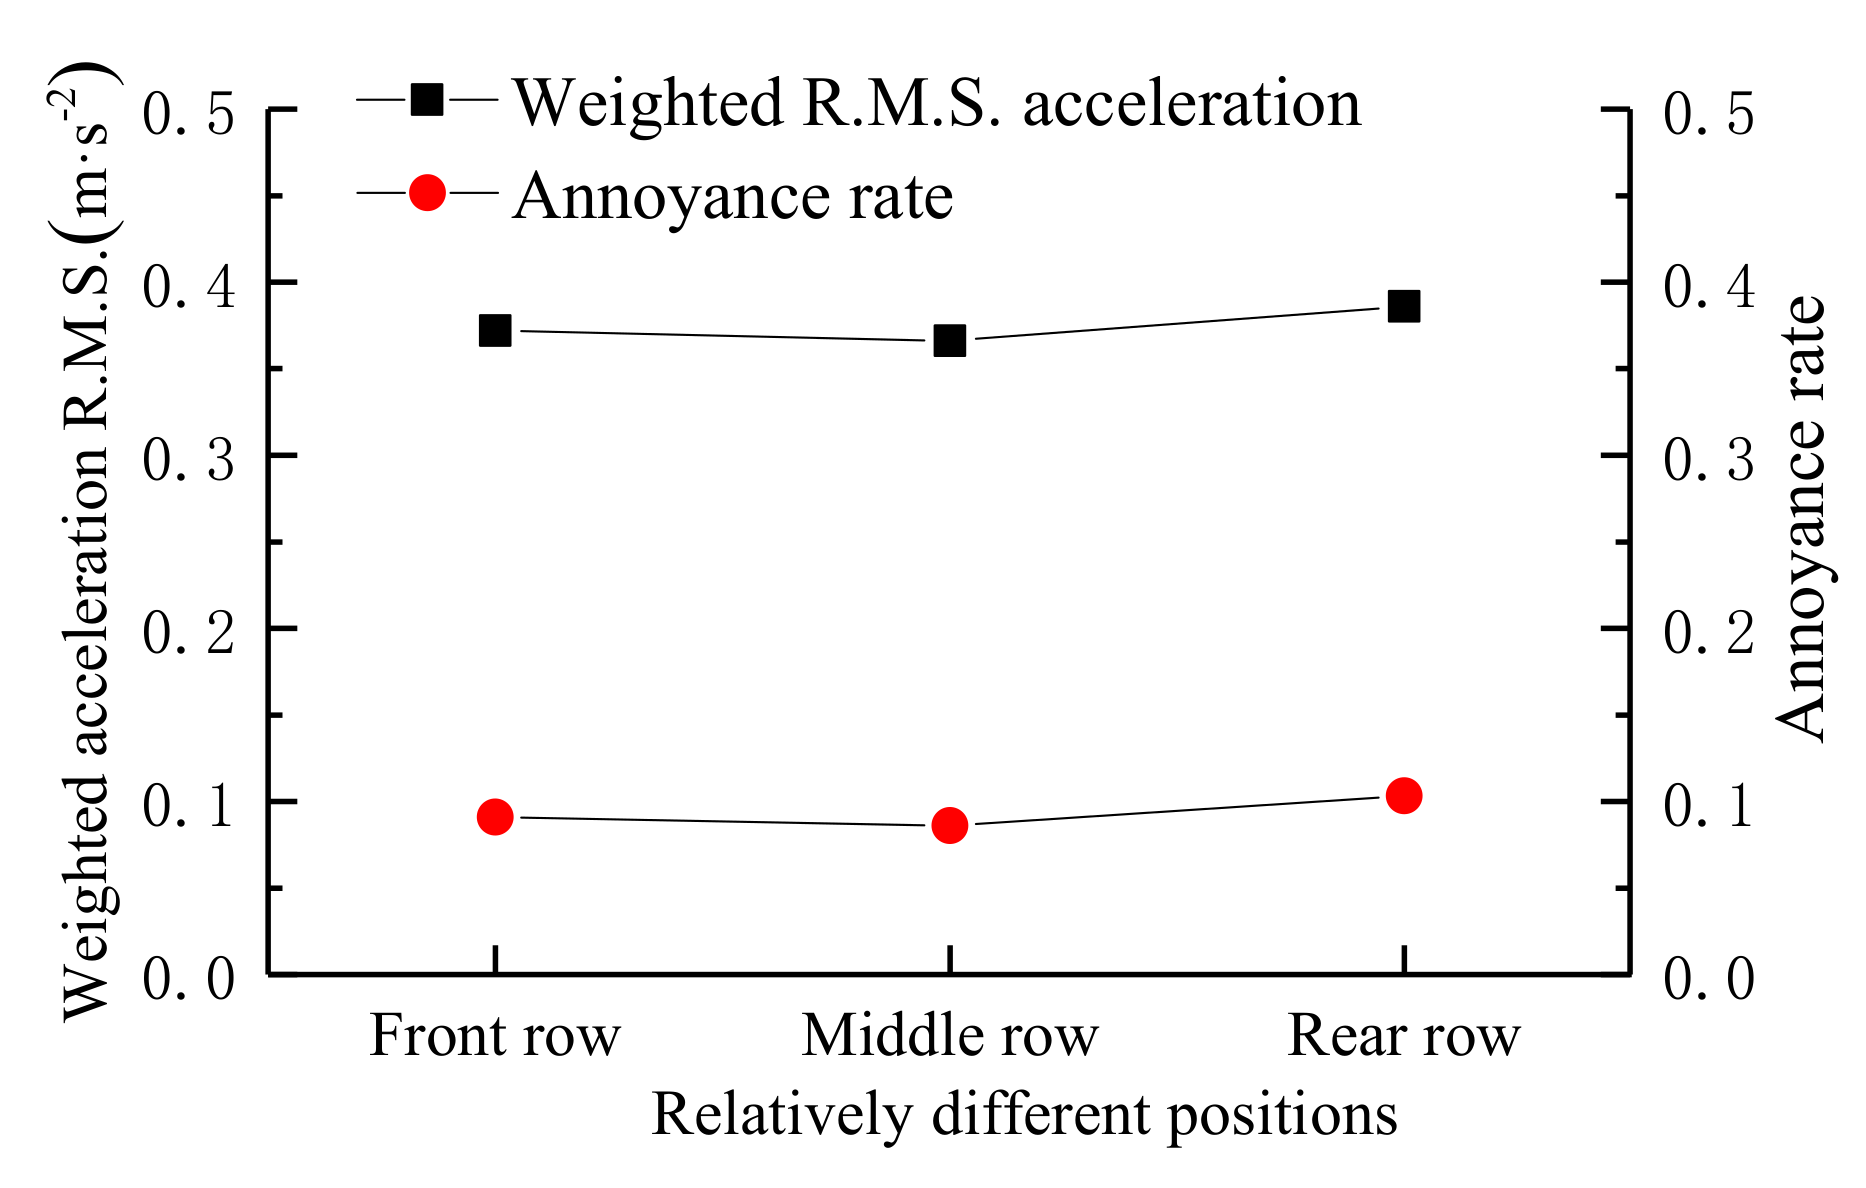
5.4. Effect of Sitting Position

It is not reasonable to use only one value to evaluate the comfort of all passengers on the bus. In order to study the influence of the sitting position on the vibration acceleration of the human body and passenger comfort, three representative positions in the front, middle, and rear rows are selected. The vertical accelerations of the human body at the three positions are shown in Figure 24.
As can be seen in Figure 25, the vertical acceleration is sensitive to the sitting position. The vertical acceleration of the human body at a specific row is obtained by multiplying the pitch angle with the distance to the bus body center. The vertical acceleration amplitude of human bodies of the front, middle, and rear row are 0.9474, 0.3393, and 1.9524 m/s2, respectively. The accelerations of the front row and rear row are much greater than that of the middle row. This is because the front and rear rows are farther away from the center of the bus. Although the distance of the front row to the center of gravity of the bus is close to that of the rear row, the stiffness of the rear suspension is greater than that of the front suspension. Therefore, the vertical acceleration in the rear row is larger than that in the front row.
It is found in Figure 26 that the weighted acceleration RMS of the human body at various positions are not too much different. On the one hand, the weighted acceleration RMS of the human body is a comprehensive consideration of the vibration in three directions, and the contribution of the vibration in each direction depends on the corresponding weight. On the other hand, according to the simplification of the bus–human model, the roll and pitch accelerations of the bus are directly used as the human acceleration, while the vertical vibration of the human body is transferred from the bus through a spring-damping system. In the calculation of the weighted acceleration RMS of the human body, the ratio of vertical acceleration to roll and pitch accelerations is relatively small. The same observation can be obtained in the comfort evaluation, as shown in Table 8. According to the ISO 2631 evaluation standard, the passengers at all the three positions are “slightly uncomfortable”, and the annoyance rates are close.

5.5. Discussion

In order to quantify the importance of different parameters on human comfort, the min and max values under each parameter and the ratio between the max and the min are summarized and shown in Table 9. The max/min ratio under each parameter can reflect the relative change when the parameter experiences the most-possible conditions. For example, in the case of interlayer bonding conditions, the ratio reflects that the RMS acceleration changes 2.3 times when the interlayer bonding is in the range of 0.1~0.9 that covers most of the interlay bonding conditions. Meanwhile, in the case of road surface, the ratio is 24.2, which means that the RMS acceleration changes 24.2 times when the road roughness condition changes between Levels A to D. It indicates that the effect of road surface roughness is much more significant than that of the interlayer bonding condition. As can be seen from the table, the bus weight and bus speed have similar effects on human comfort, while the influence of sitting positions on human comfort is relatively small. Therefore, among all the five factors, the road roughness condition has the greatest impact on human comfort.

6. Conclusions

The three-dimensional human–bus–road coupled vibration system was established to study the dynamic response and human comfort. Parametric studies were also conducted to investigate the effects of road surface roughness, interlayer bonding condition, bus weight, bus speed, and sitting position. The following conclusions can be drawn.
In order to study the interaction between human, bus, and road, the human–bus–road coupled vibration system is proposed, including the bus model, the parallel biomechanical human model with 2 DOF, and road surface roughness condition. The proposed coupled model was then used to study the dynamic response of the system and the comfort evaluation of the human body.
In the comfort evaluation, the annoyance rate based method is proposed to consider the randomness of passenger vibration, the difference of the psychosensory vibration, and the fuzziness of evaluation indicators. Compared to the fuzzy evaluation based on the ISO 2631 standard, the proposed annoyance rate based method can give out a quantitative evaluation of human comfort. Not only the degree of comfort can be evaluated, but the percentage of people feeling uncomfortable can also be obtained.
The effects of interlayer bonding conditions of the pavement, bus weight, bus speed, and sitting position on the passenger comfort were also investigated. Among all the parameters, surface road roughness has the most significant effect on human comfort.

Author Contributions

Conceptualization, G.W., J.Z., and X.K.; methodology, J.Z. and X.K.; investigation and result analysis, J.Z. and X.K.; writing—original draft, J.Z.; supervision and writing—review and editing, G.W. and X.K.; project administration, G.W. and X.K. All authors have read and agreed to the published version of the manuscript.

Funding

This research was funded by the National Natural Science Foundation of China youth fund (51408557).

Conflicts of Interest

The authors declare no conflict of interest.

References

  1. Vishwas, S. Dynamic analysis of rigid pavement with vehicle-pavement interaction. J. Pavement Eng. 2009, 10, 63–72. [Google Scholar]
  2. Zheng, L.; Hu, Z.; Yao, H.L.; Liu, J. Field evaluation and analysis of road subgrade dynamic responses under heavy duty vehicle. Int. J. Pavement Eng. 2018, 19, 1077–1086. [Google Scholar]
  3. Auersch, L. The excitation of ground vibration by rail traffic: Theory of vehicle-track-soil interaction and measurements on high-speed lines. J. Sound Vib. 2005, 284, 103–132. [Google Scholar] [CrossRef]
  4. Carroll, S.P.; Owen, J.S.; Hussein, M.F.M. Experimental identification of the lateral human-structure interaction mechanism and assessment of the inverted-pendulum biomechanical model. J. Sound Vib. 2014, 333, 5865–5884. [Google Scholar] [CrossRef] [Green Version]
  5. Kim, K.S.; Kim, J.W.; Kim, K.J. Dynamic modeling of seated human body based on measurements of apparent inertia matrix for fore-and-aft/vertical/pitch motion. J. Sound Vib. 2011, 330, 5716–5735. [Google Scholar] [CrossRef]
  6. Sharma, R.C. Evaluation of Passenger Ride Comfort of Indian Rail and Road Vehicles with ISO 2631-1 Standards Part 1-Mathematical Modelling. Int. J. Veh. Struct. Syst. 2016, 8, 1–6. [Google Scholar] [CrossRef]
  7. Wang, G.C.; Li, W.S. Analysis of vehicle comfort based on vehicle-bridge coupling vibration. J. Vib. Shock 2016, 35, 224–230. [Google Scholar]
  8. Wolfgang, R.; Limerick, R.B. Whole-body vibration exposure of haul truck drivers at a surface coal mine. Appl. Ergon. 2014, 45, 1700–1704. [Google Scholar] [CrossRef]
  9. Duarte, M.L.; Melo, M.G.C. Influence of pavement type and speed on whole body vibration (WBV) levels measured on passenger vehicles. J. Braz. Soc. Mech. Sci. Eng. 2018, 40, 3–12. [Google Scholar] [CrossRef]
  10. Specification for Design of Highway Asphalt Pavement; JTG D50-2017; China Communications Press: Beijing China, 2017.
  11. John, C.; Zayd, B.G. The Partial Fast Fourier Transform. J. Sci. Comput. 2018, 76, 1578–1593. [Google Scholar]
  12. Vaibhav, V. Fast inverse nonlinear Fourier transform. Phys. Rev. E 2018, 98, 1–14. [Google Scholar] [CrossRef] [PubMed] [Green Version]
  13. International Organization for Standardization. Mechanical Vibration-Road Surface Profiles Reporting of Measured Data; ISO 8068: Geneva, Switzerland, 1995. [Google Scholar]
  14. Deng, L.; Cai, C.S. Development of dynamic impact factor for performance evaluation of existing multi-girder concrete bridges. Eng. Struct. 2010, 32, 21–31. [Google Scholar] [CrossRef]
  15. Deng, L.; Yan, W.C.; Nie, L. A simple corrosion fatigue design method for bridges considering the coupled corrosion-overloading effect. Eng. Struct. 2019, 178, 309–317. [Google Scholar] [CrossRef]
  16. Choi, S.B.; Han, Y.M. Vibration control of electrorheological seat suspension with human-body model using sliding mode control. J. Sound Vib. 2007, 303, 391–404. [Google Scholar] [CrossRef]
  17. Wu, G.Q.; Fan, G.D.; Guo, J.B. Ride comfort evaluation for road vehicle based on rigid-flexible coupling multibody dynamics. Theor. Appl. Mech. Lett. 2013, 3, 013004–013008. [Google Scholar] [CrossRef] [Green Version]
  18. Liu, G.; Lv, Z.R.; Chen, Y.M. Improving Wilson-θ and Newmark-β Methods for Quasi-Periodic Solutions of Nonlinear Dynamical Systems. J. Appl. Math. Phys. 2018, 06, 1625–1635. [Google Scholar] [CrossRef] [Green Version]
  19. International Organization for Standardization. Mechanical Vibration and Shock-Evaluation of Human Exposure to Whole-body Vibration-part1, General Requirements; ISO 2631-1: Geneva, Switzerland, 1997. [Google Scholar]
  20. Kong, X.; Cai, C.S.; Hu, J.X. The State-of-the-art on framework of vibration-based structural damage identification for decision making. Appl. Sci. 2017, 7, 497. [Google Scholar] [CrossRef] [Green Version]
  21. Dóra, H. Calculation model of road traffic noise annoyance rate in urban areas. Pollack Period. 2014, 9, 41–47. [Google Scholar]
  22. Blair, A.N.; Ayyub, B.M.; Bender, W.J. Fuzzy stochastic risk-based decision analysis with the mobile offshore base as a case study. Mar. Struct. 2001, 14, 69–88. [Google Scholar] [CrossRef]
  23. Chou, K.C.; Yuan, J. Fuzzy-Bayesian approach to reliability of existing structures. J. Struct. Eng. 1993, 119, 3276–3290. [Google Scholar] [CrossRef]
  24. Song, Z.G. New Theory of Vibration Comfort Design of Engineering Structures Based on Annoyance Rate Model; Zhejiang University: Hangzhou, China, 2003. [Google Scholar]
  25. Griffin, M.J.; Whitham, E.M. Individual variability and its effect on subjective and biodynamic response to whole-body vibration. J. Sound Vib. 1978, 58, 239–250. [Google Scholar] [CrossRef]
  26. Peng, M.J.; Zhao, W.X. Influence of interlayer contact on anti-rutting performance of asphalt pavement. J. Highw. Transp. Res. 2016, 33, 1–6. [Google Scholar]
  27. GB/T7031-1986, Vehicle Vibration-Describing Method for Road Surface Irregularity; Standards Press of China: Beijing, China, 1987.
  28. Sekulic´, D. Analysis of vibration effects on the comfort of intercity bus users by oscillatory model with ten degrees of freedom. Appl. Math. Model. 2013, 37, 8629–8644. [Google Scholar] [CrossRef]
  29. Gao, J.H.; Hou, Z.C.; He, L.; Xia, Q.S. Vertical vibration characteristics of seated human bodies and a biodynamic model with two degrees of freedom. Sci. China Technol. Sci. 2011, 10, 2776–2784. [Google Scholar] [CrossRef]
  30. Obrien, E.J.; Enright, B. Modeling same-direction two-lane traffic for bridge loading. Struct. Saf. 2011, 33, 296–304. [Google Scholar] [CrossRef]
  31. Sieniawska, R.; Sniady, P. Life expectancy of highway bridge due to traffic load. J. Sound Vib. 1990, 140, 31–38. [Google Scholar] [CrossRef]
Figure 1. Three views of the bus model: (a) side view; (b) front view; (c) top view.
Applsci 10 03254 g001
Figure 2. Two degrees-of-freedom (DOF) human biomechanical vibration model.
Applsci 10 03254 g002
Figure 3. The vertical displacement of the human–bus–road model.
Applsci 10 03254 g003
Figure 4. Finite element model of asphalt road.
Applsci 10 03254 g004
Figure 5. Road roughness curves of B and C levels.
Applsci 10 03254 g005
Figure 6. C-level roughness power spectral density (PSD) by the Fourier inverse transformation (FIT) method.
Applsci 10 03254 g006
Figure 7. C-level road surface roughness PSD by random sine wave superposition method.
Applsci 10 03254 g007
Figure 8. The bus–human dynamics model.
Applsci 10 03254 g008
Figure 9. Time history of vertical acceleration at B-level road roughness.
Applsci 10 03254 g009
Figure 10. Time history of human body vertical acceleration with B- and D-level road roughness.
Applsci 10 03254 g010
Figure 11. Time history of human body pitch acceleration with B- and D-level road roughness.
Applsci 10 03254 g011
Figure 12. Time history of human body roll acceleration with B- and D-level road roughness.
Applsci 10 03254 g012
Figure 13. The vertical acceleration amplitude with four levels of road roughness.
Applsci 10 03254 g013
Figure 14. The pitch and roll acceleration amplitudes with four levels of road roughness.
Applsci 10 03254 g014
Figure 15. Annoyance rate curve.
Applsci 10 03254 g015
Figure 16. The weighted acceleration RMS of the human body for four levels of road roughness.
Applsci 10 03254 g016
Figure 17. Annoyance rate curve for four levels of road roughness.
Applsci 10 03254 g017
Figure 18. The acceleration amplitude for different interlayer bonding conditions.
Applsci 10 03254 g018
Figure 19. The weighted root mean square (RMS) of human body acceleration and annoyance rate for different interlayer bonding conditions.
Applsci 10 03254 g019
Figure 20. The acceleration amplitude for different weights of the bus.
Applsci 10 03254 g020
Figure 21. The weighted RMS of human body acceleration and annoyance rate for different weights of the bus.
Applsci 10 03254 g021
Figure 22. The acceleration amplitude for different bus speeds.
Applsci 10 03254 g022
Figure 23. The weighted RMS of human body acceleration and annoyance rate for different bus speeds.
Applsci 10 03254 g023
Figure 24. Time history of human body vertical accelerations in different positions.
Applsci 10 03254 g024
Figure 25. The vertical acceleration amplitude in different positions.
Applsci 10 03254 g025
Figure 26. The weighted RMS of human body acceleration and annoyance rate in different positions.
Applsci 10 03254 g026
Table 1. Comfort evaluation—ISO 2631standard.
Weighted RMS Accelerations/m·s−2Reactions
<0.315not uncomfortable
0.315-0.63a little uncomfortable
0.5–1fairly uncomfortable
0.8–1.6uncomfortable
1.25–2.5very uncomfortable
>2.0extremely uncomfortable
Table 2. Structural parameters of asphalt road.
Structure LayerThickness/cmElastic Modulus/MPaPoisson’s RatioDensity/(kg/m3)Damping Ratio (ζ)
Upper layer1014000.2525000.05
Lower layer1012000.2525000.05
Base2010000.2524000.05
Subbase209000.2523000.05
Soil foundation540600.419000.05
Table 3. Parameters of the bus IK-301.
ParametersDescriptionValues
m b elastic-suspended mass of the fully-loaded bus15,890 kg
m f m the front axle mass746 kg
m r m the rear axle mass1355 kg
J x the suspended mass moment of inertia relative to the x-axis13,000 kg·m2
J y the suspended mass moment of inertia relative to the y-axis150,000 kg·m2
J x 1 the front axle moment of inertia relative to the x1 axis350 kg·m2
J x 2 the rear axle moment of inertia relative to the x2 axis620 kg·m2
k b i single airbag stiffness on the front and the rear axle200,000 N/m
C b i single airbag damping on the front and the rear axle45,973 Ns/m
K w i single tire stiffness on the front and the rear axle1,000,000 N/m
C w i single tire damping on the front and the rear axle150 Ns/m
Table 4. Evaluation of human comfort under four road surface conditions.
Road Surface ConditionWeighted RMS Acceleration /m·s−2ReactionsAnnoyance Rate
A level0.1432not uncomfortable0.0009%
B level0.3748slightly uncomfortable9.33%
C level0.9862uncomfortable52.90%
D level3.4663extremely uncomfortable94.15%
Table 5. Evaluation of human comfort for different interlayer bonding conditions.
Friction CoefficientWeighted RMS Acceleration /m·s−2ReactionsAnnoyance Rate
0.10.5214slightly uncomfortable22.54%
0.30.4507slightly uncomfortable16.19%
0.50.3748slightly uncomfortable9.33%
0.70.2780not uncomfortable2.48%
0.90.2272not uncomfortable0.69%
Table 6. Evaluation of human comfort for different weights of the bus.
Weight of Bus/tWeighted RMS Acceleration /m·s−2ReactionsAnnoyance Rate
11.570.6998uncomfortable36.38%
13.730.5032slightly uncomfortable20.94%
15.890.3748slightly uncomfortable9.33%
16.970.2928not uncomfortable3.27%
18.050.2278not uncomfortable0.71%
Table 7. Evaluation of human comfort for different bus speeds.
Speed/km·h−1Weighted RMS Acceleration /m·s−2ReactionsAnnoyance Rate
180.3186slightly uncomfortable4.90%
360.3748slightly uncomfortable9.33%
540.4799slightly uncomfortable18.85%
720.6142uncomfortable30.16%
900.8015extremely uncomfortable42.90%
1080.9782extremely uncomfortable52.51%
Table 8. Evaluation of human comfort in different positions.
Ride LocationWeighted RMS Acceleration /m·s−2ReactionsAnnoyance Rate
Front row0.3721slightly uncomfortable9.09%
Middle row0.3662slightly uncomfortable8.59%
Rear row0.3861slightly uncomfortable10.31%
Table 9. The importance of the different parameters.
ParametricRMS AccelerationRatioAnnoyance RateRatio
MinMaxMax/MinMinMaxMax/Min
Road roughness0.14323.466324.20.0009%94.15%104,611.1
Interlayer bonding0.22720.52142.30.69%22.54%32.7
Bus weight0.22780.69983.10.71%36.38%51.2
Bus speed0.31860.97823.14.90%52.51%10.7
Sitting Position0.36620.38611.18.59%10.31%1.2

