Article

Study on Pressure Characteristics and Its Evolution Law at the Ellipsoidal End Cover Pole of Cylindrical Explosion Containment Vessels

1
College of Field Engineering, Army Engineering University of PLA, Nanjing 210007, China
2
Unit No.31696 of PLA, Jinzhou 121017, China
*
Author to whom correspondence should be addressed.
Appl. Sci. 2020, 10(9), 3060; https://doi.org/10.3390/app10093060
Submission received: 25 February 2020 / Revised: 23 April 2020 / Accepted: 24 April 2020 / Published: 28 April 2020
(This article belongs to the Special Issue Computational Methods in Vibration Problems and Wave Mechanics)

Abstract

:
To explore the postposition of the maximum pressure at the pole of the ellipsoidal end cover of cylindrical explosion containment vessels and to reveal the mechanism of the load evolution, the experimental method was used to measure the pressure curve at the pole under different charges, and the numerical simulation method was used to analyze the evolution law of the explosion flow field within the end cover. The results show that the end cover pole was subjected to three types of pressure: the primary explosion wave, the secondary shock wave and the convergence wave. In addition, the pressure peaks increased in sequence. The evolution of the flow field in the end cover was affected by the amount of charge and the aspect ratio of the vessel. When the scaled distance due to a small charge increased, or when the aspect ratio of the vessel was reduced, the time interval between the convergence wave and the secondary shock wave at the end cover pole decreased gradually. When the scaled distance increased to 4.05 m·kg−1/3, the convergence wave at the pole superimposed on the secondary shock wave. As the aspect ratio of the vessel ranged from 1.75 to 2.50, the time interval between the two peaks was about 150 μs. However, if the aspect ratio was less than 1.40, the convergence wave and the secondary shock wave were fused through complex interaction.

1. Introduction

As a limiting device for blast wave and explosion products, the explosion containment vessel has wide applications in both military and civil fields. It was found that the maximum pressure of the end cover pole of the container is not the first pressure peak, but a subsequent one. W. H. Zhu et al. [1] used the TVD (Total Variation Diminishing) numerical method, combined with the analytical solution of a strong explosion, to analyze the internal load distribution of a cylindrical explosion container. They proposed that due to the interaction between waves, the pressure characteristics at the end cover pole were very complex, and multiple pressure peaks might be present. S. Kevorkian et al. [2] observed that, in the internal explosion experiment of a cuboid explosion container, the center of the cover plate at the far end of the explosion was affected by four simultaneous reflections by the chamber wall. It was suggested that the second pressure peak corresponding to the largest value appeared a few microseconds later than the first one. C. F. Zhao et al. [3] analyzed the internal explosion loading and the structural stability of the cylindrical reinforced concrete containment by numerical simulation. It was found that the explosion shock wave was repeatedly reflected in the vessel, and the dome of the container may have been subjected to the strongest impact. By the means of experiment and numerical simulation, C. Q. Wu et al. [4] studied the pressure distribution of an explosion in an irregular confined blast chamber. They found that the second pressure peak had a high intensity and even exceeded the first peak at gauges near the chamber wall or the corner. Z. Wang et al. [5] used a TNT (2,4,6-Trinitrotoluene) equivalent numerical model to analyze the explosion impact load inside the steel container, and found that due to the convergence effect of shock waves, the maximum load occurred in the pole area of the dome and all occurred in the second or third peak of the waveform. V. Pickerd et al. [6], through experiments and numerical simulation, found that the second peak was much higher than the first peak, which was on the gauges at the edge and corner of the cubic explosive vessel. W. B. Wang et al. [7] used numerical models with different zoom ratios to analyze the pressure load distribution of a single-layer spherical lattice shell structure, in which the maximum pressure at the pole always appeared at the second peak. Z. R. Li et al. [8] experimentally measured the pressure, which was loaded on the cover plate of a cylindrical vessel, with an aspect ratio of 2:1, indicating that the pressure load on it presented multiple wave peaks, and the maximum peak of the pressure load at the center of the cover plate was three times higher than the first. In addition, A. F. Demchuk [9], V. M. Kornev [10], R. R. Karpp [11], T. A. Duffey [12], Q. Dong [13,14,15], W. X. Liu [16] and other scholars have conducted fruitful studies on the distribution of the internal load, vibration response, failure analysis and the design criteria of the explosion containment vessel.
To explore the postposition phenomenon of the maximum pressure at the end cover pole, but also to reveal its load evolution mechanism, this paper introduced an experimental result on the pressure load of the pole of the ellipsoidal end cover and a numerical simulation on the evolution and distribution of explosive flow field over various charges and aspect ratios. This study was intended to provide references for the study of the distribution law of explosion, which loads in the container, and the design of the anti-detonation strength of the explosion containment vessel.

2. Experiment

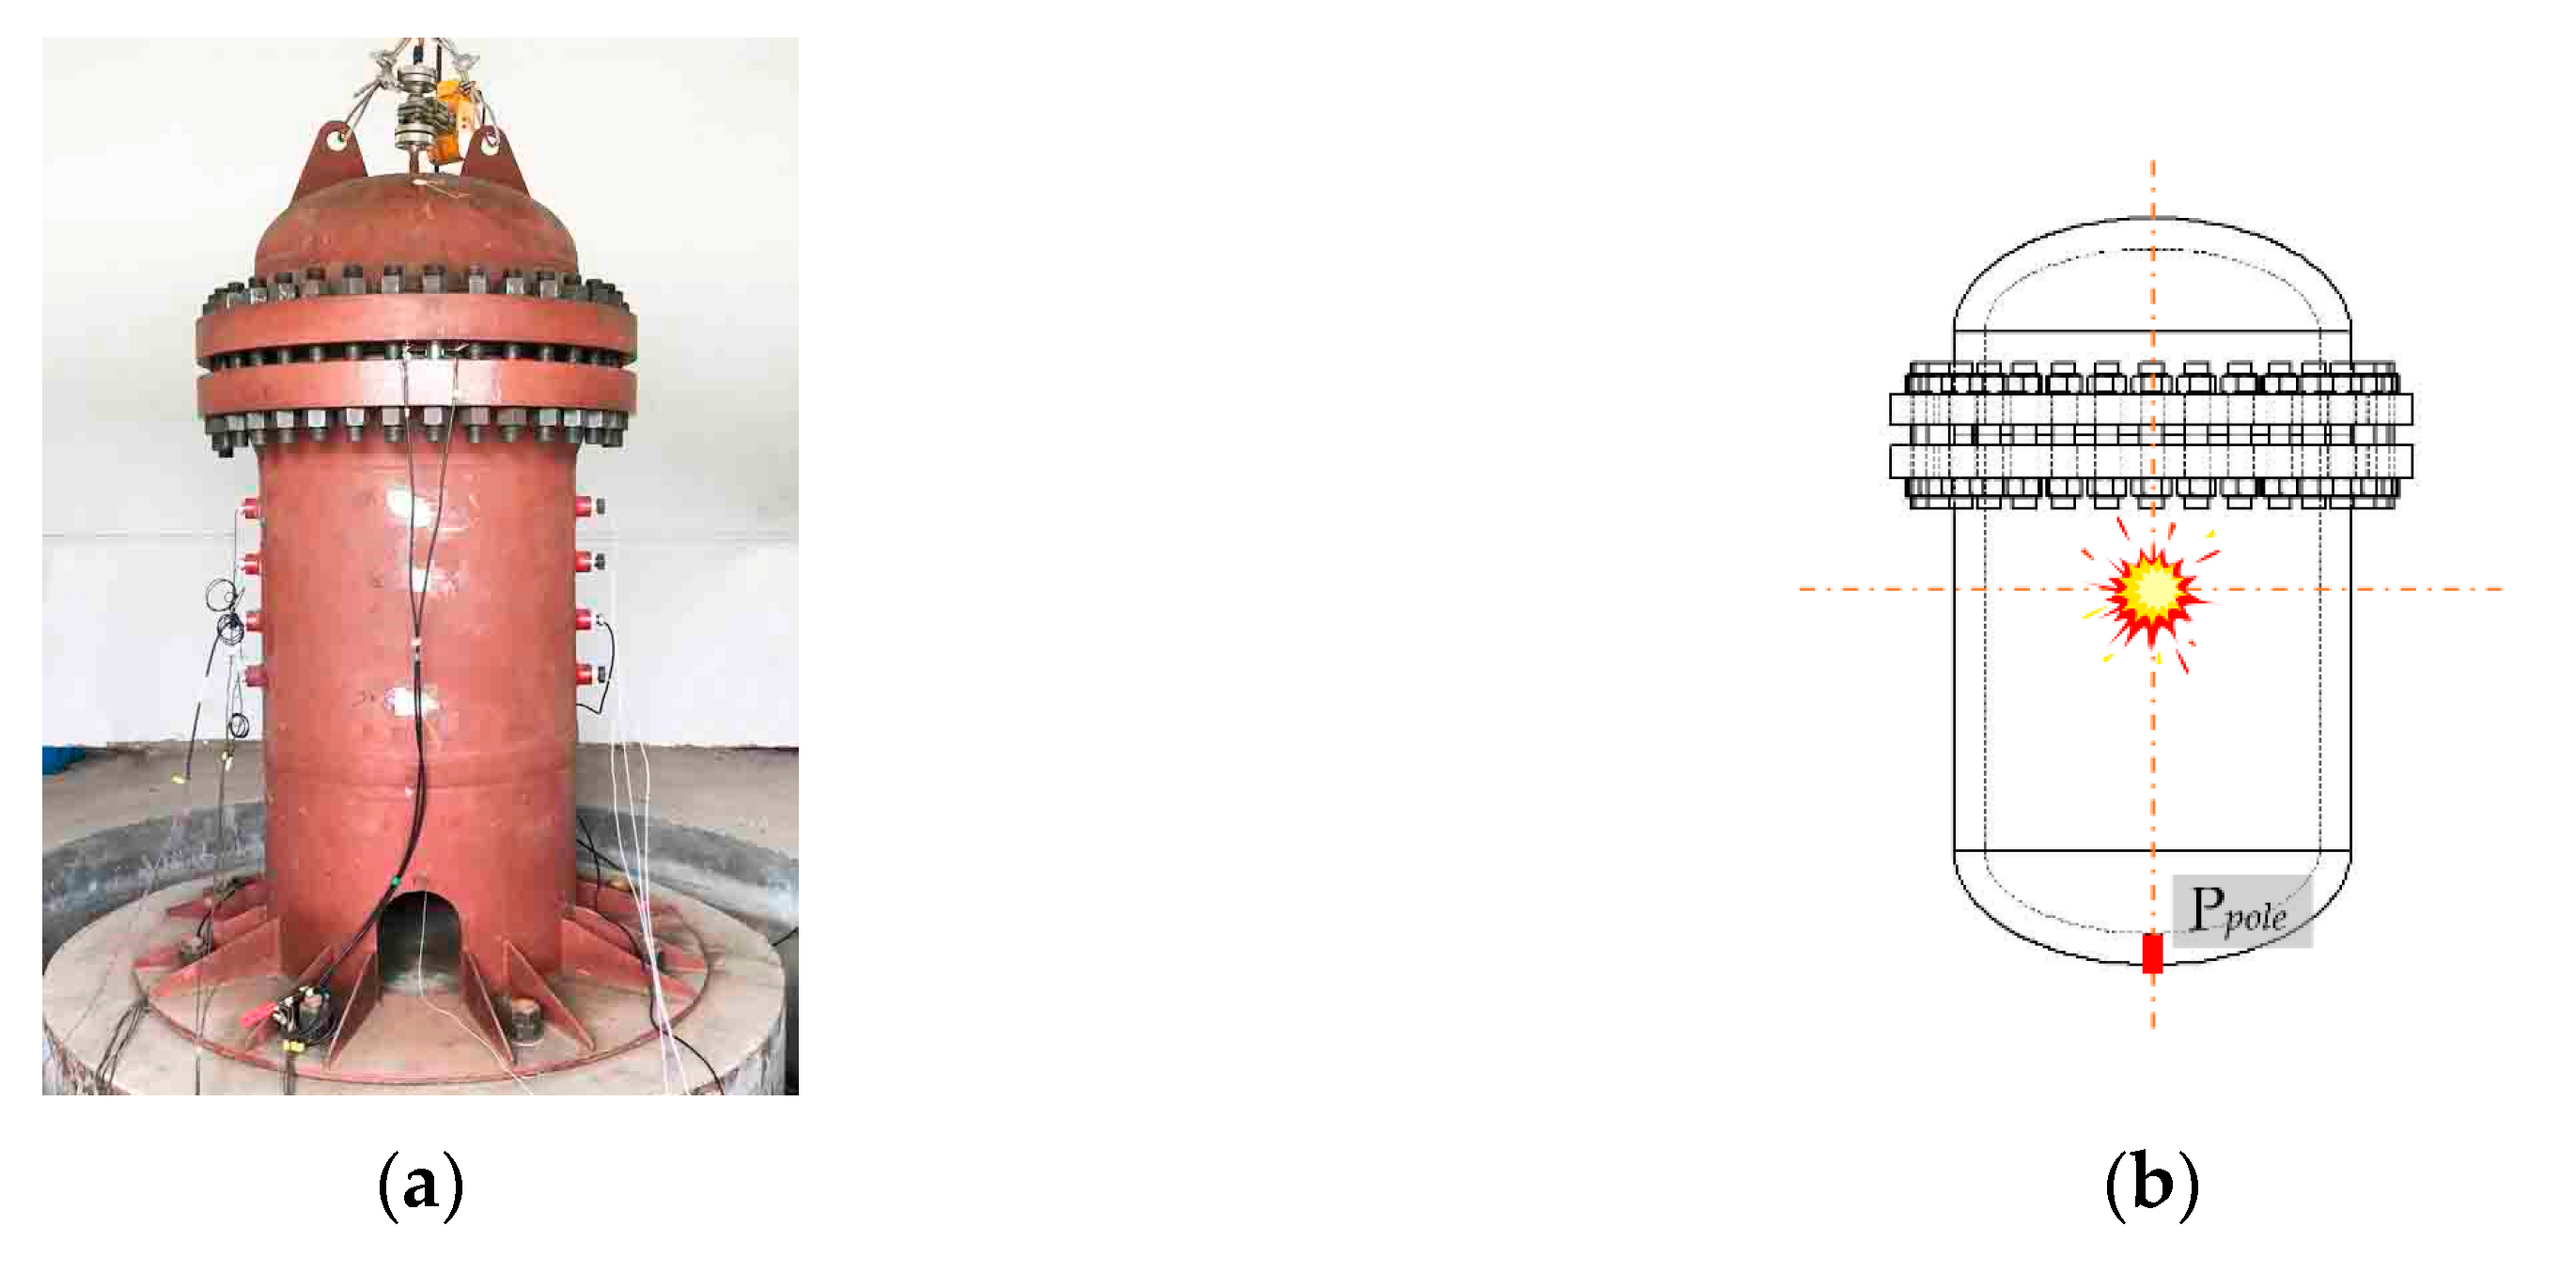
2.1. Experimental Setup

The explosion containment vessel and the measures used in this experiment are shown in Figure 1a. The total length L of the vessel was 166.4 cm, the thickness 2δ of the vessel wall was 2.2 cm, the inner major axis diameter Da of the ellipsoidal end cover was 80 cm, the inner minor axis diameter Db was 40 cm and the aspect ratio (L-4δ)/(Da) was 2.025. The internal shape of the upper end cover of the container and the ellipsoidal container bottom were the same. Therefore, a pressure-measuring point Ppole was set at the bottom of the container, as shown in Figure 1b. When the spherical charge was detonated in the center of the container, its pressure curve should have been the same as that of the upper end of the container. Four kinds of compressed TNT spherical charges with 27 g, 65 g, 106 g and 155 g were set, with a density of 1.50 g·cm−3. The TNT charge ball was hoisted in the center of the container and the central detonation method was adopted.

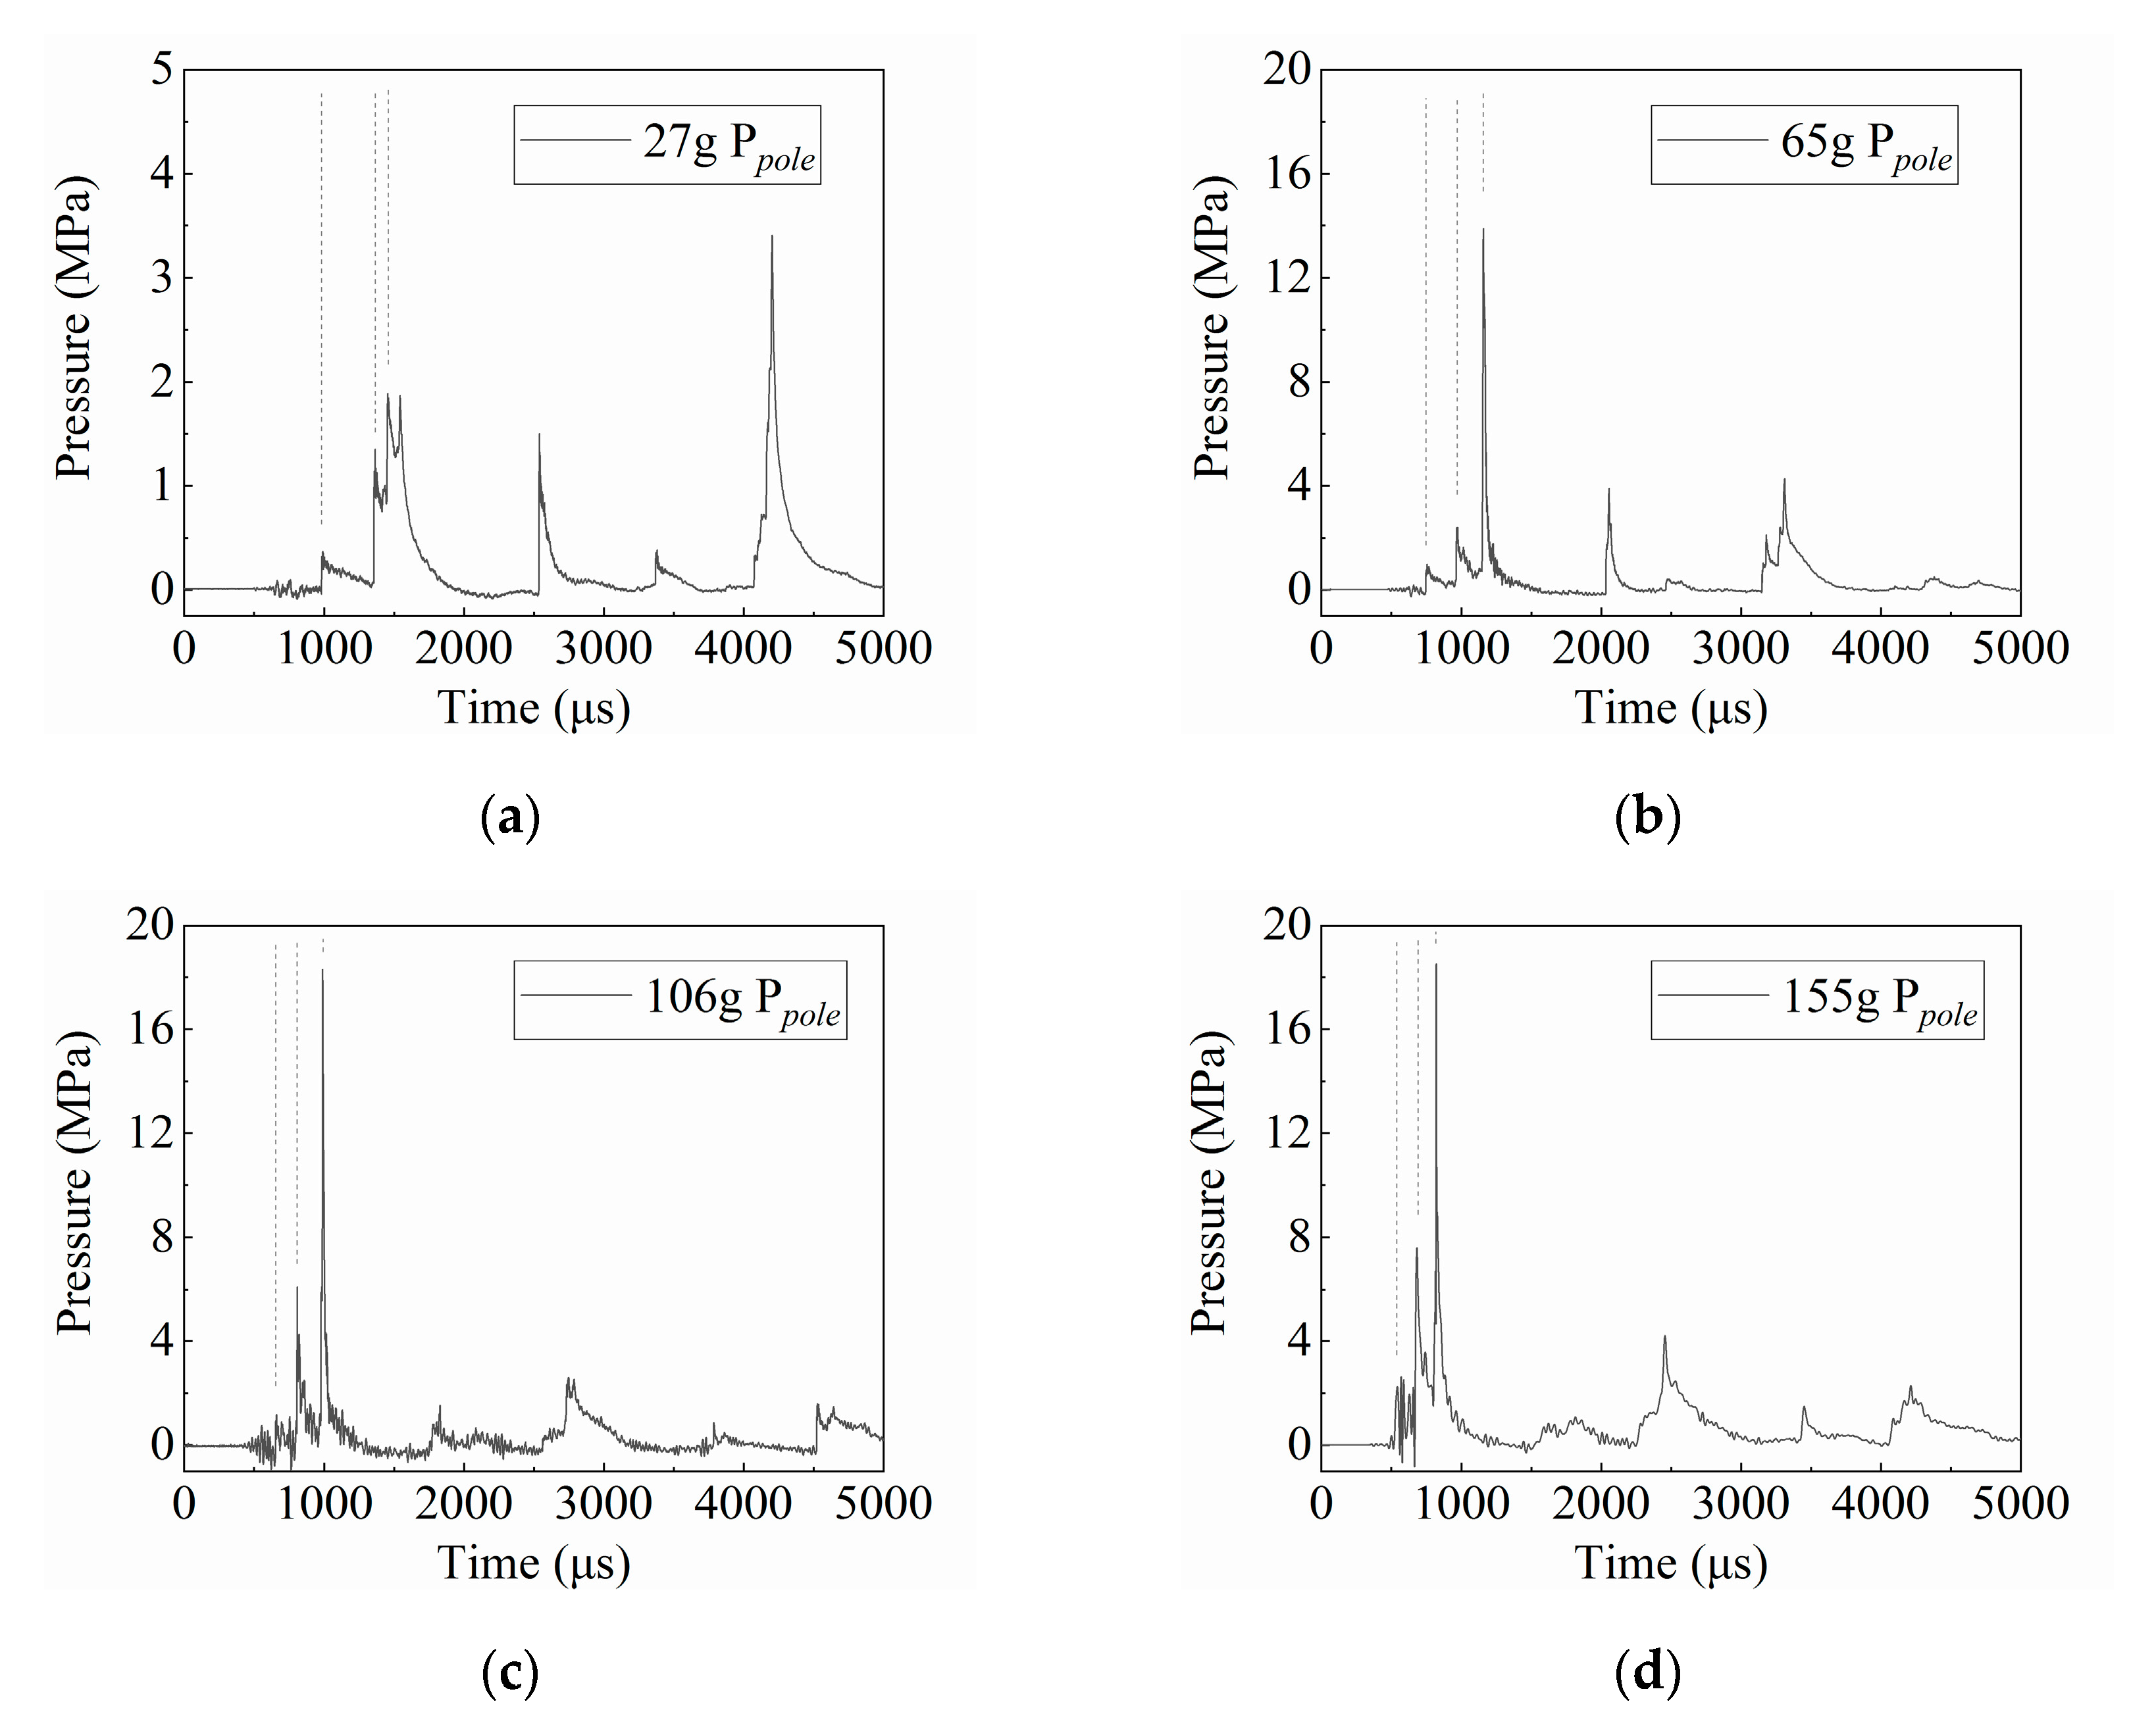
2.2. Experimental Results

Based on previous numerical simulation studies [5,7], it was generally believed that the initial pressure stage at the end cover pole was divided into two parts: first, the explosion shock wave inside the charge was encountered at the pole and the reflected pressure was generated. Then, the convergence collision wave of the shock wave was formed at the pole, and the convergence pressure was significantly higher than the first pressure peak. Z. R. Li et al. [8] believed that the central area of the end cover was first affected by the blast wave, and then by the superposition of the wall reflection wave, the secondary shock wave and then by the cover reflection wave. In this test, the time history curve of pressure was measured at the measuring point Ppole at the end cover pole, as shown in Figure 2. However, what differed from previous research results was the presence of three increasing pressure peaks in a row at the initial pressure stage of the end cover pole. For example, in Figure 2b, at the initial stage (700 μs–1500 μs), there are three pressure peaks, 0.99 MPa, 2.41 MPa and 13.89 MPa, respectively. In order to explore this phenomenon and reveal the mechanism of load evolution, numerical simulation was used for the analysis and discussion in the following article.

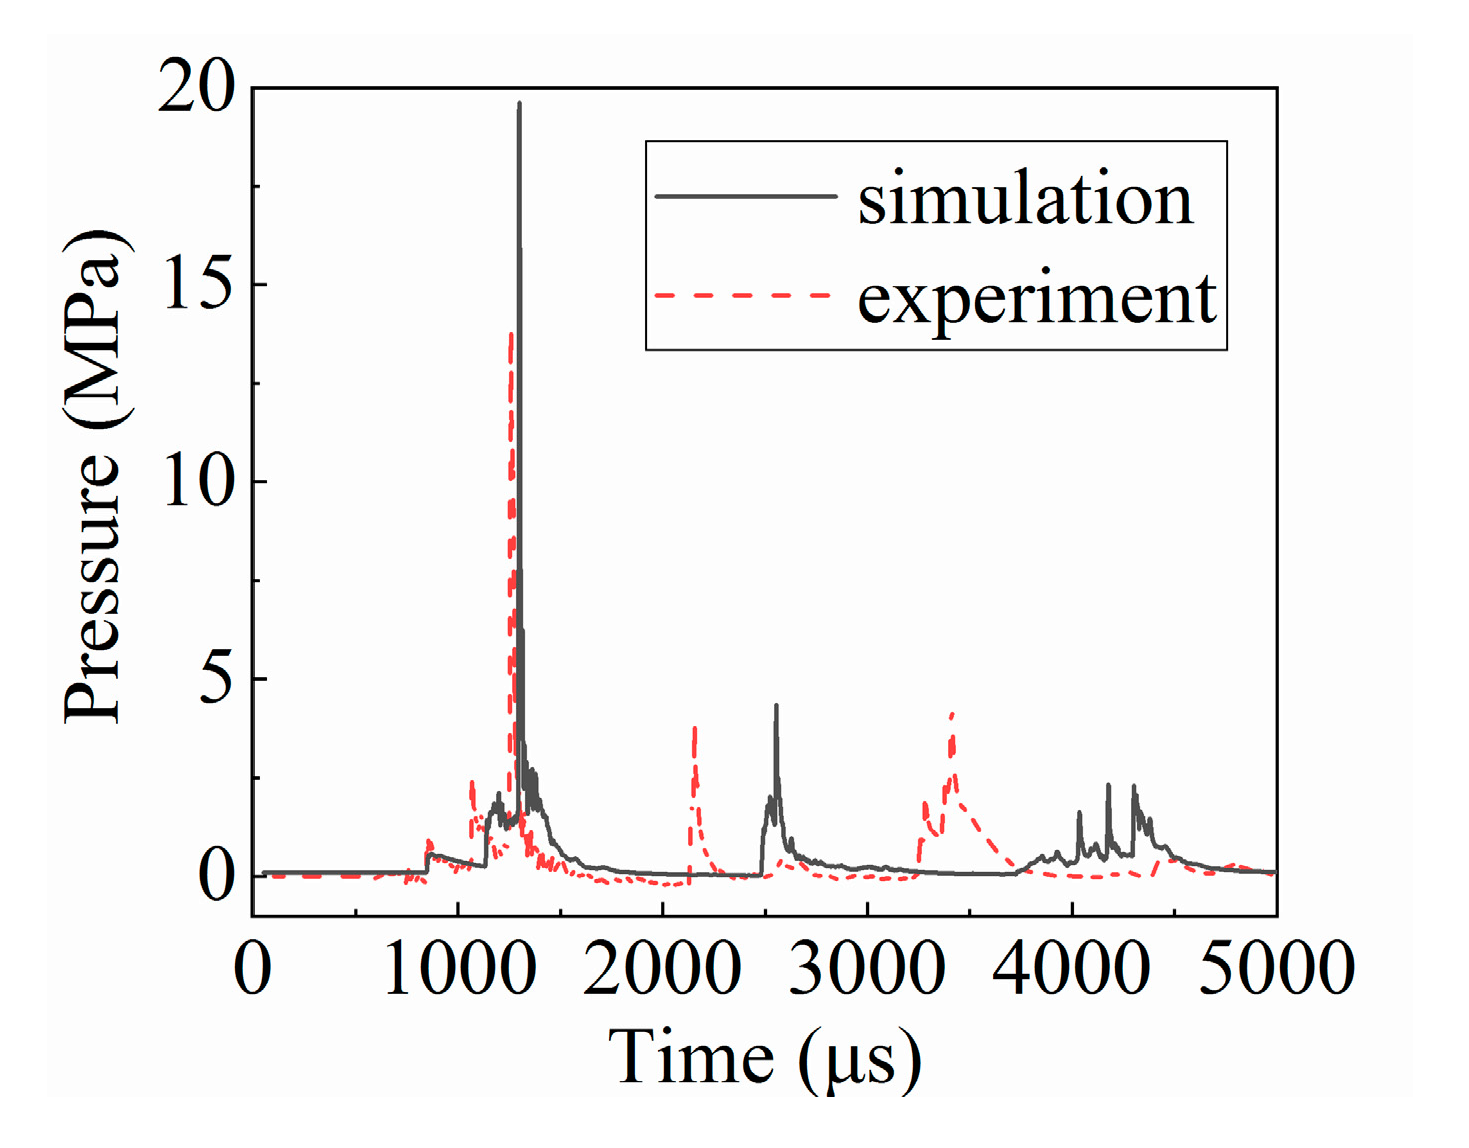
3. Numerical Simulation

3.1. Modeling and Parameters

As the TNT charges detonated in the center of the container, the distribution of the internal flow field was symmetrical. Therefore, a two-dimensional model could be used to describe the distribution evolution law. In order to ensure the calculation accuracy of the flow field inside the container, the mesh size of the solid was limited to less than 0.6 cm, and the mesh size of the air was 0.1 cm. For the convenience of calculation, the flange, bolt and other structures independent of the internal flow field were simplified in the model, and the 1/4 containment vessel model was adopted as shown in Figure 3. The mapping method was used to map the calculation results of the one-dimensional explosive shock wave to the two-dimensional model, which ensured the calculation accuracy while maintaining simpler calculations [17,18,19]. The symmetrical boundaries of the two planes, both xoz and yoz, were set, respectively. The initial volume fraction method, *INITIAL_VOLUME_FRACTION_GEOMETRY, was used to fill the explosive at the origin of the one-dimensional air grid.
The body and end cover of the explosion containment vessel were made of Q345R steel and the vessel wall was 2.2 cm thick. The deformation of these solids under pressure loads had little effect on the flow field [20,21]. Therefore, the solid deformation was ignored, and *MAT_RIGID could be selected for the material model. The material density ρ0 was 7.85 g·cm−3, the Young’s modulus E was 209 GPa and the Poisson’s ratio ν was 0.28.
A high energy explosive combustion model was used to describe the explosive, with the keyword *MAT_HIGH_EXPLOSIVE_BURN. The combined JWL (Jones-Wilkins-Lee) equation represents the pressure of the explosion product. The form is as follows [22]:
p = A ( 1 ω R 1 V ) e R 1 V + B ( 1 ω R 2 V ) e R 2 V + ω E V
The units of A, B, and E are the same as the pressure, and R1, R2, ω, and V are dimensionless values, where E is the energy density and V is the relative volume. When entering the parameters, the initial energy density E0 and the initial relative volume V0 should be determined, and the specific parameters are shown in Table 1.
The material model of air was *MAT_NULL, and its state equation was *EOS_LINEAR_POLYNOMIAL. The equation can be written as follows:
p = C 0 + C 1 μ + C 2 μ 2 + C 3 μ 3 + ( C 4 + C 5 μ + C 6 μ 2 ) E
μ = 1 V 1 = ρ ρ 0 1
Regarding air as an ideal gas, the parameters were set to C0 = C1 = C2 = C3 = C6 = 0. The polytropic exponent γ is usually set to 1.4, thus C4 = C5 = γ −1 = 0.4 [22]. The initial density ρ0, the initial energy density E0 and the initial relative volume V0 of air were set to 1.29 g·cm−3, 0.25 MPa and 1.0, respectively. The parameters are shown in Table 2.

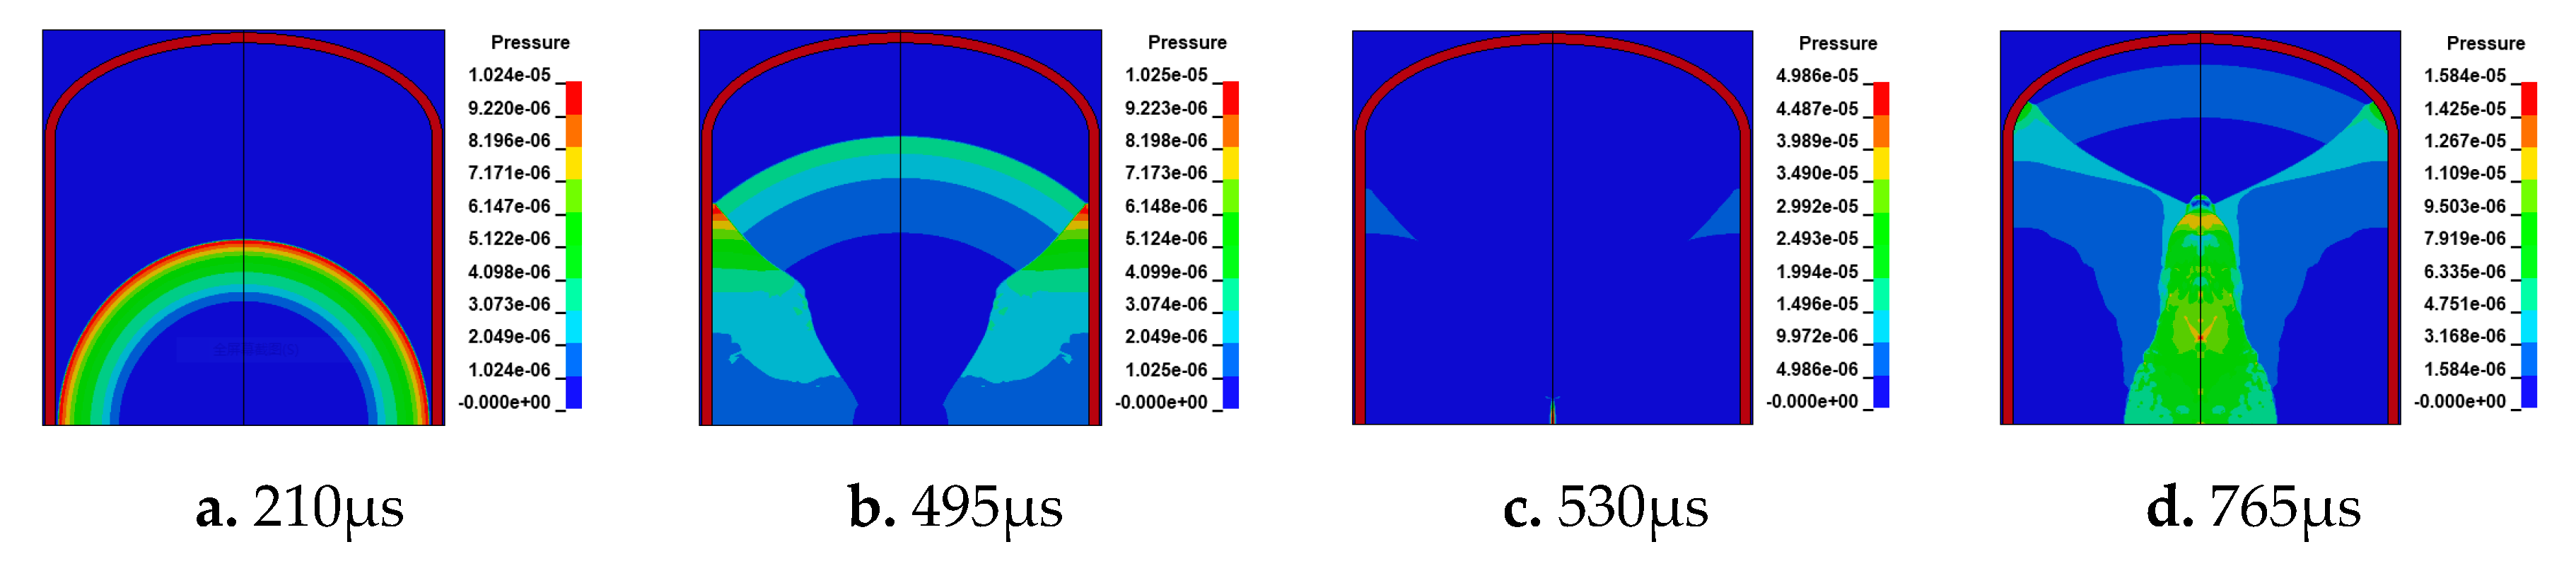
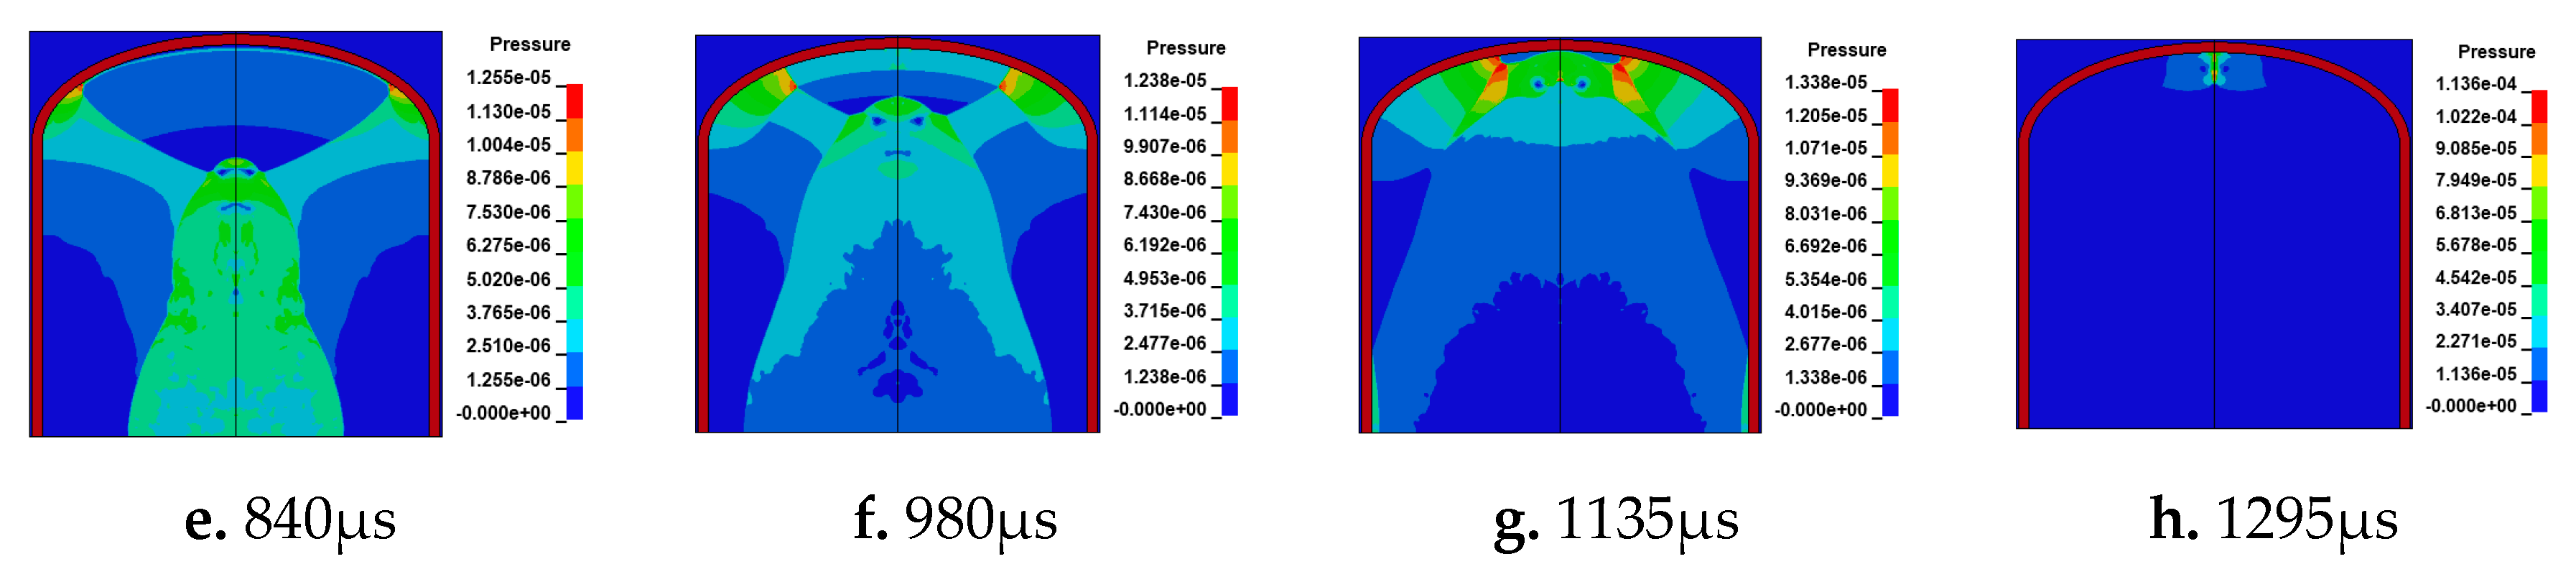
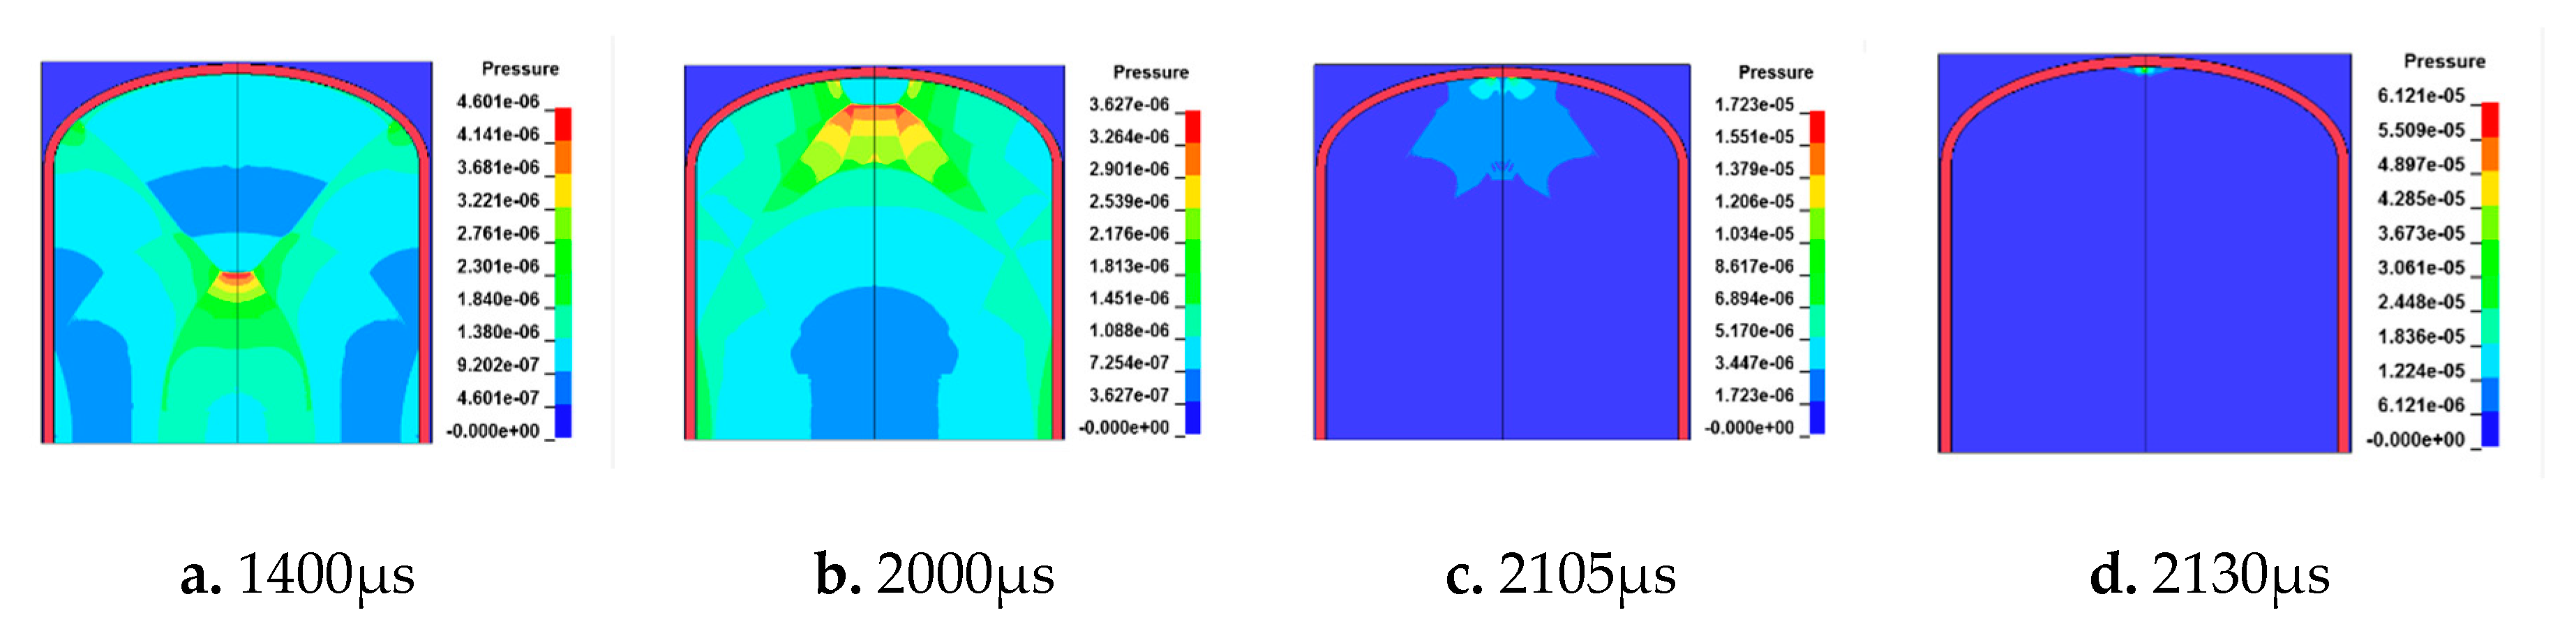
3.2. Internal Explosion Flow Field at the End Cover of the Vessel

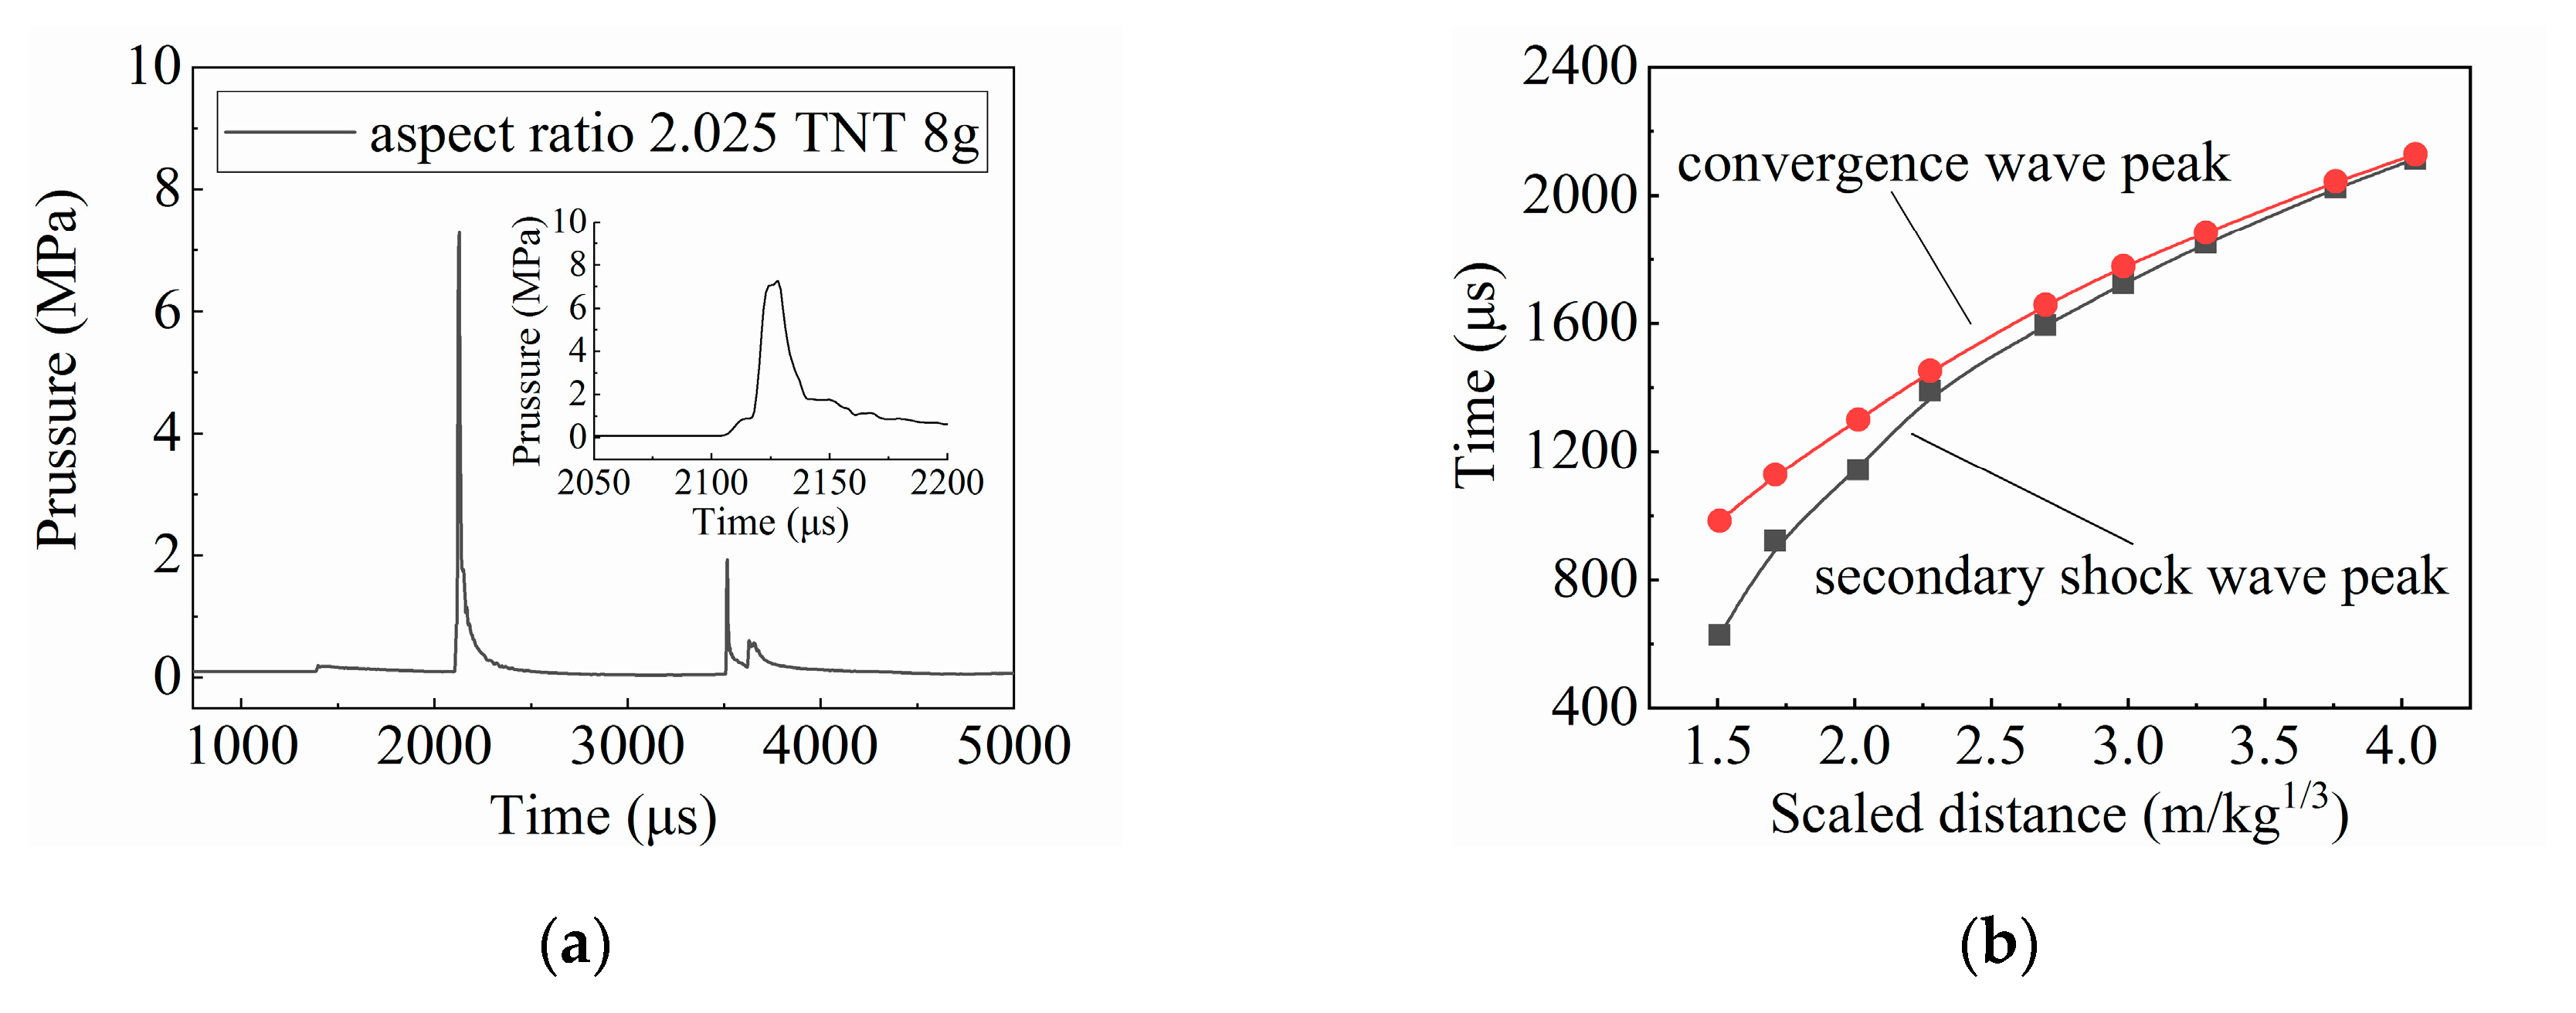
3.2.1. Typical Explosion Flow Field at the End Cover of the Vessel

Figure 4 shows the explosion pressure curve of a 65 g TNT charge in the containment vessel with an aspect ratio of 2.025. The scaled distance between this charge and the pole was 2.01 m·kg−1/3. The numerical simulation and experimental results were well matched and the maximum pressure was reached at the third peak.
Figure 5 illustrates the nephogram of the internal explosion in the container under this working condition. After the charge explosion at 0 μs, the explosion shock wave reached the vicinity of the vessel wall at about 210 μs, and then because of the blocking effect of the wall being moved along the vessel wall towards the bottom, the shock wave formed the reflection shock wave. At about 495 μs, a clear Mach reflection and a three-wave intersection phenomenon appeared. It is worth noting that the reflection waves at the detonation center torus were gradually converging toward the center of the container. At 530 μs, the reflection shock waves from the torus successfully converged at the center of the container and generated the secondary shock wave that propagated to all directions of the container. At the same time, the Mach wave continued to propagate along the end cover inner wall after passing the corner between the barrel and the end cover, as shown at 765 μs (Figure 5d). At around 840 μs, the first explosion shock wave had already acted on the end cover, and the first pressure peak appeared at the pole of the end cover, as shown in Figure 4 and Figure 5, respectively. The secondary shock wave propagated faster in the air after the primary explosion wave was compressed, while the Mach wave propagated slower due to the wall retardation. Therefore, before the Mach wave at 1135 μs, the secondary shock wave reached the end cover pole, forming the second pressure peak. At the following moment 1295 μs, Mach reflection waves from all directions converged and collided at the pole of the end cover, creating a third pressure jump. Over time, the new shock wave formed at the pole and travelled around.

3.2.2. Influence of Scaled Distance on Internal Explosion Flow Field

Observing Figure 2, it can be found that with a small amount of charge, the interval time between the convergence wave peak and the secondary shock wave peak is smaller, as shown in Figure 2a. To investigate this phenomenon, an explosion containment vessel model with a same aspect ratio of 2.025 and a smaller charge of 8 g was used for numerical simulation. In conversion, the scaled distance between the charge and the pole was 4.05 m·kg−1/3. Figure 6 shows the pressure nephogram at the critical moment.
At 1400 μs after the TNT explosion, the primary explosion wave reached near the end cover pole and caused a small pressure jump, while the secondary shock wave formed by the torus reflection wave convergence was already propagating to the pole. During the propagation process, the secondary wave and the shock wave propagating along the end cover converged toward the pole at the same time. For example, at 2000 μs the two shock waves are almost equal to the wave at pole. At 2105 μs, the impact of the secondary shock wave is encountered at the pole, and the shock wave propagating along the inner wall of the end cover is also about to reach the pole. Subsequently, only at 2130 μs was the convergence wave at the pole compressed inward to the extreme, at which point the pressure reached the maximum. Of particular note was that, compared with the typical pressure flow field evolution, which was described in the previous section, it merely took about 25 μs from the rising edge of the secondary shock wave to reach the peak of the convergence wave, instead of about 160 μs. It was obvious that during the charge of 8 g TNT, the secondary wave and the convergence wave arrived at the pole almost at the same time, so they almost merged into one peak in the pressure curve. In other words, it can be called a superposition wave of the convergence wave and the secondary shock wave. From the pressure curve of the amplified superimposed wave, it can also be seen that, in fact, the two waves were not completely merged, but when the pressure was not unloaded after the secondary shock wave, the convergence wave reached the pole as shown in Figure 7a.
In order to explore the changing law of the interval time between the convergence wave and the secondary shock wave at different scaled distances, the charge was set between 8 g to 155 g, and the corresponding scaled distance ranged from 1.51–4.05 m·kg−1/3. The simulation results are shown in Figure 7b. When the scaled distance was small, the interval time between the convergence wave and the secondary shock wave was large, therefore three dominating peaks at the initial stage could be observed in the pressure curve, and the maximum value appeared in the third peak—the convergence wave peak. As the scaled distance grew, the interval between the convergence wave and the secondary shock wave decreased gradually, until the convergence wave was superimposed on the secondary shock wave. When the scaled distance reached 4.05 m·kg−1/3, there were only two obvious wave peaks in the pressure curve and the maximum pressure appeared on the second peak—the superimposed wave peak.

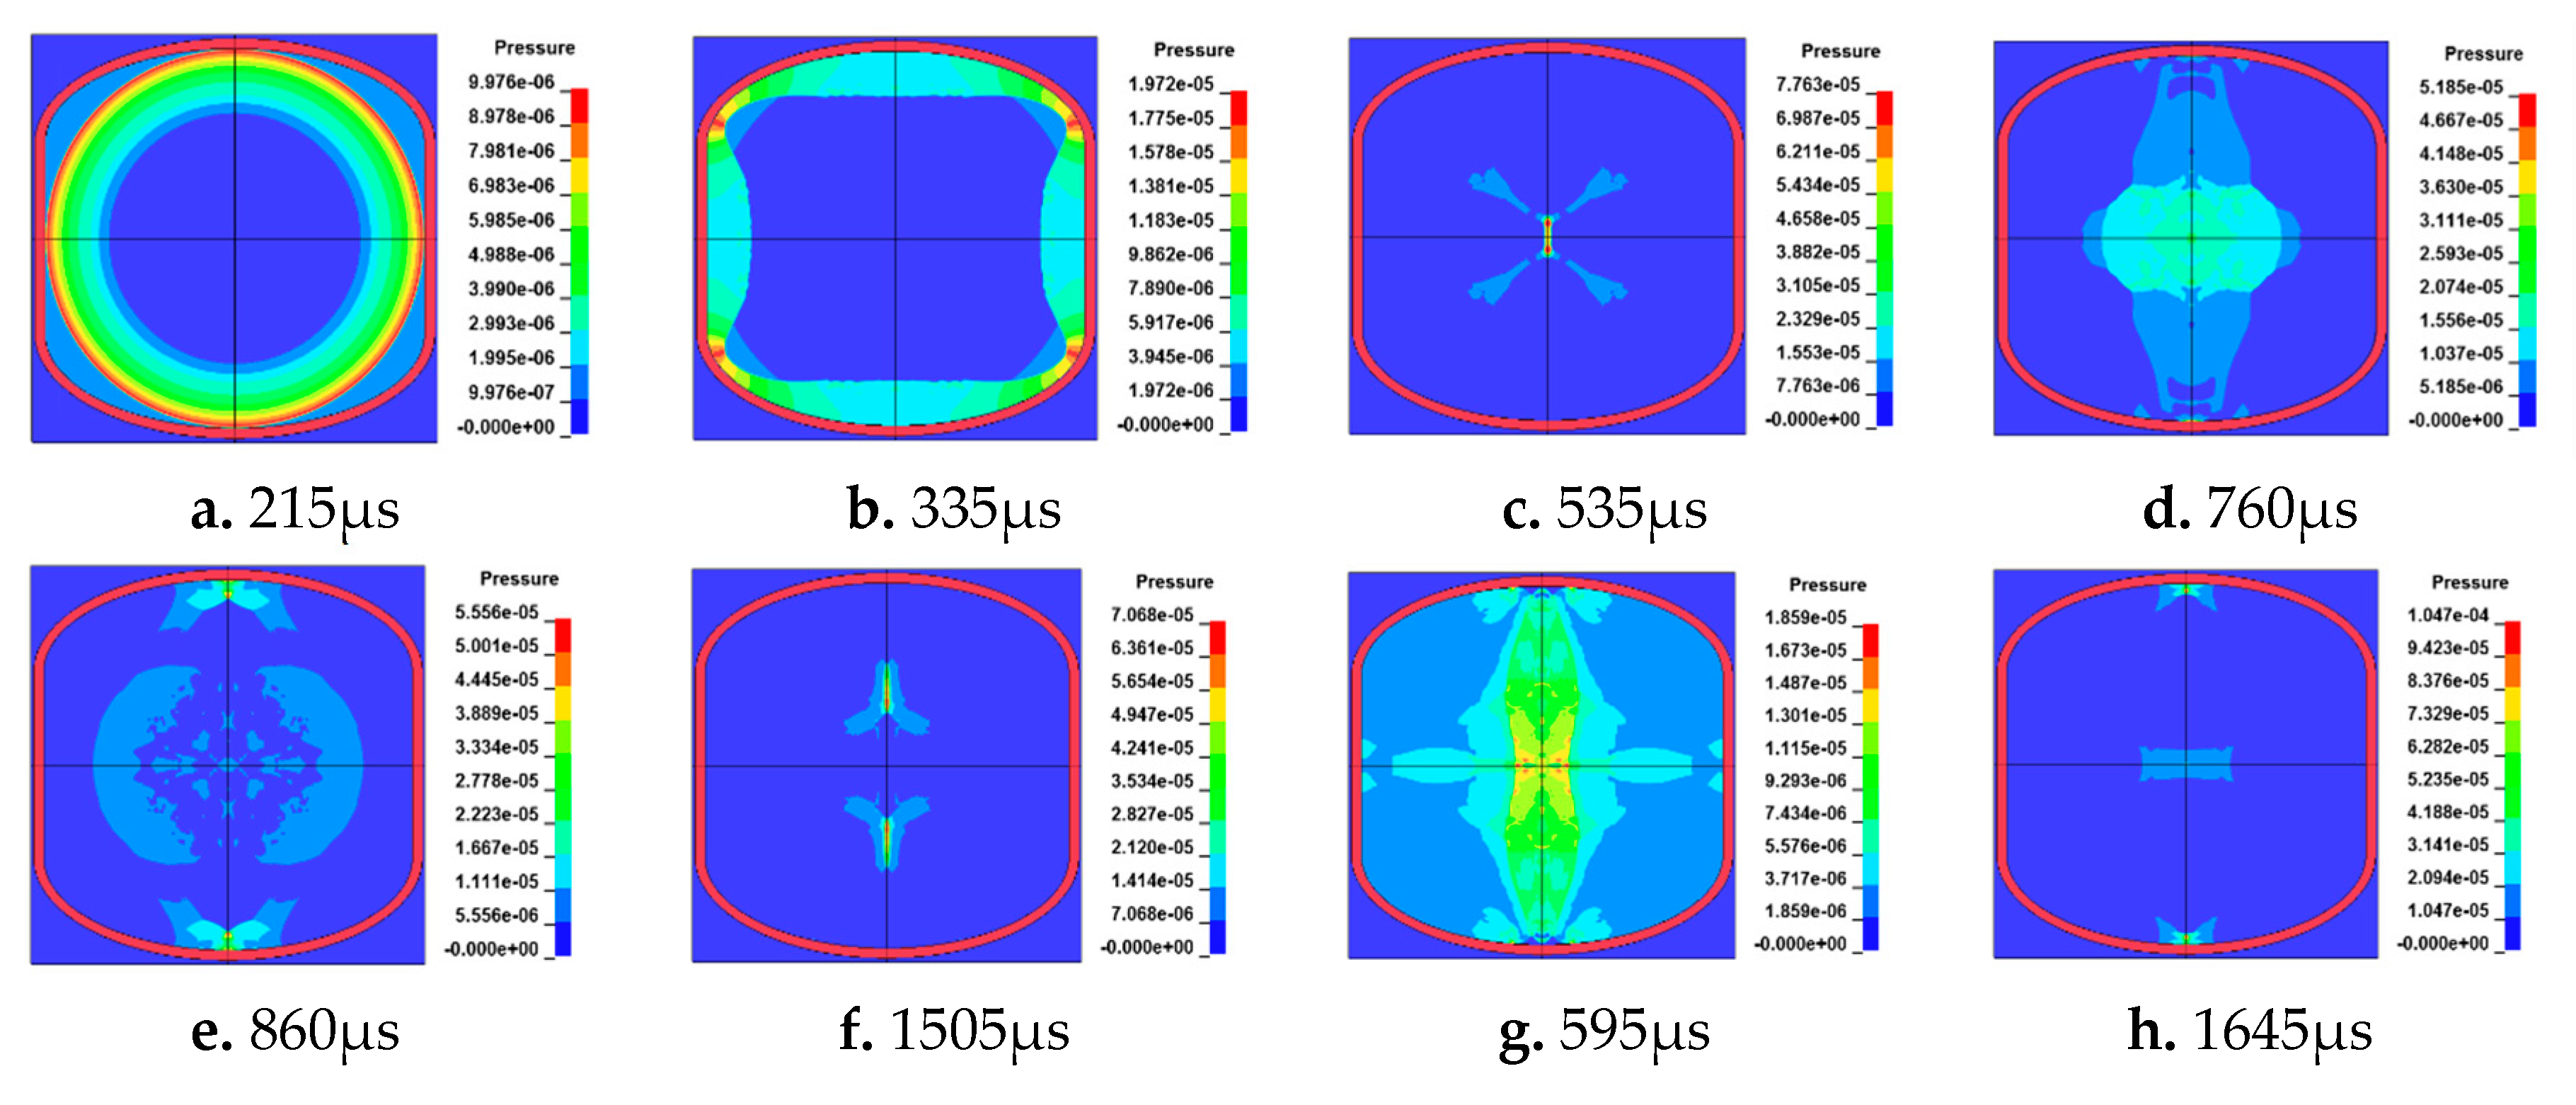
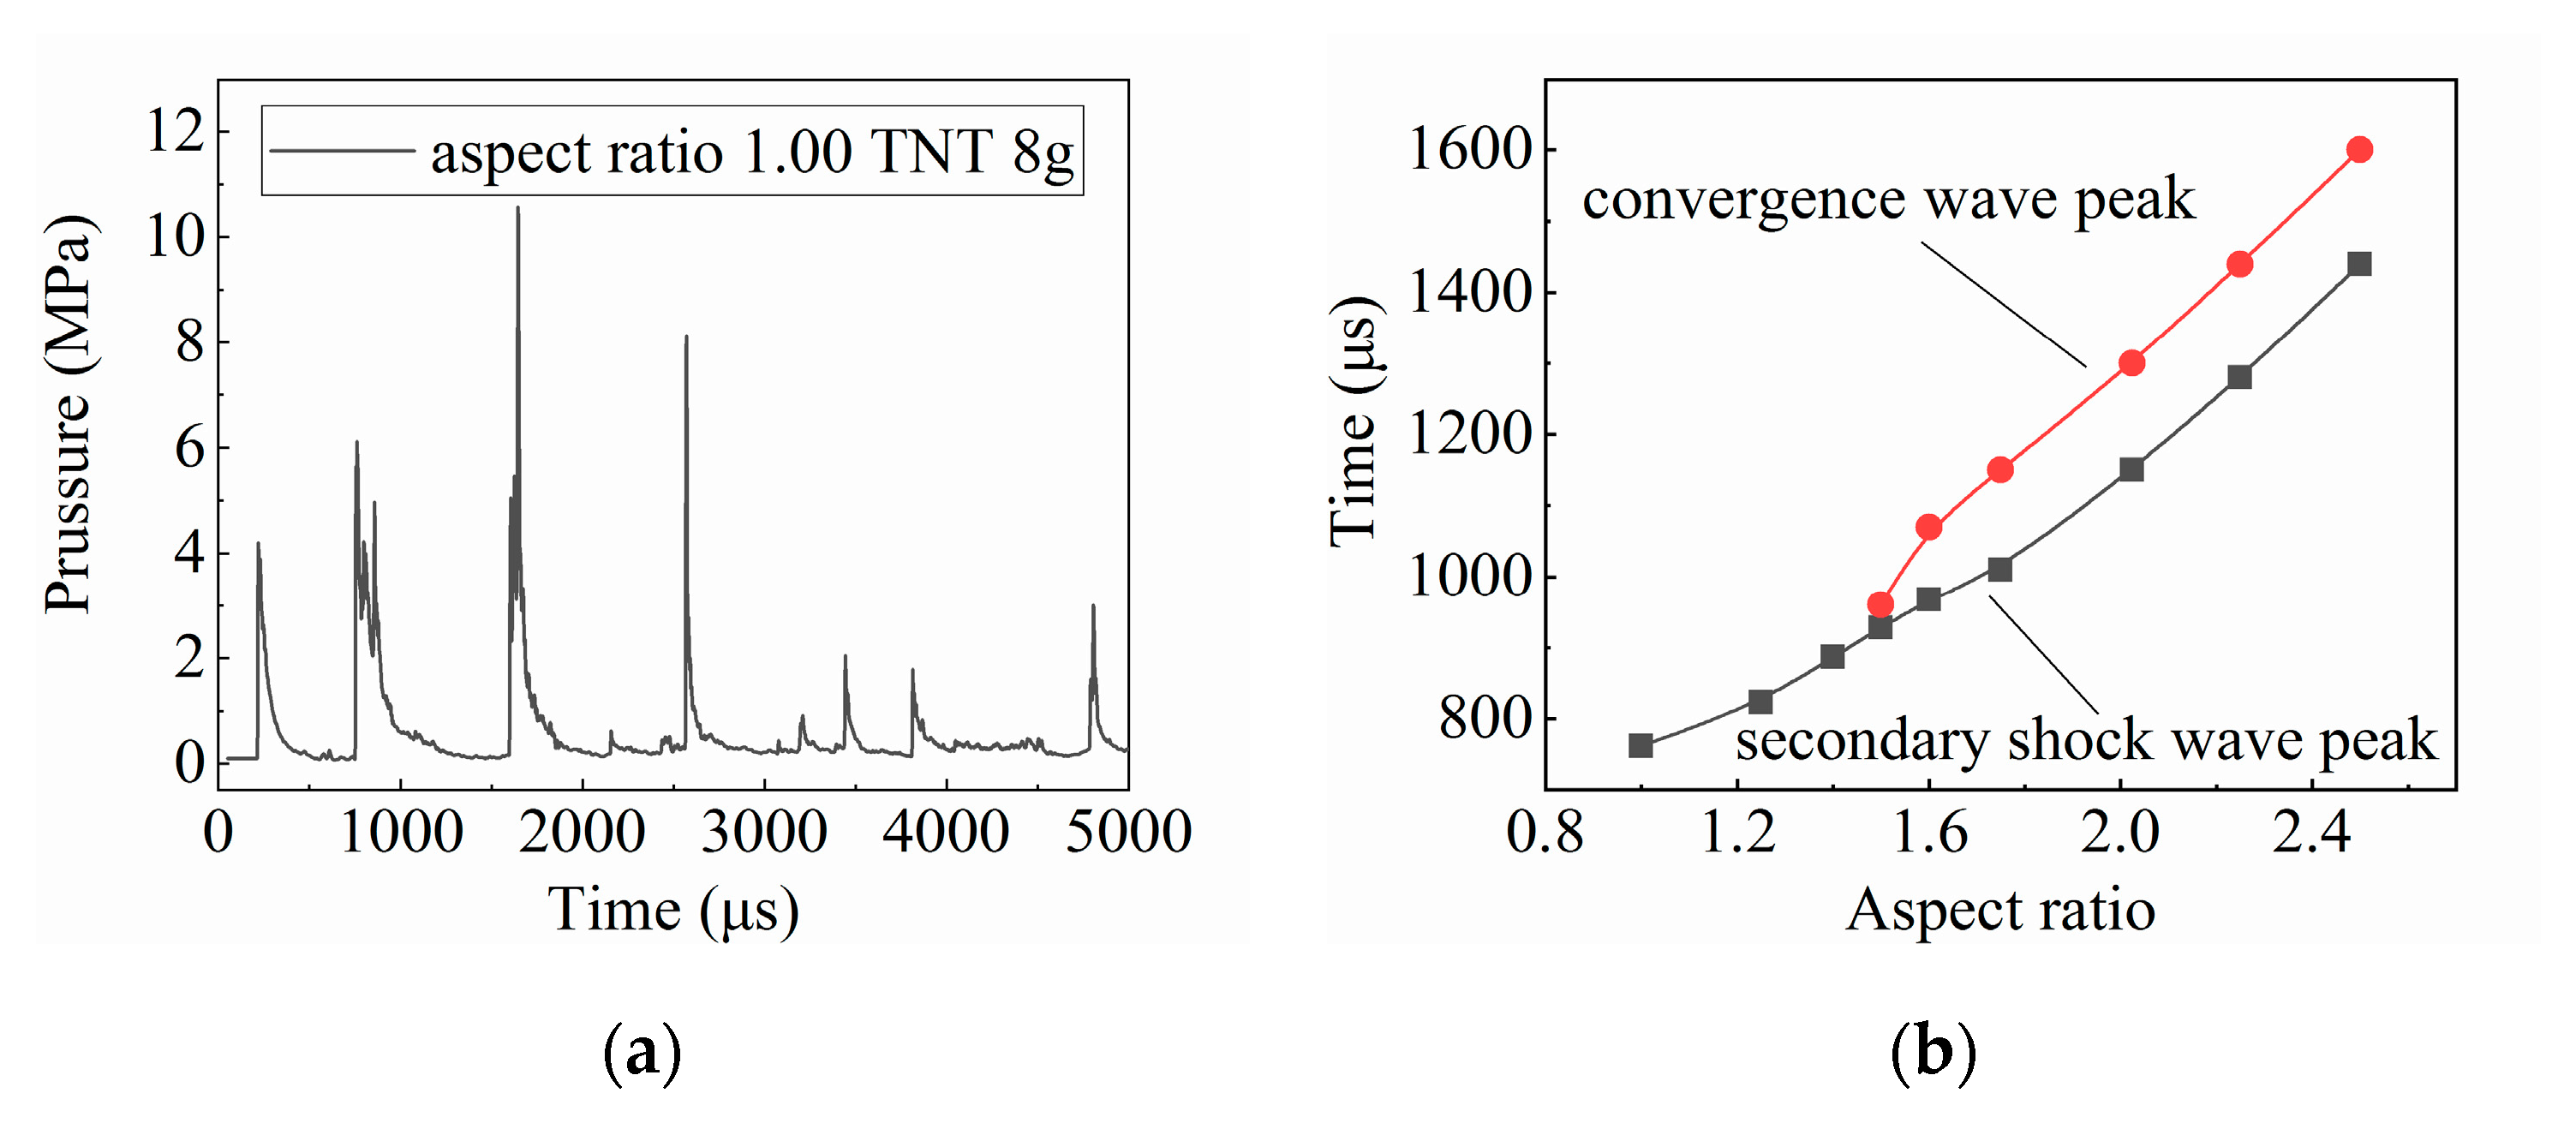
3.2.3. Influence of Aspect Ratio on Internal Explosion Flow Field

In addition to the scaled distance of charge, factors such as the aspect ratio of the container also affect the internal flow field distribution [25]. Therefore, explosion containment vessel models with different aspect ratios were designed for numerical simulation and the charge was uniformly set to 65 g.
The evolution of the internal explosion flow field with a container aspect ratio of 1.00 was taken as an example for analysis. As shown in Figure 8 and Figure 9a, at about 215 μs after the charge explosion, the primary explosion wave and its reflection occurred simultaneously at the pole and at the central section torus of the containment vessel. Then, the reflection point moved from the torus and the pole to the corner of the container, and finally the reflection points met near the corner, at 335 μs. At the same time, all the reflection shock waves converged toward the center of the container and compressed to the extreme at about 535 μs, then outward to form a series of secondary shock waves. The ellipsoidal end cover had radians, which helped the reflection shock waves to converge toward the focal point. Therefore, the reflection shock waves did not converge at the center of the container, but formed two upper and lower convergence points. Due to the influence of the location of the convergence point, at about 760 μs the end cover pole first received the secondary shock wave and the reflection was formed at the central section torus. It is noteworthy that, along the inner wall of the end cover converging towards the pole, there was still a shock wave propagating. As a result of the pressure of this secondary shock wave, its reflected wave at the pole and the convergence wave were in the same order of magnitude, and they formed a complex interaction at the pole, resulting in the formation of three peaks between 760 μs and 860 μs, as shown in Figure 9a. After that, the reflection shock waves from the vessel wall converged again at about 1505 μs, and the formed tertiary shock wave reached the end cover pole at 1595 μs. Moreover, through the complex interaction of the tertiary wave itself, its reflected wave and the convergence wave, a maximum pressure peak was finally formed at around 1645 μs.
Through setting up containment vessels with different aspect ratios in the range of 1.00 to 2.50 for numerical simulation, the change of the interval time between the convergence wave and the secondary shock wave was investigated as shown in Figure 9b. When the aspect ratio of the container was greater than 1.75, the interval between the two peaks was practically the same, about 150 μs. When the aspect ratio was lower than 1.60, the interval between the two peaks decreased gradually. Until the aspect ratio came to 1.40, due to the same intensity of the secondary shock wave and its reflected wave at the pole as the convergence wave, it was impossible to distinguish the convergence wave peak from the secondary wave peak after the complex interaction. When the aspect ratio was less than 1.40, the convergence wave and the secondary shock were fused to form the complex fusion wave.

4. Conclusions

In this paper, the pressure load time history curve at the end cover of the ellipsoid of the cylindrical explosion containment vessel was experimentally measured under the charges of 27 g, 65 g, 106 g and 155 g TNT. Different from the previous results, it was found that there were three pressure peaks successively rising at the initial stage of the pressure at the end cover pole. In order to verify the experimental results and explore the mechanism, the method of fluid–solid coupling was used to simulate and analyze the flow field changes in the container with a two-dimensional numerical model. A series of conclusions were obtained through the numerical simulation and analysis. The study in this paper shows that the pressure peak at the end of the container increases continuously, which must be controlled in the actual container. This context expounds important practical significance for the safety evaluation and protection design of explosive vessels. The main conclusions of this paper are summarized as follows:
a. It was found by the explosion experiment of different charges that, at the initial stage, the ellipsoidal end cover pole of the cylindrical explosion vessel was subjected to three types of shock waves, namely the primary explosion wave, the secondary shock wave and the convergence wave, and the pressure peak values increased in sequence. The results were verified by numerical simulation.
b. In the numerical simulation, the scaled distance between the detonation center and the end cover pole was changed by adapting the charge amount. Numerical simulation was carried out under different charges and it was found that, when the scaled distance increased due to the reduction of the charge, the interval between the convergence wave and the secondary shock wave at the end cover pole decreased gradually. When the scaled distance increased to 4.05 m·kg−1/3, the convergence wave at the pole was superimposed on the secondary shock wave.
c. By changing the length of the vessel wall, with different aspect ratios at a 65 g charge, the numerical simulation of models showed that the decrease of the aspect ratio of the container also led to the decrease of the interval between the convergence wave and the secondary shock wave at the end cover pole. When the aspect ratio was reduced to below 1.40, the convergence wave and secondary shock wave fused through complex interaction.

Author Contributions

Conceptualization, W.G.; Data curation, Y.H. (Yangming Han); Formal analysis, Y.H. (Yunhao Hu); Investigation, Y.H. (Yunhao Hu) and Y.H. (Yangming Han); Project administration, W.G.; Software, Y.H. (Yunhao Hu) and Z.W.; Writing—original draft, Y.H. (Yunhao Hu); Writing—review & editing, W.G. All authors have read and agreed to the published version of the manuscript.

Funding

This research received no external funding.

Acknowledgments

All the authors thank a factory and its staff for providing explosion test conditions and technical support.

Conflicts of Interest

The authors declare no conflict of interest.

References

  1. Zhu, W.H.; Xue, H.L.; Zang, Z.Y. Combining analytical method with numerical simulation to obtain blast load on chamber wall produced by an explosive charge. J. Nat. Univ. Def. Technol. 1997, 19, 102–106. (In Chinese) [Google Scholar]
  2. Kevorkian, S.; Duriez, N.; Loiseau, O. Laboratory scale tests for internal blast loading. WIT. Trans. Built. Environ. 2010, 113, 125–136. [Google Scholar]
  3. Zhao, C.F.; Chen, J.Y.; Wang, Y.; Lu, S.J. Damage mechanism and response of reinforced concrete containment structure under internal blast loading. Theor. Appl. Fract. Mech. 2012, 61, 12–20. [Google Scholar] [CrossRef]
  4. Wu, C.; Lukaszewicz, M.; Schebella, K.; Antanovskii, L. Experimental and numerical investigation of confined explosion in a blast chamber. J. Loss Prev. Process Ind. 2013, 26, 737–750. [Google Scholar] [CrossRef]
  5. Wang, Z.; Hu, K.; Zhao, Y. Numerical simulation for internal vapor cloud explosion loading in dome-roof steel tanks. J. Vib. Shock 2013, 32, 35–40. (In Chinese) [Google Scholar]
  6. Pickerd, V.; Bornstein, H.; McCarthy, P.; Buckland, M. Analysis of the structural response and failure of containers subjected to internal blast loading. Int. J. Impact Eng. 2016, 95, 40–53. [Google Scholar] [CrossRef]
  7. Wang, W.; Gao, X.; Le, L. Study of the Similarities in Scale Models of a Single-Layer Spherical Lattice Shell Structure under the Effect of Internal Explosion. Shock Vib. 2017, 2017, 1–13. [Google Scholar] [CrossRef] [Green Version]
  8. Li, Z.R.; Wang, S.Q.; Jiang, H.Y.; Zhang, Y.L.; Wang, Z.H. Experimental studies on characteristics of explosion pressure load in cylinder apparatus. Baozha Yu Chongji 2019, 39, 14–21. (In Chinese) [Google Scholar]
  9. Demchuk, A.F. Method for designing explosion chambers. J. Appl. Mech. Tech. Phys. 1968, 9, 558–559. [Google Scholar] [CrossRef]
  10. Kornev, V.M.; Adishchev, V.V.; Mitrofanov, A.N.; Grekhov, V.A. Experimental investigation and analysis of the vibrations of the shell of an explosion chamber. Fiz Goreniya Vzryva 1979, 15, 821–824. [Google Scholar] [CrossRef]
  11. Karpp, R.R.; Duffey, T.A.; Neal, T.R. Response of Containment Vessels to Explosive Blast Loading. J. Press. Vessel Technol.-Trans. ASME 1983, 105, 23–27. [Google Scholar] [CrossRef]
  12. Duffey, T.A.; Romero, C. Strain growth in spherical explosive chambers subjected to internal blast loading. Int. J. Impact Eng. 2003, 28, 967–983. [Google Scholar] [CrossRef]
  13. Li, Q.M.; Dong, Q.; Zheng, J.Y. Strain growth of the in-plane response in an elastic cylindrical shell. Int. J. Impact Eng. 2008, 35, 1130–1153. [Google Scholar] [CrossRef]
  14. Dong, Q.; Li, Q.M.; Zheng, J.Y. Investigation on the mechanisms of strain growth in cylindrical containment vessels subjected to internal blast loading. In Proceedings of the ASME Pressure Vessels And Piping Conference; Dixon, R.D., Springer, B., Auyang, M.K., Eds.; ASME: New York, NY, USA, 2009; Volume 5. [Google Scholar]
  15. Dong, Q.; Li, Q.M.; Zheng, J.Y. Guidelines for the design of multiple-use explosion containment vessels based on the understanding of the strain growth phenomenon. J. Perform. Constr. Facil. 2011, 25, 394–399. [Google Scholar] [CrossRef]
  16. Liu, W.; Zhang, Q.; Zhong, F.; Cheng, S.; Zhang, D.; Yang, L. Further research on mechanism of strain growth caused by superposition of different vibration modes. Int. J. Impact Eng. 2017, 104, 1–12. [Google Scholar] [CrossRef]
  17. ANSYS; LSTC. LS-DYNA Keyword User’s Manual Volume I R11.0. Available online: http://ftp.lstc.com/anonymous/outgoing/jday/manuals/LS-DYNA_Manual_Volume_I_R11.pdf (accessed on 18 October 2018).
  18. Kalra, A.; Zhu, F.; Yang, K.H.; King, A.I. Key parameters in blast modeling using 2d to 3d ale mapping technique. In Proceedings of the 13th International LS-DYNA Users Conference, Dearborn, Detroit, MI, USA, 8–10 June 2014; pp. 1–8. [Google Scholar]
  19. Wu, Z.; Guo, J.; Yao, X.; Chen, G.; Zhu, X. Analysis of explosion in enclosure based on improved method of images. Shock Waves 2017, 27, 237–245. [Google Scholar] [CrossRef]
  20. Adishchev, V.V.; Kornev, V.M. Calculation of the shells of explosion chambers. Fiz Goreniya Vzryva 1979, 15, 780–784. [Google Scholar] [CrossRef]
  21. Baker, W.E.; Cox, P.A.; Westine, P.S. Explosion Hazards and Evaluation, 1st ed.; Elsevier: Amsterdam, The Netherland, 1983. [Google Scholar]
  22. ANSYS; LSTC. LS-DYNA Keyword User’s Manual Volume II Material Models R11.0. Available online: http://ftp.lstc.com/anonymous/outgoing/jday/manuals/LS-DYNA_Manual_Volume_II_R11_Ver2.pdf (accessed on 19 February 2019).
  23. Cheng, D.S.; Hung, C.W.; Pi, S.J. Numerical simulation of near-field explosion. J. Appl. Sci. Eng. 2013, 16, 61–67. [Google Scholar]
  24. Mobaraki, B.; Vaghefi, M. Numerical study of the depth and cross-sectional shape of tunnel under surface explosion. Tunn. Undergr. Space Technol. 2015, 47, 114–122. [Google Scholar] [CrossRef]
  25. Hu, K.; Zhao, Y. Numerical simulation of internal gaseous explosion loading in large-scale cylindrical tanks with fixed roof. Thin-Walled Struct. 2016, 105, 16–28. [Google Scholar] [CrossRef]
Figure 1. (a) Physical picture of the cylindrical explosion containment vessel; (b) Position of the pressure-measuring point (red rectangle).
Applsci 10 03060 g001
Figure 2. Time history curves of the pressure loading at poles of the different TNT charges: (a) 27 g; (b) 65 g; (c) 106 g and (d) 155 g. The dotted lines indicate the three peaks of the initial pressure stage.
Applsci 10 03060 g002
Figure 3. Two-dimensional 1/4 model of the containment vessel. The blue mesh is the air and the red mesh is the explosive containment vessel.
Applsci 10 03060 g003
Figure 4. Comparison between the pressure curves of the numerical simulation (black solid line) and the experiment (red dotted line).
Applsci 10 03060 g004
Figure 5. Internal explosion nephogram under the 2.025 vessel aspect ratio.
Applsci 10 03060 g005aApplsci 10 03060 g005b
Figure 6. Internal explosion nephogram under the 8 g charge.
Applsci 10 03060 g006
Figure 7. (a) The pressure curve at the pole under the 8 g charge. The detail is in the top right corner. (b) Time interval between the convergence wave peak (red dot solid line) and the secondary shock wave peak (black dot solid line) under the different charges.
Applsci 10 03060 g007
Figure 8. Internal explosion nephogram under the 1.00 vessel aspect ratio.
Applsci 10 03060 g008
Figure 9. (a) The pressure curve at the pole under the 1.00 vessel aspect ratio; (b) Time interval between the convergence wave peak (red dot solid line) and the secondary shock wave peak (black dot solid line) under the 1.00 vessel aspect ratio.
Applsci 10 03060 g009
Table 1. Material model parameters and the JWL parameters of TNT.
ρ0/g·cm−3PCJ/GPavD/m·s−1A/GPaB/GPaR1R2ωE0/GPaV0
1.5017.926547.2374.63.394.150.950.286.341.0
Table 2. Material model and the EOS (Equation of State) parameters of air [23,24].
ρ0/g·cm−3C0C1C2C3C4C5C6E0/MPaV0
1.2900000.40.400.251.0

