Article

Flexible Power System Defense Strategies in an Isolated Microgrid System with High Renewable Power Generation

1
Department of Electrical Engineering, National Chung-Cheng University, Chiayi 62102, Taiwan
2
School of Engineering and Advanced Engineering Platform, Monash University Malaysia, Jalan Lagoon Selatan, Bandar Sunway 47500, Selangor, Malaysia
*
Author to whom correspondence should be addressed.
Appl. Sci. 2020, 10(9), 3184; https://doi.org/10.3390/app10093184
Submission received: 30 March 2020 / Revised: 29 April 2020 / Accepted: 30 April 2020 / Published: 2 May 2020
(This article belongs to the Special Issue Wind Power Systems: Design, Operation, and Control)

Abstract

:
This work develops an underfrequency preventive control strategy for an islanded power system with a high penetration of wind power generation. First, the preventive control strategy uses the frequency nadir forecasting module to analyze the frequency stability under largest diesel generator tripping (N-1) contingency events. If predicted frequency nadir is too low, four frequency support methods are then analyzed and used for preventing potential frequency stability problem. They include generator rescheduling (GR), the use of battery energy storage system (BESS), direct load control (DLC) and emergency demand response program (EDRP). In terms of the GR method, the optimal diesel generator dispatch is obtained, with sufficient frequency stability and minimal fuel cost and start-up cost. In the BESS method, the optimal instantaneous power output from BESS is obtained based on its frequency support capability. With the DLC or EDRP method, the optimal contract-based load-shedding or the load-reduction to provide frequency support is obtained, respectively. Then, the operating costs of each method to support frequency are analyzed. The research methods and simulation results are very useful to the low-frequency protection of actual power systems with high renewable power generation. This work proposed a complete defense strategy in a microgrid system. It combines GR, BESS, DLC and EDRP. Therefore, the system operators have many options to implement their defense strategies, based on the operating costs of various methods. In other words, the proposed defense strategy provides a more flexible solution for the protection of micro grids with a high renewable power penetration. Therefore, the solution considers the system safety and economical aspects.

1. Introduction

On an islanded power system, ensuring the balance between power generation and load demand is very important. When an unpredictable generation unit tripping, N-1 contingency occurs, the imbalance between generation and load causes a transient frequency dip, which may trigger the involuntary underfrequency load shedding (UFLS) scheme or even cause a complete blackout [1,2,3]. This work proposed a complete control strategy that includes four frequency support methods to balance the power generation and load demand. The four methods include the short-term power supports from both generation side and demand side. Generally, the re-dispatch and start-up operations of diesel generators can be executed in a short period of time around several minutes; BESS can provide instantaneous power support in few milliseconds of battery response time [4,5,6,7,8]. Therefore, the GR and BESS-based methods are good choices to improve frequency stability. On the demand side, the demand response (DR) methods can effectively improve frequency stability by controlling loads. Typically, DR can be categorized into two basic categorizes—price-based demand response (PBDR) and incentive-based demand response (IBDR) [9,10,11,12,13,14]. PBDR offers the time-varying electricity rate while IBDR offers the incentive payments or rate discount to DR participants; in exchange, DR participants agree to provide contract-based load-reduction or load-shedding services.
In this work, the IBDR methods, including the DLC and EDRP, are used for frequency support. DLC allows utility directly shuts down or cycles participants’ certain electrical appliance (e.g., air conditioners and water heaters) on a very short notice [9,10,11,12,13,14]. That is, using the load-relay or load-controller, DLC can directly shed the load and provide frequency support when a contingency occurs. As for the EDRP method, it notifies participants 15 min to 2 h ahead and requests for voluntary load-reduction [9,15]. With the information about the historical demand, electricity price and short-term load forecasting results, the EDRP method can be scheduled to reduce the peak load and thus provide frequency regulation service [9,14,16,17].
The economic analysis in a power utility is significant. Therefore, for the proposed preventive control strategy, the operating costs for each of the four different methods are discussed. For instance, based on the GR method, the fuel cost and start-up cost of diesel generators are considered. For the DLC and EDRP methods, the costs for those methods can be regarded as the incentive payments or rate discount which power utility should pay to the demand-response participants [9], as they belong to the incentive-based demand response.
As for the BESS method, the cost for BESS method is determined by the system architecture. In the market-based power system, power utility can regard the BESS cost as the bidding ancillary service payments to BESS provider [18]; whereas in this work, for the island power system operators, the BESS cost should consider the BESS initial investment cost, operation-and-maintenance fees and electricity bill for battery recharging [4,18]. To simplify the BESS cost analysis, the battery cycle cost, defined as battery investment cost divided by battery lifetime, is utilized in the proposed preventive control strategy [19,20]. Due to the frequency support requirement is generally highly variable, the battery charging/discharging pattern is usually various and depends on the utility’s application, implying that the battery lifetime is hard to be estimated accurately [4,21]. Therefore, this work has been discussed with Jian-Shan Thermal Power Plant and considers the battery as a back-up power source directly controlled by system operators and the battery lifetime used for this preventive control strategy is assumed to be 5000 cycles.
This work is a continuation of our past researches. In addition to the consideration of generation redispatch, additional useful mechanisms, such as energy storage and demand response strategies, have been added into this work, which makes the overall defense planning more comprehensive. The proposed algorithm is applied to actual isolated island power systems and the developed software is established in the dispatch center. In other words, the proposed algorithm should be easily applied to an actual system and the equations must be presented in a form where they are easily understandable. Nonetheless, the developed system has been applied to Penghu Island.
In an Island system or micro grid, the penetration of a single online generating unit is high. Therefore, once a generator trips offline, the frequency drop will be a critical problem. That is, maintaining the frequency stability in such a system is significant. Several works have discussed this issue [22,23,24,25,26]. However, few research works consider various control methods, such as GR, BESS, DLC and EDRP, simultaneously. Additionally, few works calculated the economics value for each control method to identify the priority of various defense strategies.
This work contributes to developing a complete underfrequency control strategy that includes four different frequency support methods to ensure system security and minimal operating cost. This paper is organized as follows. Section 2 introduces the proposed underfrequency preventive control strategy for an island or micro-grid power system. Section 3 describes the establishment of the database utilized in the control strategy. Section 4 describes the models that are used in the control strategy, including the frequency nadir forecasting module, frequency support capability forecasting module and their formulation relationship. Section 5 analyzes the cost for different frequency support methods. Section 6 introduces the testing system. Section 7 examines the accuracy of the forecasting modules. Section 8 presents the results of cost analysis. Section 9 analyzes the capacity requirements of different frequency support methods. Finally, Section 10 draws the conclusion.

2. Proposed Preventive Control Strategy

This work develops an underfrequency preventive control strategy for an isolated micro-grid or islanded power system with a high penetration of renewable generation, in which four different methods to provide frequency support is proposed and available to be implemented. The developed control strategy includes five main modules—the frequency nadir forecasting, GR, BESS, DLC and EDRP modules. Firstly, the frequency nadir forecasting module is used to predict the frequency nadir under an N-1 contingency event [1,2]. Generally, the N-1 contingency test has been utilized in many isolated island power systems to examine the system frequency stability. If the predicted frequency nadir is below the predetermined frequency threshold, then one of the four methods can be selected to provide frequency support to solve potential frequency stability problems.
Following the proposed underfrequency preventive control strategy, next the optimal scheme for diesel generator re-dispatch, instantaneous active power output from BESS, contract-based load-shedding in DLC and contract-based load-reduction in EDRP are determined. The developed control strategy ensures the system is operating with sufficient frequency stability and minimal operating cost.
The proposed underfrequency preventive control strategy is composed of several main steps—including the prediction of frequency nadir and four preventive control methods, that is, GR, BESS, DLC and EDRP for frequency support. Figure 1 shows the overall structure of the flowchart of the proposed control strategy.

2.1. Step 1: Real-Time Data from SCADA

Step 1 is to read the real-time data from supervisory control and data acquisition (SCADA), the measured data include the power output of diesel generators, the power output of wind turbines, the power output of photovoltaics and system load. These data collected by SCADA have a significant influence on the transient frequency response, thus they are used to forecast the frequency nadir ( f min (Hz)).

2.2. Step 2: Forecast the Frequency Nadir

Step 2 is to forecast the f min and analyze the frequency stability. If f min is higher than the predetermined threshold, meaning that the occurrence of N-1 contingency event will not excessively affect the system, then the system will remain stable throughout the analyzed period. If f min is lower than the predetermined threshold, then one of the proposed frequency support methods, including the GR, BESS, DLC and EDRP, will be applied.

2.3. Step 3: Selection of Control Methods

Step 3 is the selection of four parallel control methods. In this step, the system operators have to choose one of the four methods to improve the f min . The first one is the GR method. The operation of the GR method is illustrated in Figure 2. For the GR method, the generator re-dispatch or the start-up of additional diesel generator could ensure the sufficient frequency stability. System operators will re-dispatch the online diesel generators to share the same power generation output for each unit at first. If the predicted f min is still below the predetermined threshold, then the preventive control system will be activated by starting another diesel unit and again re-dispatch the online diesel generators. The increase of spinning reserve by activating additional diesel unit certainly can improve frequency stability. This process of starting an additional diesel unit is continued until f min is higher than the predetermined threshold. Then the next process is implemented to obtain the optimal online diesel generator dispatch with sufficient frequency stability and minimal operating cost. For the second stage of GR method, the economic dispatch, including the fuel cost and start-up cost of diesel generators, are considered. Each online diesel generator is re-dispatched according to its fuel-cost curve. If the predicted f min is below the predetermined frequency threshold, then the P max (MW) constraint on each online diesel generator will be updated, by limits the maximum power generation of each diesel generator to increase the overall spinning reserve. Finally, the optimal GR is obtained, which ensures both the sufficient frequency stability and minimal operating cost.
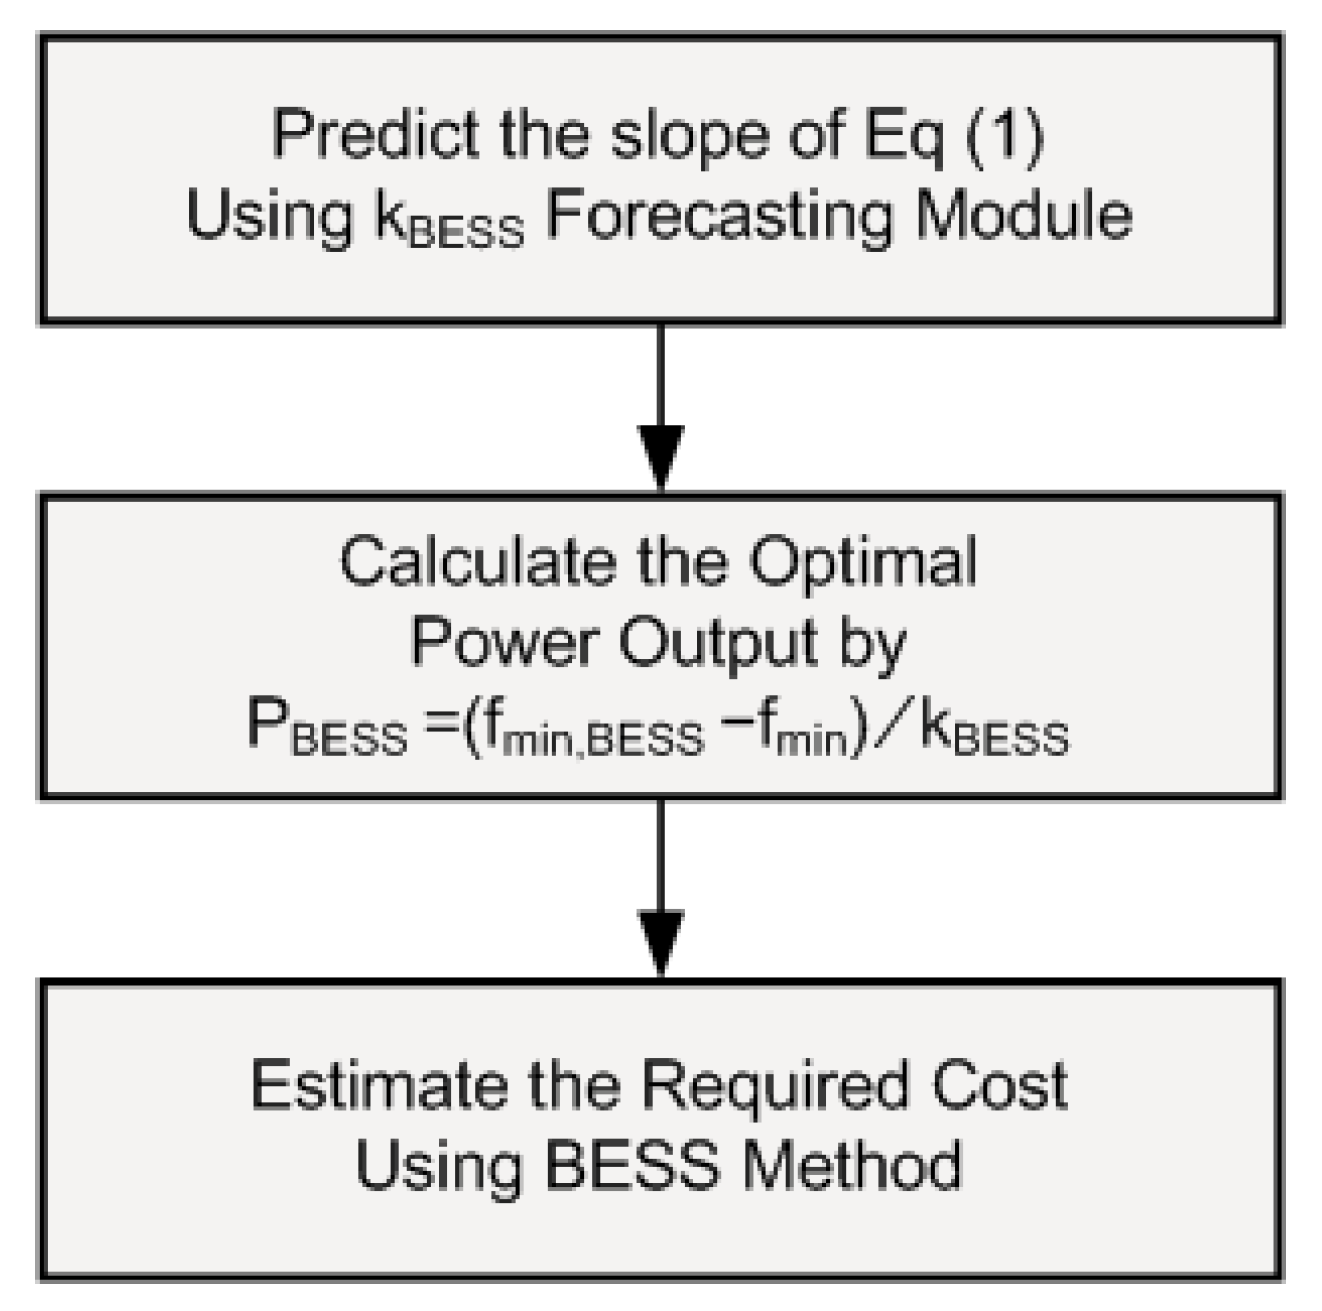
The GR method is simple and efficient; however, its main disadvantages are the possible economic and environmental constraints of diesel generators. Therefore, the proposed control scheme further develops other methods by applying energy storage or demand management. The operation of the BESS method is depicted in Figure 3. In the developed BESS method, based on the simulation results and approximate method, it can establish the formulation relationship between f min and the improved frequency nadir f min , B E S S (Hz) by BESS. The equation is shown as:
f min , B E S S = f m i n + k B E S S P B E S S ,
where P B E S S (MW) is the active power output of the BESS; k B E S S is the slope of linear regression of Equation (1). Different operating modes have different k B E S S values and they are obtained throughout a trained neural network. The offline historical data were used to train the neural network; then the P B E S S , o p t (MW) is determined, which ensures the sufficient frequency stability and minimal requirement of BESS. The frequency nadir is improved and should be higher than the predetermined frequency threshold of power system, which is achieved with the sufficient output capacity of BESS.
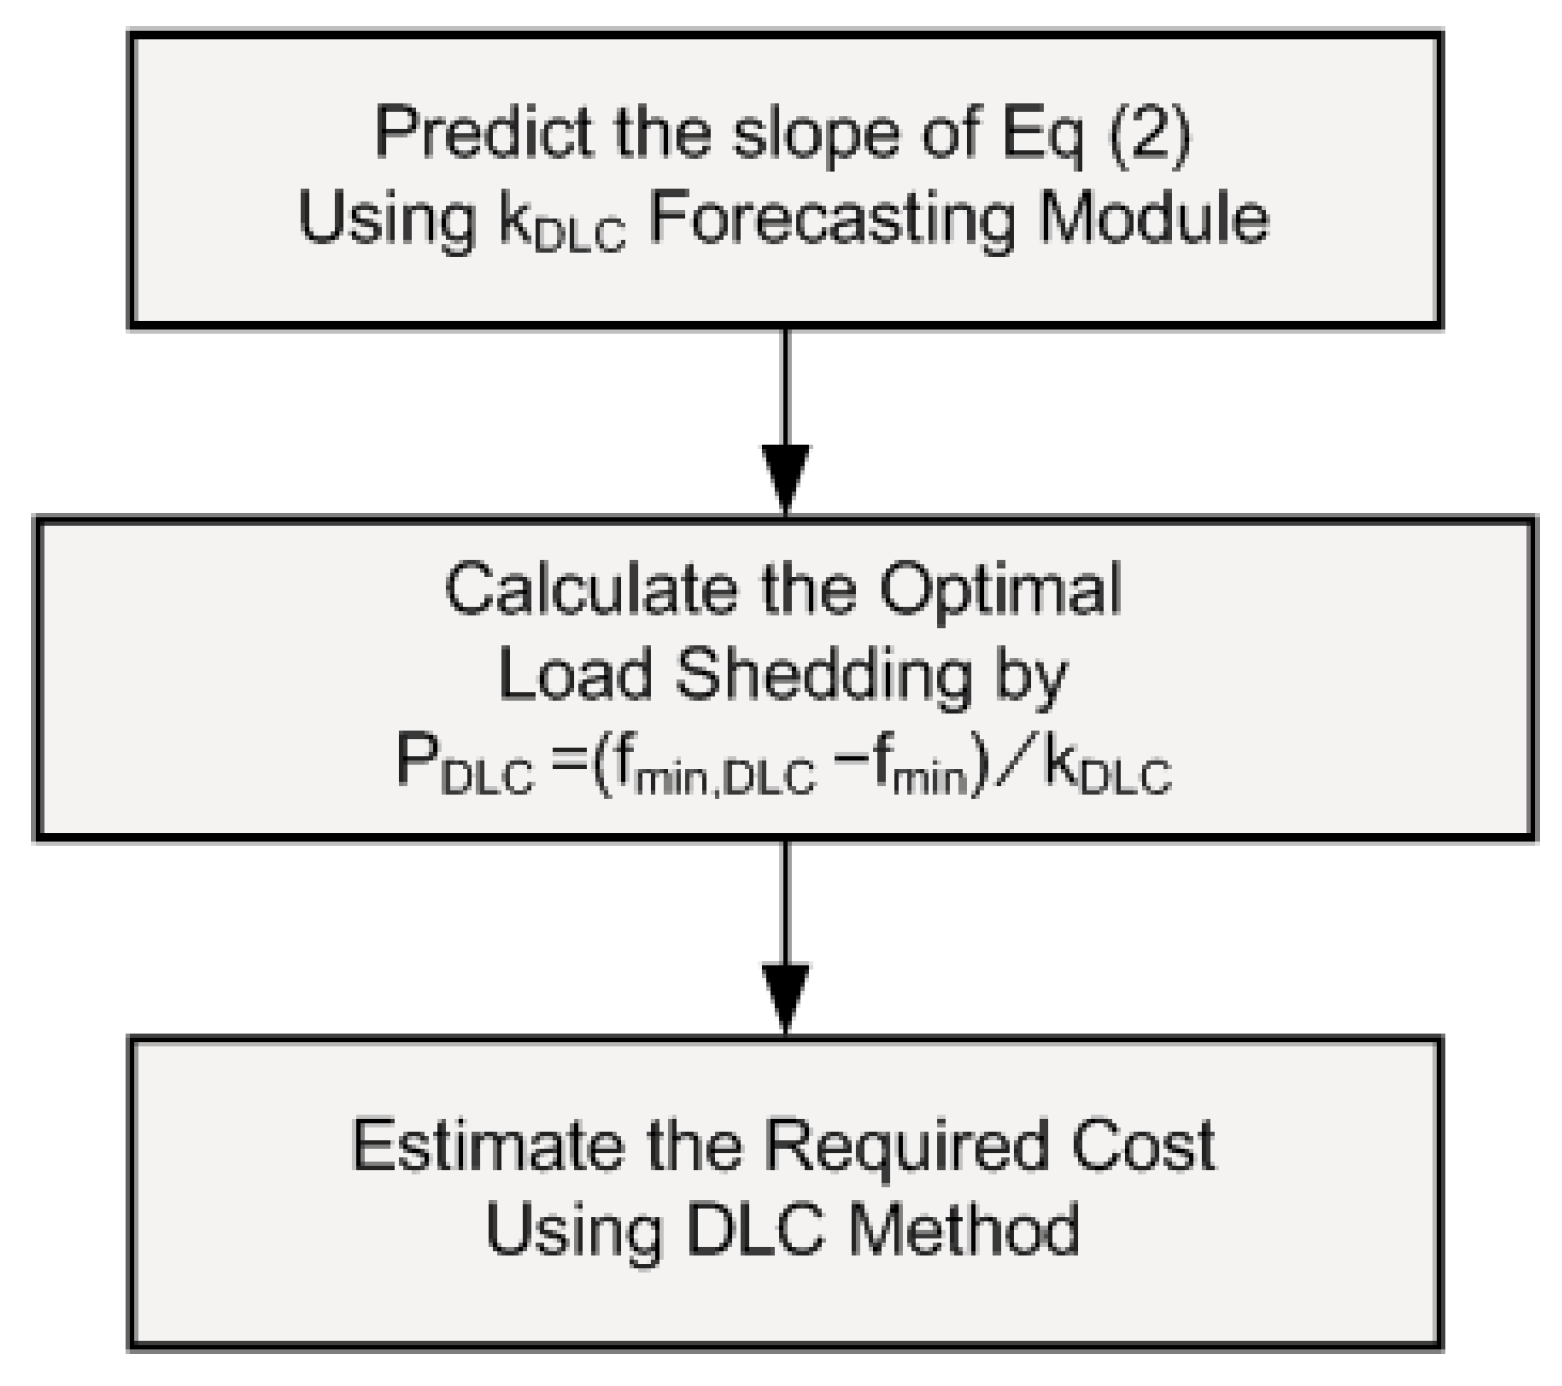
On the other hand, the operation of the DLC method is demonstrated in Figure 4. For the DLC method, based on the simulation results and approximate method, the formulation relationship between f min and the improved frequency nadir f min , D L C (Hz) by DLC has been established. The equation is shown as:
f min , D L C = f min + k D L C P D L C ,
where the P D L C (MW) is the amount of the load shedding and k D L C is the slope of linear regression of Equation (2). Different operating modes have different k D L C values and they are obtained throughout a trained neural network. The offline historical data are used to train the neural network; then the required minimal load shedding of DLC ( P D L C , o p t (MW)) to support frequency response is determined, which ensures the sufficient frequency stability and minimal requirement of DLC. The frequency nadir is improved and should be higher than the predetermined frequency threshold of the power system, which is achieved with a sufficient load-shedding of DLC.
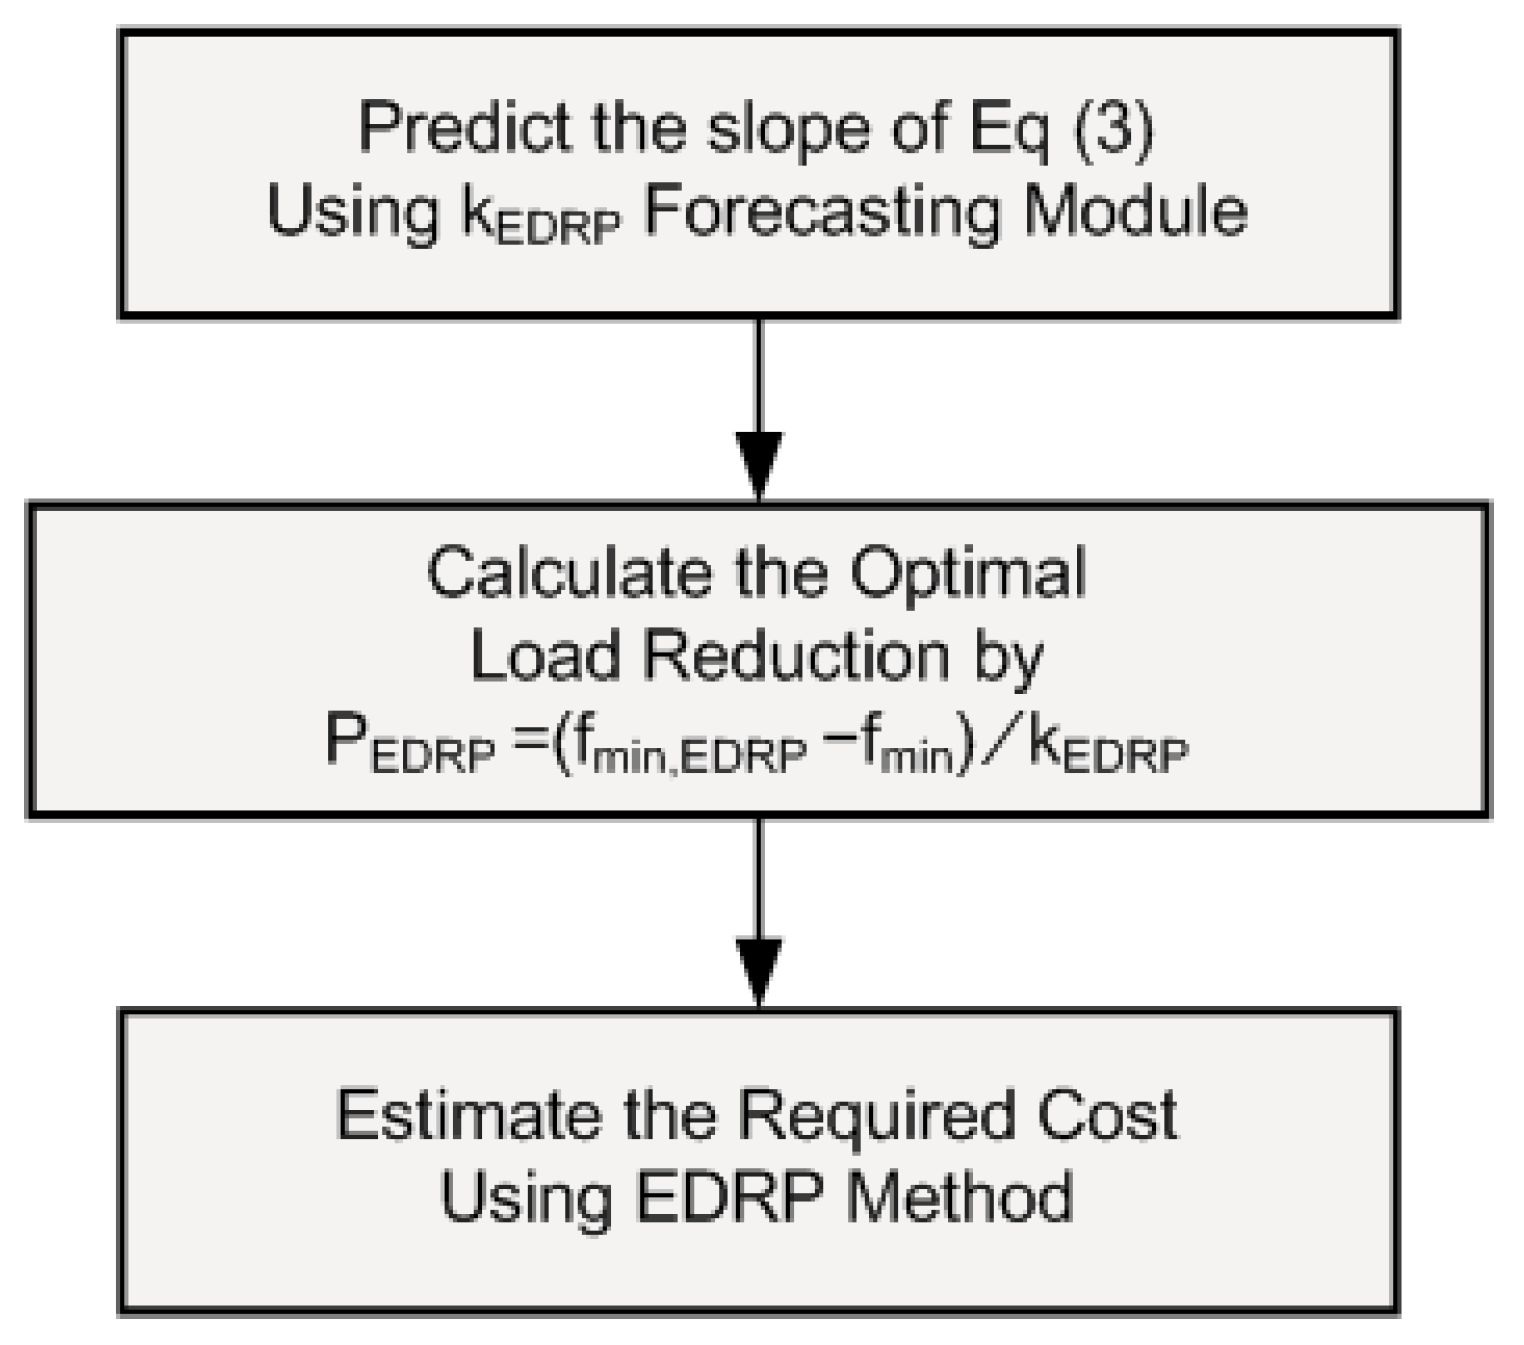
Next, the operation of the EDRP method is presented in Figure 5. In terms of the EDRP method, based on the simulation results and approximate method, the formulation relationship between f min and the improved frequency nadir by EDRP has been established. The equation is shown as:
f min , E D R P = f min + k E D R P P E D R P ,
where the P E D R P (MW) is the amount of the load reduction and k E D R P is the slope of linear regression of Equation (3). Again, different operating modes have different k E D R P values and they are obtained throughout a trained neural network. The offline historical data are used to train the neural network; then the required minimal load-reduction of EDRP ( P E D R P , o p t (MW)) to support frequency response is determined, which ensures the sufficient frequency stability and minimal requirement of EDRP. The frequency nadir is improved and should be higher than the predetermined frequency threshold of power system, which is achieved with the sufficient peak-load reduction of EDRP.

3. Establishment of the Database Used in the Proposed Preventive Control Strategy

In the proposed preventive control strategy, the frequency nadir and the k B E S S , k D L C and k E D R P values under an N-1 contingency event for every 5min were simulated. To ensure the proposed preventive control strategy is worthy of trust, the frequency nadir forecasting module and the k B E S S , k D L C and k E D R P forecasting modules must be sufficiently robust to provide accurate results. Before the forecasting modules are developed and the neural networks are trained, the offline database must be established first. The steps for establishing the database for module training are as follows.

3.1. Step 1

Step 1 is to identify the parameters of the system network and obtain the system operating data. The system operating data include the power output of diesel generators, the power output of wind turbines, the power output of photovoltaics, system load, computed system moment of inertia, computed spinning reserve and the power loss owing to an N-1 tripping event.

3.2. Step 2

In Step 2, the power system simulation software (PSS/E) is used to simulate the transient frequency nadir f min and then obtain the corresponding P B E S S , P D L C and P E D R P every 5 min using (1)–(3).

3.3. Step 3

In Step 3, the offline database concerning frequency response is established. This database includes the historical system operating data, the used P B E S S , P D L C and P E D R P and corresponding f min under the N-1 contingency event. The offline database is utilized to train the f min , k B E S S , k D L C and k E D R P forecasting modules.
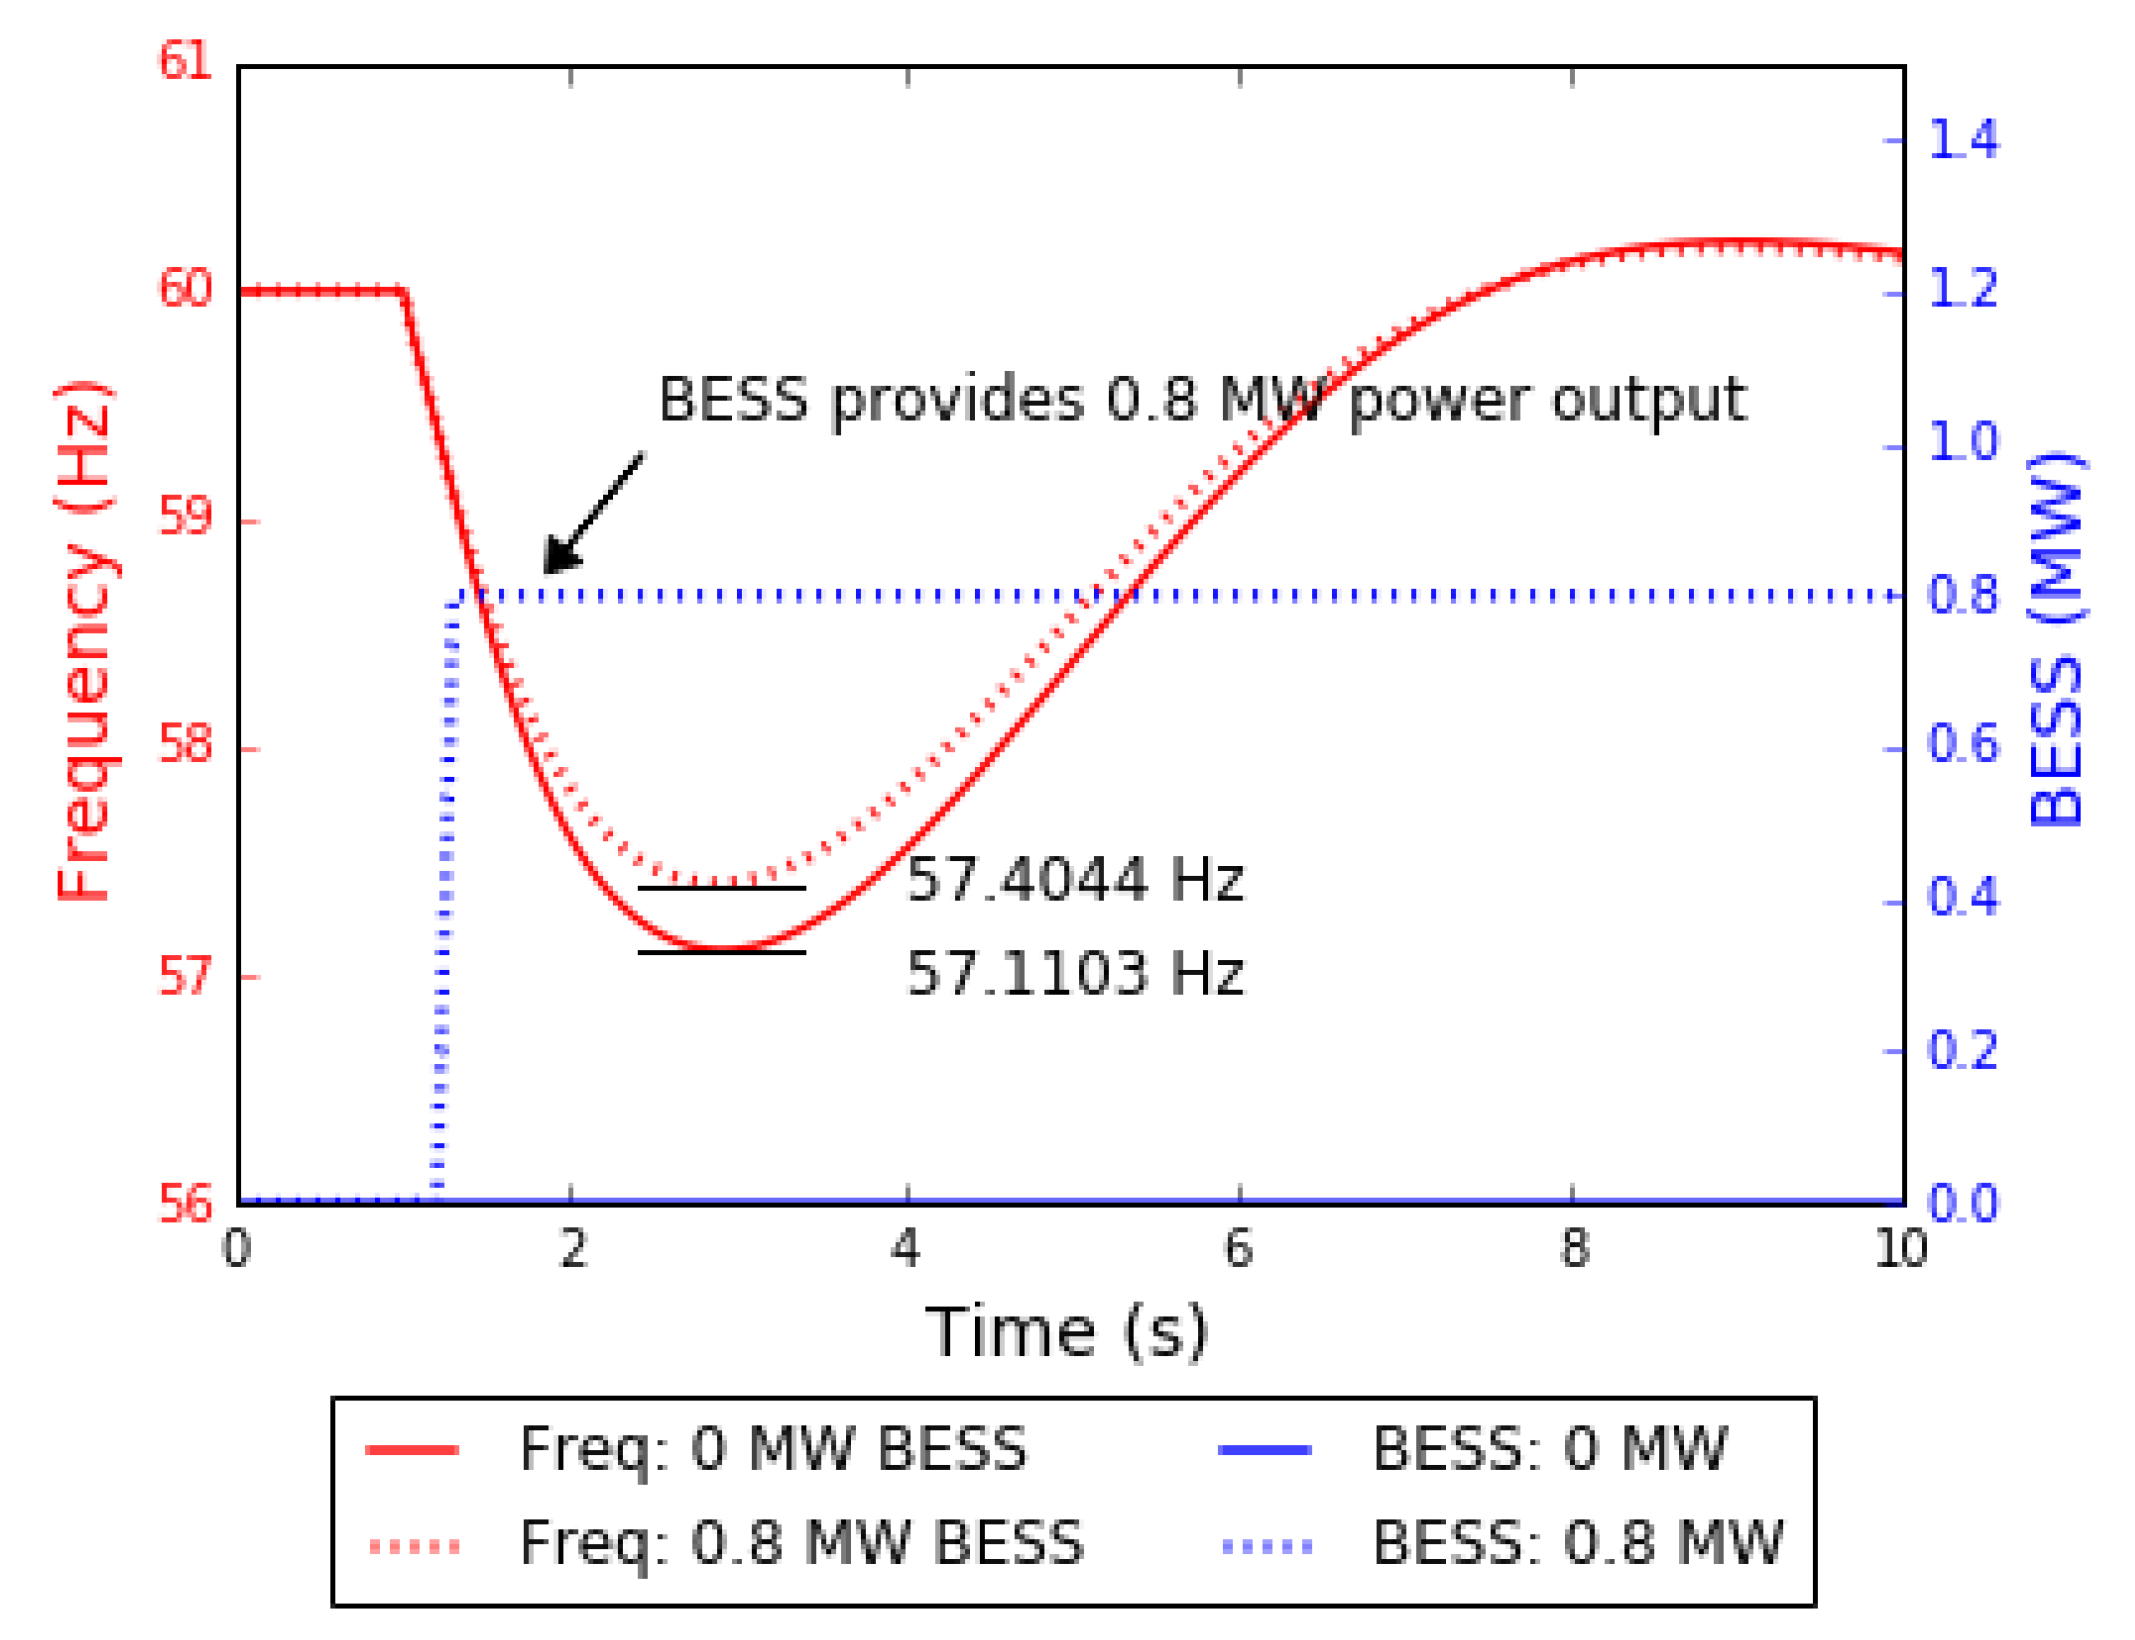
For the BESS method, the battery is considered as a back-up power source, which is directly controlled by system operators [8,27]. Many researches investigate the control methods for battery outputs and those methods affects the frequency support capability of BESS [21,28,29]. This work assumes that the BESS will provide the active power output directly when a contingency is detected and it assumes the battery response time to be 100 ms [4,30]. Figure 6 shows an example for frequency response with and without using BESS—the solid red line and the dash red line represent the frequency response with 0 and 0.8 MW BESS, respectively. In this operating status, the relation between the power output from BESS and frequency nadir is summarized in Table 1 and it can be described by a linear regression with the slope of 0.0368.
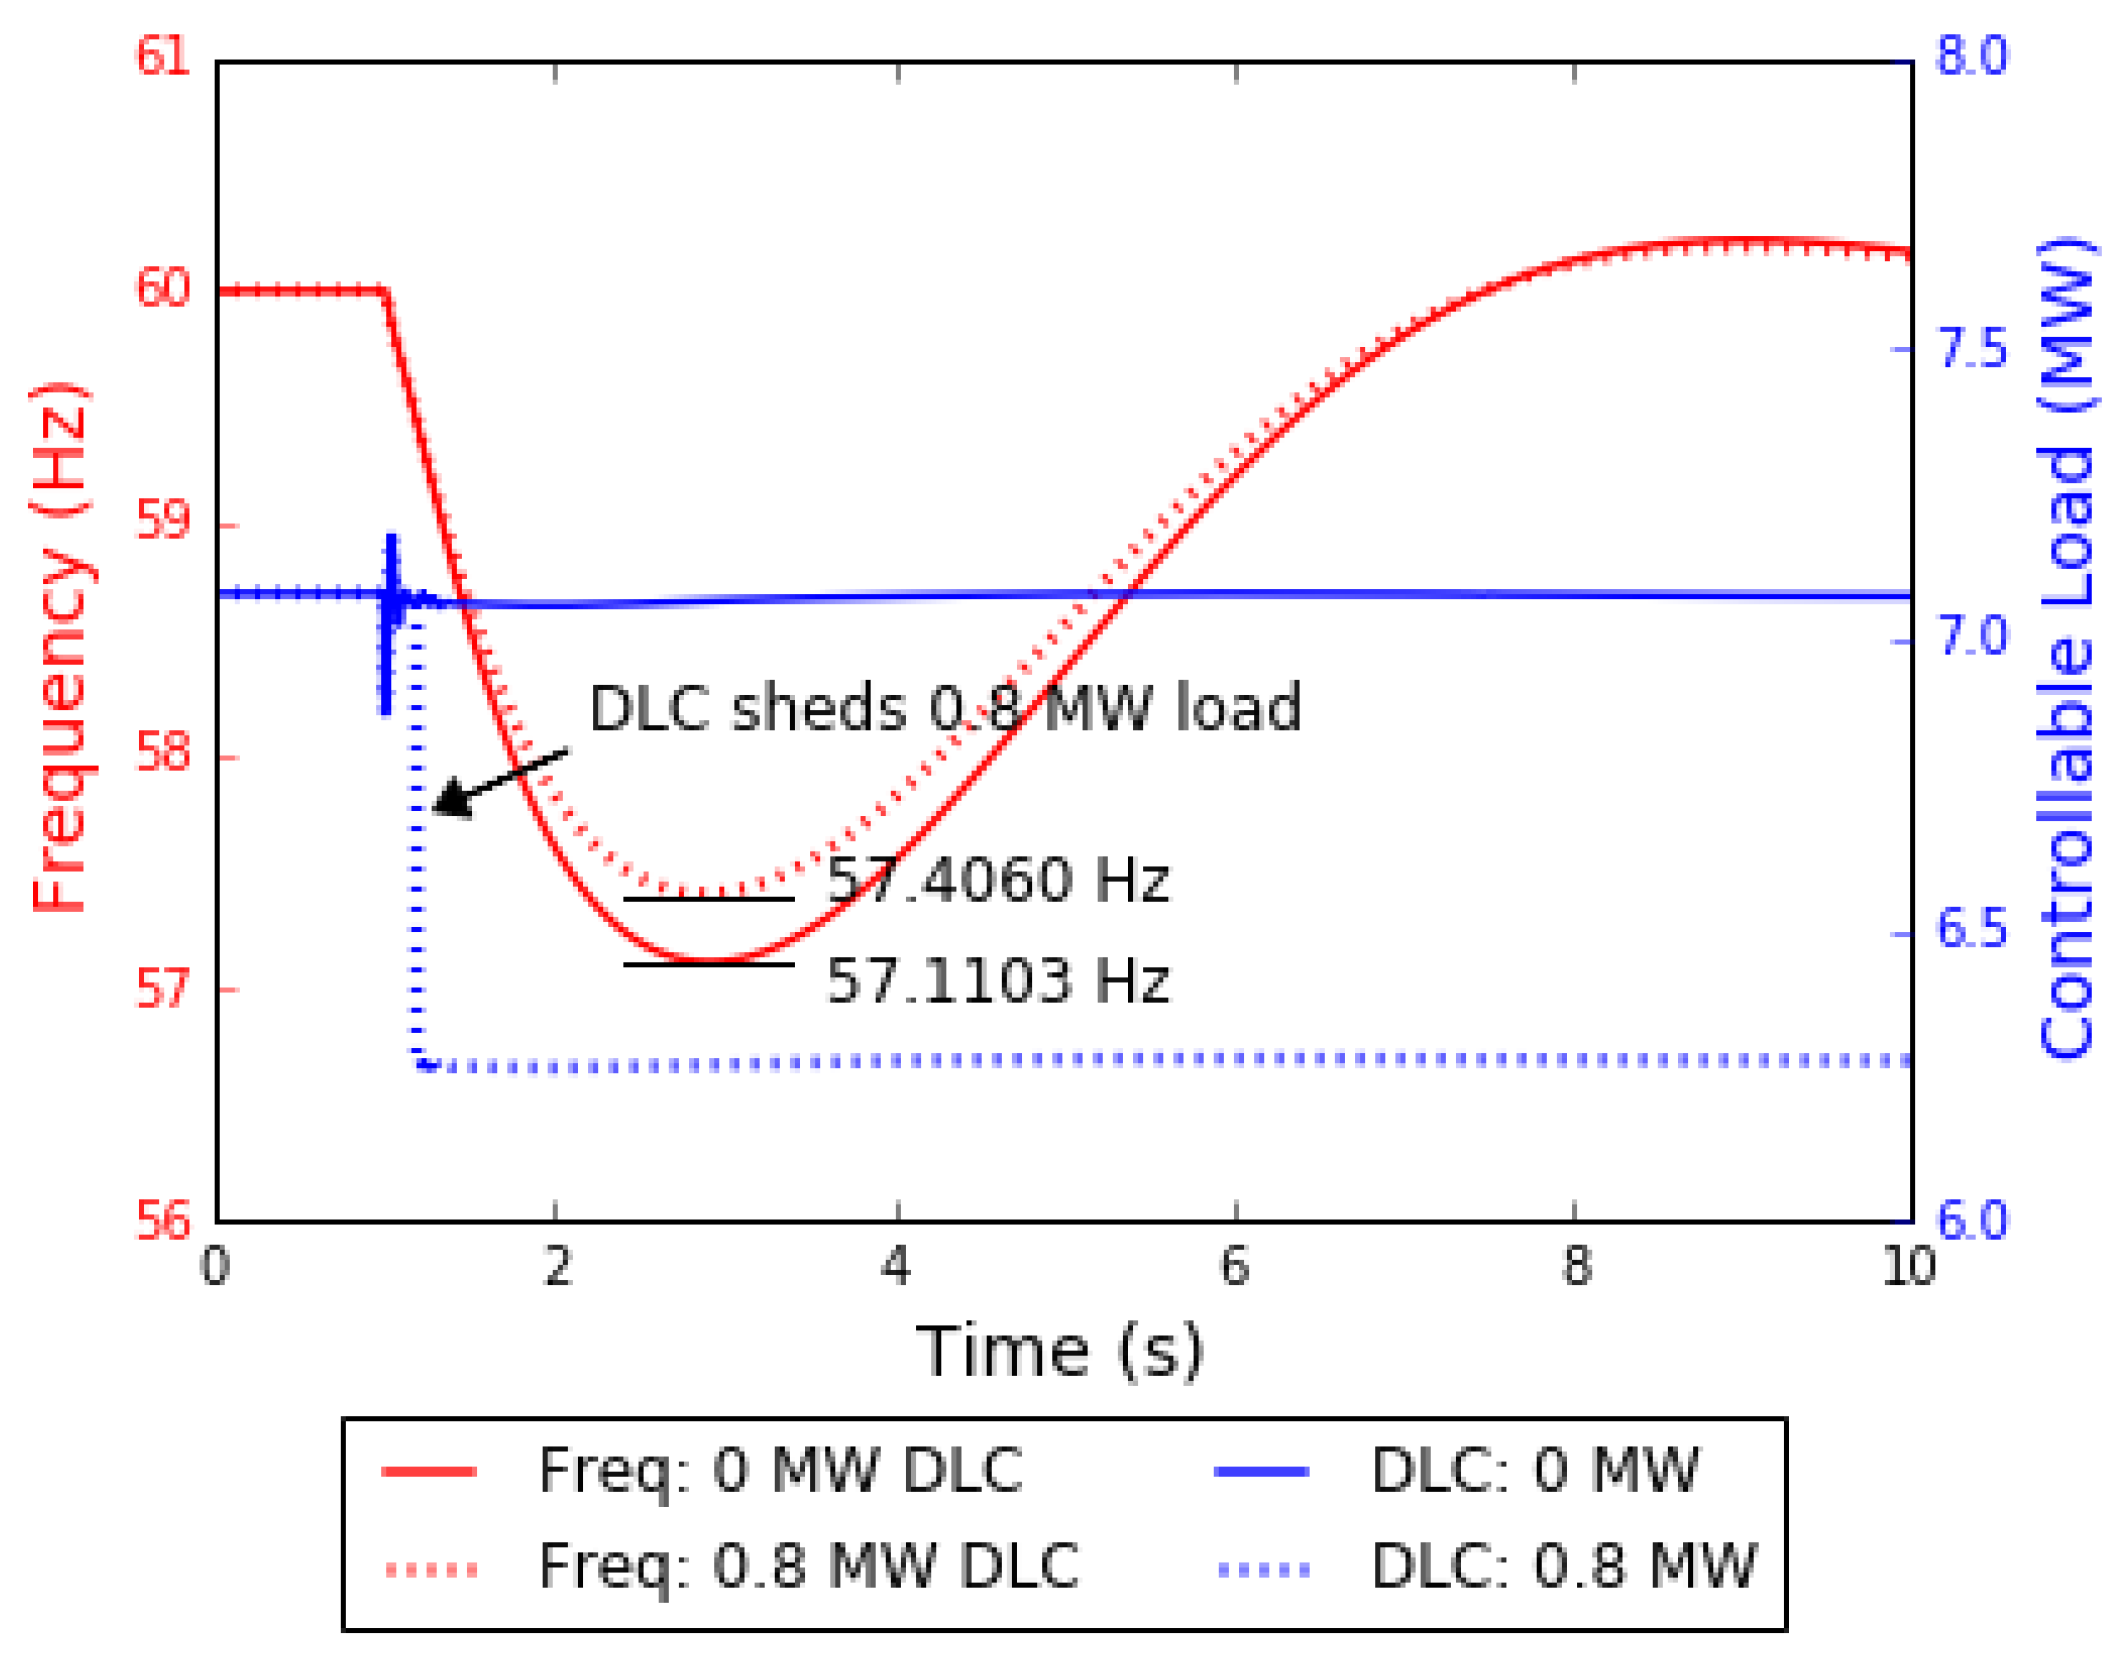
Furthermore, the DLC method provides load participants with incentive payments or rate discount and it allows system operators directly shuts down or cycles participants’ certain electrical appliance [9,10,11,12,13,14]. The certain electrical appliance (e.g., air conditioners and water heaters) can be directly shed via the load-relay or load-controller. Whether the load-relay or load-controller is activated or not, load participants receive the incentive payments or rate discount. Many researchers investigated different UFLS relay settings and the corresponding frequency support capability by DLC [3,31,32,33]. This work assumes the load participants to provide the UFLS service using the rate of change of frequency relay. Figure 7 shows an example for frequency response with and without the use of DLC—the solid red line and the dash red line represent the frequency response with 0 and 0.8 MW DLC, respectively. Within the same operating status, the relation between the amount of load shedding and frequency nadir is summarized in Table 2 and it can be described by a linear regression with the slope of 0.037.
The EDRP method provides load participants with incentive payments or rate discount; it notifies participants 15 min to 2 h ahead and requests for voluntary load-reduction service [9,10,11,12,13,14,15]. By implementing the proposed preventive control method and the short-term renewable and load forecasts, system operators can predict and reduce a certain amount of load in advance [9,14,16,17], regardless either a contingency event really occurs or not. In this work, the EDRP scheme notifies load participants 15 min in advance, which is common for a general EDRP scheme. Figure 8 shows an example for frequency response with and without using EDRP—the solid red line and the dash red line represent the frequency response with 0 and 3.6 MW EDRP load-reduction, respectively. Within the same operating status, the relation between the amount of load shedding and frequency nadir is summarized in Table 3 and it can be described by a linear regression with the slope of 0.026. It is noted that the EDRP method needs more load reduction in order to provide spinning reserve, which increases the overall operating cost and reduces the efficiency. However, it is still an option for frequency regulation for emergency cases; additionally, it sheds the voluntary participants in advance and avoids unplanned load shedding.

4. Establishment of Forecasting Modules for Frequency Nadir and Frequency Support Capability

4.1. Frequency Nadir Forecasting Module

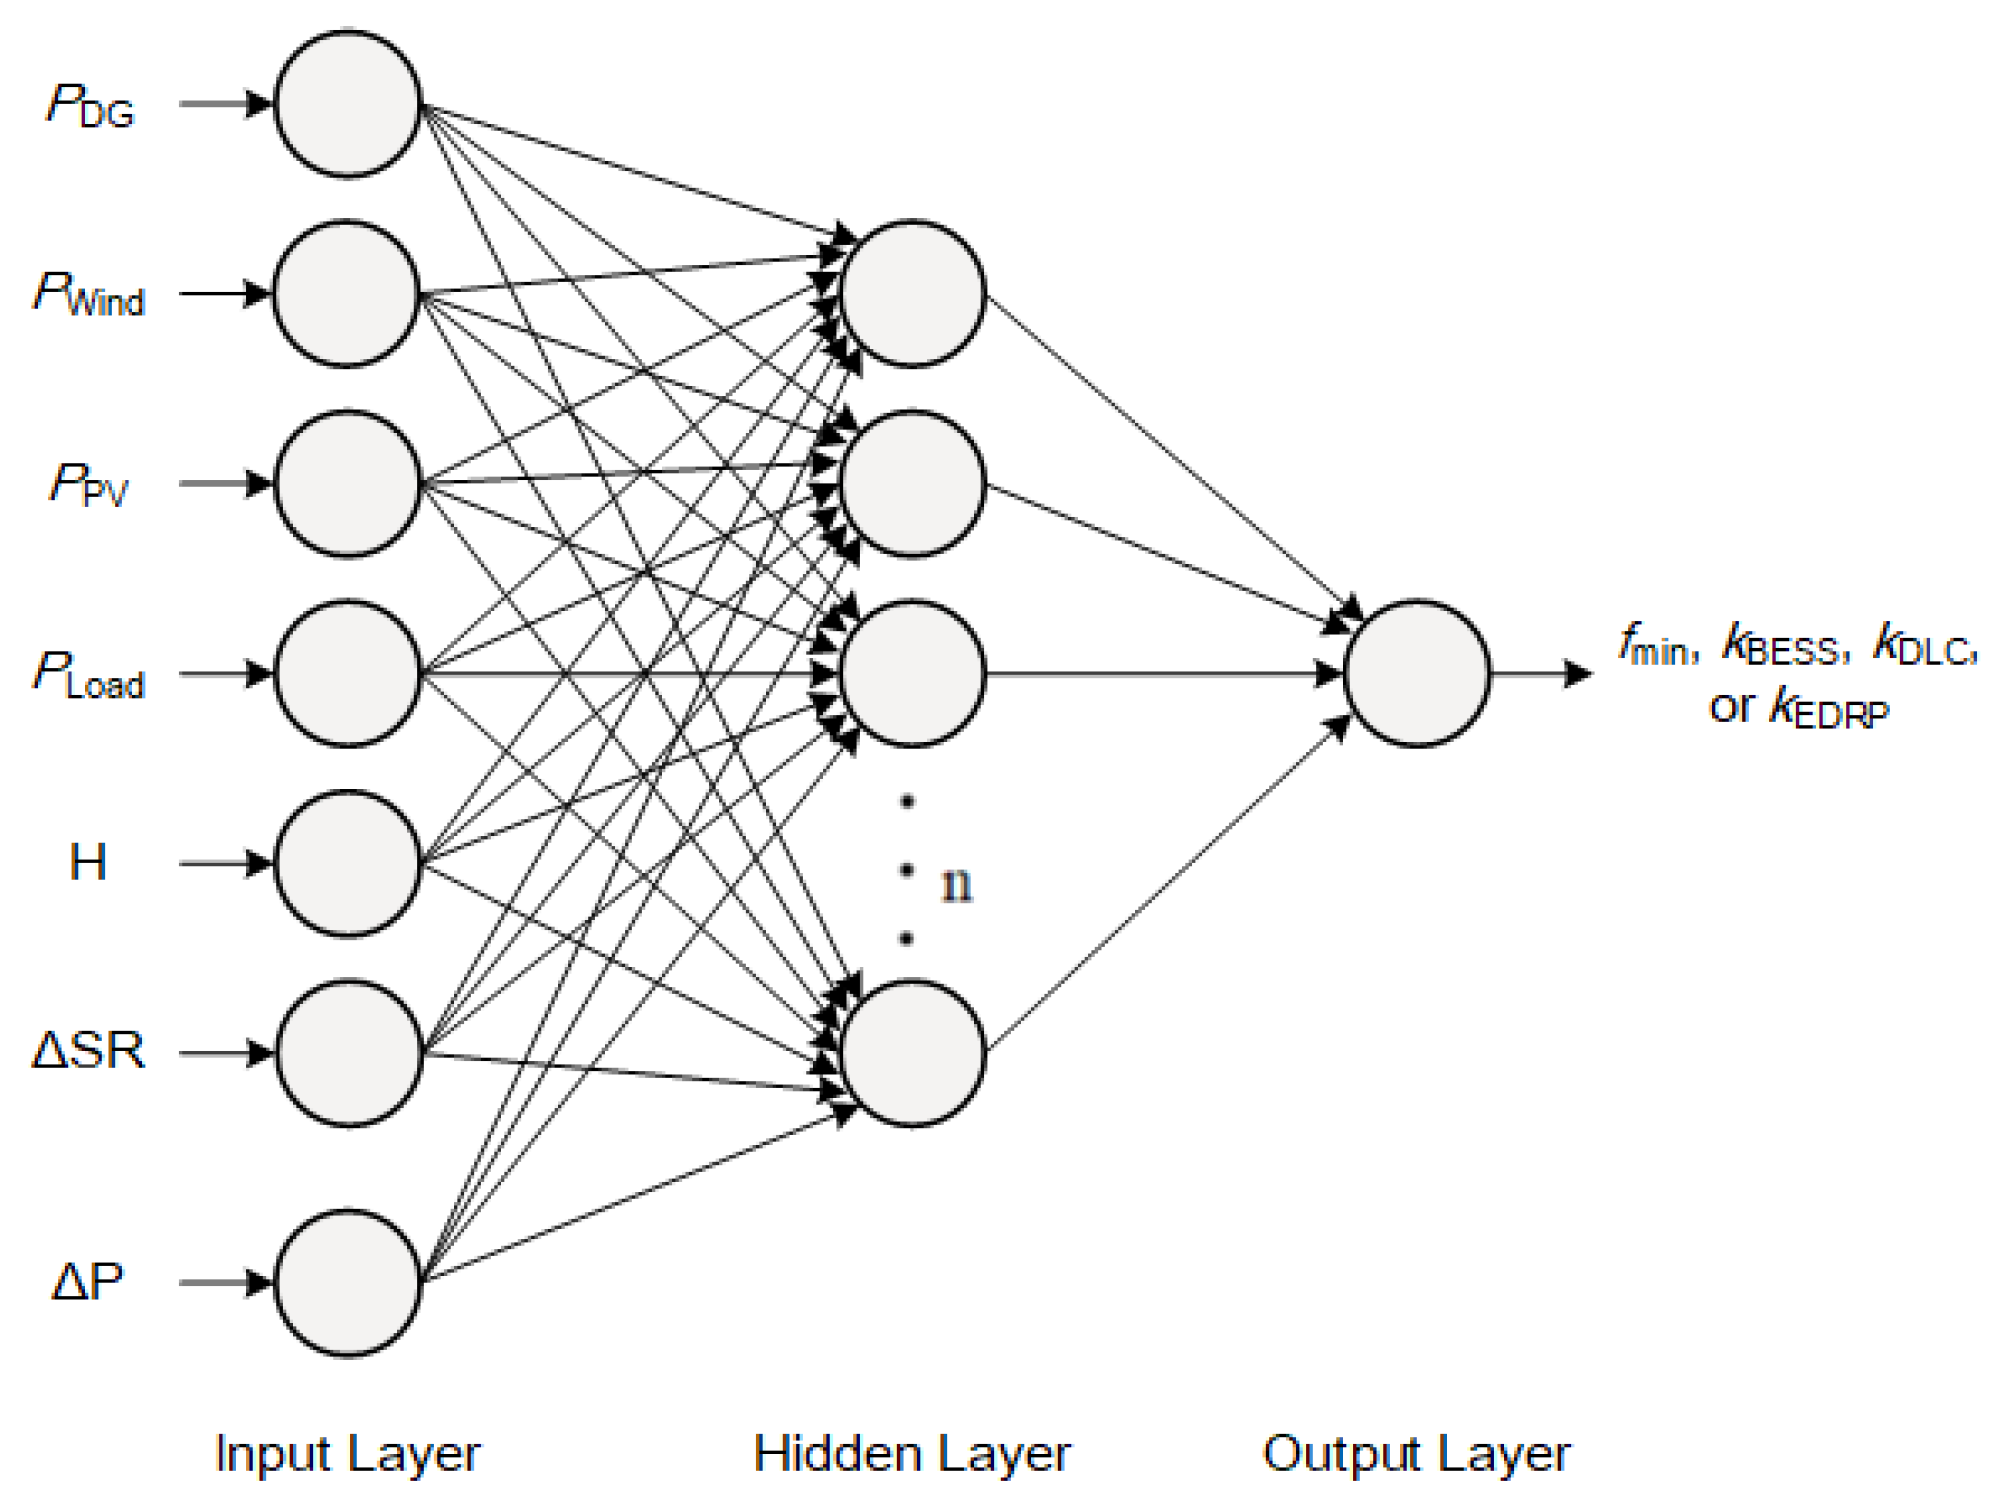
In the proposed preventive control strategy, the frequency nadir forecasting module is trained by back-propagation artificial neural network (BP-ANN), which capable of accurately predict the system frequency nadir under an N-1 contingency [1,2]. The frequency nadir forecasting module using BP-ANN is illustrated in Figure 9. The input data include the power output of diesel generators ( P D G (MW)), power output of wind turbines ( P w i n d (MW)), power output of photovoltaics ( P P V (MW)), system load ( P L o a d (MW)), computed system moment of inertia (H) and computed spinning reserve (ΔSR) and the power loss owing to an N-1 tripping event (ΔP). The output data of the module are the frequency nadirs without any frequency-support control.

4.2. Frequency Support Capability of BESS, DLC and EDRP

The relationship between frequency nadir and frequency support capability, including BESS, DLC or EDRP, are constructed via the BP-ANN and the linear regression. For the BESS method, the value of k B E S S in equation (1) is nearly a constant if the system continuously operates at the same condition. For example, k B E S S in Table 1 is approximately to 0.0367 Hz/MW and it varies under different operating conditions. Therefore, this work first utilizes the linear regression technique to approximate the values of k B E S S under various operating conditions. Then, the BESS frequency support capability forecasting module is developed to predict the optimal k B E S S under various system operating conditions. It is trained by the BP-ANN and illustrated in Figure 9. The input data include all the system operating data from the database established in Section 3 and the output data are the optimal k B E S S calculated by linear regression. Additionally, this work can establish the formulation relationship between frequency nadir and BESS frequency support capability, presented as (1). For the DLC and EDRP method, the optimal k D L C and k E D R P values are obtained by the similar process and the formulation relationship are established and presented as (2) and (3).
If only the BESS method is considered, the optimized output capacity of BESS P B E S S , o p t is determined by (4). For the DLC method only and EDRP method only, the optimized load-shedding of DLC P D L C , o p t and optimized peak-load reduction of EDRP P E D R P , o p t are determined similarly, presented as (5) and (6), respectively.
P B E S S , o p t = ( f min , t h r e s h o l d f min ) / k B E S S
P D L C , o p t = ( f min , t h r e s h o l d f min ) / k D L C
P E D R P , o p t = ( f min , t h r e s h o l d f min ) / k E D R P

5. Cost Analysis for the Proposed Preventive Control Methods

5.1. Cost Analysis for the GR Method

Generally, the cost for GR method consists of the fuel cost and start-up cost of diesel generators. The typical fuel cost function of a diesel generator is approximate to a quadratic equation, presented as (7)
f ( P i ) = a i P i 2 + b i P i + c i ,
where P i (MW) is active power output from the diesel generator i. Because the coefficients a i , b i and c i of each diesel generator are different, the re-dispatch of diesel generators would increase or decrease the total fuel cost. In contrast, the start-up cost is considered only when starting additional diesel unit. In this work, the start-up cost of one diesel unit is 80 L of diesel fuel.
In the Penghu Island power system, the fuel cost functions on the diesel generators are either convex upward curves or convex downward curves. That is, the Penghu Island power system has a non-monotonicity characteristic of the fuel incremental cost. Therefore, this work utilizes the mixed integer linear programming (MILP) method to solve the economic dispatch problem. The MILP method can achieve the optimal solution even when the incremental cost of system is non-monotonicity [1,34].

5.2. Cost Analysis for the BESS Method

In the proposed control strategy, the cost for implementing the BESS method also considers the limited lifetime of BESS. First, the battery cycle cost is calculated as follows
C B a t t , c y c l e = C B a t t , i n v e s t m e n t / L B a t t ,
where C B a t t , i n v e s t m e n t (USD/kW) is the investment cost of 1 kW battery; L B a t t (cycle) is the lifetime of battery. The lifetime of battery is determined by many factors, including the battery charging/discharging patterns, ambient temperature and others. However, since the requirement on frequency support is highly variable, the required battery charging/discharging patterns cannot be accurately predicted and they depend on the system operators’ applications [4,21]. Therefore, this work assumes that a battery package is installed at Jian-Shan Thermal Power Plant and the L B a t t is 5000 cycles and C B a t t , i n v e s t m e n t is 2000 USD/kW [4,30,35,36,37,38]. Then, the C B a t t , c y c l e (USD/kW/cycle) is set to 0.4 USD/kW/cycle, to support system frequency response. As a result, the corresponding cost using the BESS method is calculated as (9).
C B E S S = C B a t t , c y c l e × P B E S S , o p t .
In the study, the historical and real-time requirement of P B E S S , o p t of Jian-Shan Thermal Power Plant are analyzed and predicted and the cost for implementing the BESS method of power system can be calculated.

5.3. Cost Analysis for the DLC and EDRP Methods

On the other hand, the cost for DLC and EDRP methods take into account the rate discount for load participants. Generally, the rate discount depends on the electricity bill and demand-response contracts. In Taiwan, Taiwan Power Company provides the discounts of demand charge and energy charge to EDRP participants and the corresponding scheme concerning the Taiwan Power Company EDRP is presented in Table 4. EDRP participants pre-register their contracts on the suppression capacity. Participants can select to provide 2 h or 4 h load reduction and the average of load reduction ( P E D R P , a v g (MW)) should be no less than the contracted suppression capacity. Therefore, the corresponding cost for the EDRP method can be calculated by (10)–(13),
C E D R P = C E D R P , D C + C E D R P , E C
C E D R P , D C = P C S C D D C
C E D R P , E C = P E D R P D E C
P E D R P , a v g P C S C ,
where C E D R P (NTD) is the cost for the EDRP method; C E D R P , D C (NTD) is the cost for demand-charge discount in one month; C E D R P , E C (NTD) is the cost for energy-charge discount; P C S C (MW) is the pre-registered contracted suppression capacity; D D C (NTD/MW) is the demand-charge discount per MW; D E C (NTD/MWh) is the energy-charge discount per MWh.
In Taiwan, the government is currently comparing and analyzing the cost and benefits of different DR programs. However, there is no DLC program being implemented in Taiwan nowadays. References [4,39] review the international experiences about DLC and EDRP programs. In California, three different DLC programs are provided by Pacific Gas & Electric Company, Southern California Edison Company (SCE) and San Diego Gas & Electric Company [40]. These California DLC programs provide load participants with different incentive payments, which are useful references to evaluate the cost for the DLC method in Taiwan.

6. Testing System

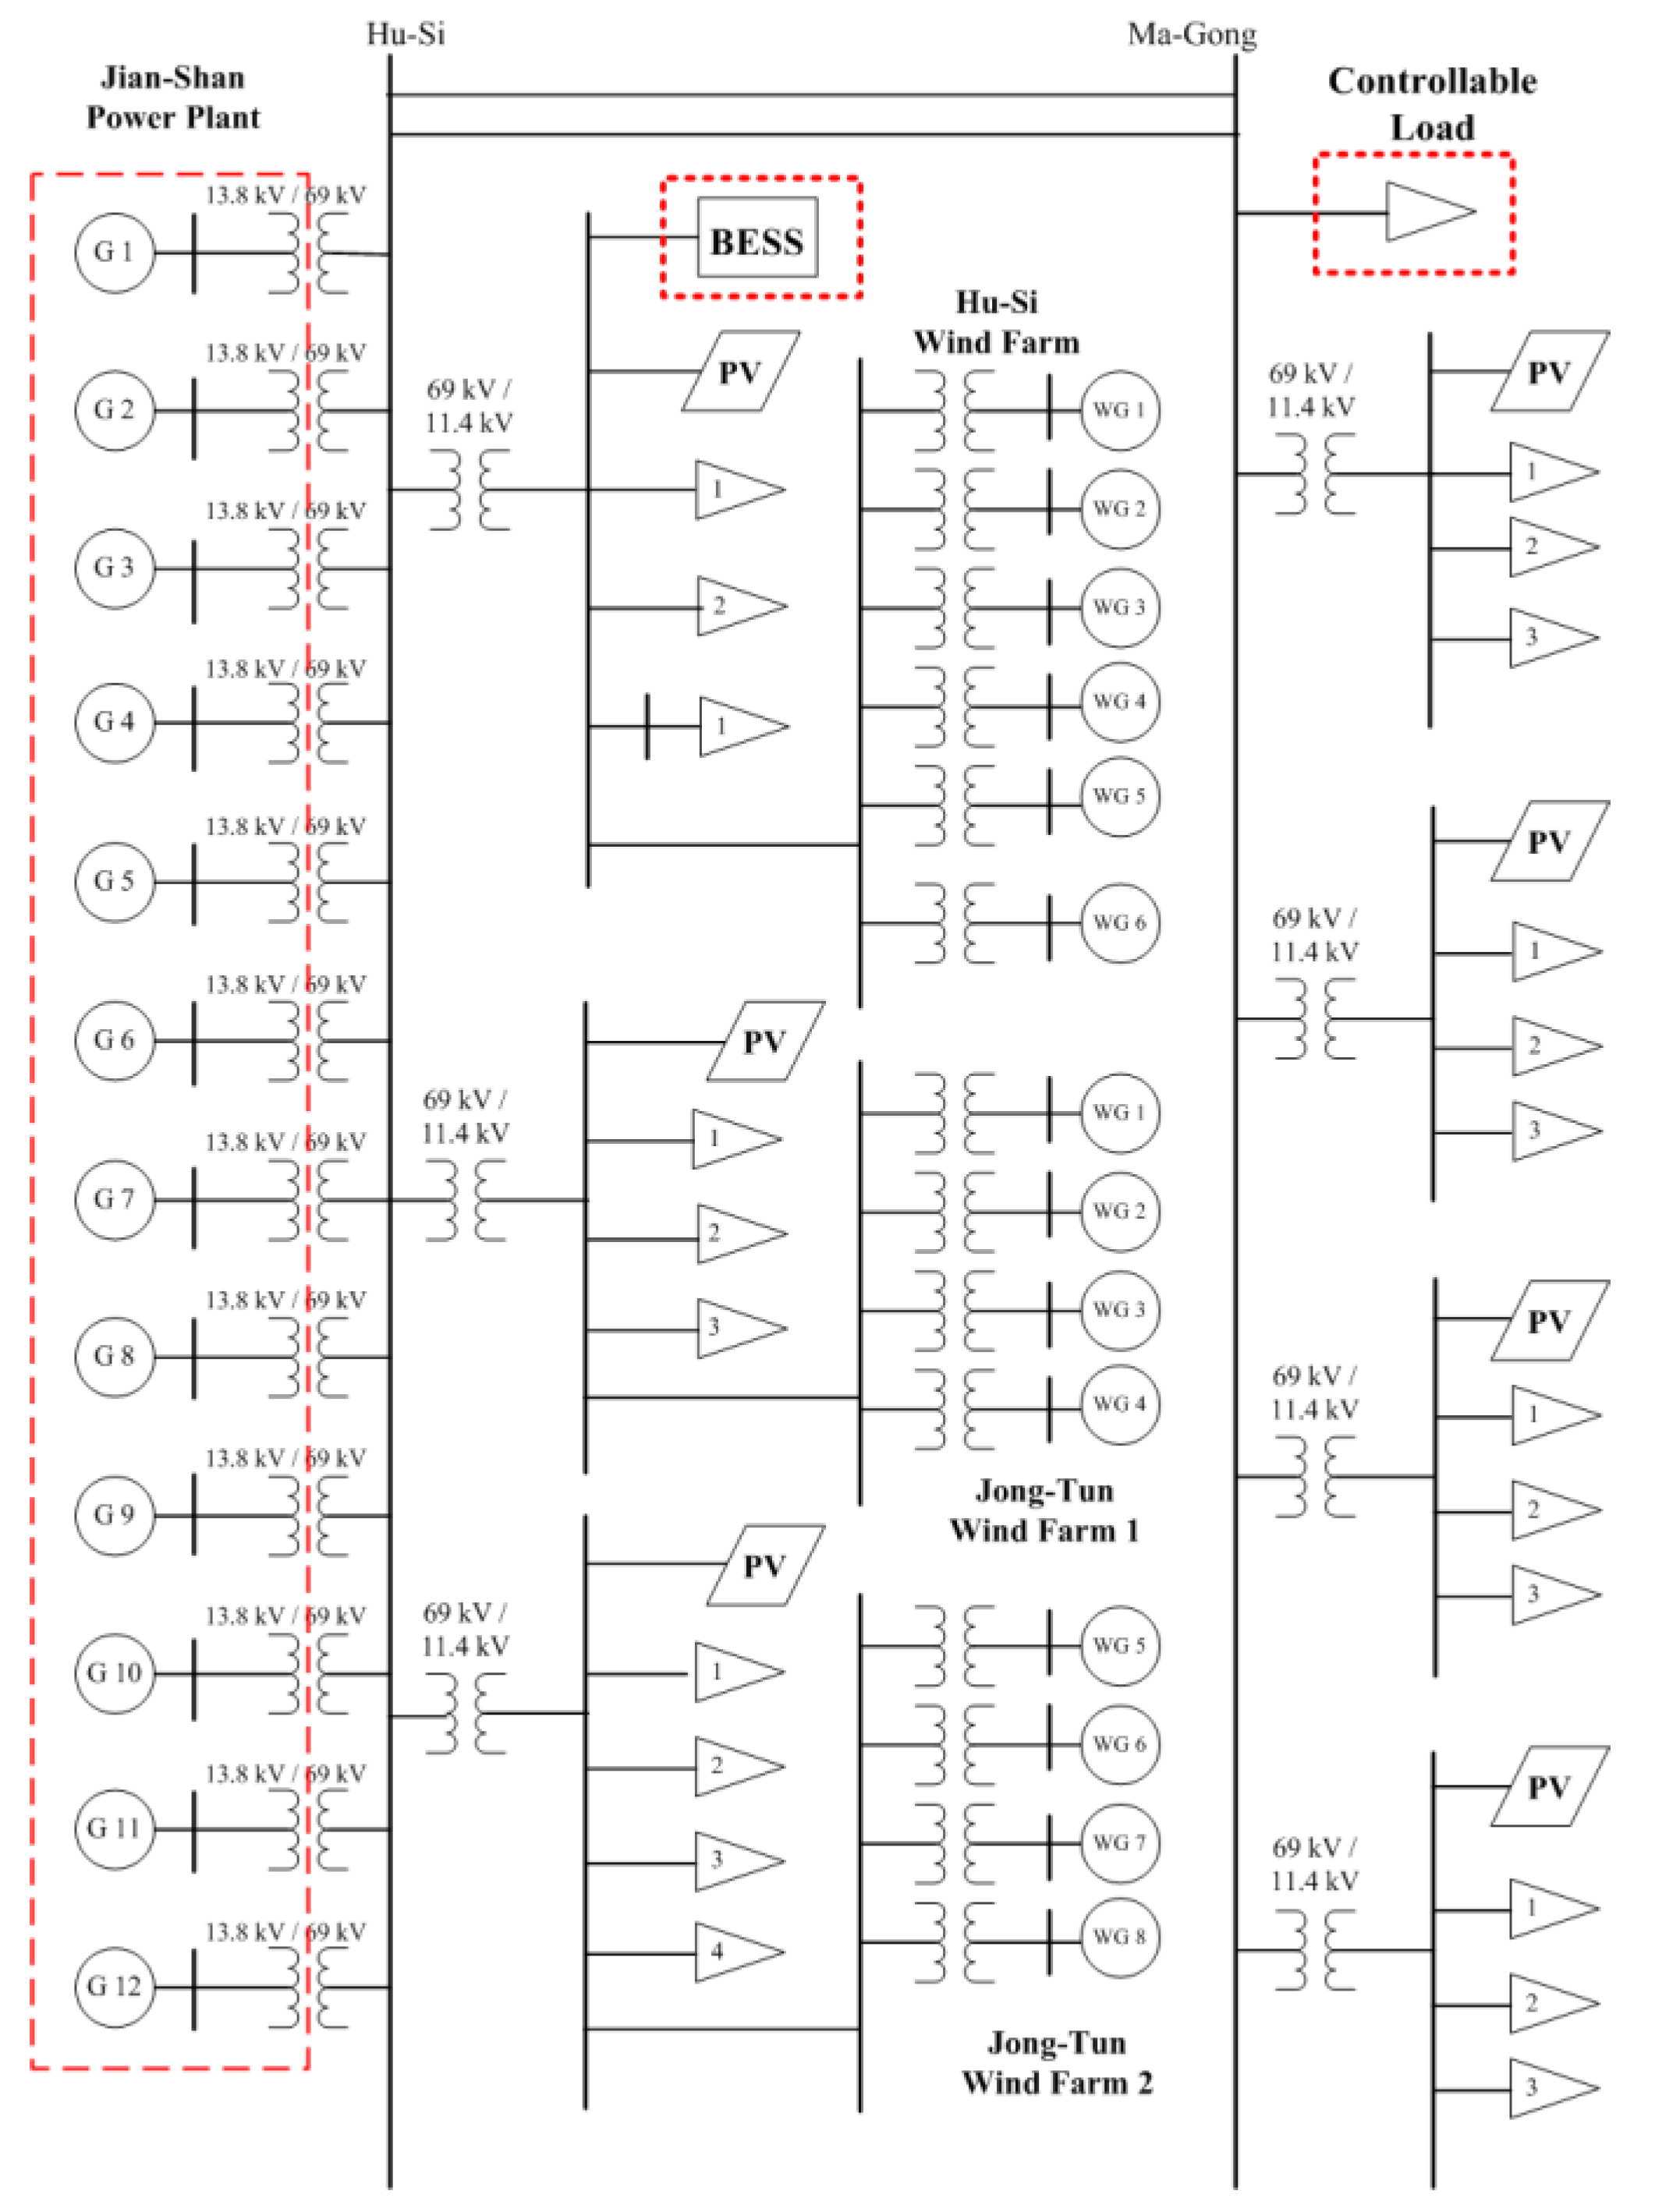
The developed under-frequency preventive control strategy was tested on the Penghu Island power system and the actual historical system operating data for every 5 min were utilized. The single line diagram of the Penghu system is presented in Figure 10. The Jian-Shan Power Plant has 12 diesel generator units with 129.6 MW of total installed capacity. The Hu-Si wind farm has 6 wind turbines with 6.0 MW of total installed capacity. Jong-Tun wind farm has 8 wind turbines with 7.2 MW of total installed capacity. The distributed solar photovoltaic (PV) has 10 MW of total installed capacity. In this work, the battery energy storage is assumed to be installed at the Hu-Si Substation for the purpose of management and maintenance. Additionally, the controllable load is assumed to be connected at Ma-Gong Substation (the main substation for the load center) for implementing the DLC and EDRP methods.
Currently, the under-frequency load shedding scheme and the rescheduling scheme of diesel generators are the defense strategies applied in the Penghu Island power system. That is, if a system contingency occurs and frequency drops to below 57.4 Hz, the under-frequency load shedding relay will be automatically activated to shed the load and then system operators reschedule the diesel generators based on their experiences. However, the load-shedding operations are unexpected and involuntary and the existing diesel generator rescheduling scheme is not economic. Therefore, this work proposes four frequency support methods to ensure sufficient system frequency stability and minimal operating costs.

7. Accuracy of the Forecasting Modules Used in the Proposed Preventive Control Strategy

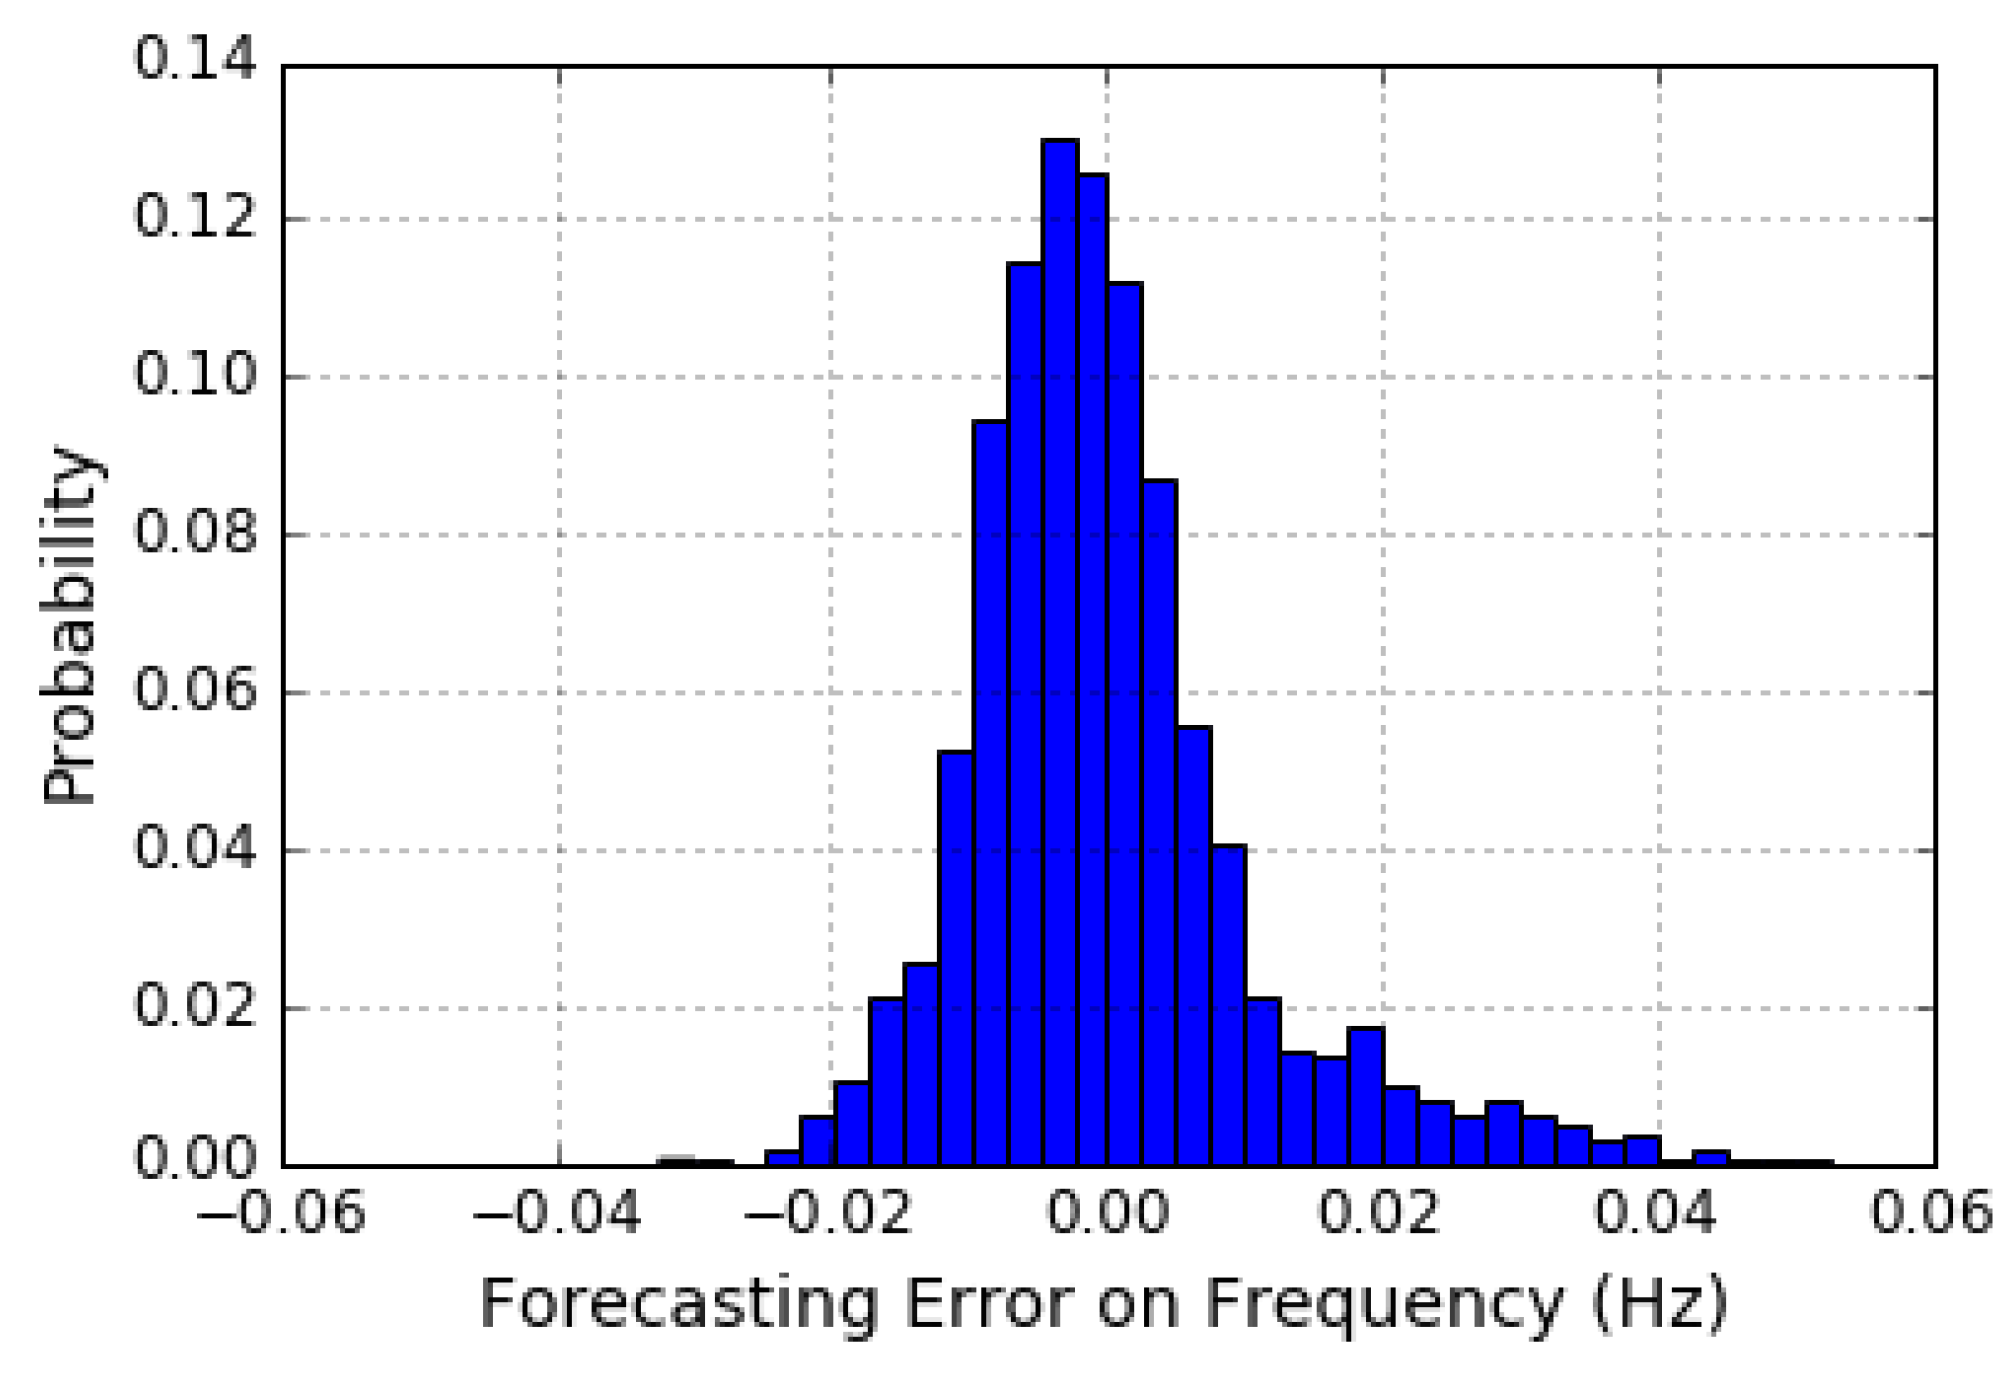
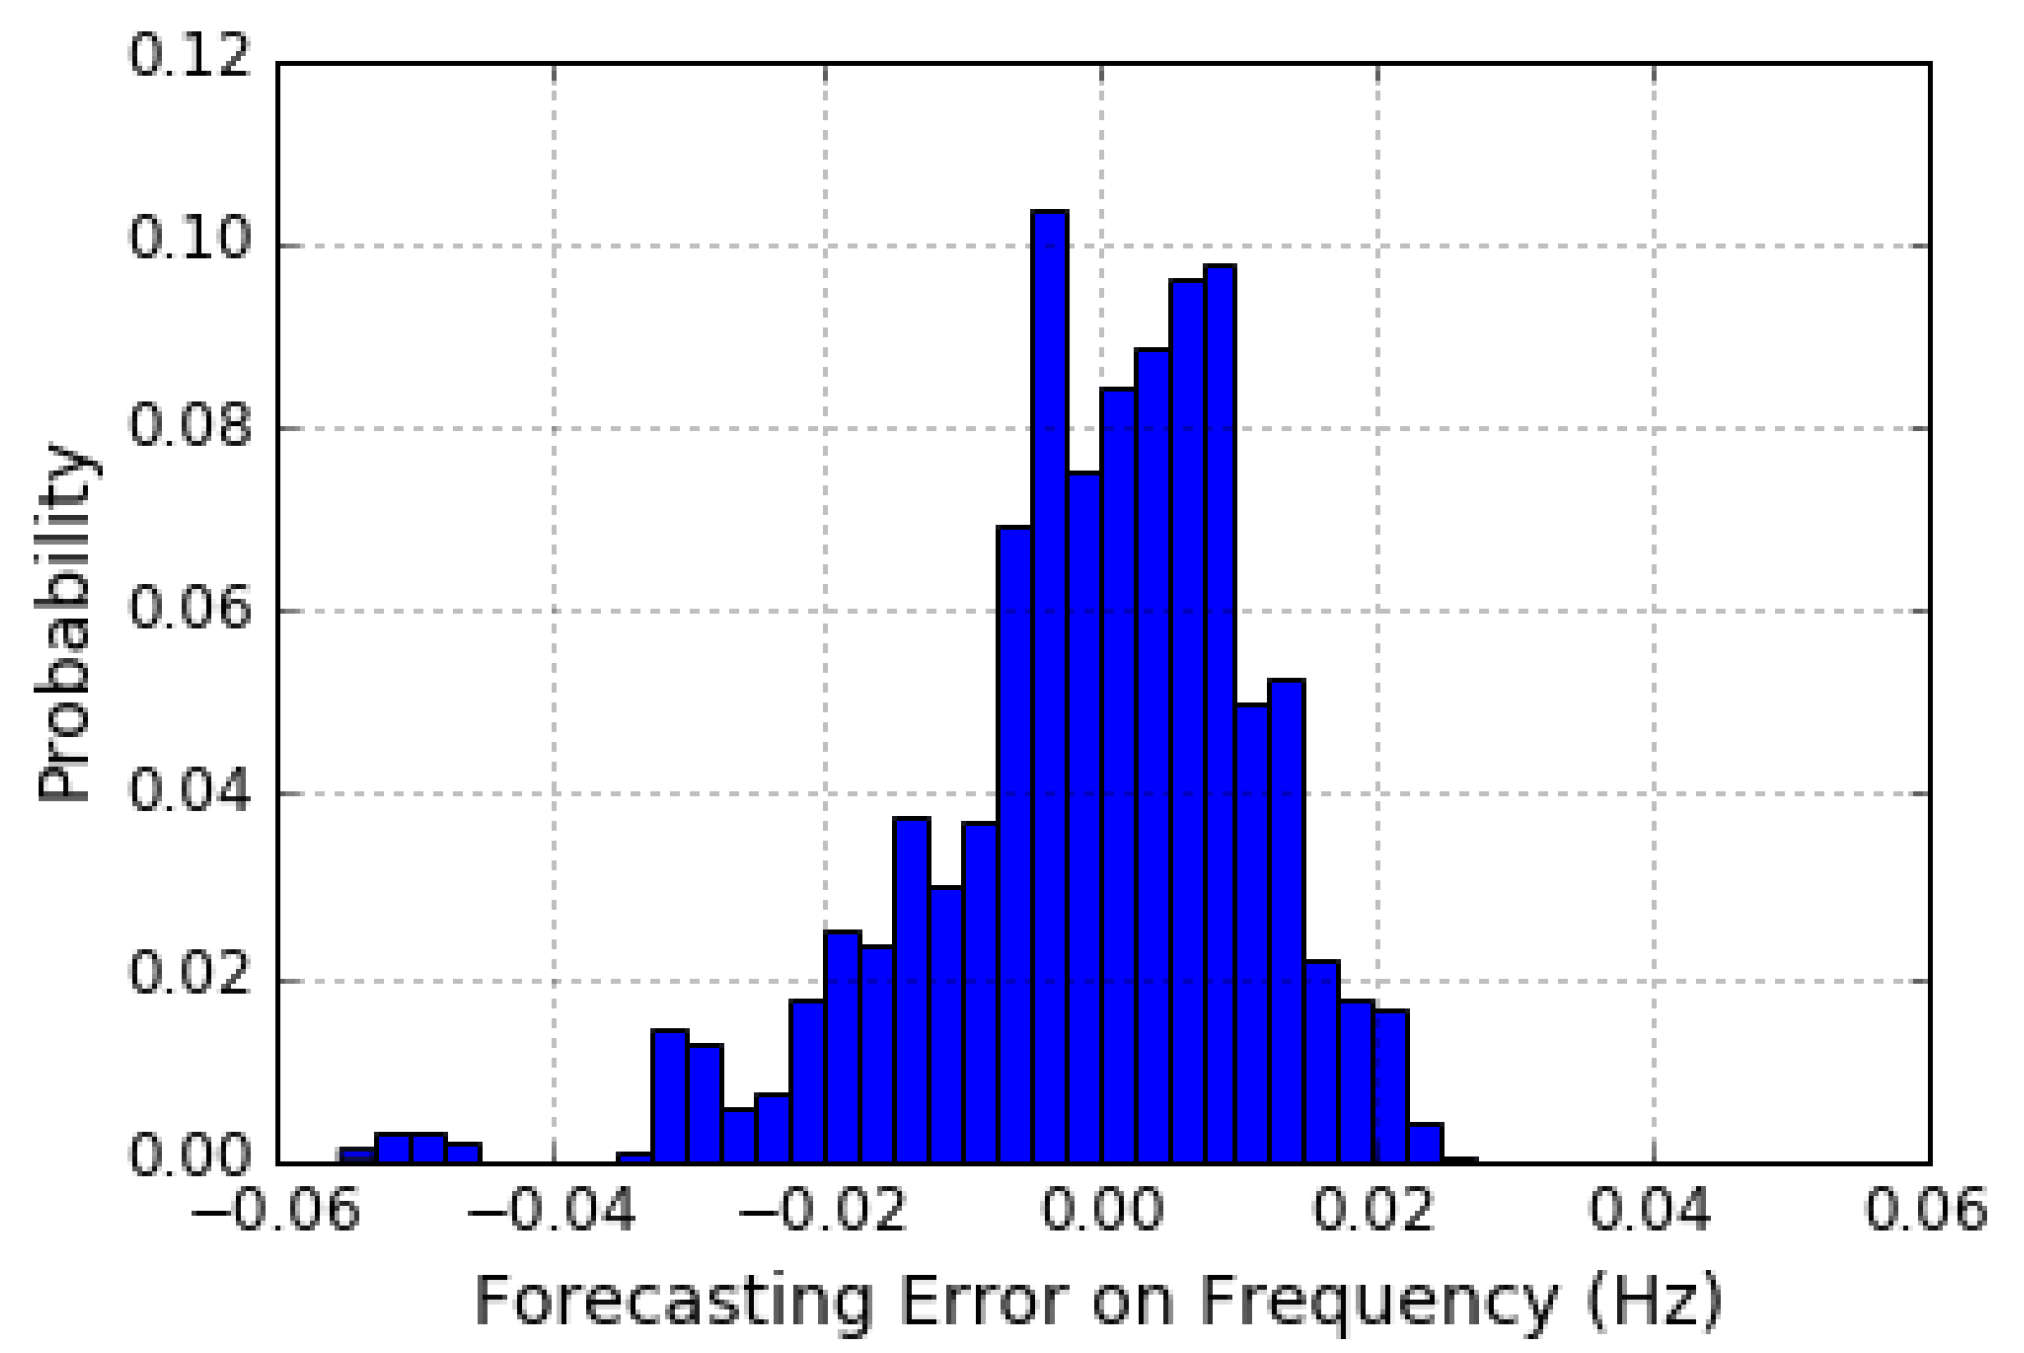
To identify whether the system can tolerate N-1 contingency events, frequency nadir must be forecast accurately. Figure 11 plots the distribution of f min forecasting errors. The f min forecasting errors are distributed between ± 0.06 Hz, with 93.74% of the errors in the ± 0.02 Hz range, which is acceptable in the Penghu Island power system.
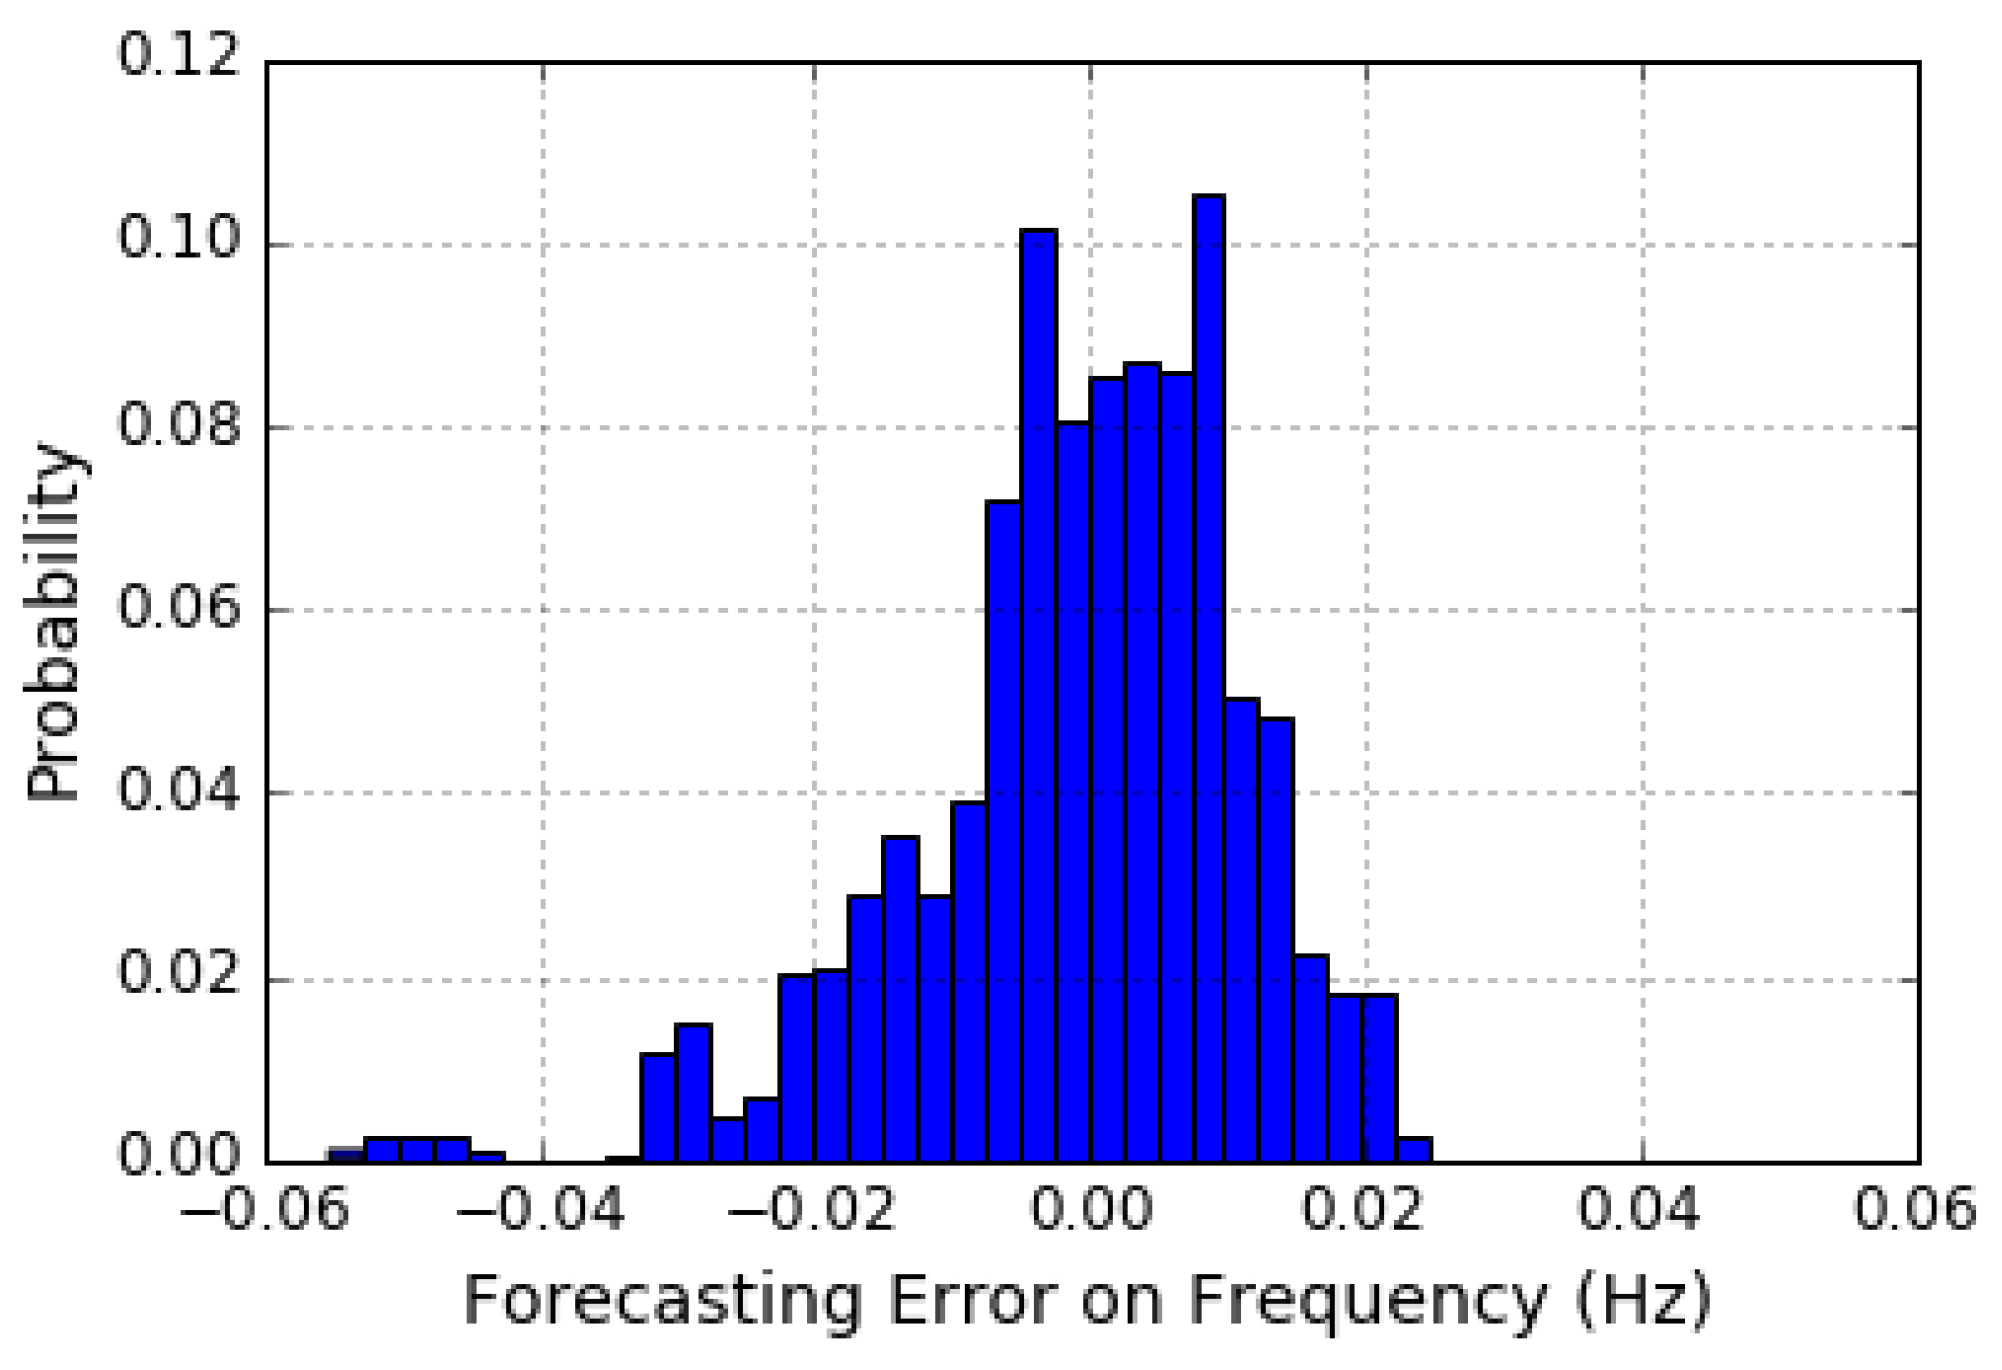
To evaluate the effectiveness of the proposed preventive control methods, the frequency nadir with the application of the BESS, DLC or EDRP method must be forecast accurately as well. For the BESS method, the error distribution of predicted frequency nadir is plotted in Figure 12. The f min , B E S S forecasting errors are distributed between ±0.06 Hz, with 90.84% of the errors in the ±0.02 Hz range.
Using the DLC method, the error distribution of the predicted frequency nadir is plotted in Figure 13. The f min , D L C forecasting errors are distributed between ±0.06 Hz, with 91.07% of the errors in the ±0.02 Hz range.
Lastly, by utilizing the EDRP method, the error distribution of predicted frequency nadir is plotted in Figure 14. The f min , E D R P forecasting errors are distributed between ±0.06 Hz, with 91.02% of the errors in the ± 0.02 . Hz range.
Based on the statistical results, it demonstrates that the developed forecasting modules of f min , k B E S S , k D L C and k E D R P are capable to provide accurate forecasting results.

8. Results of Cost Analysis

An actual SCADA data on November 10 2017 were utilized as a case study for the cost analysis. Table 5 demonstrates the predicted f min without any proposed methods. If the predicted f min is above the predetermined frequency (57.4 Hz), meaning that the system has sufficient frequency stability even under N-1 tripping contingency event. It can be observed that some of the hours the predicted f min are below the predetermined frequency threshold, which indicates possible occurrence of system frequency instability. In that case, then one of the four frequency support methods can be selected to maintain the system frequency stability and then, the corresponding required costs are calculated. The details for calculating the cost by using four frequency support methods are as follows.

8.1. The GR Method

The GR method ensures the adequate frequency stability and minimal operating cost. In this work, the diesel fuel price is 25 NTD/L and starting one diesel unit consumes 80 L of diesel fuel. As a result, the corresponding costs for GR method are presented in Table 6. The difference of diesel fuel costs before and after GR method is negative, meaning that the GR method reduces the diesel fuel cost. The start-up cost is positive, meaning an additional cost is required if start-up of a diesel unit is necessary.

8.2. The BESS Method

The optimal active power output of BESS, P B E S S , o p t , is obtained in Section 4. Then, the corresponding cost by the BESS method is calculated by (9). Table 7 shows the P B E S S , o p t and corresponding costs by the BESS method. The exchange rate is 28.93 NT Dollar to 1 US Dollar herein.

8.3. The EDRP Method

The optimal load reduction of EDRP, P E D R P , o p t , is obtained in Section 4. Then, the corresponding cost by the EDRP method is calculated by (10)–(13). This work assumes that the demand-charge discount is 96 NTD/kW and the energy-charge discount for a 15-min ahead notification EDRP is 10 NTD/kWh; furthermore, the P C S C (MW) equals P E D R P , a v g (MW). Table 8 presents the P E D R P , , o p t and the corresponding costs using the EDRP method.

8.4. The DLC Method

The optimal load shedding of DLC, P D L C , o p t , is obtained in Section 4. However, there is no operating experience concerning the DLC programs in Taiwan; thus, the corresponding cost using the DLC method is not available. This work suggests that the corresponding cost for DLC method is obtained by multiplying P D L C , o p t and an actual DLC contract rate discount. Table 9 presents the P D L C , o p t by the DLC method.

9. Capacity Requirements of the Proposed Preventive Control Strategy

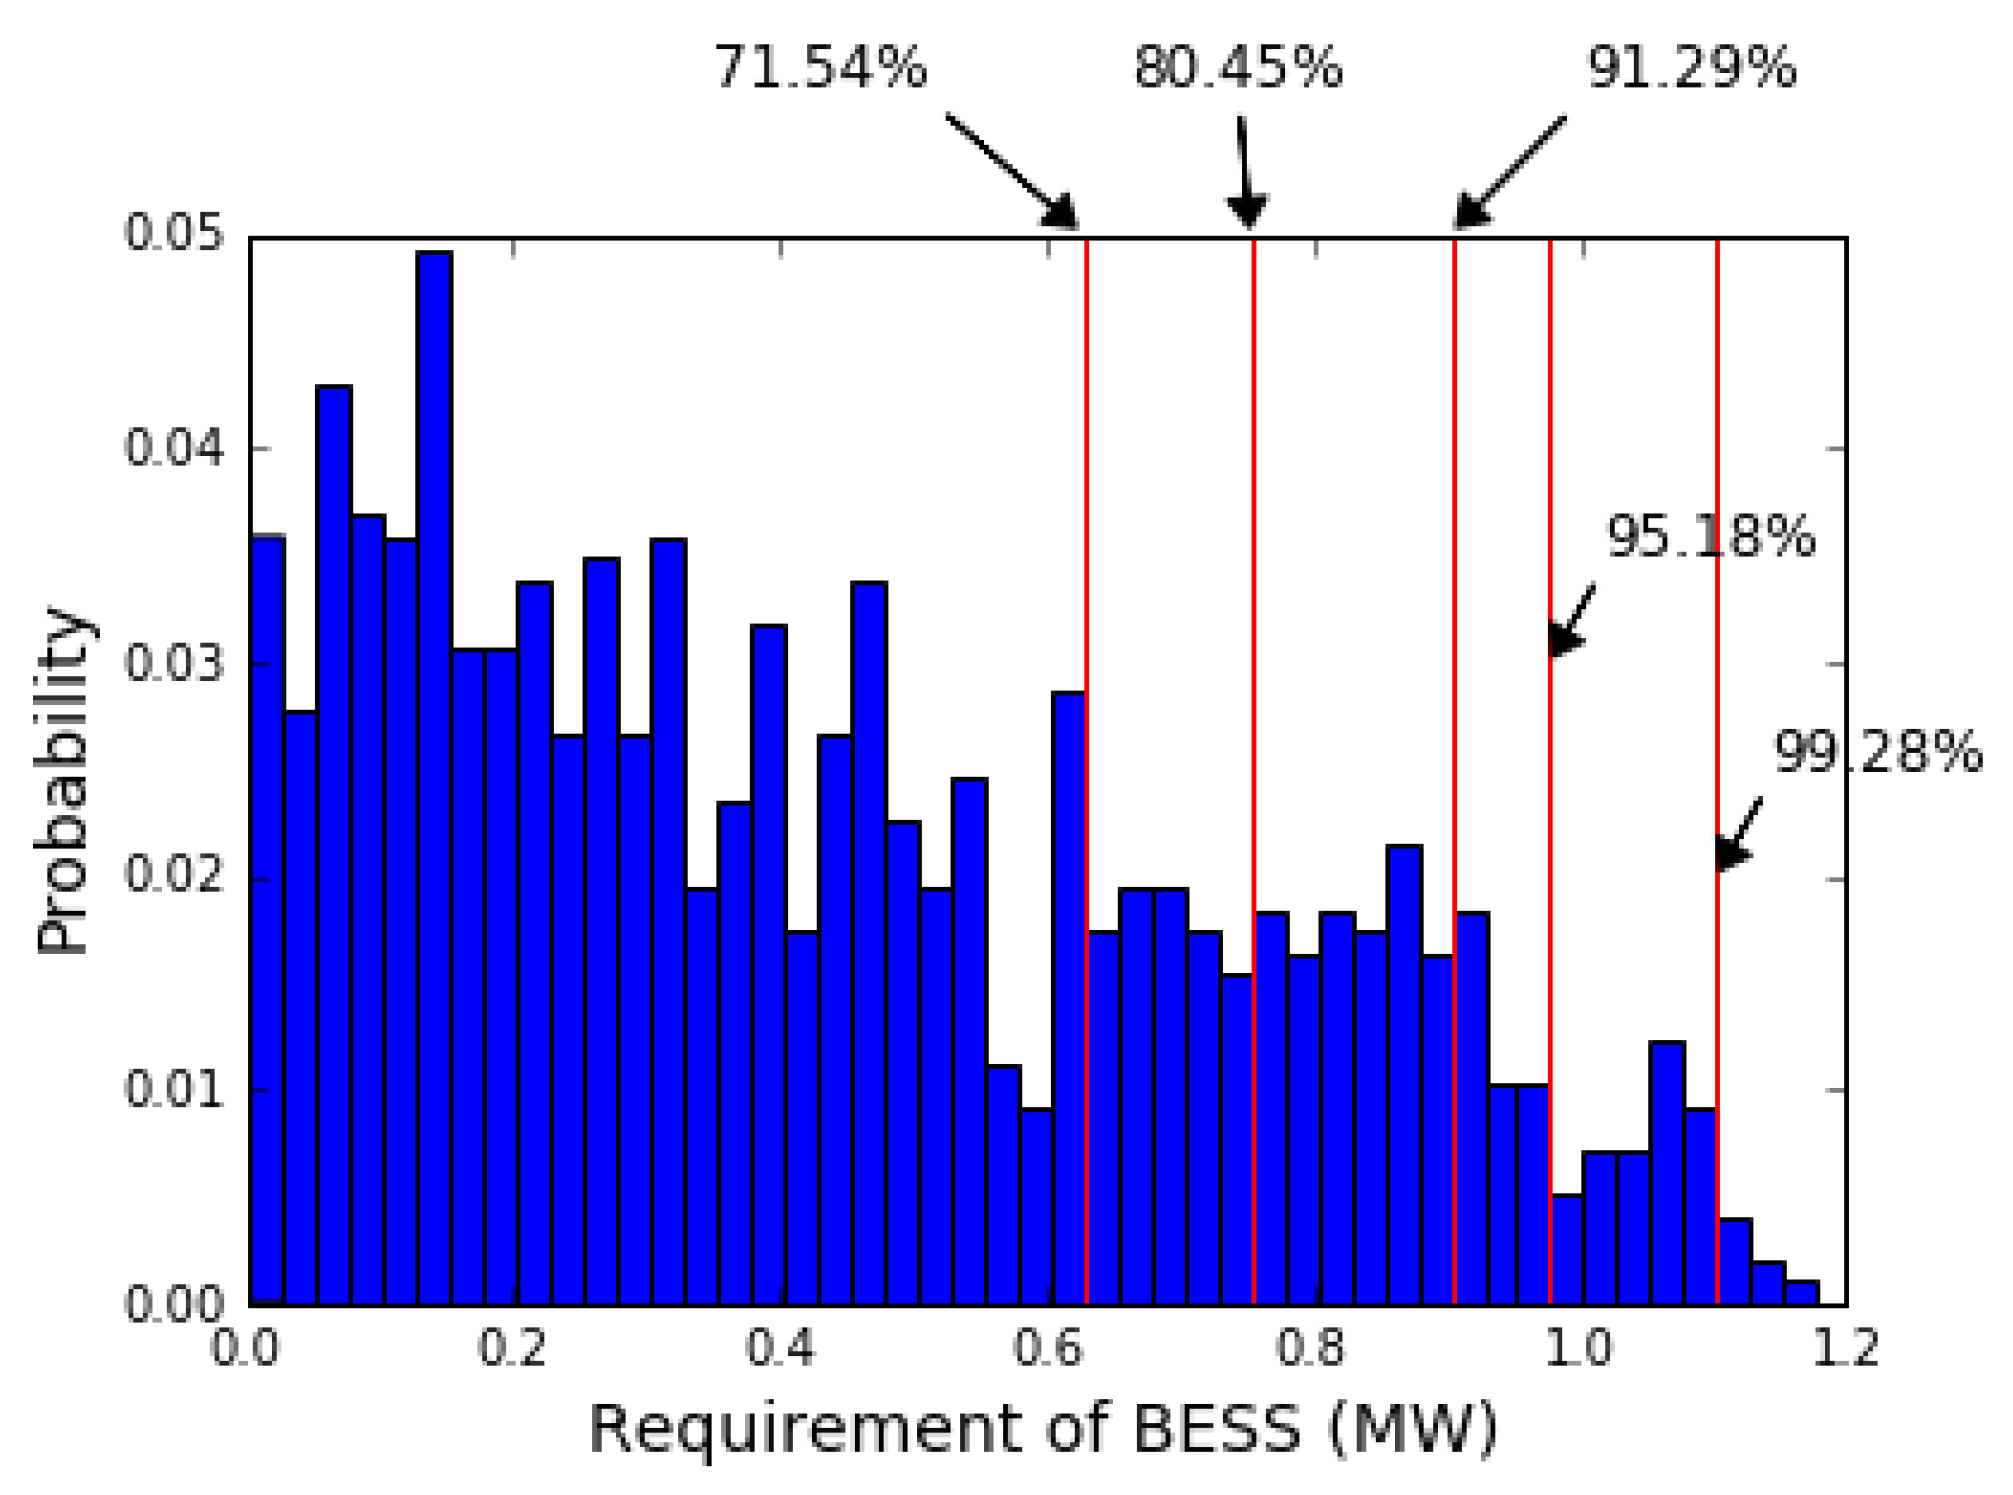
The capacity requirements (MW) using the developed frequency support methods are analyzed based on the historical operating data. If the BESS method is utilized, the probability distribution of the required BESS power output is presented in Figure 15. The confidence level (CL) of the probability distribution is demonstrated in Table 10. For instance, 90% of confidence level requires 0.9031 MW capacity of BESS to ensure sufficient frequency stability under N-1 tripping events.
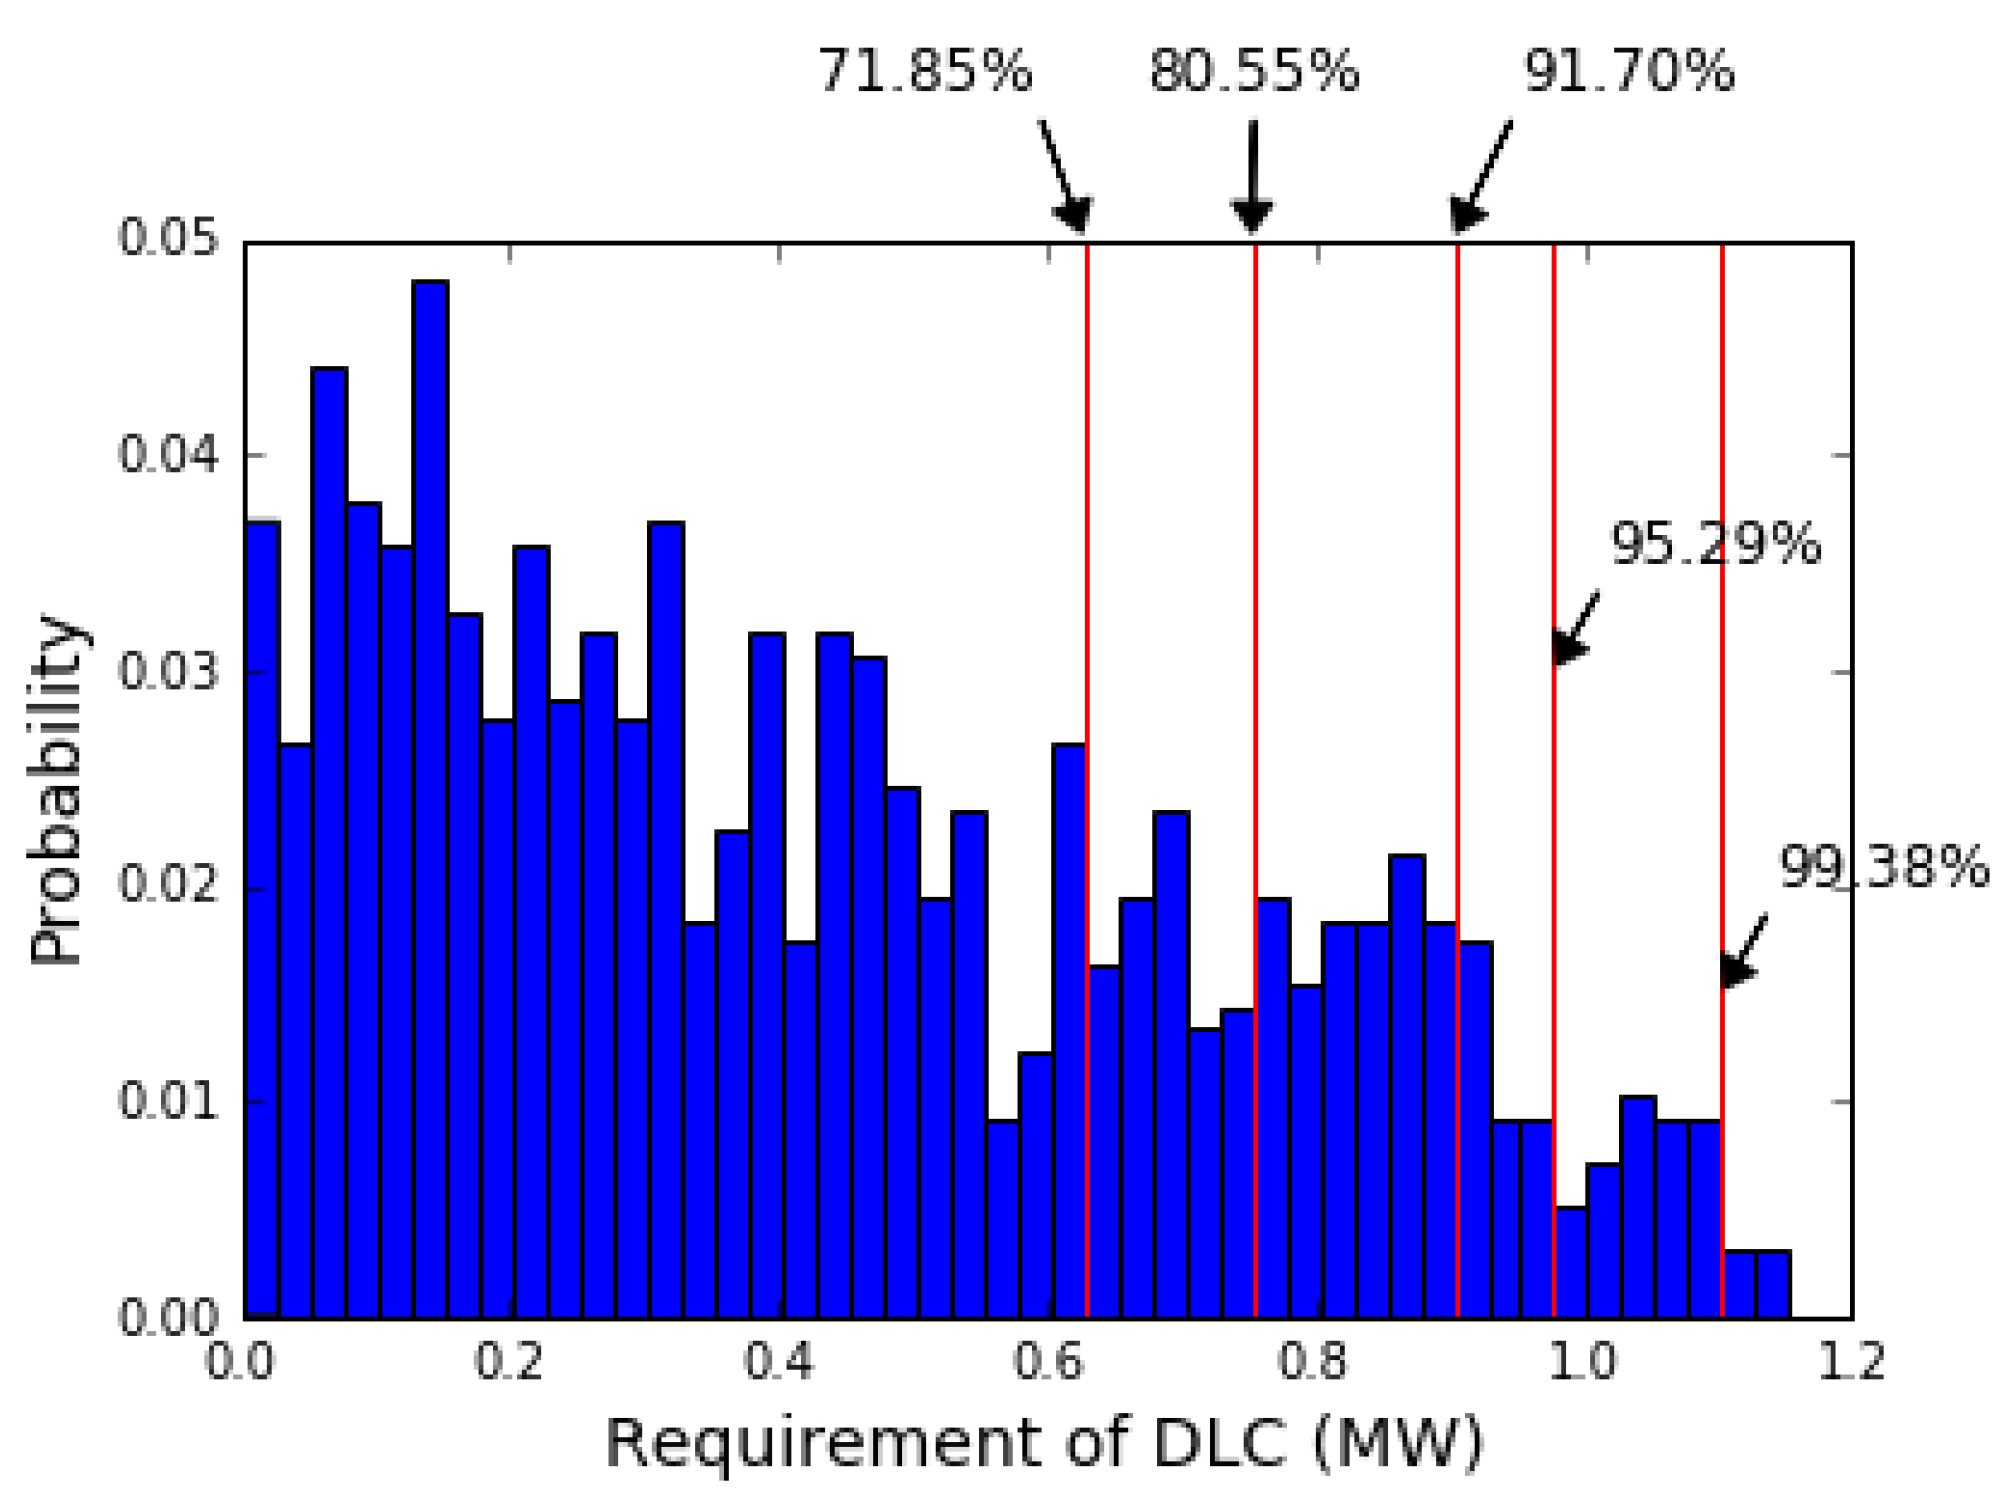
If the DLC method is utilized, the probability distribution of the power requirement of DLC load shedding is presented in Figure 16. The confidence level (CL) of the probability distribution is demonstrated in Table 10. For 90% of confidence level, it requires 0.9031 MW capacity of DLC to ensure sufficient frequency stability under N-1 tripping events.
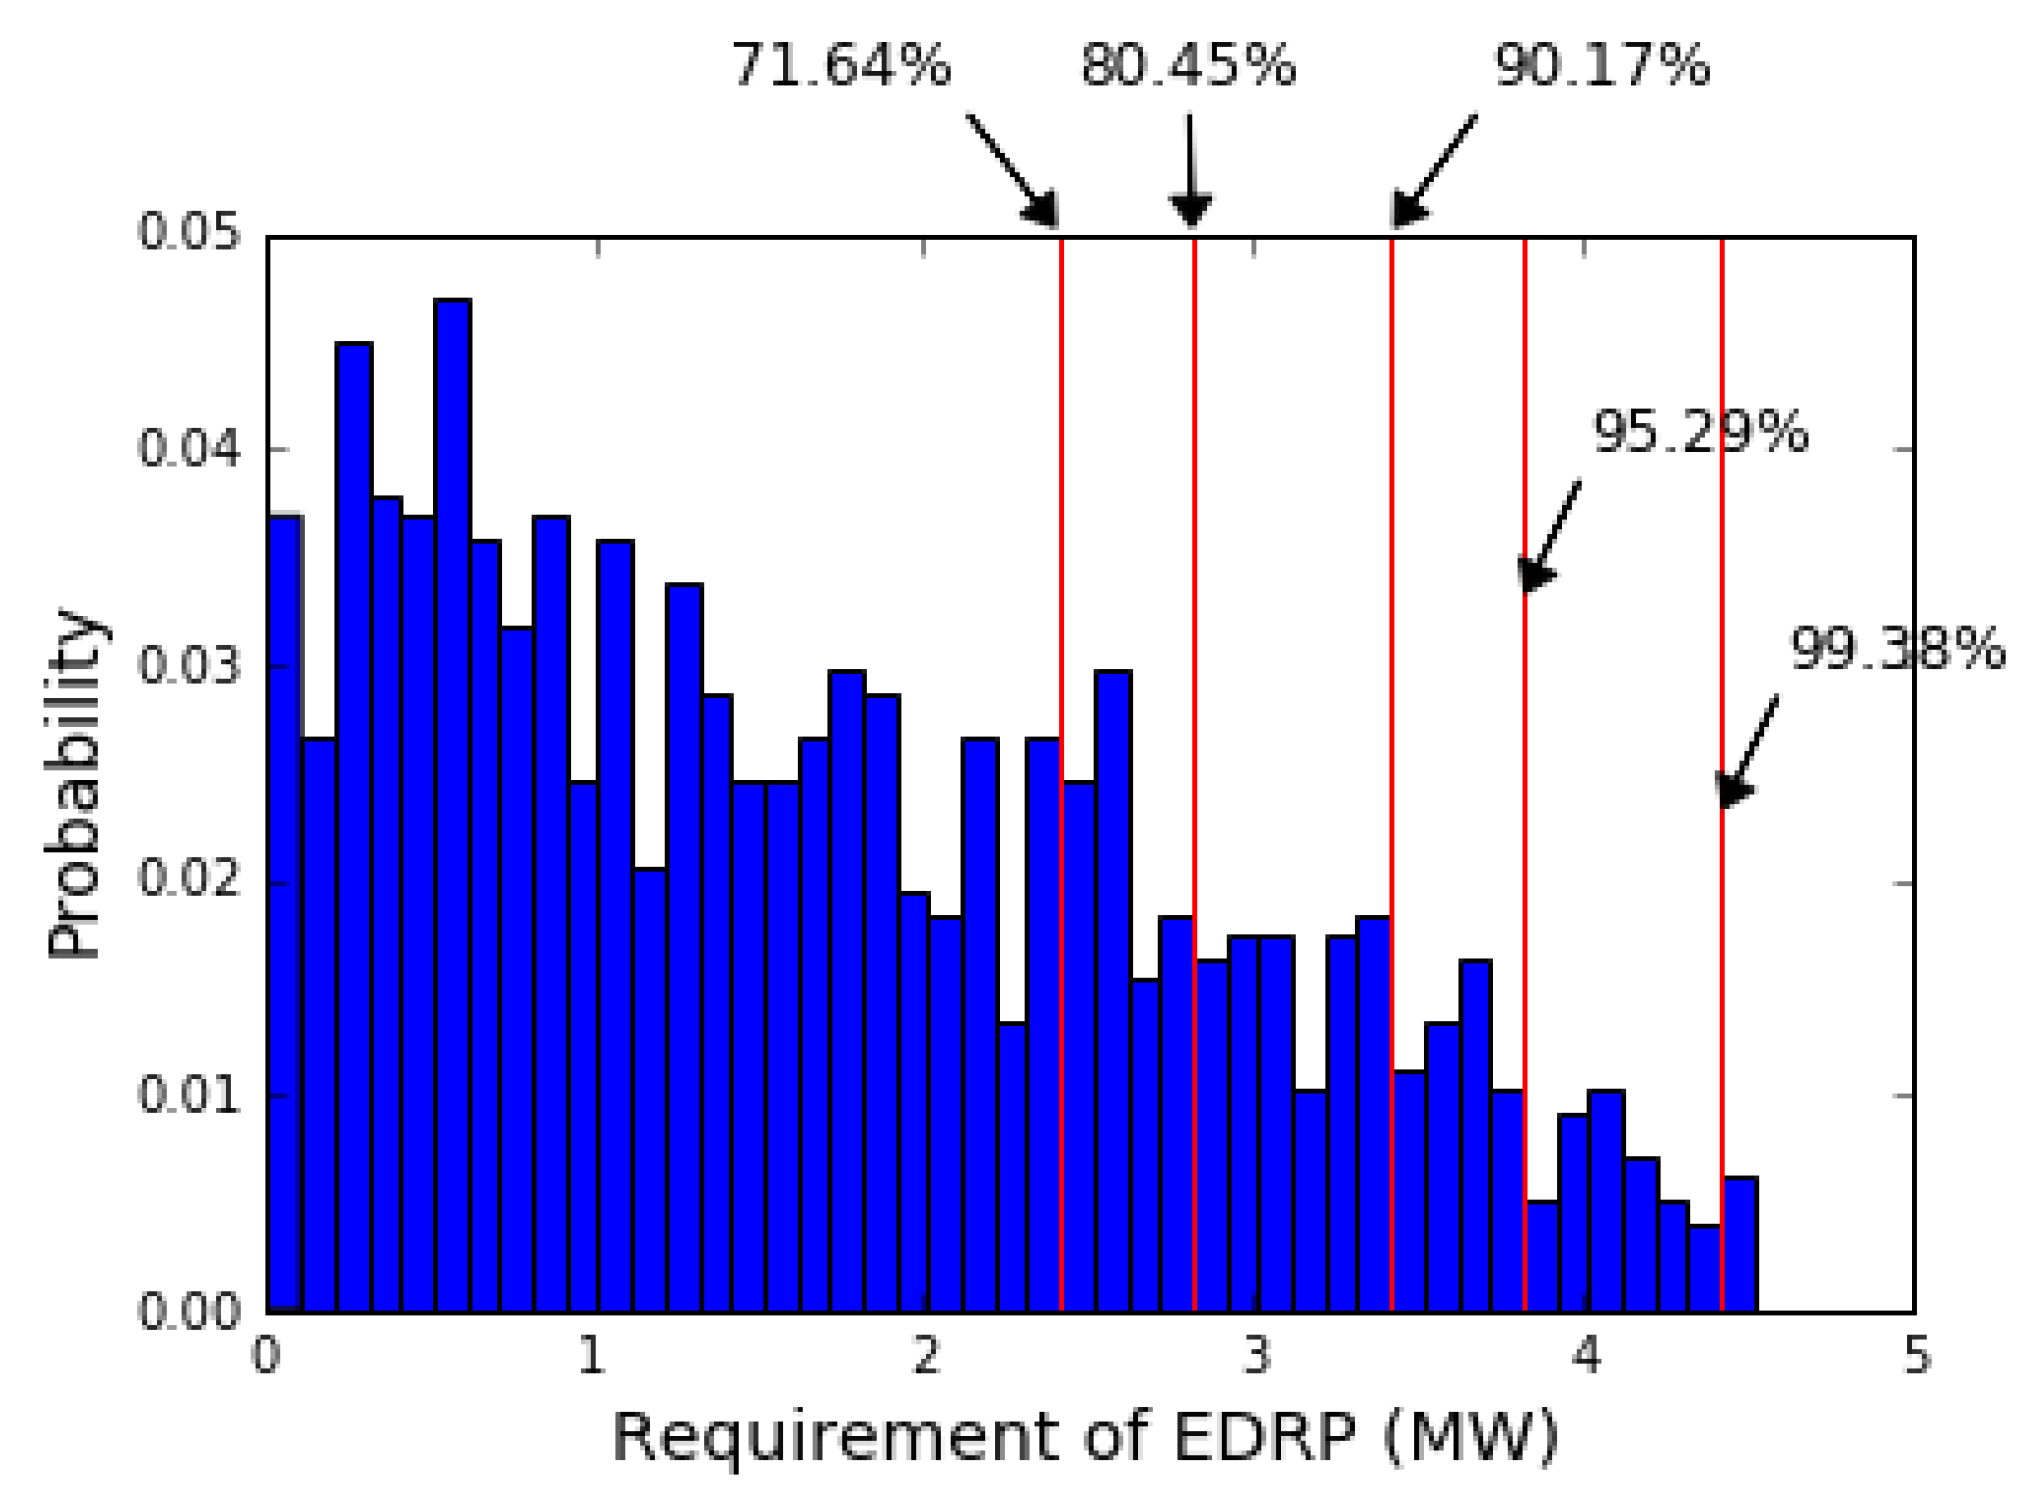
If the EDRP method is utilized, the probability distribution of the power requirement of EDRP load reduction is presented in Figure 17. The confidence level of the probability distribution is demonstrated in Table 10. For 90% of confidence level, it requires 3.4135 MW capacity of EDRP to ensure sufficient frequency stability under N-1 tripping events.

10. Conclusions

Frequency stability is an important issue for islands or micro-grid power systems. In this work, different frequency support methods have been utilized, including GR, the use of BESS, DLC and EDRP. These methods provide the system operators various options for preventive control. To compare the different frequency support methods, the costs for each method are calculated. Finally, this work develops a software platform that integrates the frequency support capability and cost analysis for the preventive methods in an actual power plant, while demonstrating the effectiveness of the proposed methods. The contributions in this work are summarized as follows.
The complete preventive control strategy that ensures sufficient system frequency stability and minimal operating costs has been proposed and the strategies include GR, BESS, DLC and EDRP methods.
The frequency support capability from BESS, DLC and EDRP are proposed and the formulation relationship between frequency nadir and the required amount of BESS, DLC or EDRP is achieved.
The costs for each frequency support method are calculated with appropriate assumptions, providing a clear way to analyze and compare these methods.

Author Contributions

Conceptualization, Y.-K.W. and K.-T.T.; methodology, Y.-K.W. and K.-T.T.; software, K.-T.T.; validation, Y.-K.W., K.-T.T. and W.-S.T.; formal analysis, Y.-K.W. and K.-T.T.; investigation, Y.-K.W. and K.-T.T.; resources, Y.-K.W. and K.-T.T.; data curation, Y.-K.W. and K.-T.T.; writing—original draft preparation, Y.-K.W., K.-T.T. and Z.K.L.; writing—review and editing, Y.-K.W., K.-T.T. and W.-S.T.; supervision, Y.-K.W.; project administration, Y.-K.W.; funding acquisition, Y.-K.W. All authors have read and agreed to the published version of the manuscript.

Funding

This work is financially supported by “This research was funded by the Ministry of Science and Technology (MOST) of Taiwan, grant number 108-3116-F-194 -001- and The APC was funded by the Ministry of Science and Technology (MOST) of Taiwan.

Conflicts of Interest

The authors declare no conflict of interest.

References

  1. Wu, Y.K.; Ye, G.T.; Tang, K.T. Preventive control strategy for an island power system that considers system security and economics. IEEE Trans. Ind. Appl. 2017, 53, 5239–5251. [Google Scholar] [CrossRef]
  2. Wu, Y.-K. Frequency Stability for an Island Power System: Developing an Intelligent Preventive-Corrective Control Mechanism for an Offshore Location. IEEE Ind. Appl. Mag. 2017, 23, 74–87. [Google Scholar] [CrossRef]
  3. Sigrist, L.; Rouco, L.; Echavarren, F.M. A review of the state of the art of UFLS schemes for isolated power systems. Int. J. Electr. Power Energy Syst. 2018, 99, 525–539. [Google Scholar] [CrossRef]
  4. Wu, Y.K.; Tang, K.T. Frequency Support by BESS—Review and Analysis. Energy Procedia 2019, 156, 187–191. [Google Scholar] [CrossRef]
  5. Tan, J.; Zhang, Y. Coordinated Control Strategy of a Battery Energy Storage System to Support a Wind Power Plant Providing Multi-Timescale Frequency Ancillary Services. IEEE Trans. Sustain. Energy 2017, 8, 1140–1153. [Google Scholar] [CrossRef]
  6. Greenwood, D.; Lim, K.; Patsios, C.; Lyons, P.; Lim, Y.; Taylor, P. Frequency response services designed for energy storage. Appl. Energy 2017, 203, 115–127. [Google Scholar] [CrossRef]
  7. Serban, I.; Marinescu, C. Control Strategy of Three-Phase Battery Energy Storage Systems for Frequency Support in Microgrids and with Uninterrupted Supply of Local Loads. IEEE Trans. Power Electron. 2013, 29, 5010–5020. [Google Scholar] [CrossRef]
  8. Wu, Y.-K.; Ye, G.-T.; Chang, L.-T.; Hsieh, T.-Y.; Jan, B.-S. Capacity determination of a dynamic energy storage system in an island power system with high renewable energy penetration. In Proceedings of the 2017 International Conference on Applied System Innovation (ICASI), Sapporo, Japan, 13–17 May 2017; pp. 1698–1701. [Google Scholar]
  9. Wu, Y.K.; Tang, K.T. Frequency support by demand response—Review and analysis. Energy Procedia 2019, 156, 327–331. [Google Scholar] [CrossRef]
  10. Deng, R.; Yang, Z.; Chow, M.-Y.; Chen, J. A Survey on Demand Response in Smart Grids: Mathematical Models and Approaches. IEEE Trans. Ind. Inform. 2015, 11, 1. [Google Scholar] [CrossRef]
  11. Nikzad, M.; Mozafari, B. Reliability assessment of incentive- and priced-based demand response programs in restructured power systems. Int. J. Electr. Power Energy Syst. 2014, 56, 83–96. [Google Scholar] [CrossRef]
  12. Alasseri, R.; Tripathi, A.; Rao, T.J.; Sreekanth, K. A review on implementation strategies for demand side management (DSM) in Kuwait through incentive-based demand response programs. Renew. Sustain. Energy Rev. 2017, 77, 617–635. [Google Scholar] [CrossRef]
  13. Zhang, Q.; Li, J. Demand response in electricity markets: A review. In Proceedings of the 2012 9th International Conference on the European Energy Market, Florence, Italy, 10–12 May 2012; pp. 1–8. [Google Scholar]
  14. Gu, C.; Liu, L.; Zhang, T.; Zheng, Y. Demand response model and impact studies based on bidirectional interactive of information and electrical energy. In Proceedings of the 2012 China International Conference on Electricity Distribution, Shanghai China, 5–6 September 2012; pp. 1–6. [Google Scholar]
  15. Eid, C.; Codani, P.; Perez, Y.; Reneses, J.; Hakvoort, R. Managing electric flexibility from Distributed Energy Resources: A review of incentives for market design. Renew. Sustain. Energy Rev. 2016, 64, 237–247. [Google Scholar] [CrossRef]
  16. Aalami, H.; Yousefi, G.R.; Moghadam, M.P. Demand response model considering EDRP and TOU programs. In Proceedings of the 2008 IEEE/PES Transmission and Distribution Conference and Exposition, Chicago, IL, USA, 21–24 April 2008; pp. 1–6. [Google Scholar]
  17. Rahmani-Andebili, M.; Abdollahi, A.; Moghaddam, M.P. An investigation of implementing Emergency Demand Response Program (EDRP) in Unit Commitment problem. In Proceedings of the IEEE PES General Meeting, Detroit, MI, USA, 24–28 July 2011; pp. 24–29. [Google Scholar]
  18. Lian, B.; Sims, A.; Yu, D.; Wang, C.; Dunn, R.W. Optimizing LiFePO4 Battery Energy Storage Systems for Frequency Response in the UK System. IEEE Trans. Sustain. Energy 2016, 8, 385–394. [Google Scholar] [CrossRef]
  19. Świerczyński, M.; Stroe, D.I.; Stan, A.I.; Teodorescu, R.; Sauer, D.U. Selection and performance degradation modeling of LiMo2/Li4Ti5O12 and LiFePO4/C battery cells as suitable energy storage systems for grid integration with wind power plants: An example for the primary frequency regulation service. IEEE Trans. Sustain. Energy 2014, 5, 90–101. [Google Scholar] [CrossRef]
  20. Chalise, S.; Sternhagen, J.; Hansen, T.M.; Tonkoski, R. Energy management of remote microgrids considering battery lifetime. Electr. J. 2016, 29, 1–10. [Google Scholar] [CrossRef]
  21. Such, M.C. Operation and Control Strategies for Battery Energy Storage Systems to Increase Penetration Levels of Renewable Generation on Remote Microgrids. Master’s Thesis, Sch. of Science in Engineering, The University of Texas at Austin, Austin, TX, USA, 2013. [Google Scholar]
  22. Yeh, C.C.; Chen, C.S.; Ku, T.T.; Lin, C.H.; Hsu, C.T.; Chang, Y.R.; Lee, Y.D. Design of special protective system for an offshore island with high PV penetration. IEEE Trans. Ind. Appl. 2017, 53, 901–907. [Google Scholar] [CrossRef]
  23. Asl, S.A.F.; Gandomkar, M.; Nikoukar, J. Optimal protection coordination in the micro-grid including inverter-based distributed generations and energy storage system with considering grid-connected and islanded modes. Electr. Power Syst. Res. 2020, 184, 106317. [Google Scholar] [CrossRef]
  24. Abazari, A.; Monsef, H.; Wu, B. Coordination strategies of distributed energy resources including FESS, DEG, FC and WTG in load frequency control (LFC) scheme of hybrid isolated micro-grid. Int. J. Electr. Power Energy Syst. 2019, 109, 535–547. [Google Scholar] [CrossRef]
  25. Barra, P.; Coury, D.; Fernandes, R. A survey on adaptive protection of microgrids and distribution systems with distributed generators. Renew. Sustain. Energy Rev. 2020, 118, 109524. [Google Scholar] [CrossRef]
  26. Mohamed, E.; Magdy, G.; Shabib, G.; Elbaset, A.A.; Mitani, Y.; Baset, A.A. Digital coordination strategy of protection and frequency stability for an islanded microgrid. IET Gener. Transm. Distrib. 2018, 12, 3637–3646. [Google Scholar] [CrossRef]
  27. Fathima, A.H.; Palanisamy, K. Battery energy storage applications in wind integrated systems—A review. In Proceedings of the 2014 International Conference on Smart Electric Grid (ISEG), Vaddeswaram, Guntur, 19–20 September 2014; pp. 1–8. [Google Scholar]
  28. Son, D.H.; Nam, S.R.; Karlsson, D. Development of PSS/E dynamic model for controlling battery output to improve frequency stability in power systems. Int. J. Electr. Power 2017, 11, 462–466. [Google Scholar]
  29. Falcão, J.; Castro, R.; De Jesus, J.F. Frequency control during transients in offshore wind parks using battery energy storage systems. J. Mar. Eng. Technol. 2016, 15, 1–12. [Google Scholar] [CrossRef] [Green Version]
  30. Castillo, A.; Gayme, D.F. Grid-scale energy storage applications in renewable energy integration: A survey. Energy Convers. Manag. 2014, 87, 885–894. [Google Scholar] [CrossRef]
  31. Padron, S.; Hernandez, M.; Falcon, A. Reducing under-frequency load shedding in isolated power systems using neural networks. IEEE Trans. Power Syst. 2016, 31, 63–71. [Google Scholar] [CrossRef]
  32. Abdelwahid, S.; Babiker, A.; Eltom, A.; Kobet, G. Hardware Implementation of an Automatic Adaptive Centralized Underfrequency Load Shedding Scheme. IEEE Trans. Power Deliv. 2014, 29, 2664–2673. [Google Scholar] [CrossRef]
  33. Xu, X.; Zhang, H.; Li, C.; Liu, Y.; Li, W.; Terzija, V. Optimization of the event-driven emergency load-shedding considering transient security and stability constraints. IEEE Trans. Power Syst. 2016, 32, 2581–2592. [Google Scholar] [CrossRef]
  34. Wu, Y.-K.; Ye, G.-T.; Hsieh, T.-Y.; Jan, B.-S. Economic dispatch in an offshore island system with high wind power penetration. In Proceedings of the 2016 IEEE PES Asia-Pacific Power and Energy Engineering Conference (APPEEC), Xi’an, China, 25–28 October 2016; pp. 374–378. [Google Scholar]
  35. Rohit, A.K.; Devi, K.P.; Rangnekar, S. An overview of energy storage and its importance in Indian renewable energy sector. J. Energy Storage 2017, 13, 10–23. [Google Scholar] [CrossRef]
  36. Chen, H.; Cong, T.N.; Yang, W.; Tan, C.; Li, Y.; Ding, Y. Progress in electrical energy storage system: A critical review. Prog. Nat. Sci. 2009, 19, 291–312. [Google Scholar] [CrossRef]
  37. May, G.J.; Davidson, A.; Monahov, B. Lead batteries for utility energy storage: A review. J. Energy Storage 2018, 15, 145–157. [Google Scholar] [CrossRef]
  38. Vazquez, S.; Lukic, S.M.; Galvan, E.; Franquelo, L.G.; Carrasco, J.M. Energy Storage Systems for Transport and Grid Applications. IEEE Trans. Ind. Electron. 2010, 57, 3881–3895. [Google Scholar] [CrossRef] [Green Version]
  39. Paterakis, N.G.; Erdinç, O.; Catalao, J.P.S. An overview of Demand Response: Key-elements and international experience. Renew. Sustain. Energy Rev. 2017, 69, 871–891. [Google Scholar] [CrossRef]
  40. Laboratories, K. Comparison of California Investor-Owned-Utility (IOU) Direct Load Control (DLC) Programs; Final Report; KEMA: Arnhem, The Netherlands, 2010. [Google Scholar]
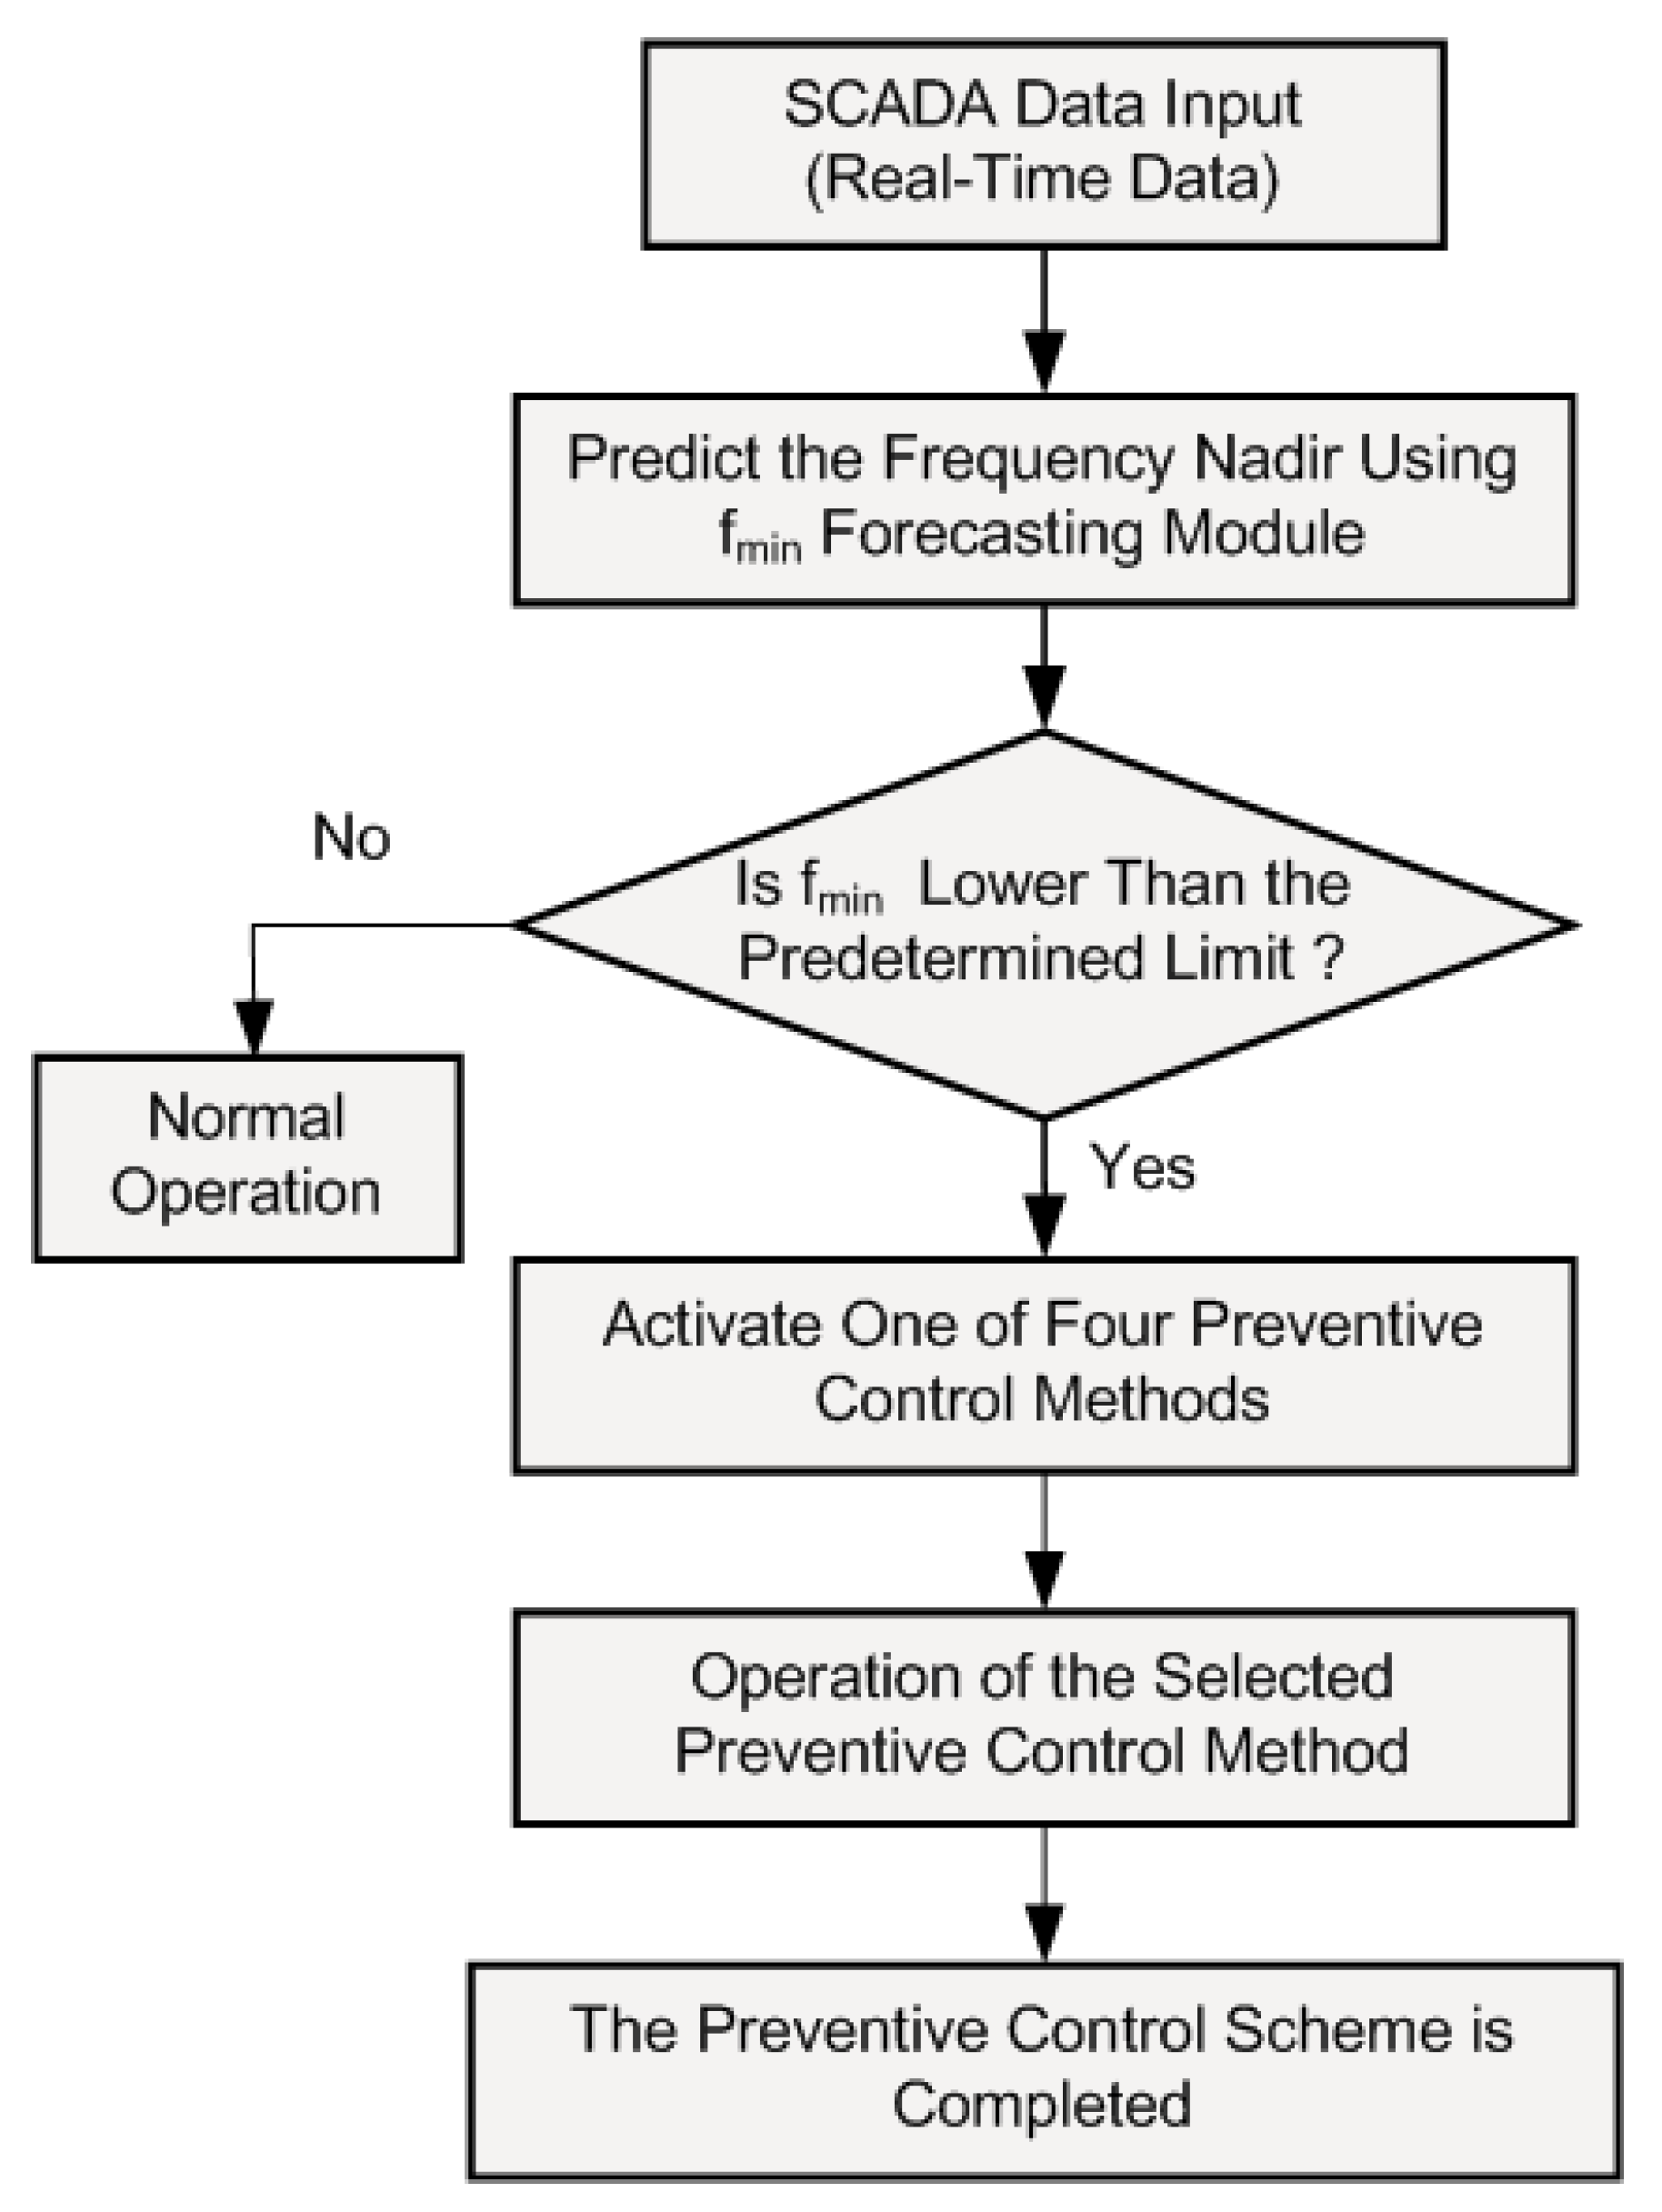
Figure 1. The flowchart of the proposed preventive control strategy including generator rescheduling (GR), battery energy storage system (BESS), direct load control (DLC) and emergency demand response program (EDRP) methods.
Applsci 10 03184 g001
Figure 2. The operation of the GR method.
Applsci 10 03184 g002
Figure 3. The operation of the BESS method.
Applsci 10 03184 g003
Figure 4. The operation of the DLC method.
Applsci 10 03184 g004
Figure 5. The operation of the EDRP method.
Applsci 10 03184 g005
Figure 6. The contingency simulation with/without BESS power support.
Applsci 10 03184 g006
Figure 7. The N-1 contingency simulation with/without DLC load shedding.
Applsci 10 03184 g007
Figure 8. The N-1 contingency simulation with/without EDRP load reduction.
Applsci 10 03184 g008
Figure 9. The frequency nadir and frequency support capability forecasting module using back-propagation artificial neural network (BP-ANN).
Applsci 10 03184 g009
Figure 10. The single line diagram of the power system in Penghu Island.
Applsci 10 03184 g010
Figure 11. Distribution of f min forecasting errors without preventive controls.
Applsci 10 03184 g011
Figure 12. Distribution of f min , B E S S forecasting errors by the BESS method.
Applsci 10 03184 g012
Figure 13. Distribution of f min , D L C forecasting errors by the DLC method.
Applsci 10 03184 g013
Figure 14. Distribution of f min , E D R p forecasting errors by the EDRP method.
Applsci 10 03184 g014
Figure 15. Probability distribution of the required BESS power output.
Applsci 10 03184 g015
Figure 16. Probability distribution of the required DLC load shedding.
Applsci 10 03184 g016
Figure 17. Probability distribution of the required EDRP load reduction.
Applsci 10 03184 g017
Table 1. The frequency support capability of BESS—case study.
BESS Output
(MW)
Frequency Nadir
(Hz)
Frequency Support
(Hz/0.1 MW BESS)
057.1103-
0.157.14710.0368
0.257.18390.0368
0.357.22060.0367
0.457.25740.0368
0.557.29410.0367
0.657.33090.0368
0.757.36760.0367
0.857.40440.0368
0.957.44100.0366
1.057.47790.0369
1.157.51460.0367
1.257.55130.0367
1.357.58800.0367
1.457.62460.0366
1.557.66130.0367
Table 2. The frequency support capability of DLC–case study.
DLC Load Shedding
(MW)
Frequency Nadir
(Hz)
Frequency Support
(Hz/0.1 MW DLC)
057.1103-
0.157.14720.0369
0.257.18410.0369
0.357.22110.0370
0.457.25810.0370
0.557.29500.0369
0.657.33200.0370
0.757.36900.0370
0.857.40600.0370
0.957.44300.0370
1.057.47990.0369
1.157.51690.0370
1.257.55390.0370
1.357.59090.0370
1.457.62790.0370
1.557.66480.0369
Table 3. The frequency support capability of EDRP–case study.
EDRP Load Reduction
(MW)
Frequency Nadir
(Hz)
Frequency Support
(Hz/0.3 MW EDRP)
057.1103-
0.357.13690.0266
0.657.16310.0262
0.957.18960.0265
1.257.21600.0264
1.557.24210.0261
1.857.26850.0264
2.157.29470.0262
2.457.32050.0258
2.757.34670.0262
3.057.37240.0257
3.357.39840.0260
3.657.42430.0259
3.957.44990.0256
4.257.47580.0259
4.557.50150.0257
Table 4. The rate discount provided by the Taiwan Power Company EDRP rule.
NotificationDemand-Charge Discount
(NTD/MW per month)
Energy-Charge Discount
(NTD/MWh)
15-min ahead96,00010,000
30-min ahead86,00010,000
1-h ahead78,00010,000
2-h ahead72,00010,000
Table 5. The predicted frequency nadir without the proposed methods.
Time f min   ( Hz ) Time f min   ( Hz )
00:0057.557012:0057.5340
01:0057.721213:0057.3750
02:0057.715214:0057.1687
03:0057.743815:0058.4231
04:0057.770716:0058.3611
05:0057.867017:0058.3210
06:0058.005118:0058.2368
07:0057.636119:0058.2798
08:0057.303120:0058.1963
09:0057.015221:0058.0321
10:0057.314822:0057.5174
11:0057.40423:0057.9393
Table 6. The cost analysis of the GR methods.
TimeConsumed Fuel
(Before)
(L/Hour)
Consumed Fuel
(After)
(L/Hour)
Change of Fuel Cost (NTD/Hour)Start-Up Cost
(NTD)
08:0078877869−4500
09:0086338412−55252000
10:0081928123−17252000
13:0078927878−3500
14:0083308095−58752000
Table 7. The cost analysis and required capacity of the BESS methods.
Time P B E S S , o p t ( MW ) Battery Cycle Cost
(NT$ per cycle)
08:000.62810.6281
09:000.75310.7531
10:000.90310.9031
13:000.97810.9781
14:001.10311.1031
Table 8. The cost analysis and required capacity of the EDRP methods.
Time P E D R P , o p t ( MW ) Demand Charge Discount (NT$ per month)Energy Charge Discount
(NT$/Hour)
08:001.1476110,16911,476
09:004.5629438,03845,629
10:001.0614101,89410,614
13:000.304929,2703049
14:002.7579264,75827,579
Table 9. The cost analysis and required capacity of the DLC methods.
Time P D L C , o p t ( MW )
08:000.2812
09:001.1157
10:000.2466
13:000.0716
14:000.6625
Table 10. The comparison of capacity requirement.
Confidence LEVEL (%)Required BESS
(MW)
Required DLC
(MW)
Required EDRP
(MW)
70–720.62810.62812.4135
80–810.75310.75312.8135
90–920.90310.90313.4135
95–960.97810.97813.8135
99–99.51.10311.10314.4135