Article

A Space Inertial Sensor Ground Evaluation System for Non-Sensitive Axis Based on Torsion Pendulum

1
Changchun Institute of Optics, Fine Mechanics and Physics, Chinese Academy of Sciences, Changchun 130011, China
2
University of Chinese Academy of Sciences, Beijing 100049, China
3
School of Mechanical and Aerospace Engineering, Jilin University, Changchun 130033, China
*
Authors to whom correspondence should be addressed.
Appl. Sci. 2020, 10(9), 3090; https://doi.org/10.3390/app10093090
Submission received: 18 March 2020 / Revised: 21 April 2020 / Accepted: 26 April 2020 / Published: 29 April 2020
(This article belongs to the Special Issue Experimental Mechanics, Instrumentation and Metrology)

Abstract

:
The inertial sensor is the key measurement payload of the technology verification satellite of China’s space gravitational wave detection mission-Taiji Project, which uses capacitive sensors to sense the acceleration disturbance of the test mass under the influence of non-conservative forces in the frequency range of 10 mHz~1 Hz. It is necessary to perform a ground performance evaluation and estimate the working state of the payload in orbit. However, due to the influence of the earth’s gravity and seismic noise, it is impossible to directly evaluate the resolution level of the non-sensitive axis when testing with high-voltage levitation, which leads to incomplete evaluation of the performance of the inertial sensor. In order to implement this part of the test, the sensitive structure is designed and a torsion pendulum facility for performance testing is developed. The experimental results show that the measurement resolution of the non-sensitive axis of the inertial sensor can reach 9.5 × 10⁻⁷ m/s2/Hz1/2 under the existing ground environmental conditions and is mainly influenced by the seismic noise during the system measurement. If the inertial sensor enters orbit, the measurement resolution can achieve 3.96 × 10⁻⁹ m/s2/Hz1/2, which meets the requirements of the technology verification satellite for a non-sensitive axis. This proposed system also provides a reasonable method for the comprehensive evaluation of inertial sensors in the future.

1. Introduction

In September 2015, the United States LIGO detector [1] for the first time directly detected gravitational wave signals and confirmed Einstein’s prediction about the existence of gravitational waves 100 years ago. The detection of ground gravitational waves is affected by the gravity and the size of the earth, and only mid-high-frequency signals above 10 Hz can be detected. Due to the existence of low-frequency gravitational wave radiation sources in space [2], space gravitational wave detection has become the next scientific hotspot for gravitational wave detection. In order to contribute to space gravitational wave detection, the Chinese Academy of Sciences started a space gravitational wave detection mission—Taiji Project [3,4,5,6,7]—in 2016. The plan will be implemented in three stages. The 1st phase was to launch a technology verification satellite, which was successfully launched on 31 August 2019 [8]. One of the main tasks of the satellite is to verify the inertial sensing technology. Eventually, three space gravitational-wave detectors are expected to be launched around 2030 to detect gravitational waves in the frequency range of 0.1 mHz to 1 Hz.
A high-precision space inertial sensor (IS, also known as gravitational reference sensor) [9] is an important device and key measurement equipment for the Taiji technology verification satellite. Based on capacitive displacement sensing and electrostatic force feedback control technology, the IS is highly sensitive to slow and weak external acceleration such as the radiation pressure from the Sun or Earth, or atmospheric drag [10], and can achieve multiple degrees of freedom and high-resolution results [11]. Therefore, it is widely applied to gravitational wave detection [12], the Earth’s gravity field measurement [13], equivalent principle verification [14], spacecraft drag-free [15], and other space science applications. European and American countries have successfully launched scientific satellites such as CHAMP, GRACE, GP-B, GOCE, GRACE Follow-on, MICROSCOPE, and LISA Pathfinder [16,17,18,19,20,21,22]. The measurement resolution of these inertial sensors reached 10−9~10−14 m/s2/Hz1/2.
In order to overcome the effects of gravity and seismic noise on the ground, some special methods such as high-voltage levitation [23], suspension wire torsion pendulum measurement [24], and drop tower test [25] are employed to evaluate and test the performance of IS. Based on the LISA Project, the University of Trento in Italy [26] and the University of Florida [27] in the United States designed a torsion pendulum system for various noise tests with a resolution of 10−11 m/s2/Hz1/2. Huazhong University of Science and Technology in China used the high-voltage levitation technique and the torsion pendulum system to research the IS [28,29]. The measurement resolution using the high-voltage levitation is 4 × 10⁻⁸ m/s2/Hz1/2, and the displacement resolution using the torsion pendulum can reach the order of magnitude of 10−11 m/Hz1/2. Furthermore, they performed the on-orbit functional verification in 2013 [30]. The Lanzhou Institute of Space Physics developed an engineering prototype and conducted high-voltage levitation experiments in an underground laboratory [31,32]. The ground evaluated resolution of the IS can achieve 2 × 10⁻⁷ m/s2/Hz1/2. Based on years of MEMS experience, Tsinghua University has also carried out a lot of research work on electronic control systems and developed a high-voltage levitation based prototype with a resolution of 4.21 × 10⁻⁷ m/s2/Hz1/2 [33,34,35].
Because many technical requirements of the Taiji Project are difficult to assess with existing technology, it is necessary to carry out the key technology research and verification step by step. In order to complete the ground evaluation requirements of IS for the Taiji technology verification satellite, a type of sensitive structure used in the experiment is designed and a dedicated torsion pendulum measurement system is developed to complement the high-voltage levitation test and comprehensively evaluate the IS. In the direction of the measurement axis, the resolution of the current system can reach 9.5 × 10⁻⁷ m/s2/Hz1/2. In addition, it is found that the main factor limiting the system resolution on the ground is the seismic noise, which points out the direction for further system performance upgrades to meet the future evaluation requirements of the Taiji project [35].
The research contents of this paper are as follows: The second section briefly introduces the principles of the space IS measurement and electrostatic force control. A multi-degree-of-freedom electrode division is also achieved. Section 3 describes the detailed design of the sensitive structure, front-end electronics, and torsion pendulum ground measurement system. In Section 4, the designed system is used to measure and evaluate the control quality and accelerometer resolution of the test mass (TM) in the non-sensitive axis direction, and the experimental results are analyzed and discussed. Finally, a comprehensive summary of the work in this paper is concluded, and the future upgrade work is expected.

2. Sensing and Actuation Principle

IS is a closed-loop sensor, which consists of a sensitive structure and a front-end electronics unit (FEE). During the ground performance testing, a vacuum maintenance system is also required. The sensitive structure converts the acceleration signal from the input to a differential capacitance displacement measurement signal to the output. The FEE is mainly used to detect the differential capacitance signal from the sensor and output the corresponding servo feedback voltage signal to the capacitors to keep the TM in the center of the electrode housing (EH). The measurement and control circuit is composed of a capacitance displacement detection circuit, a PID (Proportional, Integral, Differential) servo feedback control circuit, a driving circuit, and a scientific data acquisition circuit. The vacuum maintenance system is designed to reduce the effects of gas damping during ground testing. The composition of the IS system is shown in Figure 1.

2.1. Differential Capacitance Sensing

Capacitance displacement sensing is a technology that detects small displacements by monitoring the capacitance changes in a variable-gap parallel-plate capacitor. The basic structures are shown in Figure 2.
In the initial state [36], as shown in Figure 2a, the capacitance value C0 is:
C 0 = ε 0 ε r A d 0
where d 0 is the initial distance between the TM and the electrode, A is the area of the electrode, ε r is the relative permittivity which is identical to 1 in vacuum conditions, and ε 0 is the vacuum permittivity. When the TM moves, the gaps between the TM and the electrode will change, which causes the capacitance of the parallel-plate capacitor to vary.
If the displacement is small enough, the relationship between the displacement and the capacitance change can be written as:
C C 0 d d 0
In order to further improve the sensitivity of the measurement, a differential capacitive design (Figure 2c) is applied, in which the upper and lower electrodes are fixed, whereas the TM is movable.
After using the same method as above, the relationship between the displacement and the capacitance change is:
C C 0 2 d d 0

2.2. Electrode Configuration

The sensitive structure is the key hardware in an IS system, which consists of an EH and a TM. The EH is a closed cavity, the TM is placed in the center of the EH to form pairs of differential capacitors. In order to simultaneously measure and control the TM with multiple degrees of freedom, the differential capacitor pairs must have a reasonable electrode division and configuration. In a traditional division method [37], sets of differential capacitors are arranged along the three orthogonal axes, and each axis controls one translational freedom degree and one rotational freedom degree, as shown in Figure 3a. Therefore, six degrees of freedom control is achieved. Referring to the accelerometer of the GOCE satellite [38], the electrodes around the TM under study in this paper are separated, as shown in Figure 3b. Unlike the traditional division, there are three, one, and two electrode pairs along the axes-X, Y, and Z, controlling the corresponding number of degrees of freedom respectively. Since the X direction of the TM is the suspension direction of the ground high-voltage levitation experiment, the instability of the high-voltage signal will lead to a relatively low measurement resolution, so X is defined as the non-sensitive axis, while the other two axes are defined as the sensitive axis.

2.3. Electrostatic Actuation

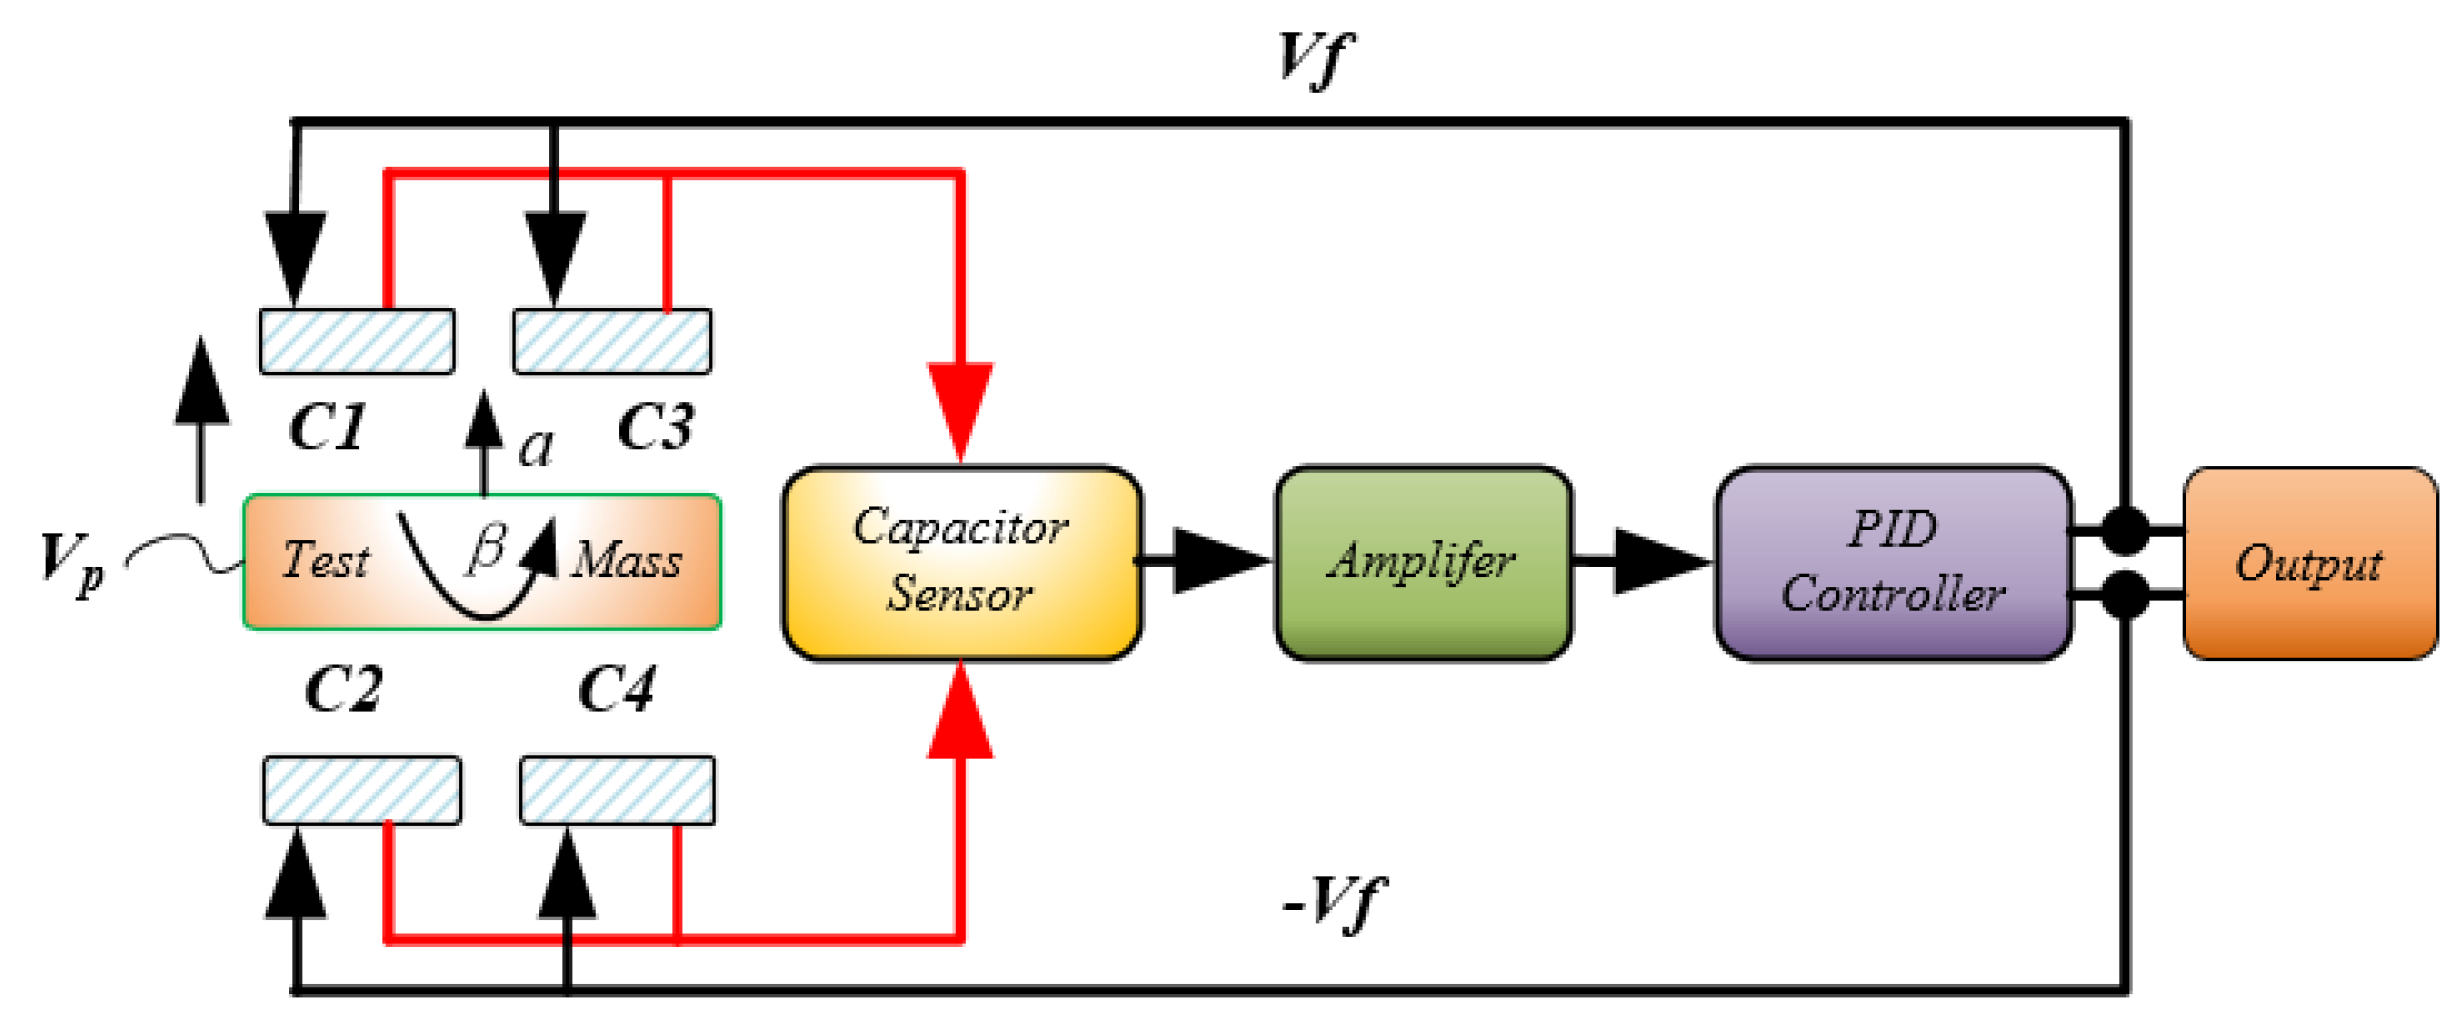
According to the electrode division, corresponding differential capacitance pairs are formed in three axes between the TM and the EH. If a non-conservative force is imposed on the TM and compels it to deviate from the center position, the capacitance sensor will generate a voltage signal caused by the change in the differential capacitance. The voltage signal will be amplified by a signal amplifier and sent to the PID controller for closed-loop feedback control. A feedback voltage from the controller is loaded on the corresponding electrode plate to generate a feedback electrostatic force between the TM and the electrode to balance the non-conservative force. Therefore, the magnitude and direction of the output feedback voltage can characterize the magnitude and direction of the non-conservative force applied to the TM. Figure 4 exhibits the basic flow diagram of the position measurement and control of the TM.
In Figure 4, V p is the preload driving voltage of the electrostatic force, a is the linear acceleration of the TM relative to the EH, α is the angular acceleration of the TM relative to the EH, and V f is the feedback control voltage.
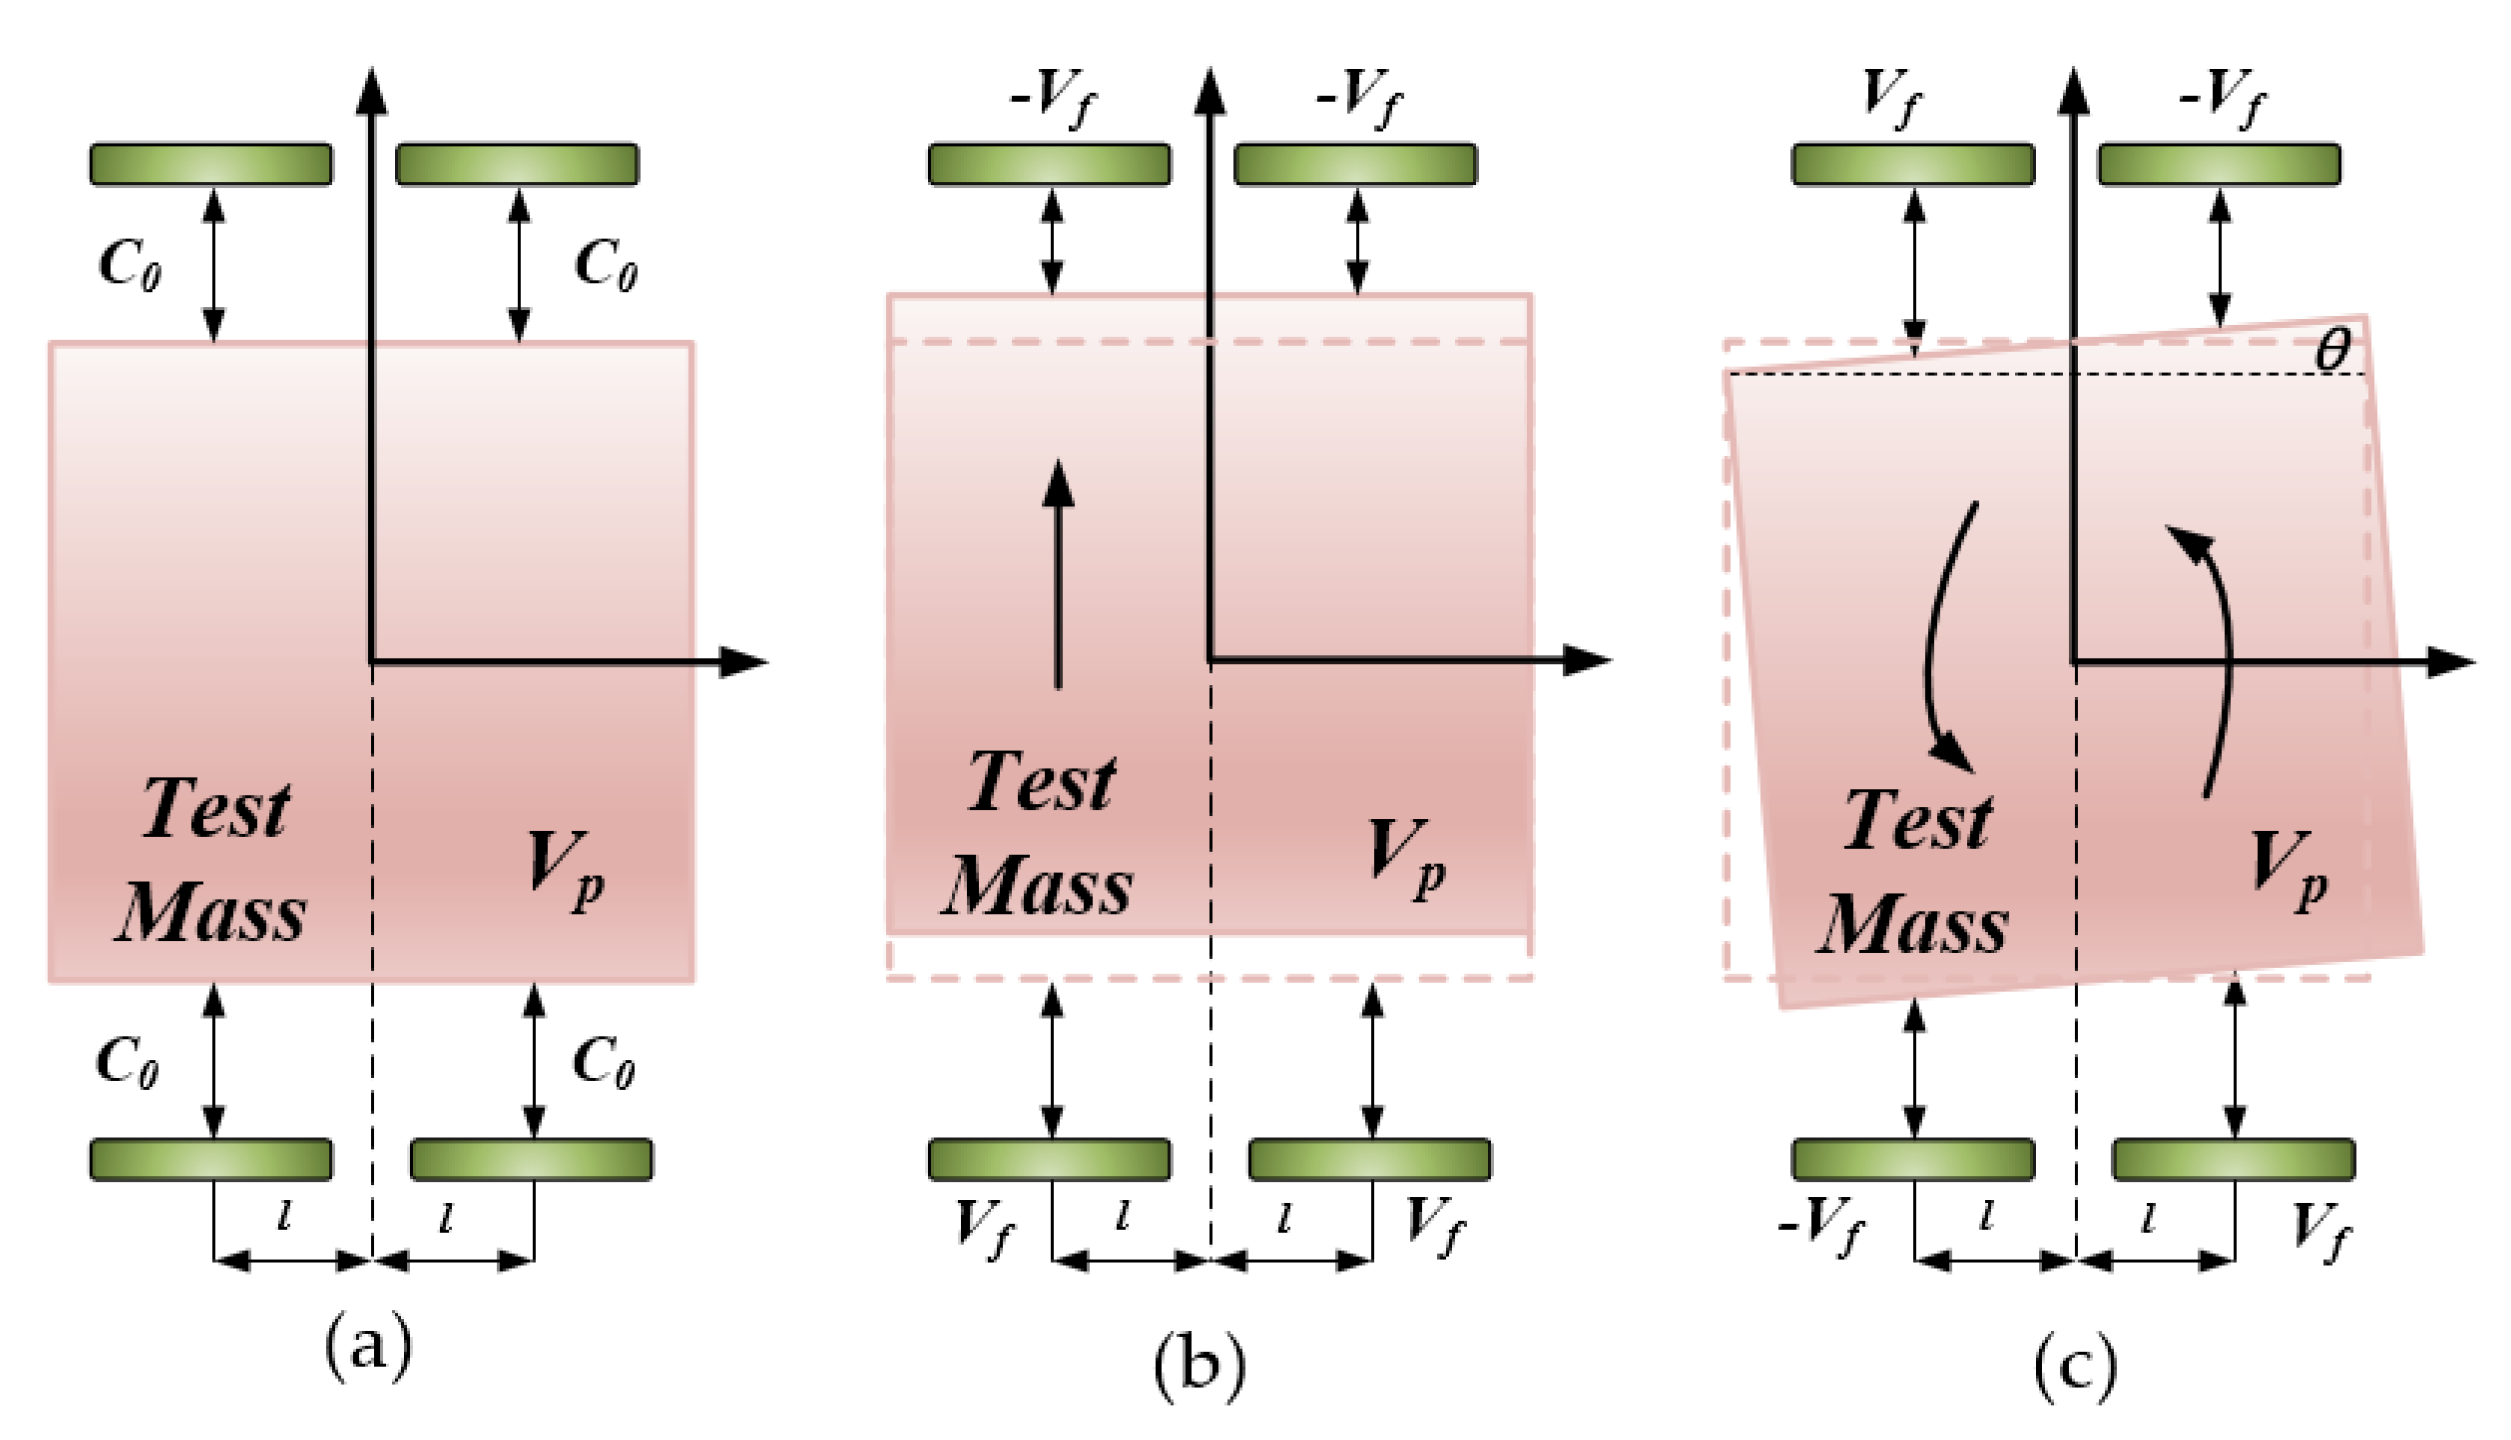
Figure 5a shows the initial state of electrostatic loading, in order to explain the motion state more clearly, some local details have been enlarged. The distance between the TM and the electrode is usually much smaller than the side length of the TM. Therefore, the edge effect can be ignored. The electrostatic force of a parallel plate capacitor can be expressed as [39]:
F = 1 2 ε 0 ε r A ( V p d 0 ) 2
For a translational control process, the load control method (single channel) of IS is shown in Figure 5b. When the TM has a displacement x relative to the center position, the electrostatic forces from the upper electrode plate F 1 and the lower electrode plate F 2 are applied to the TM. The resultant of the electrostatic forces can be written as:
F = F 1 F 2 = ma = 2 ε 0 ε r A V p V f x 2 ( V p 2 + V f 2 ) d 0 x + V p V f d 0 2 ( d 0 2 x 2 ) 2
where the higher order terms are ignored, m is the mass of the TM, and a is the acceleration. In the closed-loop state, the resultant of electrostatic forces and the external force on the TM are balanced.
When x is close to zero, the acceleration can be expressed as:
a = 2 ε 0 ε r AV p md 0 2 V f
Equation (6) shows that the input acceleration is proportional to the feedback voltage. The coefficient of V f is the system acceleration gain.
Similarly, for a rotation control process, when the TM rotates an angle of θ relative to the EH (Figure 5c), according to the principle of torque balance, we can get:
α = 2 ε 0 ε r AlV p Jd 0 2 V f
where l is the horizontal distance from the electrode center to the center of the TM, and J is the moment of inertia of the TM relative to the axis of rotation.
The measurement and control of the six-degrees-of-freedom motion position of the TM are usually implemented through the channel control. This means that during the translation control, the same feedback voltages will be applied to two adjacent electrodes, and the corresponding inverse feedback voltage, whereas during the rotation control, feedback voltages with the equal magnitude and opposite signs will be enforced to two adjacent electrodes. The magnitude and direction of the feedback voltage describe the characterization of the acceleration of TM under the influence of external non-conservative forces.

3. System Design

In order to reasonably evaluate the operating status of the IS after it enters the orbit, the performance of the IS needs to be comprehensively tested on the ground. A traditional high-voltage levitation system has been designed and built, and corresponding experiments were performed on the IS of the Taiji verification technology satellite. In the experiments, because the X-plane needs to undertake the suspension high voltage, it is impossible to accurately measure the performance index in the direction of the non-sensitive axis (X-axis as shown in Figure 3). The resolution in this direction can only be estimated by evaluation. Therefore, we design a torsion pendulum facility to evaluate the non-sensitive axis noise of IS to complete the evaluation of the system.

3.1. Sensitive Structure Design

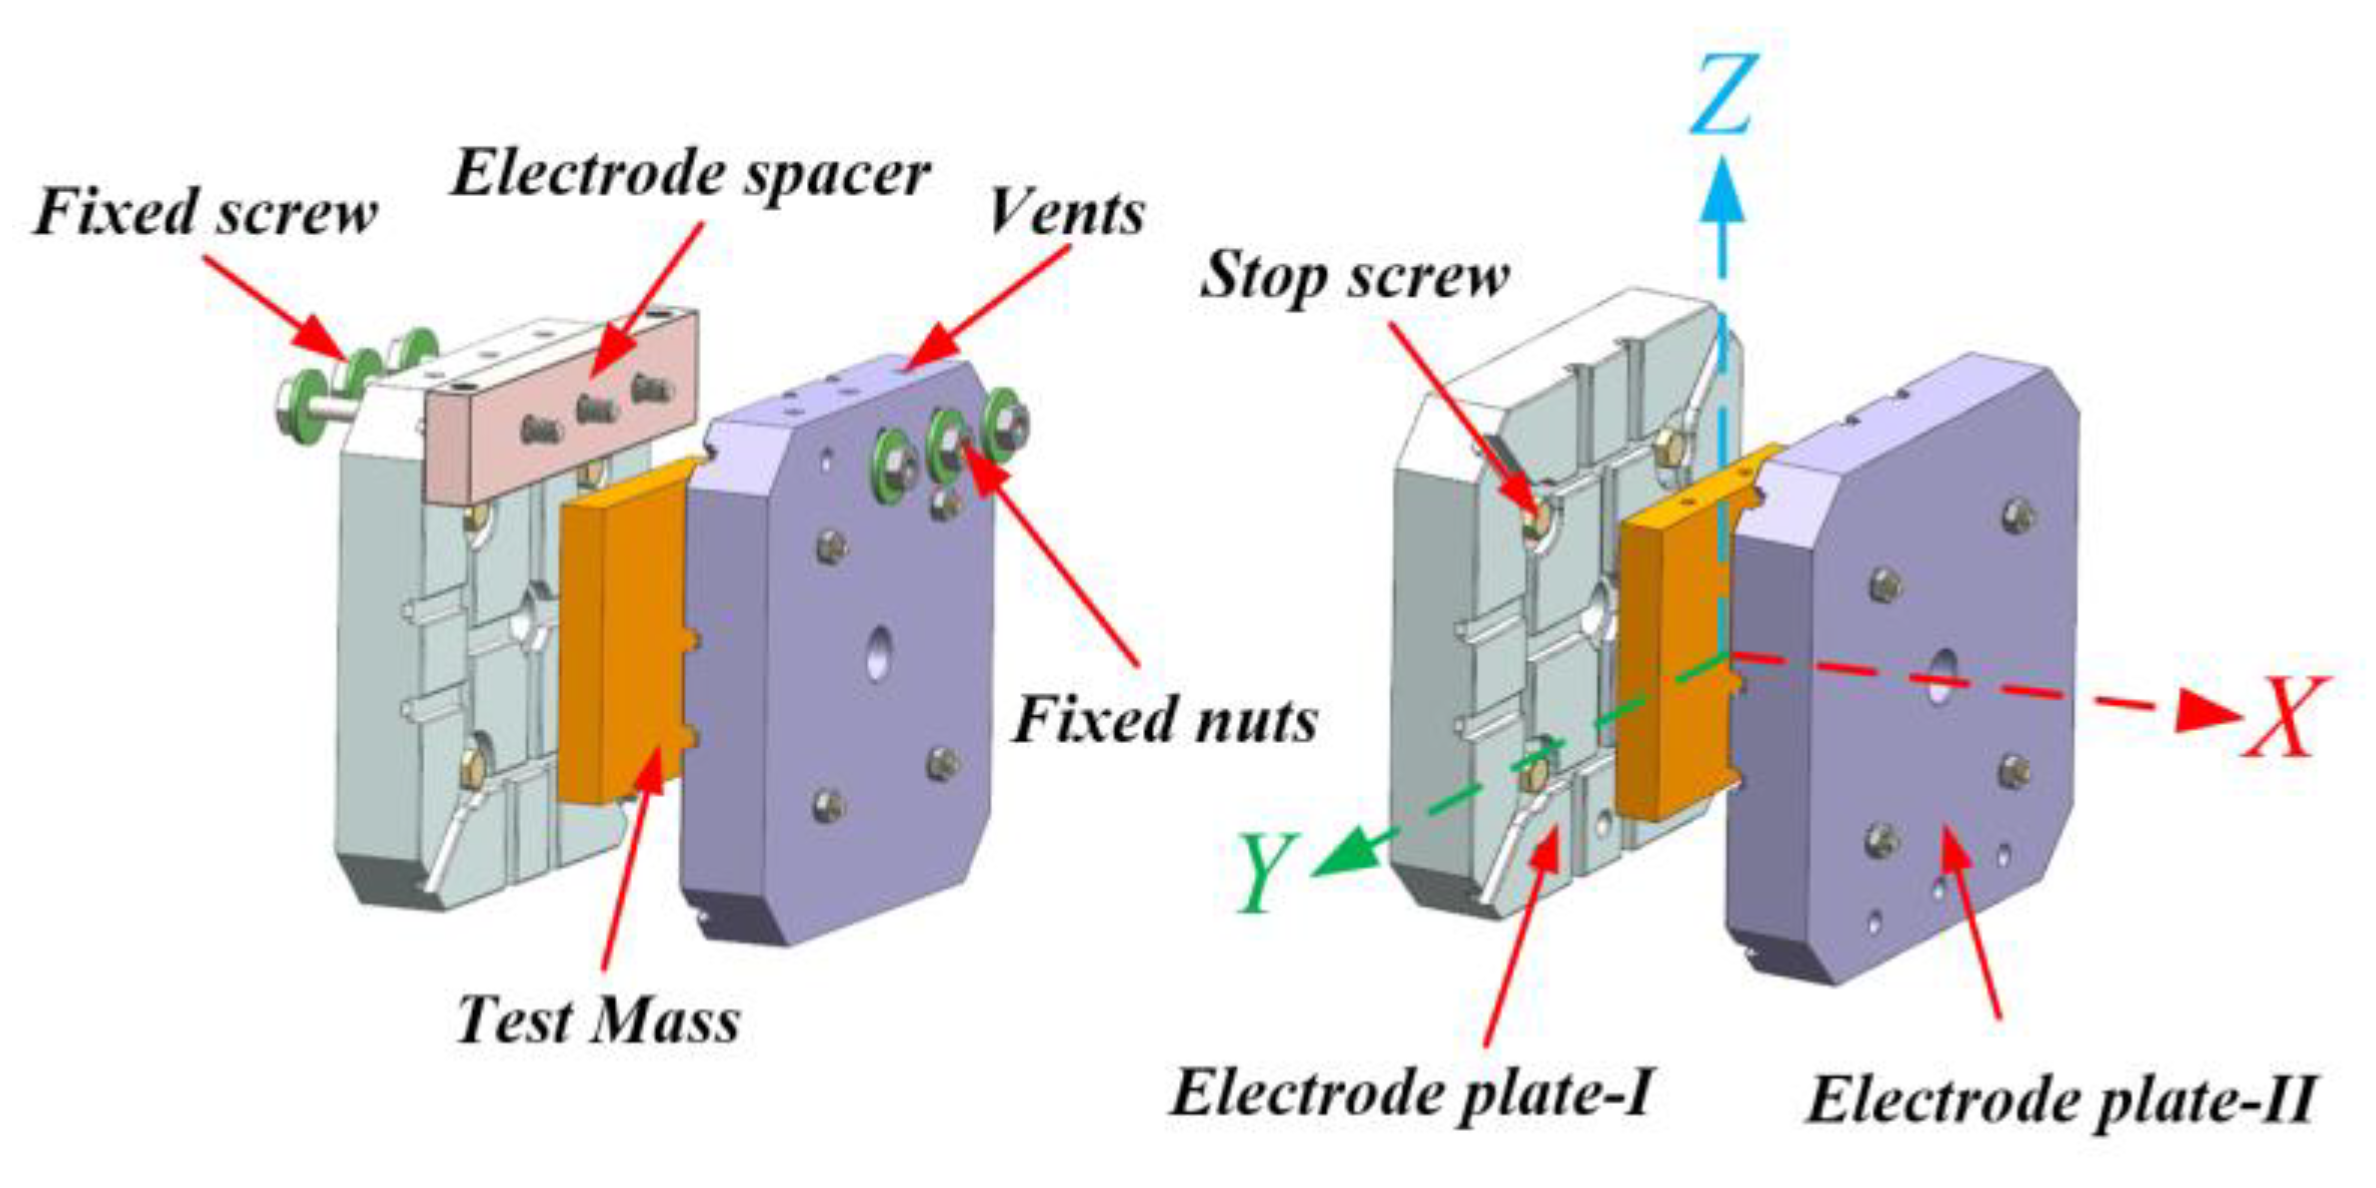
As mentioned above, the sensitive structure of the IS consists of a TM and an EH. The components are shown in Figure 6, the working coordinate system is defined as well. The TM is a parallelepiped, the normal direction of the square surface with the largest area is the X-axis. The EH provides the differential electrodes around the TM. The TM is made of TC4 titanium alloy material with extremely low magnetic susceptibility ( | χ | 1.3 × 10 5 ), which can reduce the influence of the electromagnetic noise in the space environment. A CNC (Computer Numerical Control) machining center is employed to process the TM. As a result, the TM with the perpendicularity and parallelism of end faces less than 5 × 10 5   rad (about half of the design requirements 1 × 10 4   rad ), which can effectively reduce the coupling noise between the axes. In addition, two threaded holes are prepared on the Z-direction end face of the TM for connecting with the wire suspension component and all surfaces of the TM are gold-coated.
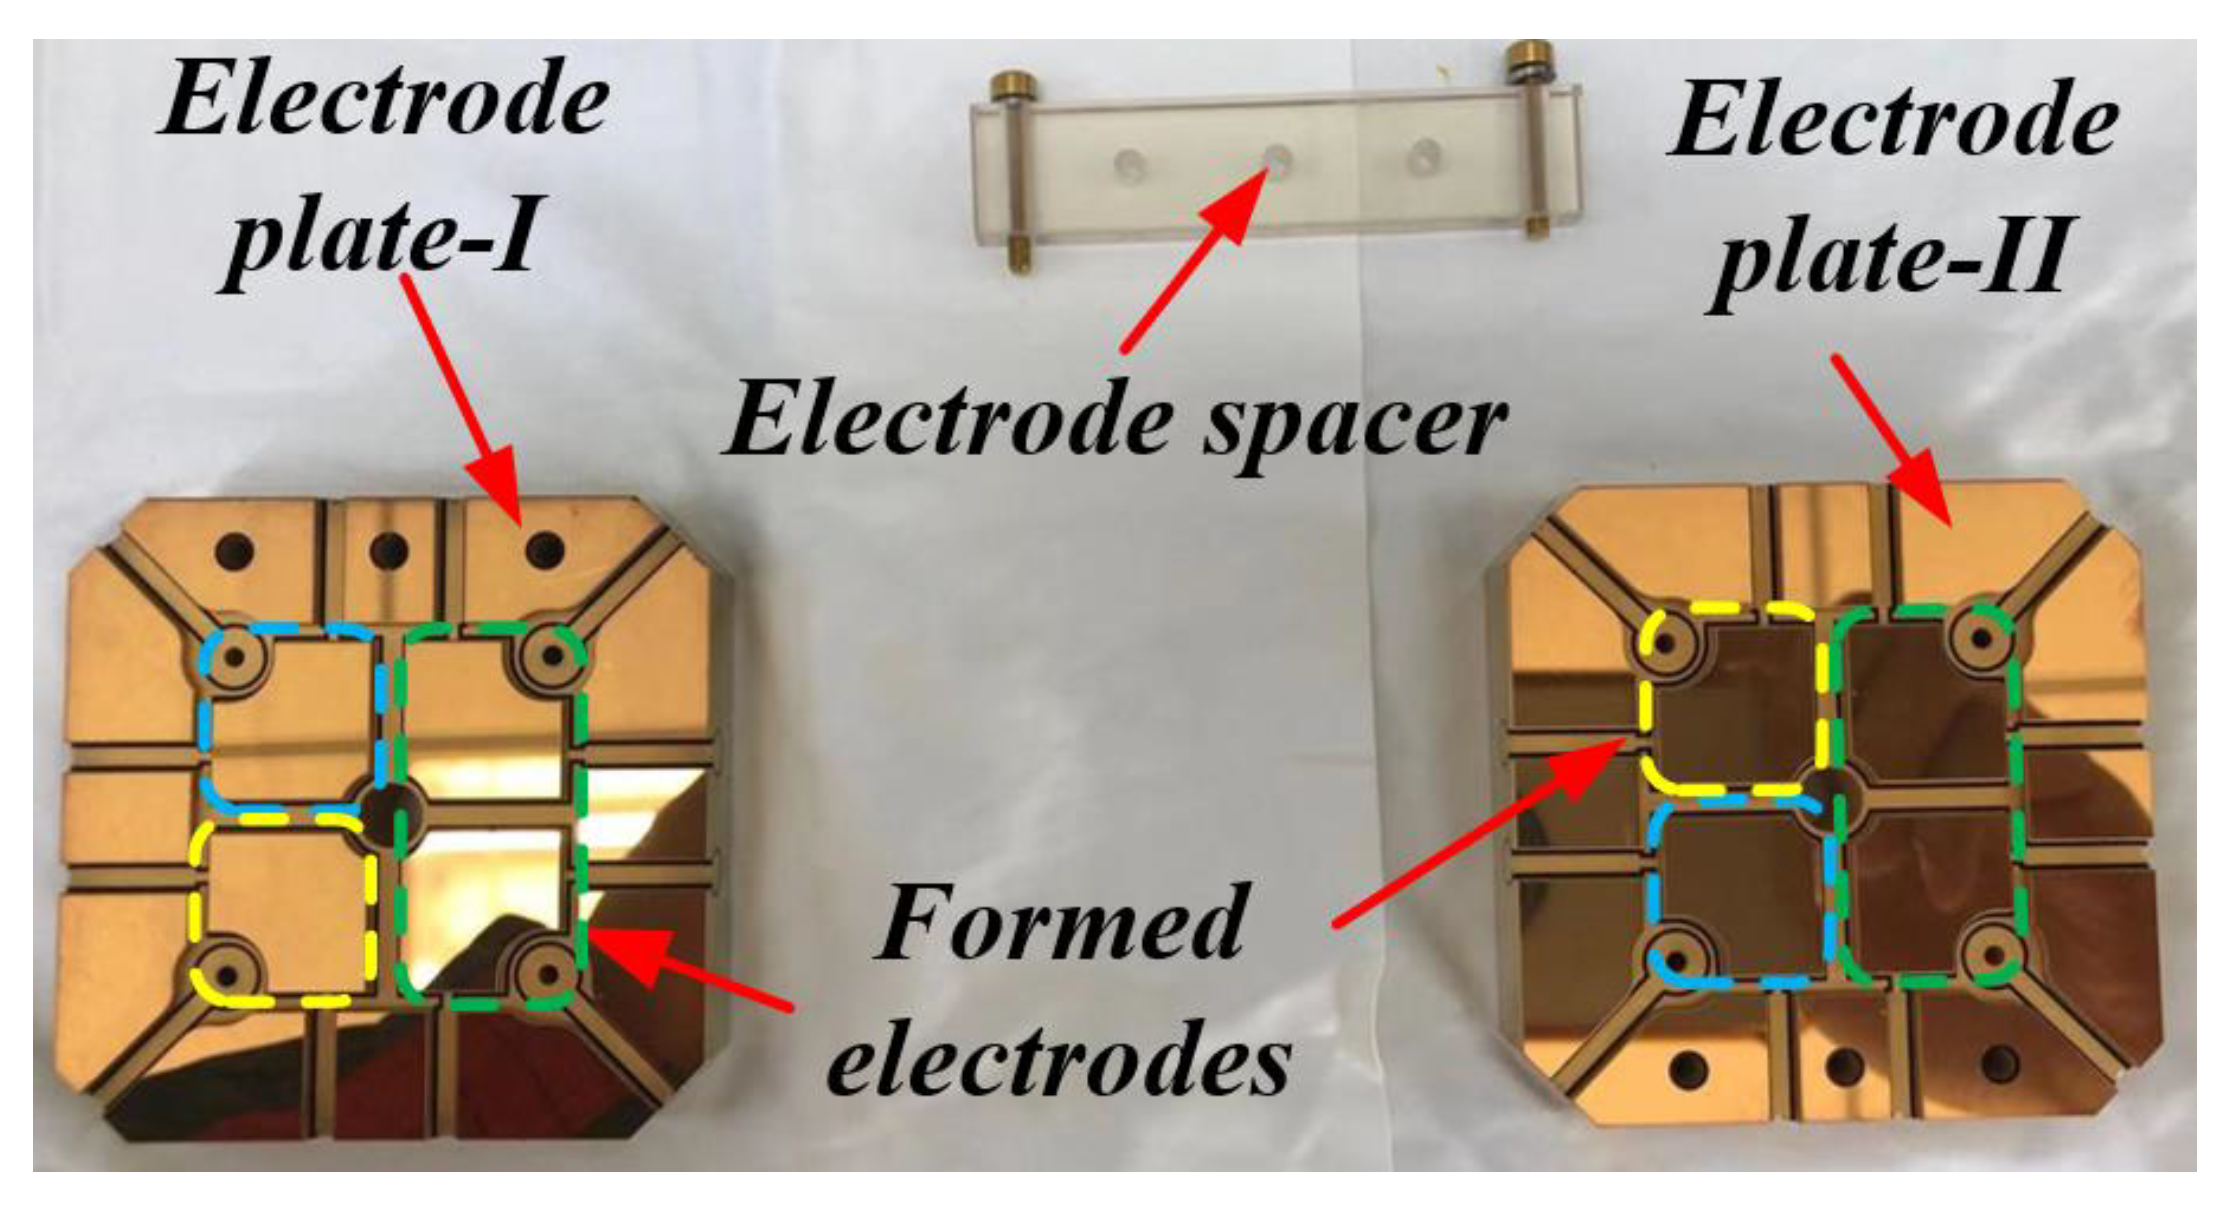
Electrode plate-I, high-precision spacer ring, and electrode plate-II compose a sandwich-structured electrode housing. The two electrode plates have the same structure. Materials with higher thermal conductivity can better suppress the thermal gradients-induced acceleration noise. Therefore, all electrode plates and spacers adopt the ultra-low expansion glass-ceramic Zerodur® material from SCHOTT and are produced with diamond tools in the CNC machining center. The flatness of the electrode surface of the electrode plate and the parallelism of the end surface of the spacer are both less than 5 × 10 5   rad , and the thickness error of the spacer is less than 1 μm. A gold layer is first coated on the entire electrode surface of the electrode plate via the Physical vapor deposition (PVD) method, and then electrodes are fabricated by laser etching. Finally, the electrode plates are bolted, assembled, aligned, and grouped with the help of a high-precision coordinate measuring machine (CMM). Each electrode plate assembly has four stop screws to prevent the TM from directly contacting the electrode surface and has three vents to avoid sealing the gas in the assembly hole during the assembly process. The finished electrode plates and assembly components are shown in Figure 7. Corresponding electrode pairs configuration is marked by different color rectangles (X1: green, X2: blue, X3: yellow).
This sensitive structure also has the ability to simultaneously measure and control three degrees of freedom, which facilitates the electrostatic drive and simplifies the complexity and design difficulty of the FEE. The basic design parameters are listed in Table 1.

3.2. Measurement and Control Unit

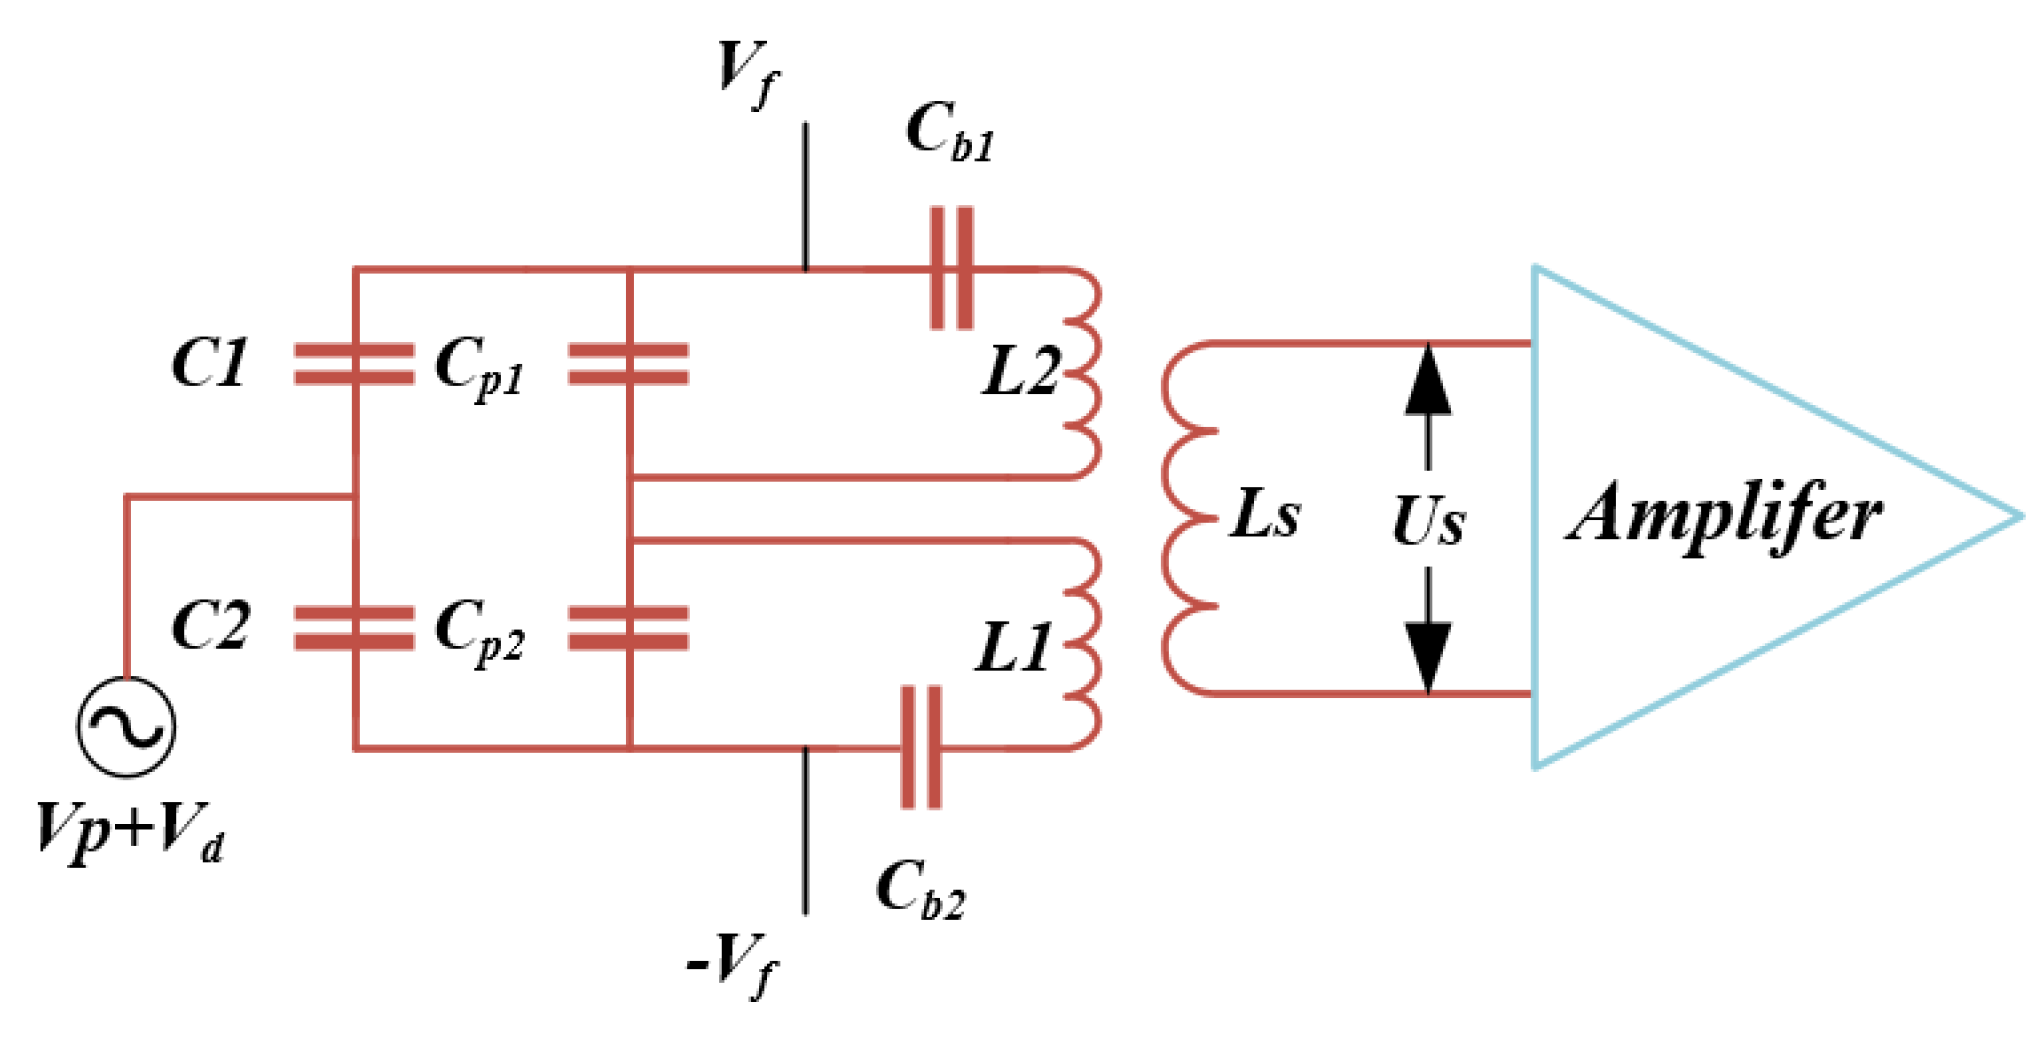
The measurement and control unit is mainly composed of a capacitive sensing control circuit and a host computer software. The capacitive sensing control circuit detects the displacement signals of the TM by directly loading a 100 kHz sinusoidal modulation signal to the TM to form a resistor-capacitor (RC) based resonant capacitor bridge. The capacitor bridge includes the differential capacitance formed by the TM and the EH and the differential transformer.
The basic measurement principle is shown in Figure 8, in which C1 and C2 are capacitors formed by the TM and the EH, Cp1 and Cp2 are the parasitic capacitor and resonance tuning capacitor in the circuit, respectively, Cb1 and Cb2 are the electrostatic feedback drive filter capacitors, L1, L2, and Ls are transformer inductances, and V d is the detection voltage of the differential capacitance. Table 2 shows the corresponding values of the capacitances and inductances.
A high gain of the signal can be achieved by adjusting the RC bridge, working near the resonance point, reducing noise and improving the signal-to-noise ratio of the differential capacitor signal. Therefore, the capacitor inductor circuit has the same resonant frequency as the sinusoidal modulation signal, i.e., 100 kHz. The circuit parameters are shown in Table 3.
The generated voltage signal is transmitted to the PID controller, and then a feedback voltage is obtained. This feedback voltage is applied to the electrodes through an electrostatic drive circuit to complete a closed-loop control. One end of the capacitive sensing circuit is connected to the sensitive structure through a coaxial cable, and the other end is linked to a host computer through a serial port. The software for measurement and control is developed through LabView, which can control the switching of different measurement modes, and collect and display the current measurement information in real-time.

3.3. Torsion Pendulum Facility

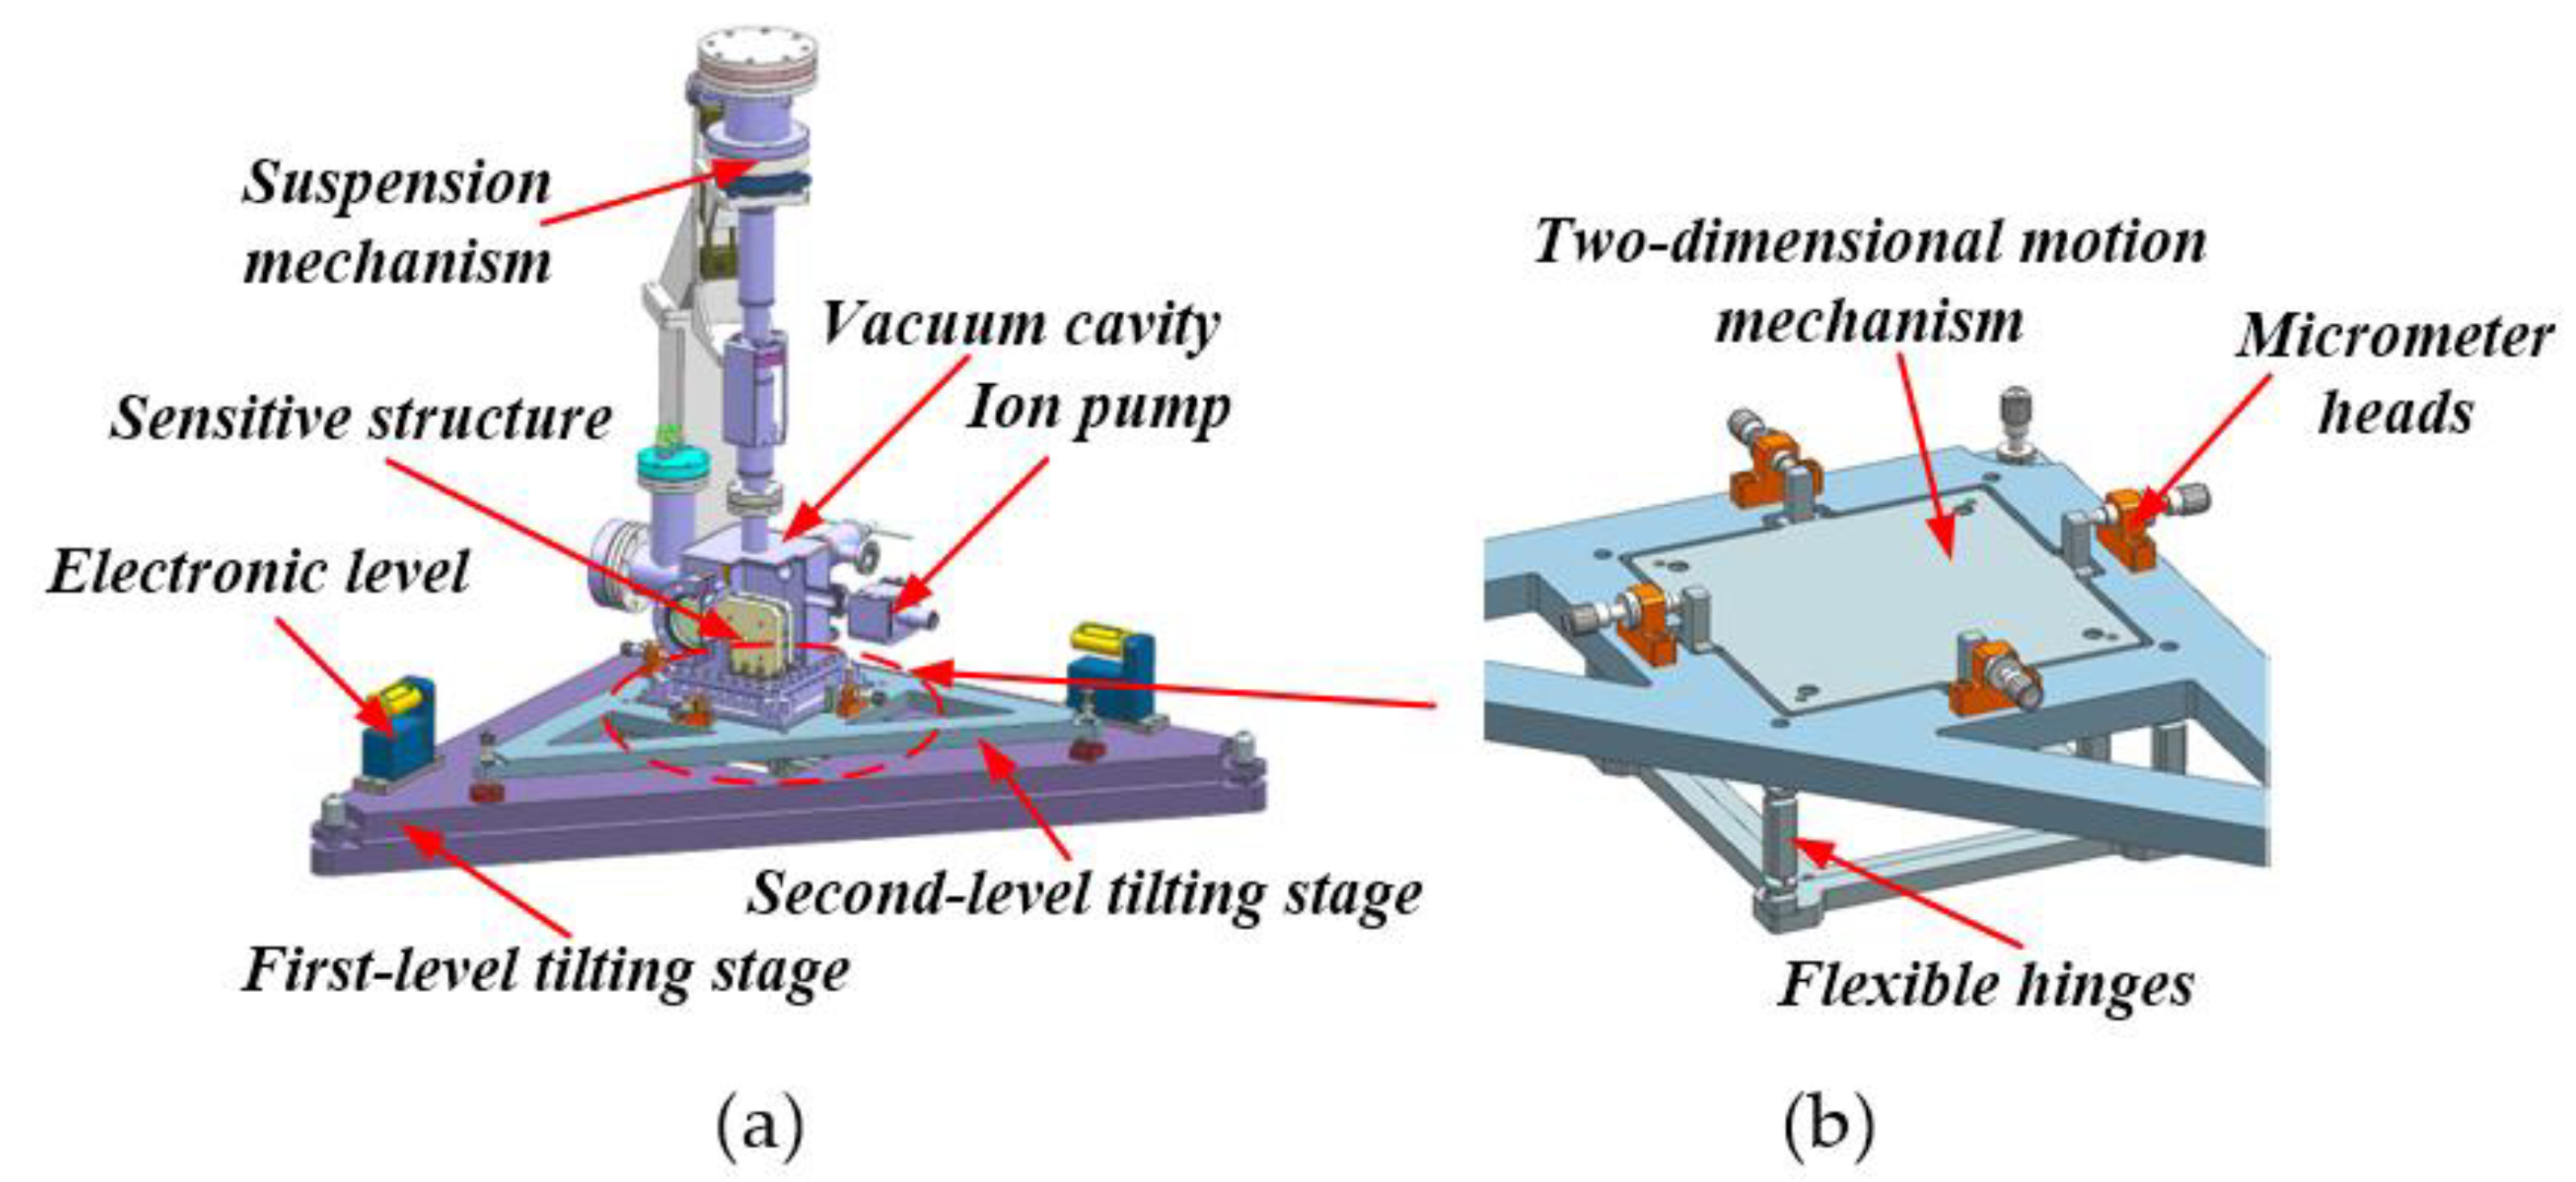
The torsion pendulum designed by Changchun Institute of Optics, Fine Mechanics, and Physics, Chinese Academy of Science (CIOMP) is depicted in Figure 9a. It consists of a precision adjustment unit, a vacuum system, a sensitive structure, a suspension mechanism, and a bracket. A suspension wire with a low stiffness in the torsion direction is used to mitigate the impact of the Earth’s gravity. Thereby, the horizontal direction displacement measurement and static control of the TM can be achieved.
The precise alignment between the TM and the EH is implemented by the precision adjustment unit, which consists of a two-level tilt adjustment mechanism and a two-dimensional translation mechanism. The second-level tilting mechanism adopts a classic three-point adjustment structure for coarse adjustment. The differential heads (NewPort-AJS) has a resolution of 25 μrad. The first-level tilting stage with an adjustment resolution less than 5 μrad is used for fine adjustment. In order to accurately control the gap between the TM and the electrodes, we design a two-dimensional motion mechanism without kinematic coupling, which has flexible adjustment space. As shown in Figure 9b, the two-dimensional motion mechanism is driven by four differential micrometer heads. The displacement resolution of the flexible hinges is less than 1 μm.
The vacuum maintenance system consists of a vacuum chamber, an ion pump, a vacuum gauge, and an external pump set, which is used to maintain the vacuum of the system and reduce the influence of gas noise during the test. The vacuum cavity is evacuated to a high-vacuum state of about 4 × 10 5   Pa by combining an external mechanical pump and a molecular pump, and then the vacuum is maintained by an ion pump. A vacuum gauge displays the air pressure in real-time.
In the suspension system, the base of the vacuum chamber is fixed on the motion mechanism, the EH is placed on the base, and the TM is suspended in the middle of the EH by a 0.55 m long tungsten wire with a diameter of 50 μm and a purity of 99.5%. One side of the suspension wire is connected to the Z-plane of the TM through a wire fixture. Since the direction of the suspension wire must exactly pass through the centroid of the TM, the entire connection is performed through the CMM. Release the tungsten wire stress and adjust the angle between the TM and the EH by a rotating mechanism.

4. Ground Evaluation Experiment

4.1. Experimental Setup

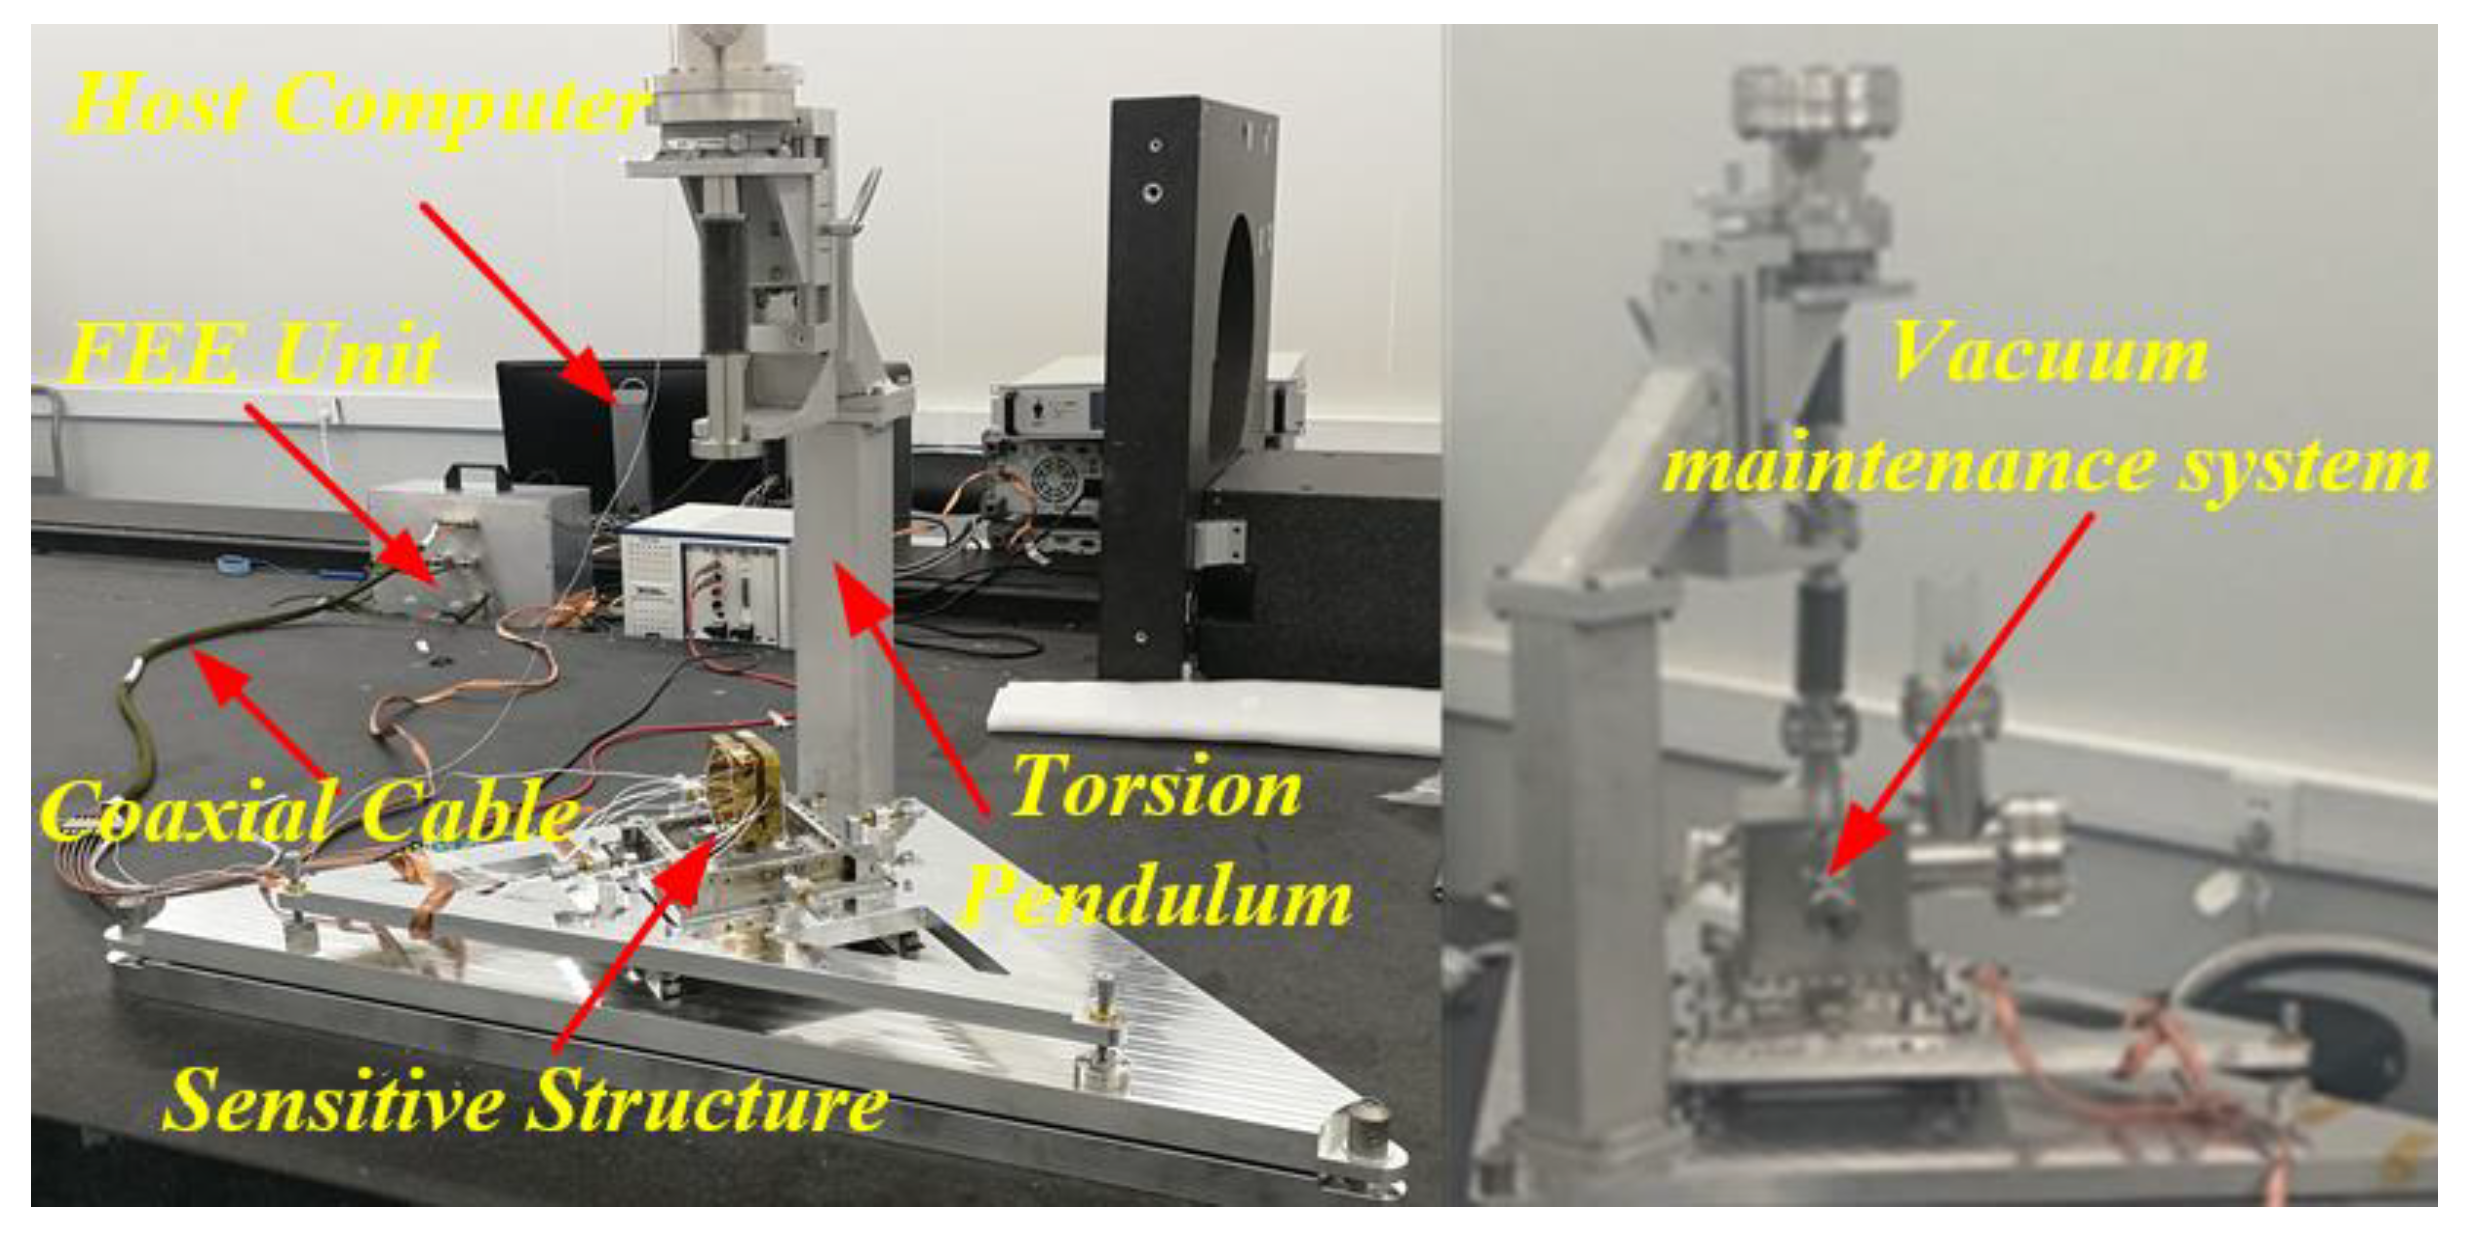
Using the sensitive structure and torsion pendulum test facility designed in Section 3, the performance of the IS is experimentally verified and the system resolution is evaluated. The verification includes the control ability test and the system resolution estimate. The experiments are performed in a laboratory of CIOMP, Changchun City, Jilin, China. This laboratory has a Class 1000 cleanliness, a temperature control level of ±0.1 °C, and a two-stage vibration isolation system based on an isolation foundation and an air floating platform. In addition, quiet nights are chosen for experiments to further minimize the influence of the environmental noise in the system measurement. The sensitive structure and the FEE are connected through a coaxial cable, the FEE structure and the torsion pendulum must be grounded as well. The system is shown in Figure 10.

4.2. Control Ability Experiment

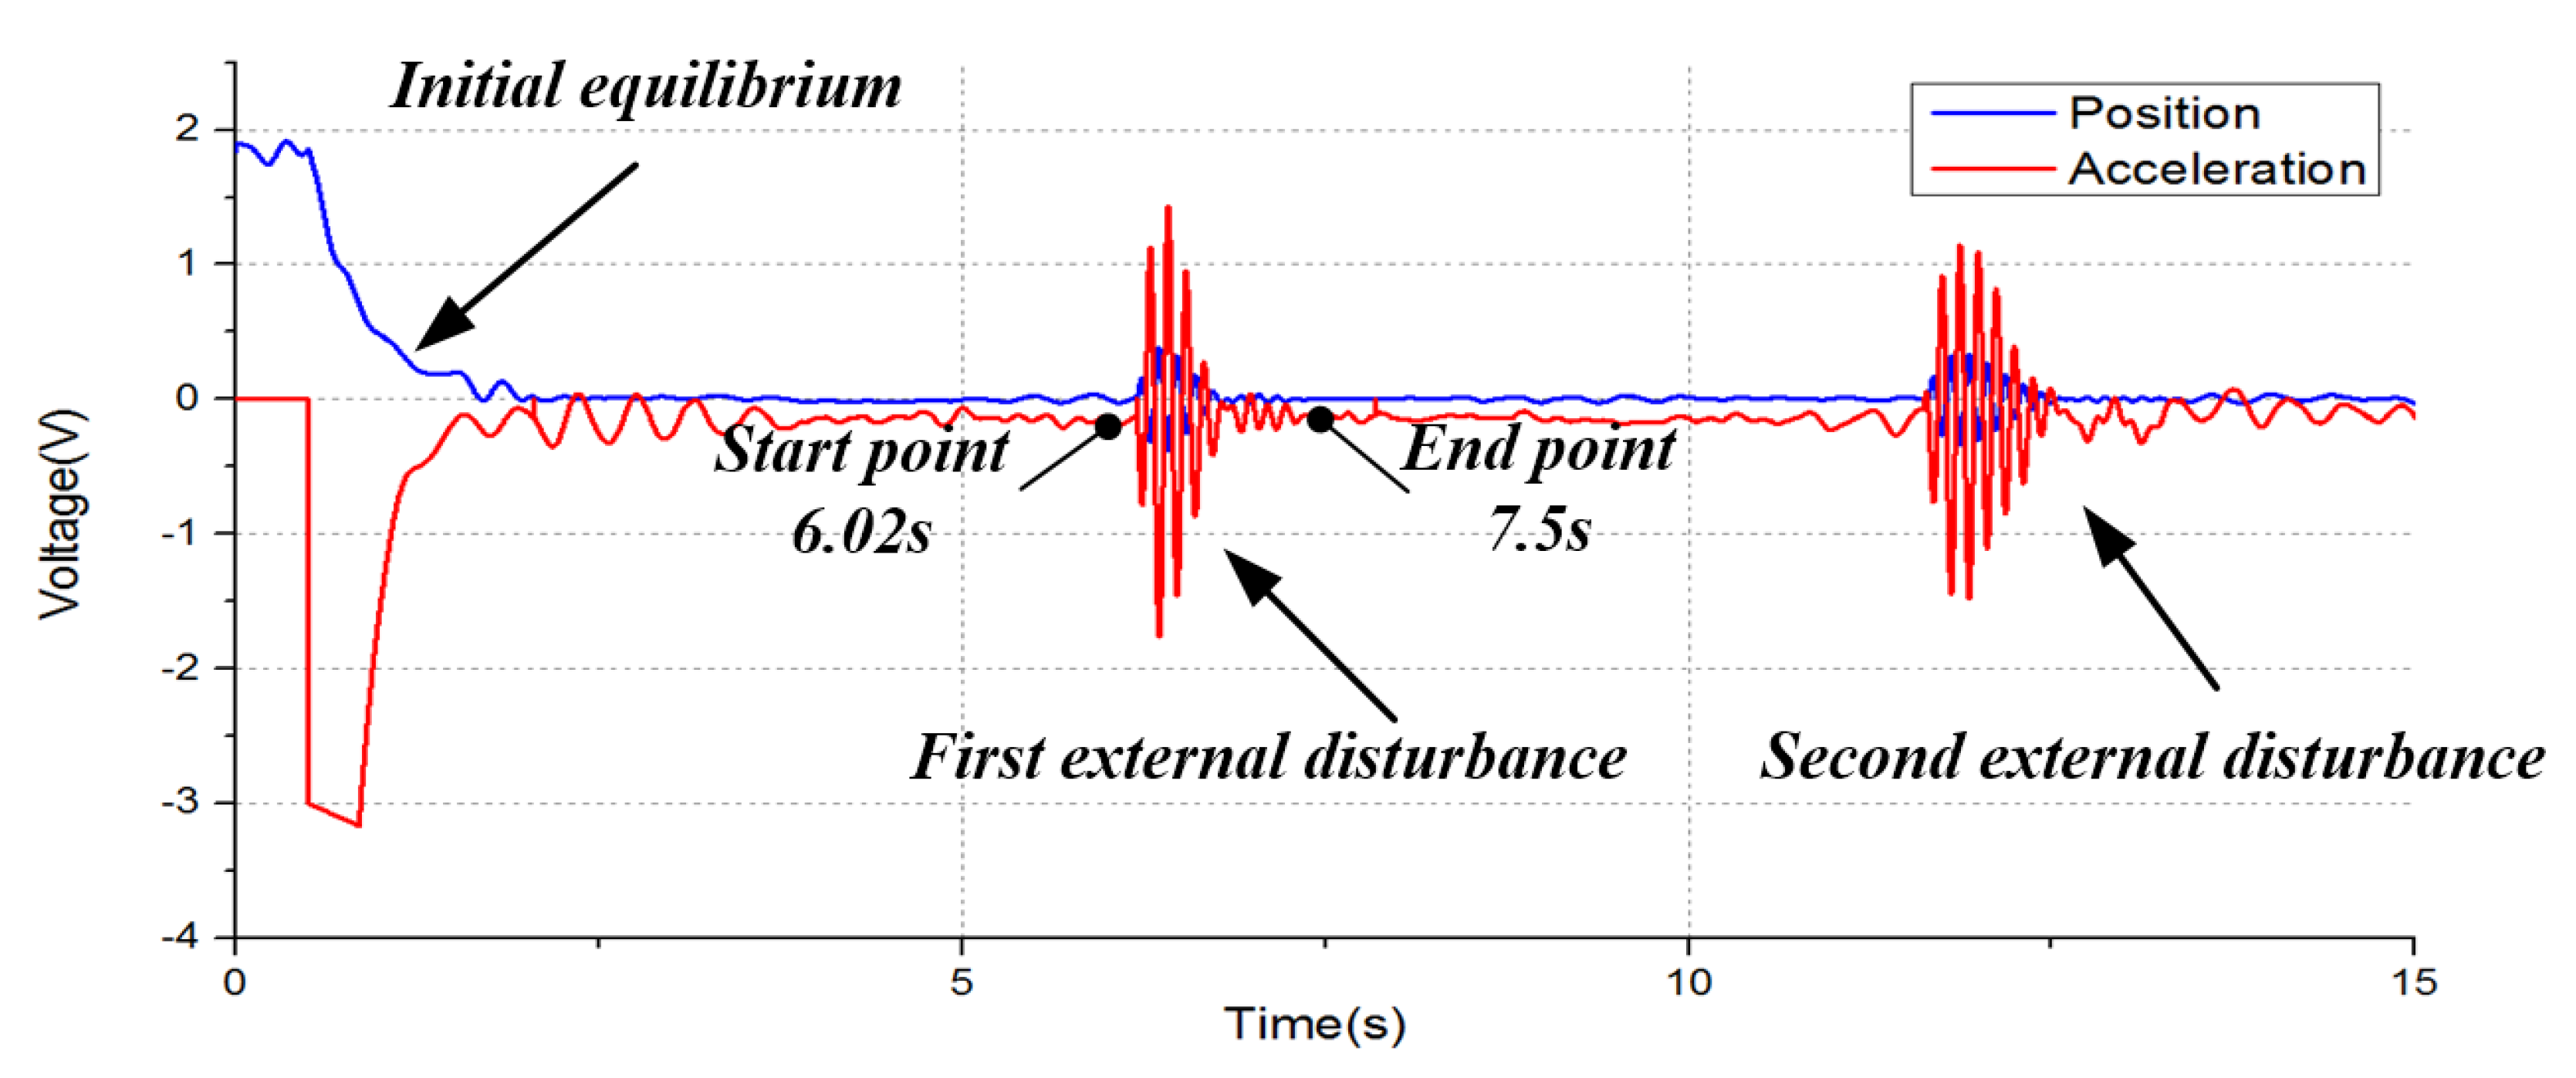
When the EH and the TM are aligned by adjusting the two-level tilt adjustment mechanism, the capacitance between the opposing electrodes is monitored by the NI-PXI-4027 digit flexDMM. If the capacitance values on both sides are approximately equal, it means that the TM has been placed in the linear region. At this time, the closed-loop control mode is turned on, three channels of electrostatic force feedback control are performed on the TM. The upper limit of the measurement band is 18.15 Hz [40] and the host computer software collects data and draws graphs in real-time. Using the relationship between the acceleration and the feedback voltage described in Equation (6), the characteristics of the change are directly reflected by the voltage. The same is true for the displacement. The experimental results are shown in Figure 11, in which an instantaneous disturbance excitation is applied by hammering one end of the marble floating platform lasting about 1.5 s. When the external disturbances are imposed, the TM is rapidly and stably controlled in the center of the EH.

4.3. Acceleration Noise and Resolution Evaluation

The evaluation of the acceleration resolution level of the IS is based on a comprehensive test analysis of the noise affecting the system measurement. Due to the EH being rigidly connected to the measurement system, the external disturbing force effect on it can be ignored. Therefore, the system measurement resolution can be represented by the residual acceleration noise of the TM. The noise sources mainly come from the temperature disturbance, earth pulsation, processing defects of the sensitive structure, and the FEE noise. It is assumed that there is no statistical correlation among various noise sources, and the total residual acceleration noise Total is the root mean square of each noise contribution term n . Table 4 shows the parameters obtained by measuring related equipment.
When the temperature changes, the residual gas in the cavity will collide with the TM and lead to acceleration noise. The expression is:
Thr = PA 2 m · δ T T 1.5 × 10 10   m / s 2 / Hz 1 / 2
Generally, seismic noise is on the order of magnitude of 10 6 10 7   m / s 2 / Hz 1 / 2 [41]. If the vibration isolation conditions are very good, it can reach the order of magnitude of 10 8   m / s 2 / Hz 1 / 2 . We reference the measurement results of local earth pulsations [42,43], analyze the actual vibration isolation conditions in our laboratory, and estimate that the seismic noise disturbance is about:
Ear 1 × 10 6 m / s 2 / Hz 1 / 2
Due to processing discrepancy in the production of sensitive structure, it is difficult to make the electrode area totally symmetrical and the electrodes completely parallel to the TM. Therefore, the coupled acceleration noise around the TM in the environment does not exceed the following:
Geo = ζ · δ E max 5 × 10 11   m / s 2 / Hz 1 / 2
The acceleration noise caused by the area asymmetry can also get to:
Dim = ε 0 ε r A δ A md 2 ( V p δ V p + V d δ V d ) 3.6 × 10 12   m / s 2 / Hz 1 / 2
The FEE noise primarily comes from detection noise and drive noise. According to the power spectral density (PSD) of the relevant noise disturbance listed in Table 4, the duration of the data acquisition is about 10 min and the displacement resolution obtained by the calibration experiment is about 7.2 × 10 11   m / Hz 1 / 2 as shown in Figure 12. Based on the principle of the spring oscillator model of the inertial sensor [44], the detection noise is expressed as:
Dis = k e δ x m 6.8 × 10 10   m / s 2 / Hz 1 / 2
where k e is the negative stiffness:
k e 2 ε 0 ε r A d 3 ( V p 2 + V d 2 ) = 0.398 / s 2
and the driving noise is:
Act = 2 ε 0 ε r A md 2 ( V p δ V f + V f δ V p ) 3.9 × 10 9   m / s 2 / Hz 1 / 2
The total acceleration noise on the TM is listed in Table 5.
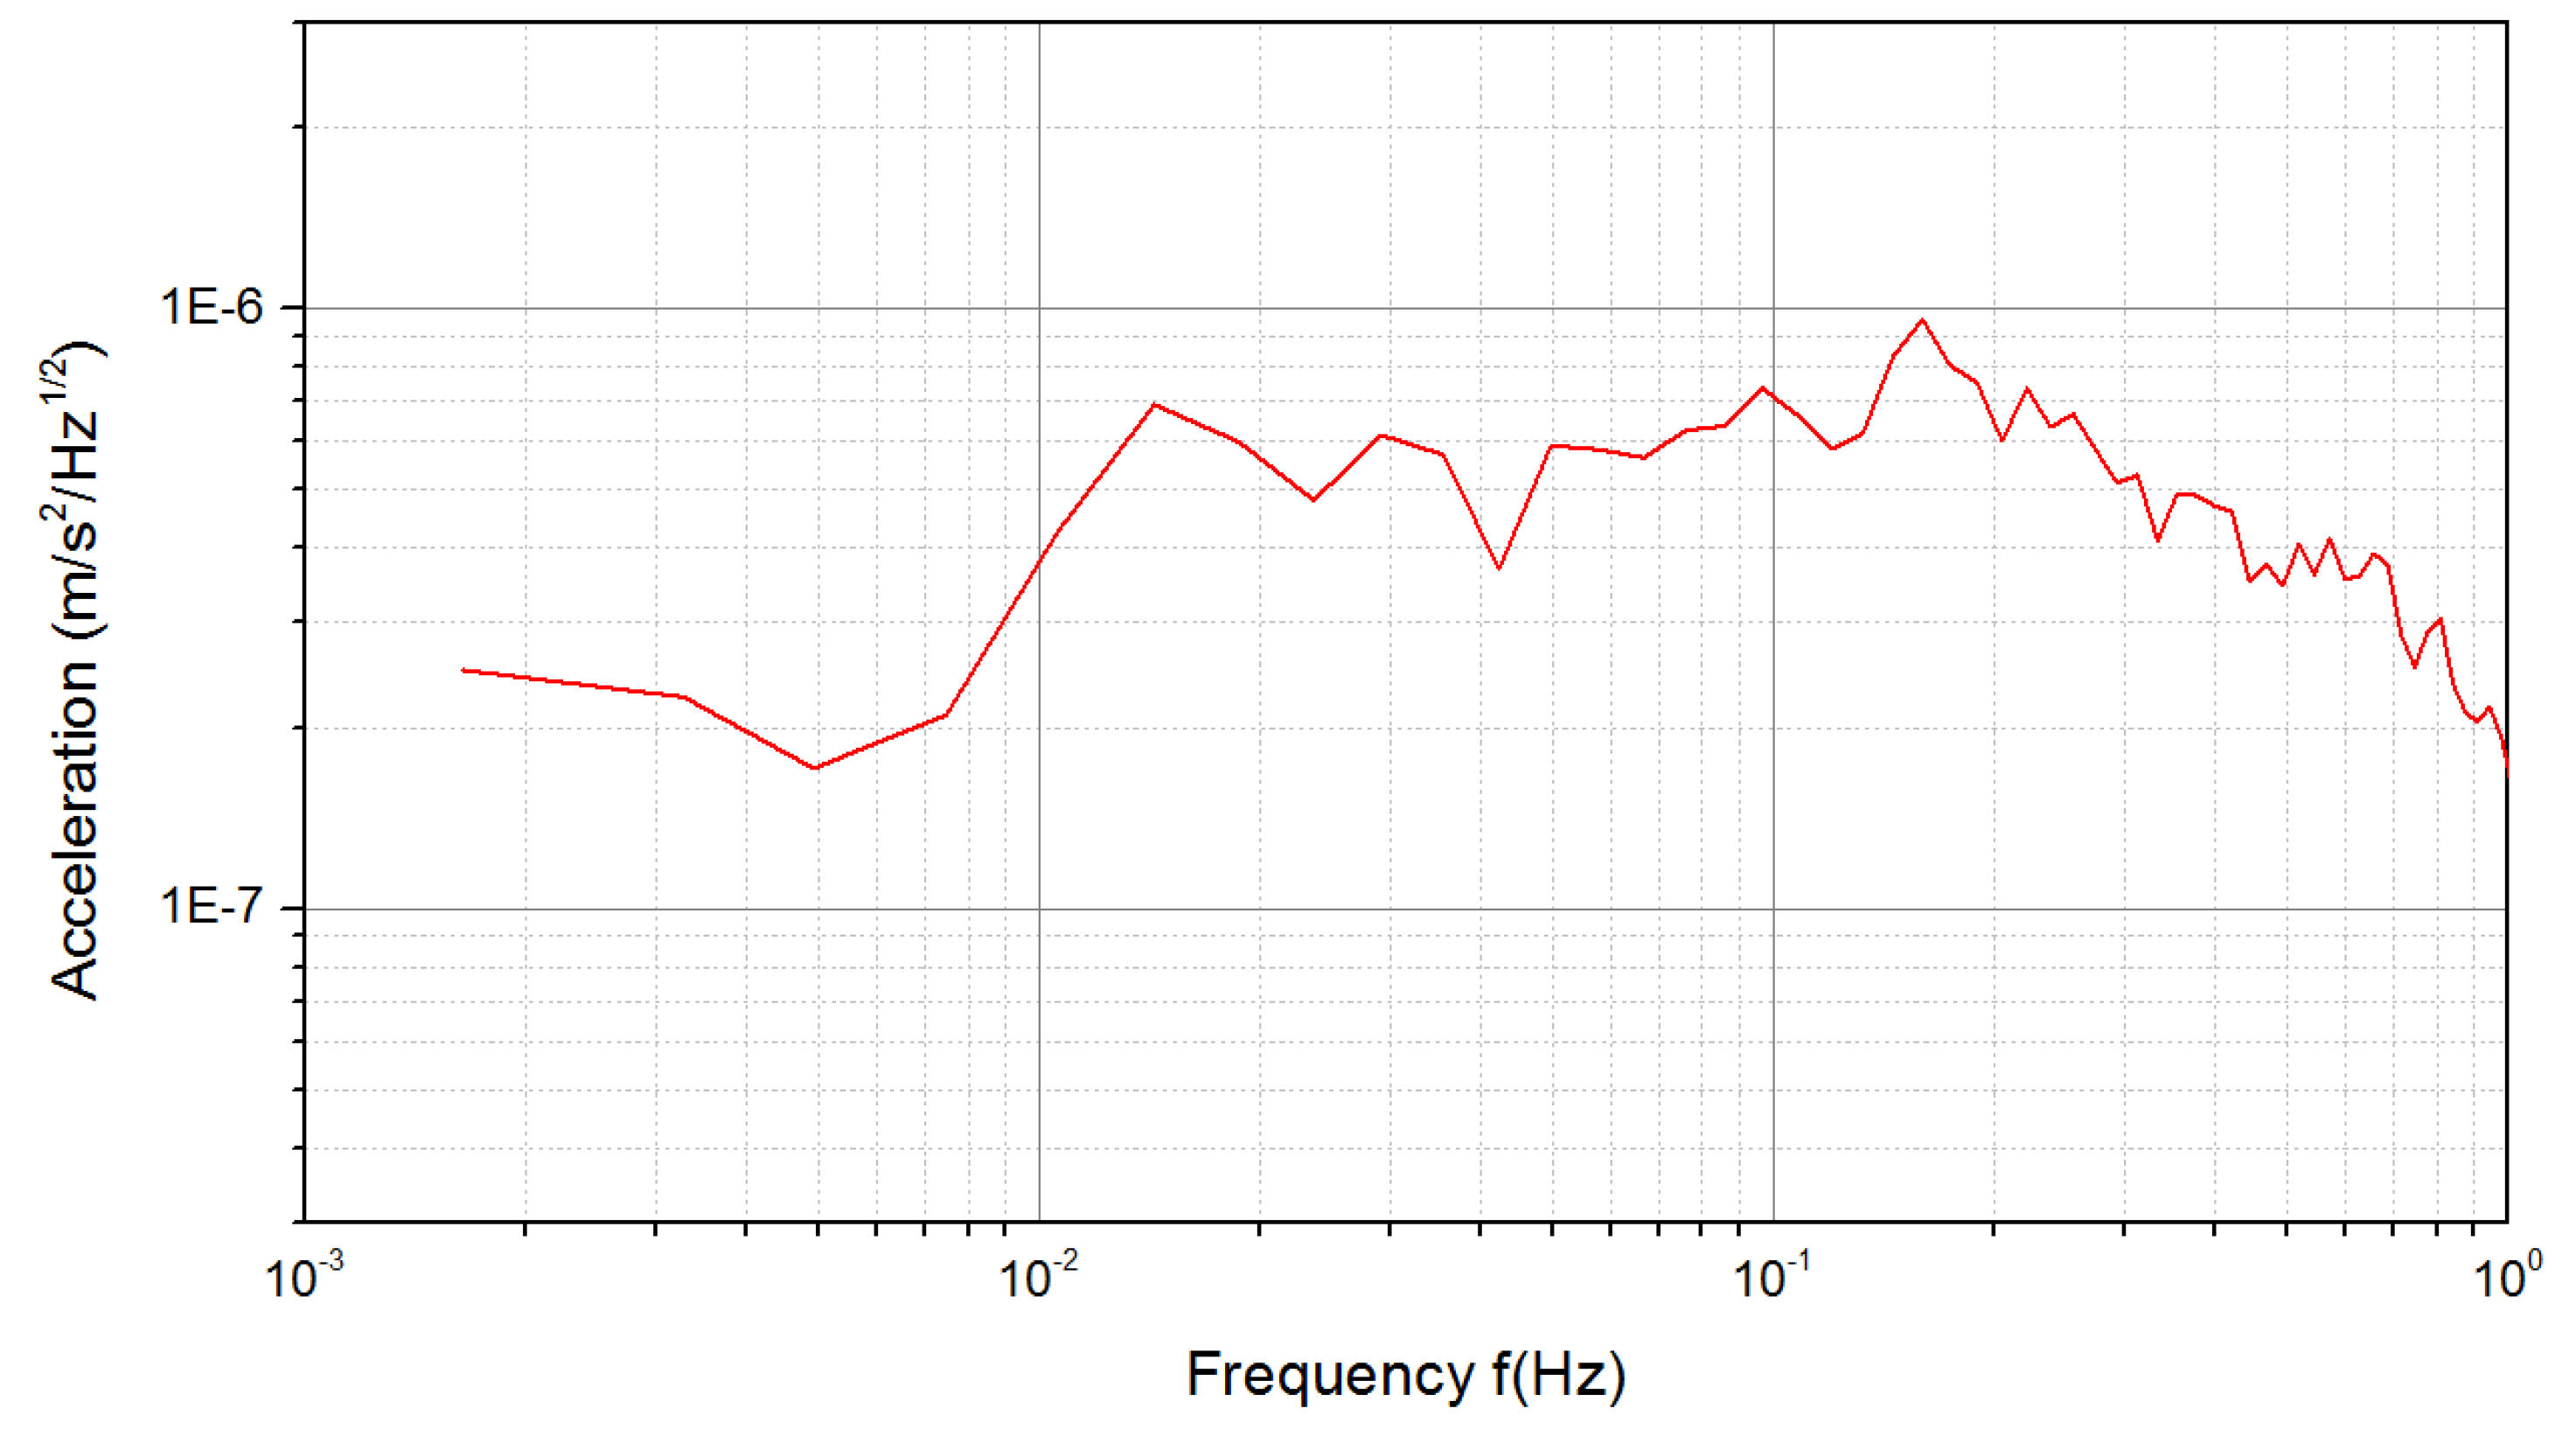
Finally, under the steady-state of the system closed-loop control, the data of the control voltage in the non-sensitive axis channel is collected. The acceleration data in the time domain are calculated with the voltage to acceleration conversion factor and converted into the PSD in the frequency domain by Fourier transform, then making the acceleration resolution PSD curve as shown in Figure 13.
According to the curve, the acceleration resolution in the interest measurement frequency band 0.1 Hz can reach 7 × 10 7   m / s 2 / Hz 1 / 2 . The resolution is better than 9.5 × 10 7   m / s 2 / Hz 1 / 2 in the Taiji technology verification satellite’s frequency band of interest between 10 mHz and 1 Hz, which corresponds to the non-sensitive axis of the IS under the current environmental conditions.
As shown above, the noise of an inertial sensor in the ground environment is mostly from the seismic noise, which is in the order of magnitude of 10 6 10 7   m / s 2 / Hz 1 / 2 within the measuring frequency. Therefore, the test results can be improved by performing the test in an underground laboratory environment. The system resolution can reach 3.96 × 10 9   m / s 2 / Hz 1 / 2 without the influence of the seismic noise and the suspension fiber system stiffness, which meets the requirements of the space system. In addition, improving temperature control and machining technologies can also further increase the resolution of the IS.

5. Conclusions

Based on the measurement principle of the capacitive sensor and the corresponding electrode division method, the sensitive structure is designed and a torsion pendulum facility is constructed to test the non-sensitive axis acceleration of the IS. This system solves the problem that the high-voltage levitation cannot assess the non-sensitive axis of the IS on the ground. Corresponding test experiments on the control ability and noise level of IS are performed in the laboratory environment. The experimental results show that under closed-loop control conditions, the TM can quickly return to the equilibrium position when it is subjected to external disturbance. According to our analysis and estimation of various noise factors, the total acceleration noise in the direction of the non-sensitive axis of the IS is below 9.5 × 10 7   m / s 2 / Hz 1 / 2 , which is mainly caused by the seismic noise on the ground. If the influence of the seismic noise and the detection noise caused by suspension fiber system stiffness is eliminated, the resolution of IS on the non-sensitive axis can reach 3.96 × 10 9   m / s 2 / Hz 1 / 2 , which meets the requirement of 3 × 10 8   m / s 2 / Hz 1 / 2 of the Taiji technology verification satellite. In order to obtain highly precise test results and a more comprehensive evaluation of the performance of the IS in the future, it is necessary to use an underground laboratory to reduce the impact of the seismic noise in system measurements.
In the future, this torsion pendulum facility will focus on the performance testing and evaluation of more precision space inertial sensors, expand more testing functions, and finally serve the space gravitational wave detection project.

Author Contributions

Conceptualization, S.W. and L.C.; methodology, S.W., Y.W. and K.Q.; validation, L.C.; investigation, S.W. and K.Q.; data curation, Z.Z.; writing—original draft preparation, S.W.; writing—review and editing, S.W., L.C. and K.Q.; funding acquisition, Z.W. All authors have read and agreed to the published version of the manuscript.

Funding

This research was funded by the Strategic Priority Research Program of the Chinese Academy of Science (XDA15720700) and the Projects of Science Technology Development Plan of Jilin Province under Grants (20180201048GX and 20190302102GX).

Acknowledgments

The author would like to thank the State Key Laboratory of Applied Optics of CIOMP for supporting the experimental conditions of the research.

Conflicts of Interest

The authors declare no conflict of interest.

References

  1. Abbott, B.P.; Abbott, R.; Abbott, T.D.; Abernathy, M.R.; Acernese, F.; Ackley, K.; Adams, C.; Adams, T.; Addesso, P.; Adhikari, R.X.; et al. GW150914: The Advanced LIGO Detectors in the Era of First Discoveries. Phys. Rev. Lett. 2016, 116, 131103. [Google Scholar] [CrossRef] [PubMed] [Green Version]
  2. Chen, Q.; Mariethoz, G.; Liu, G.; Comunian, A.; Ma, X. Locality-based 3-D multiple-point statistics reconstruction using 2-D geological cross-sections. Hydrol. Earth Syst. Sci. Discuss. 2018, 1–31. [Google Scholar] [CrossRef] [Green Version]
  3. Li, Y.; Liu, H.; Zhao, Y.; Sha, W.; Wang, Z.; Luo, Z.; Jin, G. Demonstration of an Ultraprecise Optical Bench for the Taiji Space Gravitational Wave Detection Pathfinder Mission. Appl. Sci. 2019, 9, 2087. [Google Scholar] [CrossRef] [Green Version]
  4. Liu, H.; Luo, Z.; Jin, G. The Development of Phasemeter for Taiji Space Gravitational Wave Detection. Microgravity Sci. Technol. 2018, 30, 775–781. [Google Scholar] [CrossRef]
  5. Jin, G. Program in space detection of gravitational wave in Chinese Academy of Sciences. J. Phys. Conf. Ser. 2017, 840, 12009. [Google Scholar] [CrossRef] [Green Version]
  6. Cyranoski, D. Chinese gravitational-wave hunt hits crunch time. Nat. News 2016, 531, 150–151. [Google Scholar] [CrossRef] [PubMed] [Green Version]
  7. Luo, Z.; Liu, H.; Jin, G. The recent development of interferometer prototype for Chinese gravitational wave detection pathfinder mission. Opt. Laser Technol. 2018, 105, 146–151. [Google Scholar] [CrossRef] [Green Version]
  8. China’s Taiji-1 Satellite Successfully Passes In-Orbit Tests. Available online: https://www.apdnews.com/science-military/977140.html (accessed on 26 December 2019).
  9. Josselin, V.; Rodrigues, M.; Touboul, P. Inertial sensor concept for the gravity wave missions. Acta Astronaut. 2001, 49, 95–103. [Google Scholar] [CrossRef]
  10. Touboul, P.; Willemenot, E.; Foulon, B.; Josselin, V. Accelerometers for CHAMP, GRACE and GOCE space missions: Synergy and evolution. Boll. Geof. Teor. Appl. 1999, 40, 321–327. [Google Scholar]
  11. Lauben, D.; Allen, G.; Bencze, W.; Buchman, S.; Byer, R.; Goh, A.; Dorlybounxou, S.; Hanson, J.; Ho, L.; Higuchi, S.; et al. Electrostatic sensing and forcing electronics performance for the LISA Pathfinder gravitational reference sensor. AIP Conf. Proc. 2006, 873, 576–582. [Google Scholar] [CrossRef]
  12. Danzmann, K. LISA mission overview. Adv. Space Res. 2000, 25, 1129–1136. [Google Scholar] [CrossRef]
  13. Luo, Z.-R.; Zhong, M.; Bian, X.; Dong, P.; Dong, Y.; Gao, W.; Li, H.; Li, Y.; Liu, H.; Ran, J.; et al. Mapping Earth’s gravity in space: Review and future perspective. Adv. Mech. 2014, 44, 201408. [Google Scholar]
  14. Nobili, A.M.; Anselmi, A. Relevance of the weak equivalence principle and experiments to test it: Lessons from the past and improvements expected in space. Phys. Lett. A 2018, 382, 2205–2218. [Google Scholar] [CrossRef] [Green Version]
  15. Moe, K.; DeBra, D.B.; Van Patten, R.A.; Moe, M.M.; Oelker, G.; Ruggera, M.B. Exospheric density measurements from the drag-free satellite Triad. J. Geophys. Res. Space Phys. 1976, 81, 3753–3761. [Google Scholar] [CrossRef]
  16. Huang, T.; Lühr, H.; Wang, H.; Xiong, C. The Relationship of High-Latitude Thermospheric Wind with Ionospheric Horizontal Current, as Observed by CHAMP Satellite. J. Geophys. Res. Space Phys. 2017, 122, 12378. [Google Scholar] [CrossRef] [Green Version]
  17. Frappart, F.; Ramillien, G. Monitoring Groundwater Storage Changes Using the Gravity Recovery and Climate Experiment (GRACE) Satellite Mission: A Review. Remote Sens. 2018, 10, 829. [Google Scholar] [CrossRef] [Green Version]
  18. Buchman, S.; Everitt, C.; Parkinson, B.; Turneaure, J.; DeBra, D.; Bardas, D.; Bencze, W.; Brumley, R.; Gill, D.; Gutt, G.; et al. The Gravity Probe B Relativity Mission. Adv. Space Res. 2000, 25, 1177–1180. [Google Scholar] [CrossRef]
  19. Siemes, C. Improving GOCE cross-track gravity gradients. J. Geod. 2017, 92, 33–45. [Google Scholar] [CrossRef] [Green Version]
  20. Flechtner, F.; Morton, P.; Watkins, M.; Webb, F. Status of the GRACE Follow-On Mission; Springer Science and Business Media LLC: Berlin, Germany, 2014; Volume 141, pp. 117–121. [Google Scholar]
  21. Touboul, P.; Métris, G.; Rodrigues, M.; Baghi, Q.; Boulanger, D.; Bremer, S.; Carle, P.; Chhun, R.; Christophe, B.; Cipolla, V.; et al. MICROSCOPE Mission: First Results of a Space Test of the Equivalence Principle. Phys. Rev. Lett. 2017, 119, 231101. [Google Scholar] [CrossRef] [Green Version]
  22. Armano, M.; Audley, H.; Auger, G.; Baird, J.T.; Bassan, M.; Binetruy, P.; Born, M.; Bortoluzzi, D.; Brandt, N.; Caleno, M.; et al. Sub-Femto-gFree Fall for Space-Based Gravitational Wave Observatories: LISA Pathfinder Results. Phys. Rev. Lett. 2016, 116, 231101. [Google Scholar] [CrossRef] [Green Version]
  23. Bernard, A.; Touboul, P. Development of the High Sensitivity GRADIO Accelerometers-The Aristoteles Gradiometer Mission Preparation; NASA STI/Recon Technical Report A; SITEF: Toulouse, France, 1991; Volume 92. [Google Scholar]
  24. Stanga, R.; Marconi, L.; Bagni, G.; Grimani, C.; Vetrano, F.; Viceré, A.; Carbone, L.; Cavalleri, A.; Dolesi, R.; Hueller, M.; et al. Ground based 2DoF test for LISA and LISA PF. J. Phys. Conf. Ser. 2006, 32, 180–185. [Google Scholar] [CrossRef]
  25. Touboul, P.; Foulon, B. Astre Accelerometer: Verification Tests in Drop Tower Bremen, Office National Detudes Etde Recherches Aerospatiales Onera-Publications-Tp. 1996. Available online: http://www.opengrey.eu/item/display/10068/65887 (accessed on 26 April 2020).
  26. Cavalleri, A.; Ciani, G.; Dolesi, R.; Heptonstall, A.; Hueller, M.; Nicolodi, D.; Rowan, S.; Tombolato, D.; Vitale, S.; Wass, P.; et al. A new torsion pendulum for testing the limits of free-fall for LISA test masses. Class. Quantum Gravity 2009, 26, 94017. [Google Scholar] [CrossRef]
  27. Apple, S.M.; Chilton, A.; Olatunde, T.; Bickerstaff, B.; Hillsberry, D.; Parry, S.; Ciani, G.; Mueller, G.; Conklin, J. University of Florida Torsion Pendulum for Testing Key LISA Technology. AIAA Space Astronaut. Forum Expo. 2017, 5138. [Google Scholar] [CrossRef]
  28. Li, G.; Wu, S.C.; Zhou, Z.B.; Bai, Y.Z.; Hu, M.; Luo, J. Design and validation of a high-voltage levitation circuit for electrostatic accelerometers. Rev. Sci. Instrum. 2013, 84, 125004. [Google Scholar] [CrossRef]
  29. Tu, H.B.; Bai, Y.Z.; Zhou, Z.B.; Luo, J. Electrostatic-control performance measurement of the inertial sensor with a torsion pendulum. J. Phys. Conf. Ser. 2009, 154, 012036. [Google Scholar] [CrossRef]
  30. Li, H.-Y.; Qu, S.-B.; Bai, Y.-Z.; Wu, S.-C.; Zhou, Z. Least squares estimation of in-orbit mass center position of the electrostatic accelerometer. Chin. J. Geophys. 2017, 60, 897–902. [Google Scholar]
  31. Gao, S.-M.; Wang, Y.; Li, Y.-P. The Design of Transformer Bridge on Capacitance detection circuit of electrostatic levitation accelerometer. Vac. Cryog. 2017, 23, 297–300. [Google Scholar]
  32. Chen, G.-F.; Huo, H.-Q.; Wang, Z.-L.; Yin, D.; Lei, J.; Zhang, X.-B.; Xi, D. Ground High Voltage Suspension Theory and Applications for Electrostatic Accelerometer. Chin. Space Sci. Technol. 2015, 5, 56–63. [Google Scholar]
  33. Han, F.-T.; Wu, Q.-P.; Dong, J.-X. Displacement detection schemes for electrostatically levitated inertial instruments. J. Chin. Inst. Technol. 2007, 1, 72–76. [Google Scholar]
  34. Wu, L.-M.; Dong, J.-X.; Han, F.-T. Design and experiment of the detection circuit for electrostatically levitated accelerometers. Chin.J. Sci. Instrum. 2006, 12, 1569–1572. [Google Scholar]
  35. Liu, S.; Liu, Y.-F.; Dong, J.-X. Method for resolution estimation of electrostatically euspended accelerometer based on Power Spectrum Density (PSD). Instrum. Tech. Sens. 2015, 10, 30–34. [Google Scholar]
  36. Hu, W.-R.; Wu, Y.-L. The Taiji Program in Space for gravitational wave physics and the nature of gravity. Natl. Sci. Rev. 2017, 4, 685–686. [Google Scholar] [CrossRef]
  37. Josselin, V.; Touboul, P.; Kielbasa, R. Capacitive detection scheme for space accelerometers applications. Sens. Actuators A Phys. 1999, 78, 92–98. [Google Scholar] [CrossRef]
  38. Dietrich, R.; Fox, J.; Lange, W. An electrostatically suspended cube proofmass triaxial accelerometer for electric propulsion thrust measurement. In Proceedings of the 32nd Joint Propulsion Conference and Exhibt, Lake Buena Vista, FL, USA, 1–3 July 1996; Volume 2734. [Google Scholar] [CrossRef]
  39. Silvestrin, P. Control and Navigation Aspects of the New ESA Earth Observation Missions. IFAC Proc. Vol. 2004, 37, 13–24. [Google Scholar] [CrossRef]
  40. Wang, Y.; Qi, K.; Wang, S.; Li, W.; Li, Z.; Wang, Z. Capacitive sensing and electrostatic control system design and analysis with a torsion pendulum. IEEE Access 2020, 8, 1021–1030. [Google Scholar] [CrossRef]
  41. Willemenot, E.; Touboul, P. On-ground investigation of space accelerometers noise with an electrostatic torsion pendulum. Rev. Sci. Instrum. 2000, 71, 302–309. [Google Scholar] [CrossRef]
  42. Zhou, Z.B.; Liu, L.; Tu, H.B.; Bai, Y.Z.; Luo, J. Seismic noise limit for ground-based performance measurements of an inertial sensor using a torsion balance. Class. Quantum Gravity 2010, 27, 175012. [Google Scholar] [CrossRef]
  43. Peterson, J.R. Observations and Modeling of Seismic Background Noise; Open-File Report; U.S. Geological Survey: Reston, VA, USA, 1993. [CrossRef]
  44. Bai, Y.; Li, Z.; Hu, M.; Liu, L.; Qu, S.; Tan, D.; Tu, H.; Wu, S.; Yin, H.; Li, H.; et al. Research and Development of Electrostatic Accelerometers for Space Science Missions at HUST. Sensors 2017, 17, 1943. [Google Scholar] [CrossRef]
Figure 1. Schematic structure of the inertial sensor (IS) system.
Applsci 10 03090 g001
Figure 2. Schematic structures of variable capacitances (a) Single capacitor; (b) The gap change for single capacitor; (c) The gap change for differential capacitor.
Applsci 10 03090 g002
Figure 3. Schematic diagram of the electrode configuration. (a) Electrode arrangement of each axis under the average degree of freedom; (b) Electrode arrangement of each axis under the non-average degree of freedom.
Applsci 10 03090 g003
Figure 4. Flow diagram of the electrostatic actuation.
Applsci 10 03090 g004
Figure 5. Types of electrostatic force voltage configuration. (a) Initial state of the TM; (b) Feedback voltage configuration under the TM translation state; (c) Feedback voltage configuration under the TM rotation state.
Applsci 10 03090 g005
Figure 6. Components of sensitive structure.
Applsci 10 03090 g006
Figure 7. Components of an electrode housing.
Applsci 10 03090 g007
Figure 8. Schematic of the capacitor bridge.
Applsci 10 03090 g008
Figure 9. Schematic of the torsion pendulum facility. (a) The main components of the torsion pendulum facility; (b) Two-dimensional space non-coupling motion mechanism.
Applsci 10 03090 g009
Figure 10. Measurement system.
Applsci 10 03090 g010
Figure 11. The results of the control capability.
Applsci 10 03090 g011
Figure 12. Position resolution power spectral density (PSD) of the capacitance sensor.
Applsci 10 03090 g012
Figure 13. Acceleration resolution PSD of non-sensitive axis channel.
Applsci 10 03090 g013
Table 1. Design parameters of the sensitive structure.
Parameter ContentValueTolerance
TM size40 mm × 40 mm × 6.4 mm±0.002 mm
TM weight42 g±1 g
Spacer thickness6.64 mm±0.001 mm
Distance between TM and EH120 μm±0.003 mm
Area of electrode X1473.56 mm20.2%
Area of electrode X2236.98 mm20.2%
Area of electrode X3236.86 mm20.2%
Table 2. Capacitances and inductances list.
ElementValueComment
C1, C253 pFEquilibrium value
Cp1, Cp21058 pFError: 10%
Cb1, Cb21 nFError: 10%
L1, L2, Ls4.5 mHError: 8%
Table 3. Circuit parameter list.
ParameterValue
Bias Voltage Vp5 V
Effective value of sensing voltage Vd4 V
Frequency of sensing voltage100 kHz
Peak of feedback voltage±10 V
Table 4. Related parameters list.
ParameterValueComment
ε r 1Relative permittivity
ε 0 8.85 × 10 12   F / m Vacuum dielectric constant
T 293 KEnvironment temperature
δ T 0.1   K / Hz 1 / 2 Temperature fluctuation
A 947.4 mm2Area of electrode X1, X2, X3
δ A 0.2%Deviation of electrode area
d 120 μmDistance between TM and EH
P 4 × 10 5   Pa Degree of vacuum
m 42 gMass of TM
ζ 5 × 10 5 Coupling coefficient between TM and EH
δ E max 10 6   m / s 2 / Hz 1 / 2 Environmental maximum possible noise
l 0.55 mSuspension wire length
δ V p 1 × 10 5   V / Hz 1 / 2 Bias voltage fluctuation
δ V d 2 × 10 5   V / Hz 1 / 2 Sensing voltage fluctuation
δ V f 8 × 10 6   V / Hz 1 / 2 Feedback voltage fluctuation
V f 10 VPeak of the feedback voltage
δ x 7.2 × 10 11   m / Hz 1 / 2 Position measurement noise
Table 5. Acceleration noise act on the TM (unit:   m / s 2 / Hz 1 / 2 ).
AxisThermal GradientEarth PulsationElectrode Parallelism ErrorElectrode Area AsymmetryDetection NoiseDrive NoiseTotal
X1.5 × 10−101 × 10−65 × 10−113.6 × 10−126.8 × 10−103.9 × 10−91 × 10−6