Article

A Simplified Method for Assessing the Response of RC Frame Structures to Sudden Column Removal

by
Valerio De Biagi
1,2,*,
Foad Kiakojouri
1,3,
Bernardino Chiaia
1,2 and
Mohammad Reza Sheidaii
3
1
Department of Structural, Geotechnical and Building Engineering, Politecnico di Torino, 10129 Torino, Italy
2
SISCON Centre for the Safety of INfrastructures and CONstructions, Politecnico di Torino, 10129 Torino, Italy
3
Department of Civil Engineering, Urmia University, Urmia 5756151818, Iran
*
Author to whom correspondence should be addressed.
Appl. Sci. 2020, 10(9), 3081; https://doi.org/10.3390/app10093081
Submission received: 3 April 2020 / Revised: 24 April 2020 / Accepted: 27 April 2020 / Published: 28 April 2020
(This article belongs to the Special Issue Structural Reliability of RC Frame Buildings)

Abstract

:
Column loss is a type of damage that can occur in frame structures subjected to explosions or impacts. The response of such structures largely depends on the capacity of the assembly of elements and on the inertia effects due to the sudden nature of the phenomenon. Frame structures are able to develop various resisting mechanisms that prevent the collapse to progress. The assessment of the robustness often requires complex and detailed numerical modelling. For the preliminary design of a robust frame, simplified methods to assess the effectiveness of the redistribution of the loads after the removal of a member are welcome. In the present paper, an approach based on the idealisation of the damaged structure into a single degree-of-freedom system with an elastic-plastic compliance law is proposed. The output of the method is the dynamic response of a target point, which can serve for assessing the residual safety of the structure. Comparing the obtained results with the outputs of a more sophisticated FE (Finite Elements) analysis, a satisfying accuracy is found.

1. Introduction

The effect of localised damage on frame structures is an open problem in structural engineering. Many studies on progressive collapse presuppose that an initial damage occurs on the structure. Various approaches can be followed to assess the damage tolerance of a structure [1,2]. Nonlinear analyses accounting for second-order effects and large displacements are usually adopted for assessing the robustness of the structure [3], which usually undergoes plastic deformations. The duration of the damage, that is, the triggering of the progressive collapse, can last from few milliseconds, in case of an explosion, to several years, say, in the case of chemical corrosion.
Sudden column loss is a dynamic removal phenomenon that can emerge right after explosions or impacts. The response of a structure to sudden column loss can be numerically simulated by adding an extra downward load, accounting for the removed element, to the remaining building [4,5,6,7]. From a dynamical point of view, it was found that column removal time is insignificant for rise time smaller than 10 ms [8,9,10], that is, it can be considered instantaneous. Similarly, it was found both that a rise time smaller than 1/10 of the vibration period of the structure does not affect its dynamic response [11,12]. Thus, the response to sudden load application represents an upper bound in terms of displacements [13]. The study of the behaviour of frame structures under such type of events may require sophisticated numerical analysis accounting for material and geometric non-linearities.
As proved by the large literature available on the topic, many issues are still open and simple rules to design a robust structure are hard to find. This paper deals with a simplified approach to obtain the maximum dynamic displacement of a reinforced concrete frame structure subjected to sudden column removal. The behaviour of such structures is non-trivial since the resisting mechanisms that arise in a damaged frame structure are various and have been recently addressed by experimental [14,15,16,17] and numerical papers [18,19,20,21]. Compressive arch action provides an additional capacity to the flexural mechanism at small deformations, while catenary effects activate for large deformation, preventing the collapse to progress. The proposed methods consists in two tools. The former refers to the possibility to create a synthetic model that simulates the behaviour of the frame subjected to the damage. The structure can be modelled through an equivalent single degree of freedom (SDOF) system [22,23] since its response to a sudden load mainly depends on its vertical vibration mode. The latter accounts for the fact that the application of a dynamic load produces a response in term of displacement, say u d y n , that is larger than the one that can be obtained applying the same force in a quasi-static loading process, u s t [24]. To study such effect, the dynamic amplification factor (DAF) is adopted as a metrics of the dynamic effect, that is,
D A F = u d y n u s t .
The value of the parameter is largely dependent on the rise time [25]; in elastic systems subjected to a step load the DAF is equal to 2. On the contrary, the value can be larger in inelastic systems [26,27,28].
In the following, the basics of the modeling of column loss are presented and the synthetic SDOF system is described (Section 2. Thanks to the dimensional analysis approach, the relevant quantities that affect the response of the system to the damage are defined. The simplified approach for the analysis of the damaged frame is then detailed (Section 3). An example on a three storey-four column RC frame is proposed (Section 4) and the accuracy of the results is discussed (Section 5).

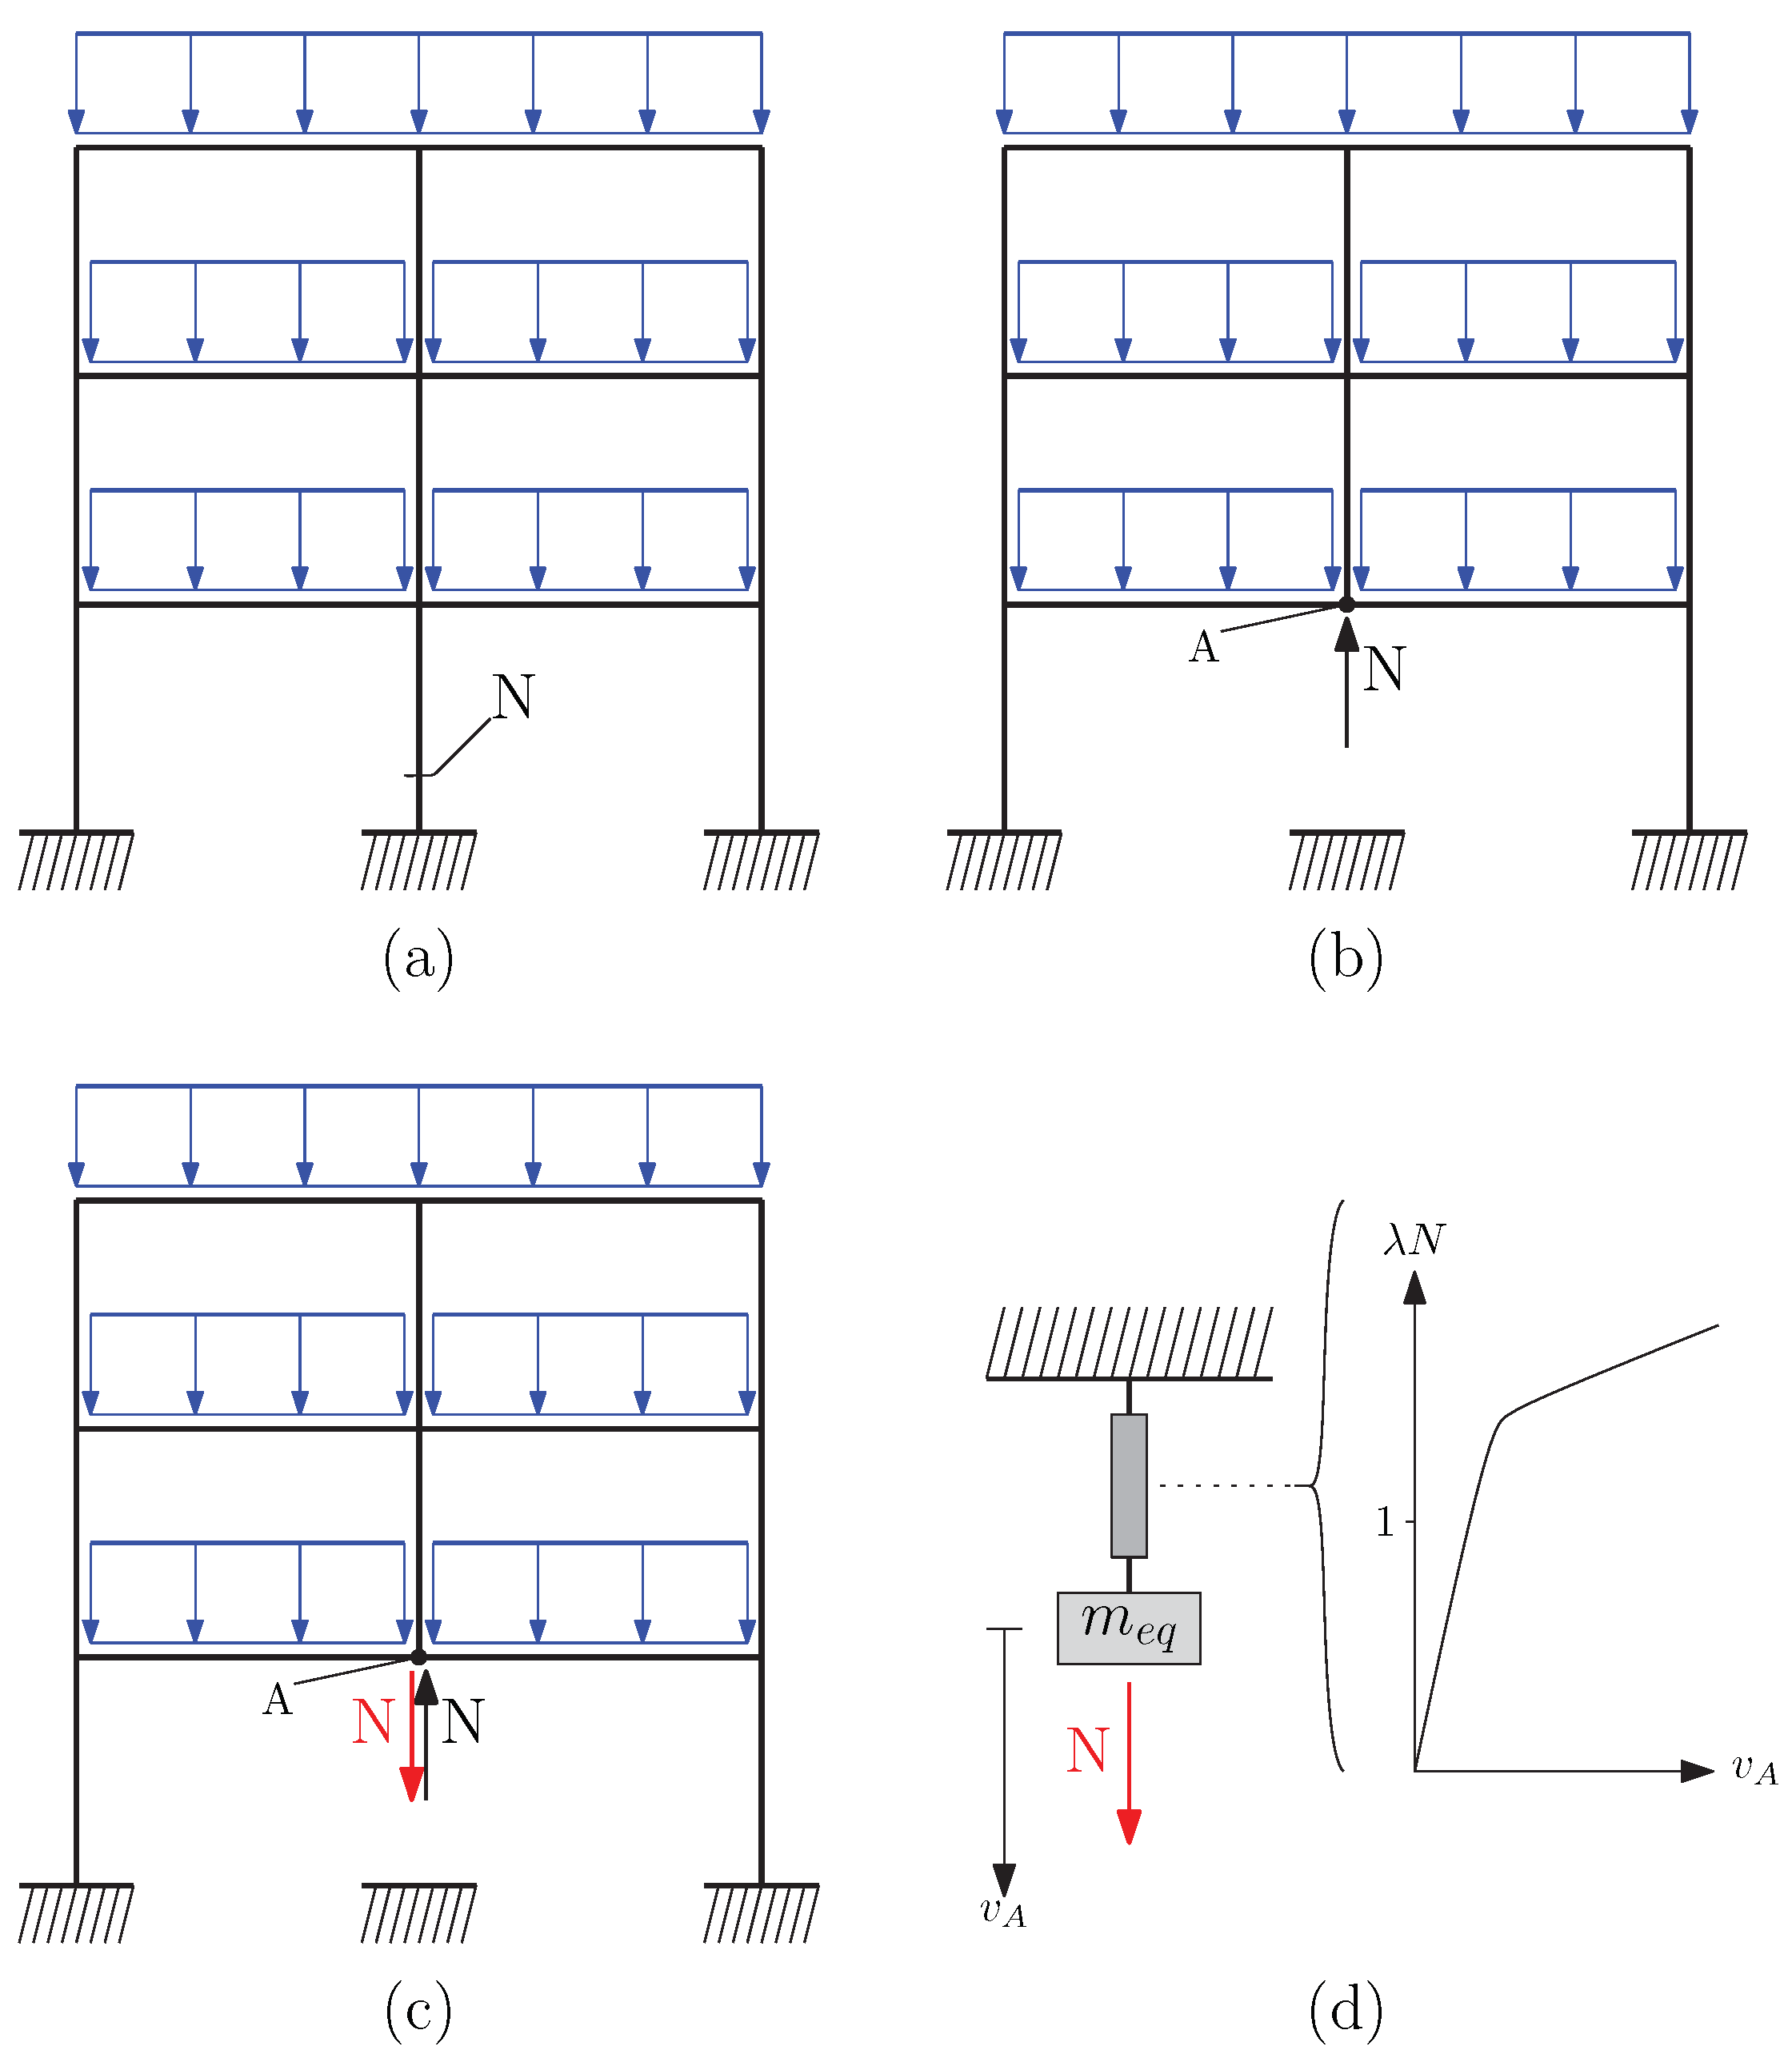
2. Modelling Sudden Column Removal on Frame structures

This section deals with the modelling of column removal. Among the various approaches proposed in the literature [12,29], a simple model consisting of the summation of reaction forces is proposed for the present study. The approach, recalled from a previous publication of the authors [1], consists in three steps as sketched in Figure 1. As soon as the removed element is identified, the internal forces within the element are evaluated through a linear analysis of the undamaged loaded structure, as it behaves elastically during the majority of its expected life. For sake of simplicity, let us suppose that only axial compression force acts in the column, thus the normal force N is evaluated, see Figure 1a. Then, the selected element is removed and a nodal force, namely a replacement force, is applied at the top end of the column, that is, at the control node A. The force is equal (but opposite) to the internal force computed the the previous step, Figure 1b. This modification does not vary the structural response of the frame since the solution can be superimposed on linear elastic systems. Finally, in the last step, a sudden downward force of magnitude equal to N, is applied at the node and the nonlinear dynamic response of the system is measured, Figure 1c. The response of the frame structure under the sudden downward force can be studied through various numerical techniques [30].
Among the possible displacements of the control node A, with the aim of simplified analysis, the vertical downward displacement is concerned, only. Thus, the behaviour of the frame structure in the last step of the analysis previously illustrated can be described by means of an equivalent single degree of freedom system, as depicted in Figure 1d. The behaviour of the connector relates to the structural behaviour of the frame along the vertical direction once subjected to a downward vertical force at the control node A. Thus, connector law is determined by performing a nonlinear static incremental analysis on the frame subjected to an increasing vertical force applied at the control node. Referring to Figure 1c, this results in an incremental analysis with a load multiplier parameter λ applied to the red vertical downwards force N. It is important to note that, when the incremental analysis is performed, the black upwards N force is still acting on the frame.
As a result, for λ = 1 the reaction force of the removed column and the applied force are equal and opposite, thus the effect of the former is null, resulting in the complete removal of the column. In the incremental analysis, all the resisting mechanisms of a statically indeterminate structure, say the alternate load path due to the redistribution of the loads across the members [31], rise. The resulting λ -v curve, Figure 1d, would highlight the presence of an initial elastic stage into which all the members are subjected to allowable stresses. For a given load multiplier ( λ 1 ) plastic hinges would form and an overall hardening-like phase would be observed on the compliance law. The analysis should extend to the maximum allowable displacement, or to the overall failure of the frame.

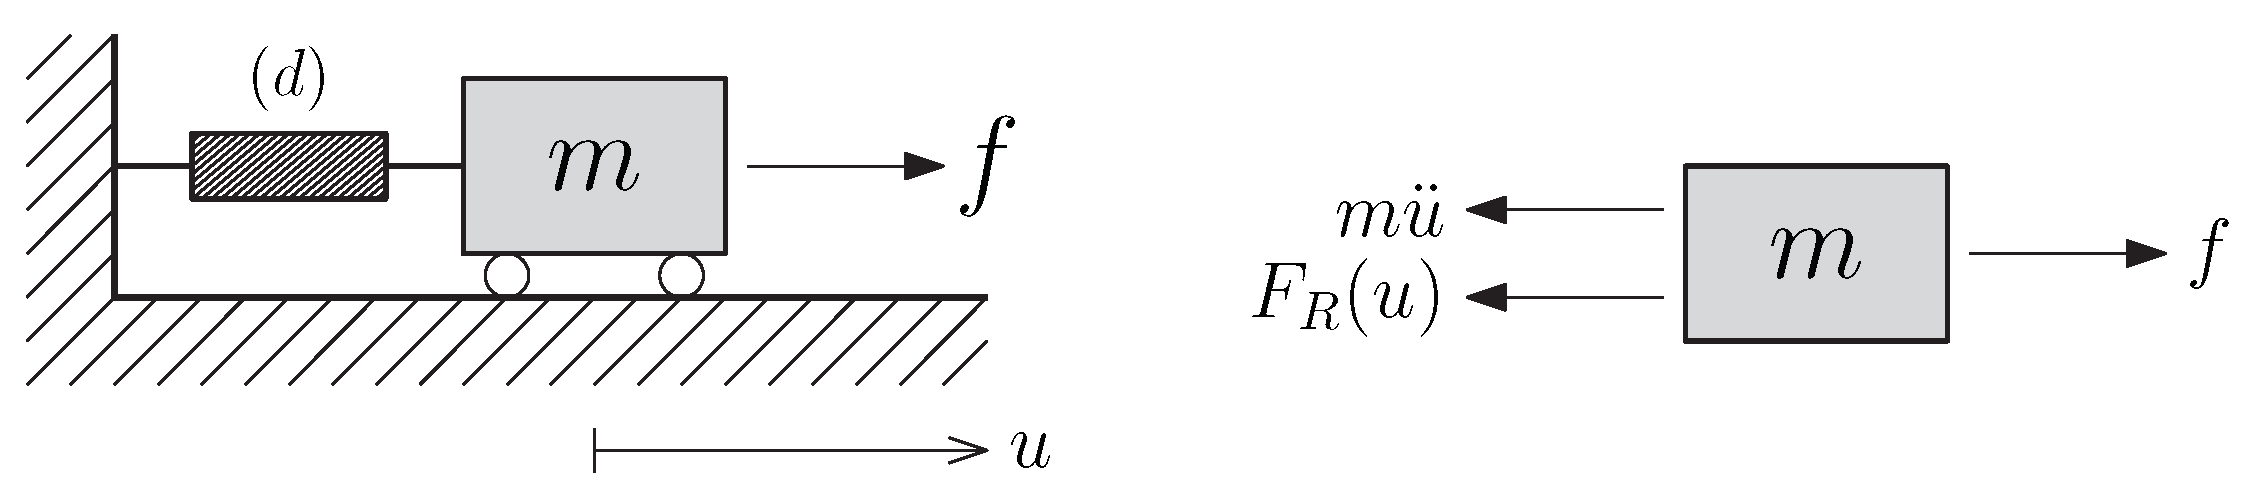
2.1. Maximum Dynamic Response of the System

From the previous considerations, it results that the dynamic response of the system can be studied through the synthetic system. To study the effect of the connector law, the general dynamics of a system consisting of a mass m connected to a fixed support through a device with a nonlinear behaviour (Figure 2) is briefly illustrated. The system is subjected to a sudden force f. The derivation of the solution of the dynamic equilibrium equation of each phase is reported in Appendix A. It is supposed that the damping is null since it has been proved that it does not influences the maximum response of the damaged system [32].
The nonlinear connector has an elastic-plastic behaviour. This is the simplest, but most recurrent, trend that can be observed in the incremental analysis previously described. Recalling the classical notations of structural mechanics, the following stages result in a suddenly loaded system (Figure 3):
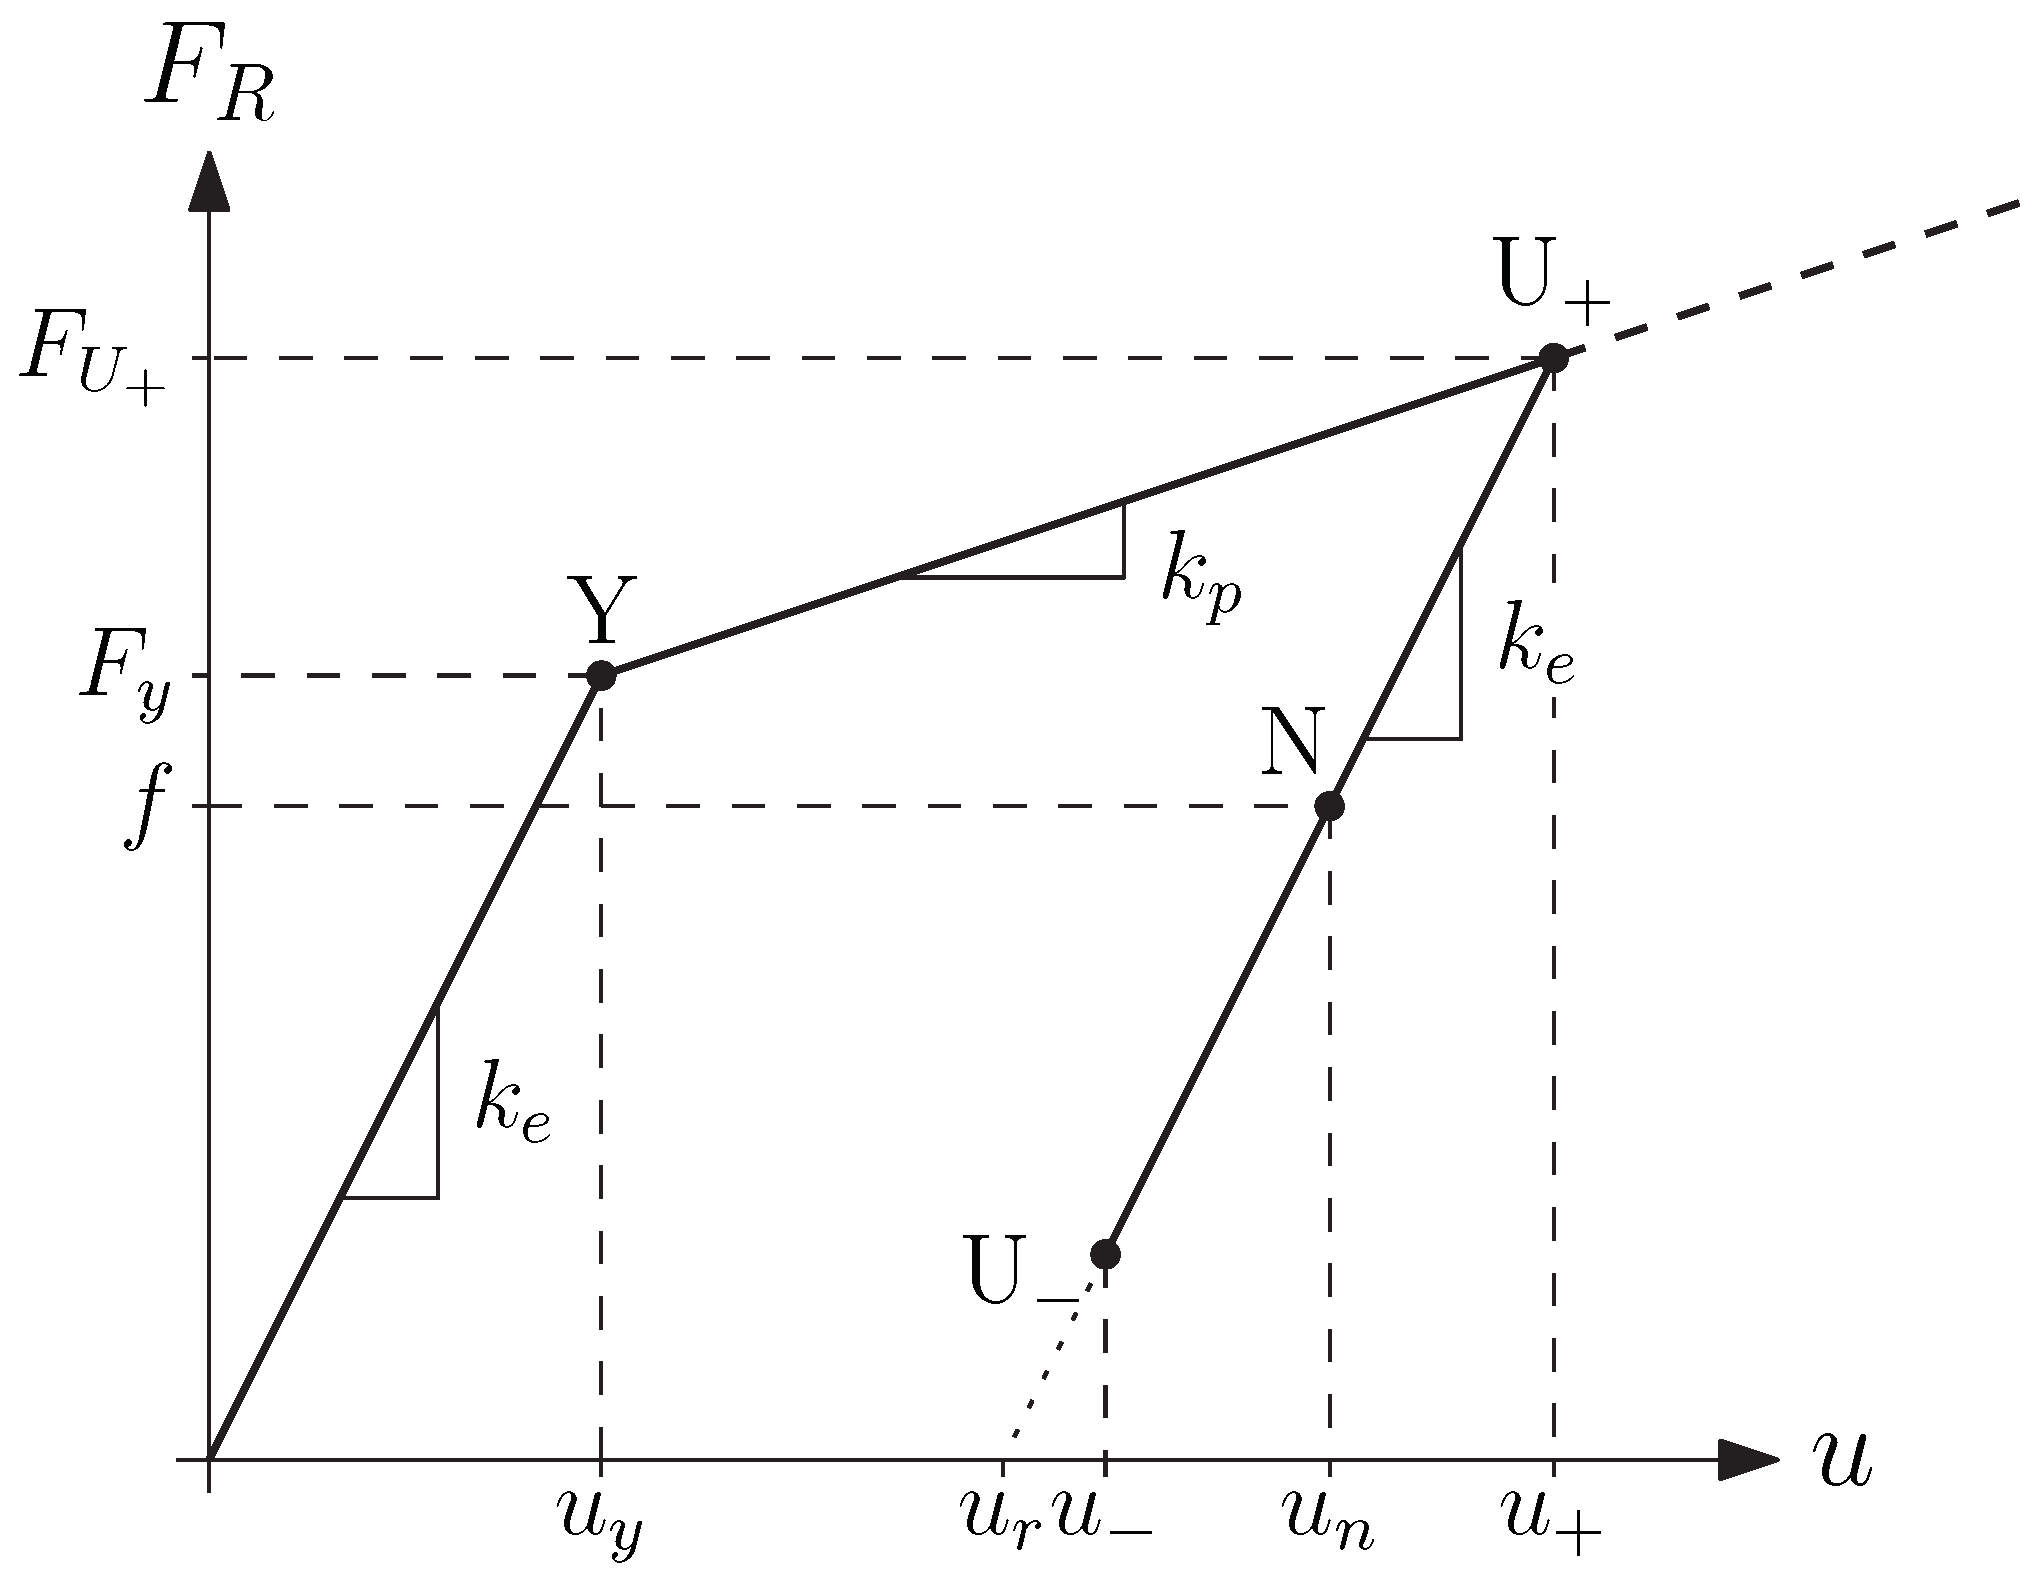
  • a linear elastic phase with tangent stiffness k e . This phase ends at a yielding force F y , corresponding to a displacement u y = F y / k e ;
  • a hardening phase with plasticity. The tangent stiffness of this phase has tangent stiffness k p . The system increases its displacement up to u + , when its velocity is null;
  • the unloading follows a linear elastic law with tangent stiffness equal to k e .
If undamped, the system oscillates around and equilibrium position u n .

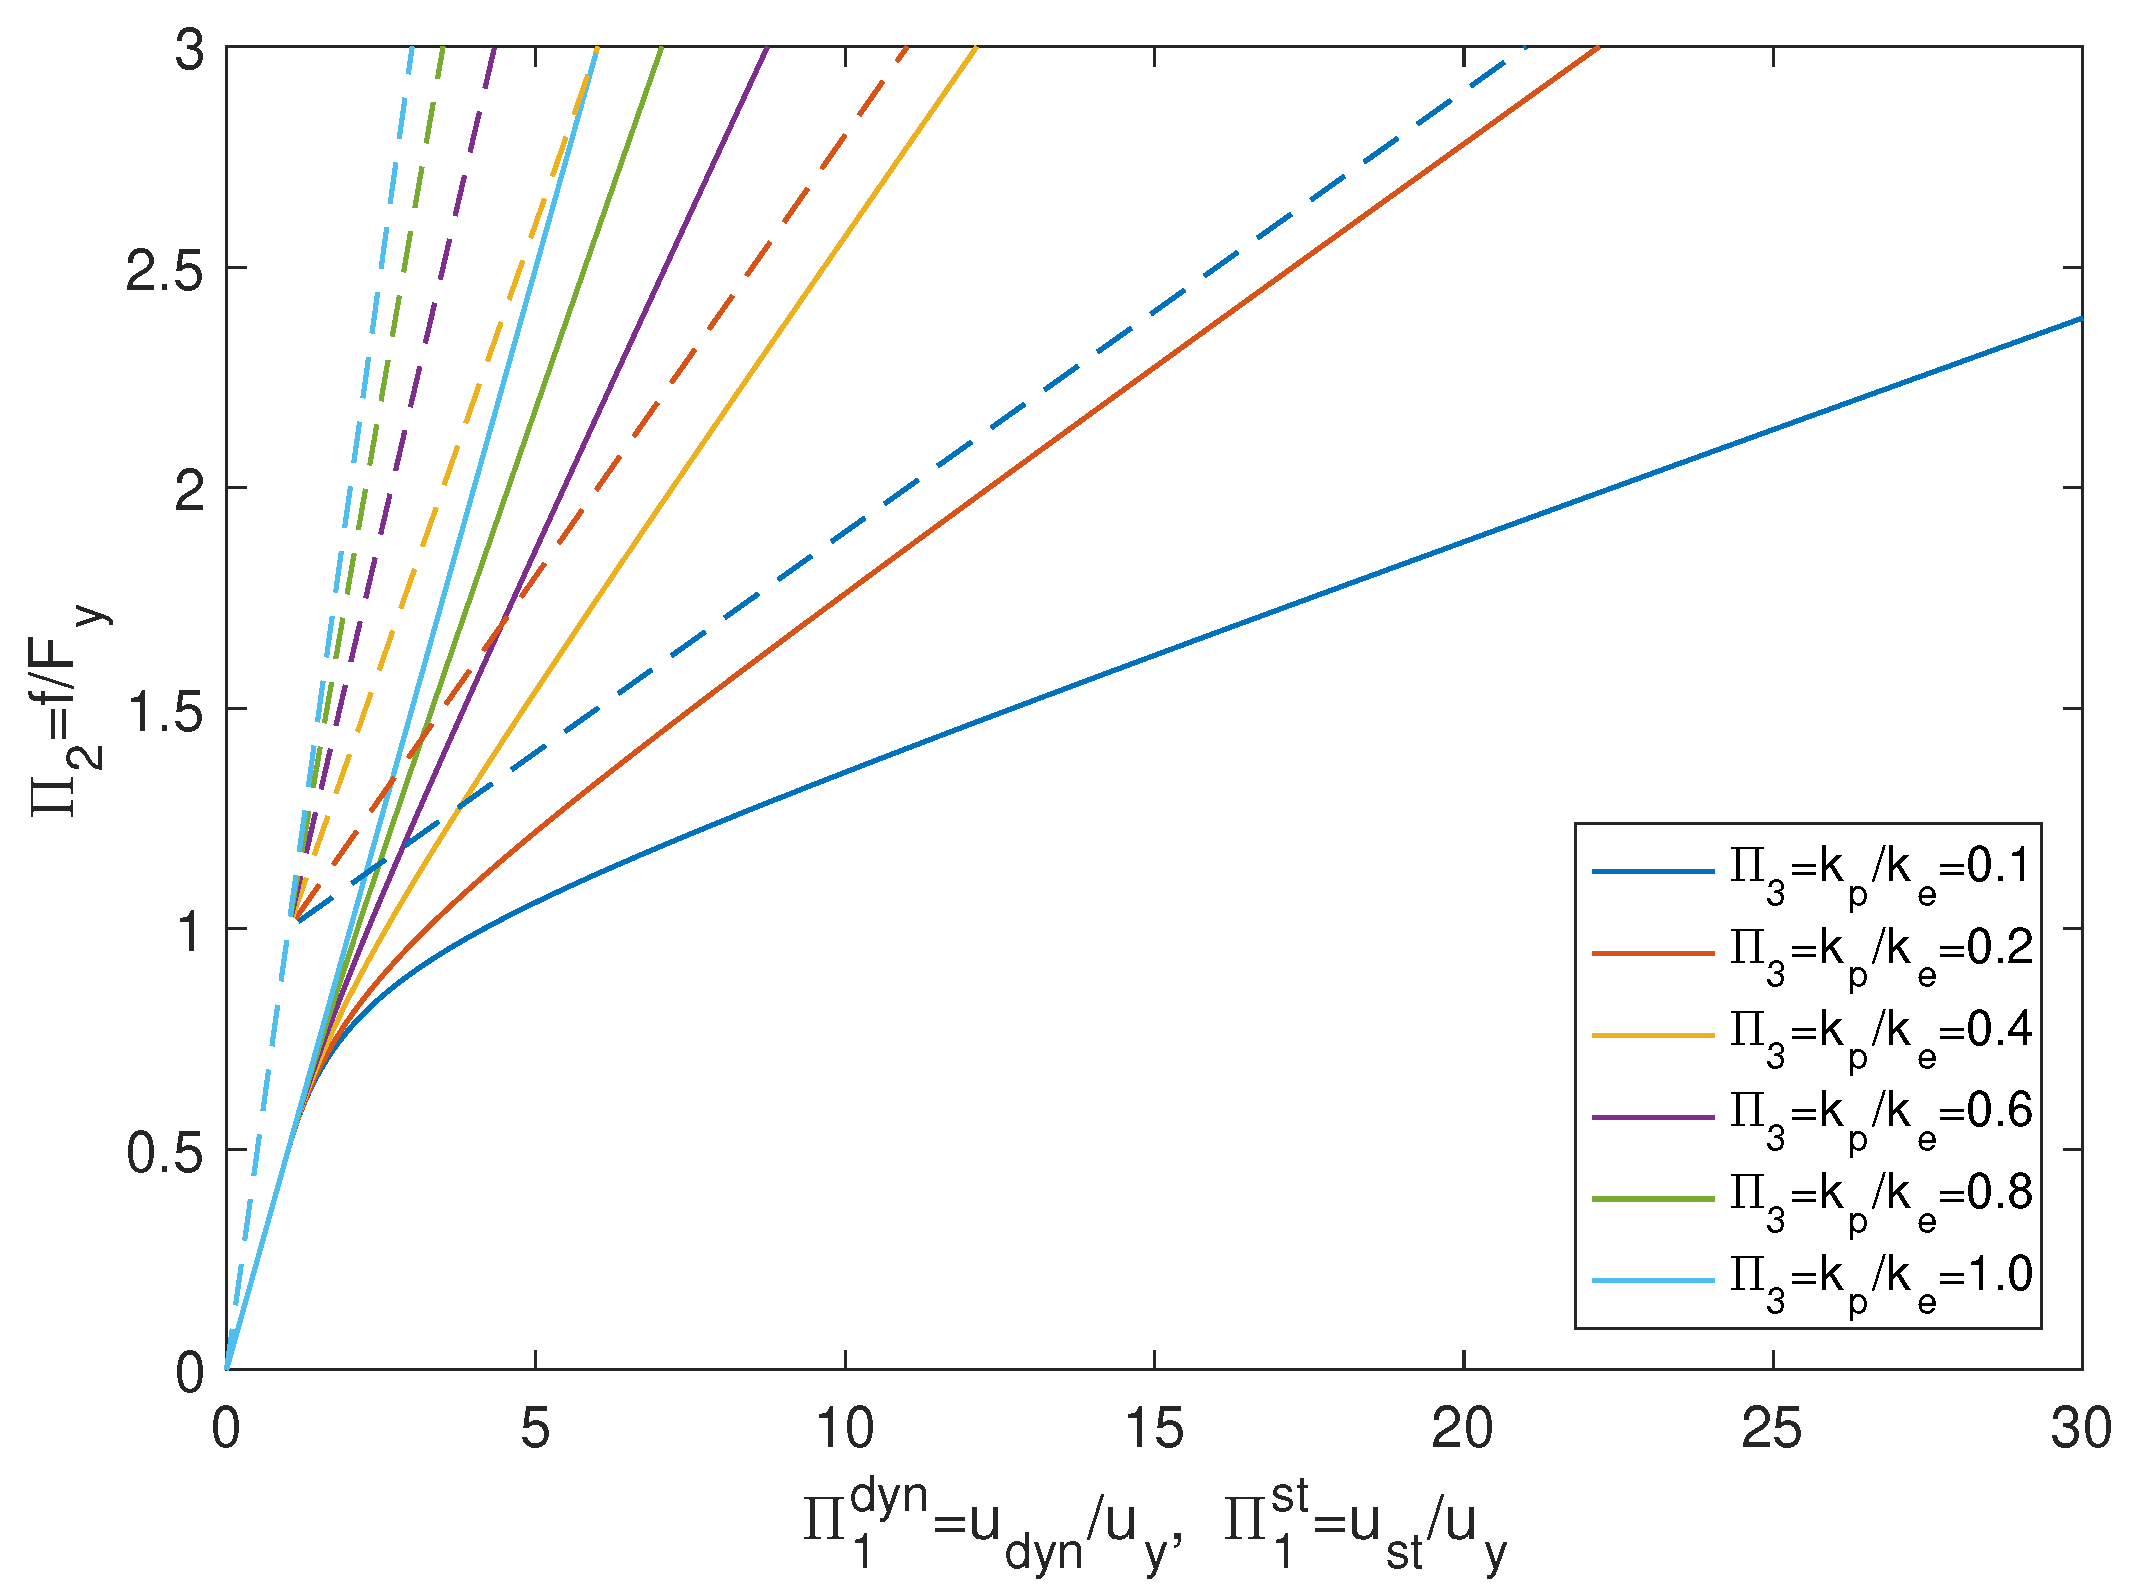
2.2. Dimensional Analysis for the Dynamic Phase of the Sudden Damage

Many quantities determine the behaviour of the previously described SDOF system. With the aim to study the effects of the connector law on the dynamic response, a general approach is required. The main variable of interest is represented by the maximum elongation of the device, that is, the maximum vertical displacement in the frame structure subjected to the sudden column removal. This quantity was previously identified as u + and can be considered in engineering terms as the dynamic response of the system subjected to a sudden load. For this reason, in the following, this term is recalled as u d y n = u + .
The value of u d y n depends on many parameters: the yielding force, F y , the applied force, f, the mass, m, the tangent stiffnesses of the elastic, k e , and the plastic with hardening, k p , rules. In general, u d y n can be written as
u d y n = φ F y , f , m , k e , k p ,
where φ · is the solution of the dynamic problem illustrated in the appendix. A dimensional analysis approach was adopted to investigate the influence of the parameters on the maximum displacement. This technique is a mathematical tool that serves for identifying the relationships that describe the physical phenomena [33]. With respect to the previous Equation (2), u d y n represents the dependent variable, while the remaining are the independent terms. Following the principle of dimensional homogeneity, Equation (2) can be rewritten using Buckingham’s Π -theorem [34,35]. Three base dimensions, that is, the length L , the mass M and the time T are needed to define the six dependent and independent variables. Hence, it results u d y n L , F y M L T 2 , f M L T 2 , m M , k e M T 2 , and k p M T 2 . According to Buckingham’s theorem, Equation (2) can be contracted to
Π 1 d y n = Φ Π 2 , Π 3 ,
where Π i ( i = 1 , 2 , 3 ) are dimensionless quantities, which number is equal to the number of variables appearing in Equation (2), that is, 6, minus the number of base dimensions, that is, 3. The Π i terms are obtained by identifying among the six variables three repeating terms and using these to turn the remaining into dimensionless quantities. The repeating variables must have independent dimensions, that is, any product between them cannot be dimensionless. In the present approach, the mass m, the elastic stiffness k e and the yielding force F y were chosen as repeating variables. Therefore, the resulting three Π i terms were Π 1 d y n = u d y n k e / F y , Π 2 = f / F y , and Π 3 = k p / k e . Considering that the displacement at yielding is u y = F y / k e , for a SDOF system with elastic-plastic with hardening rule, the governing equation is
u d y n u y = Φ f F y , k p k e .

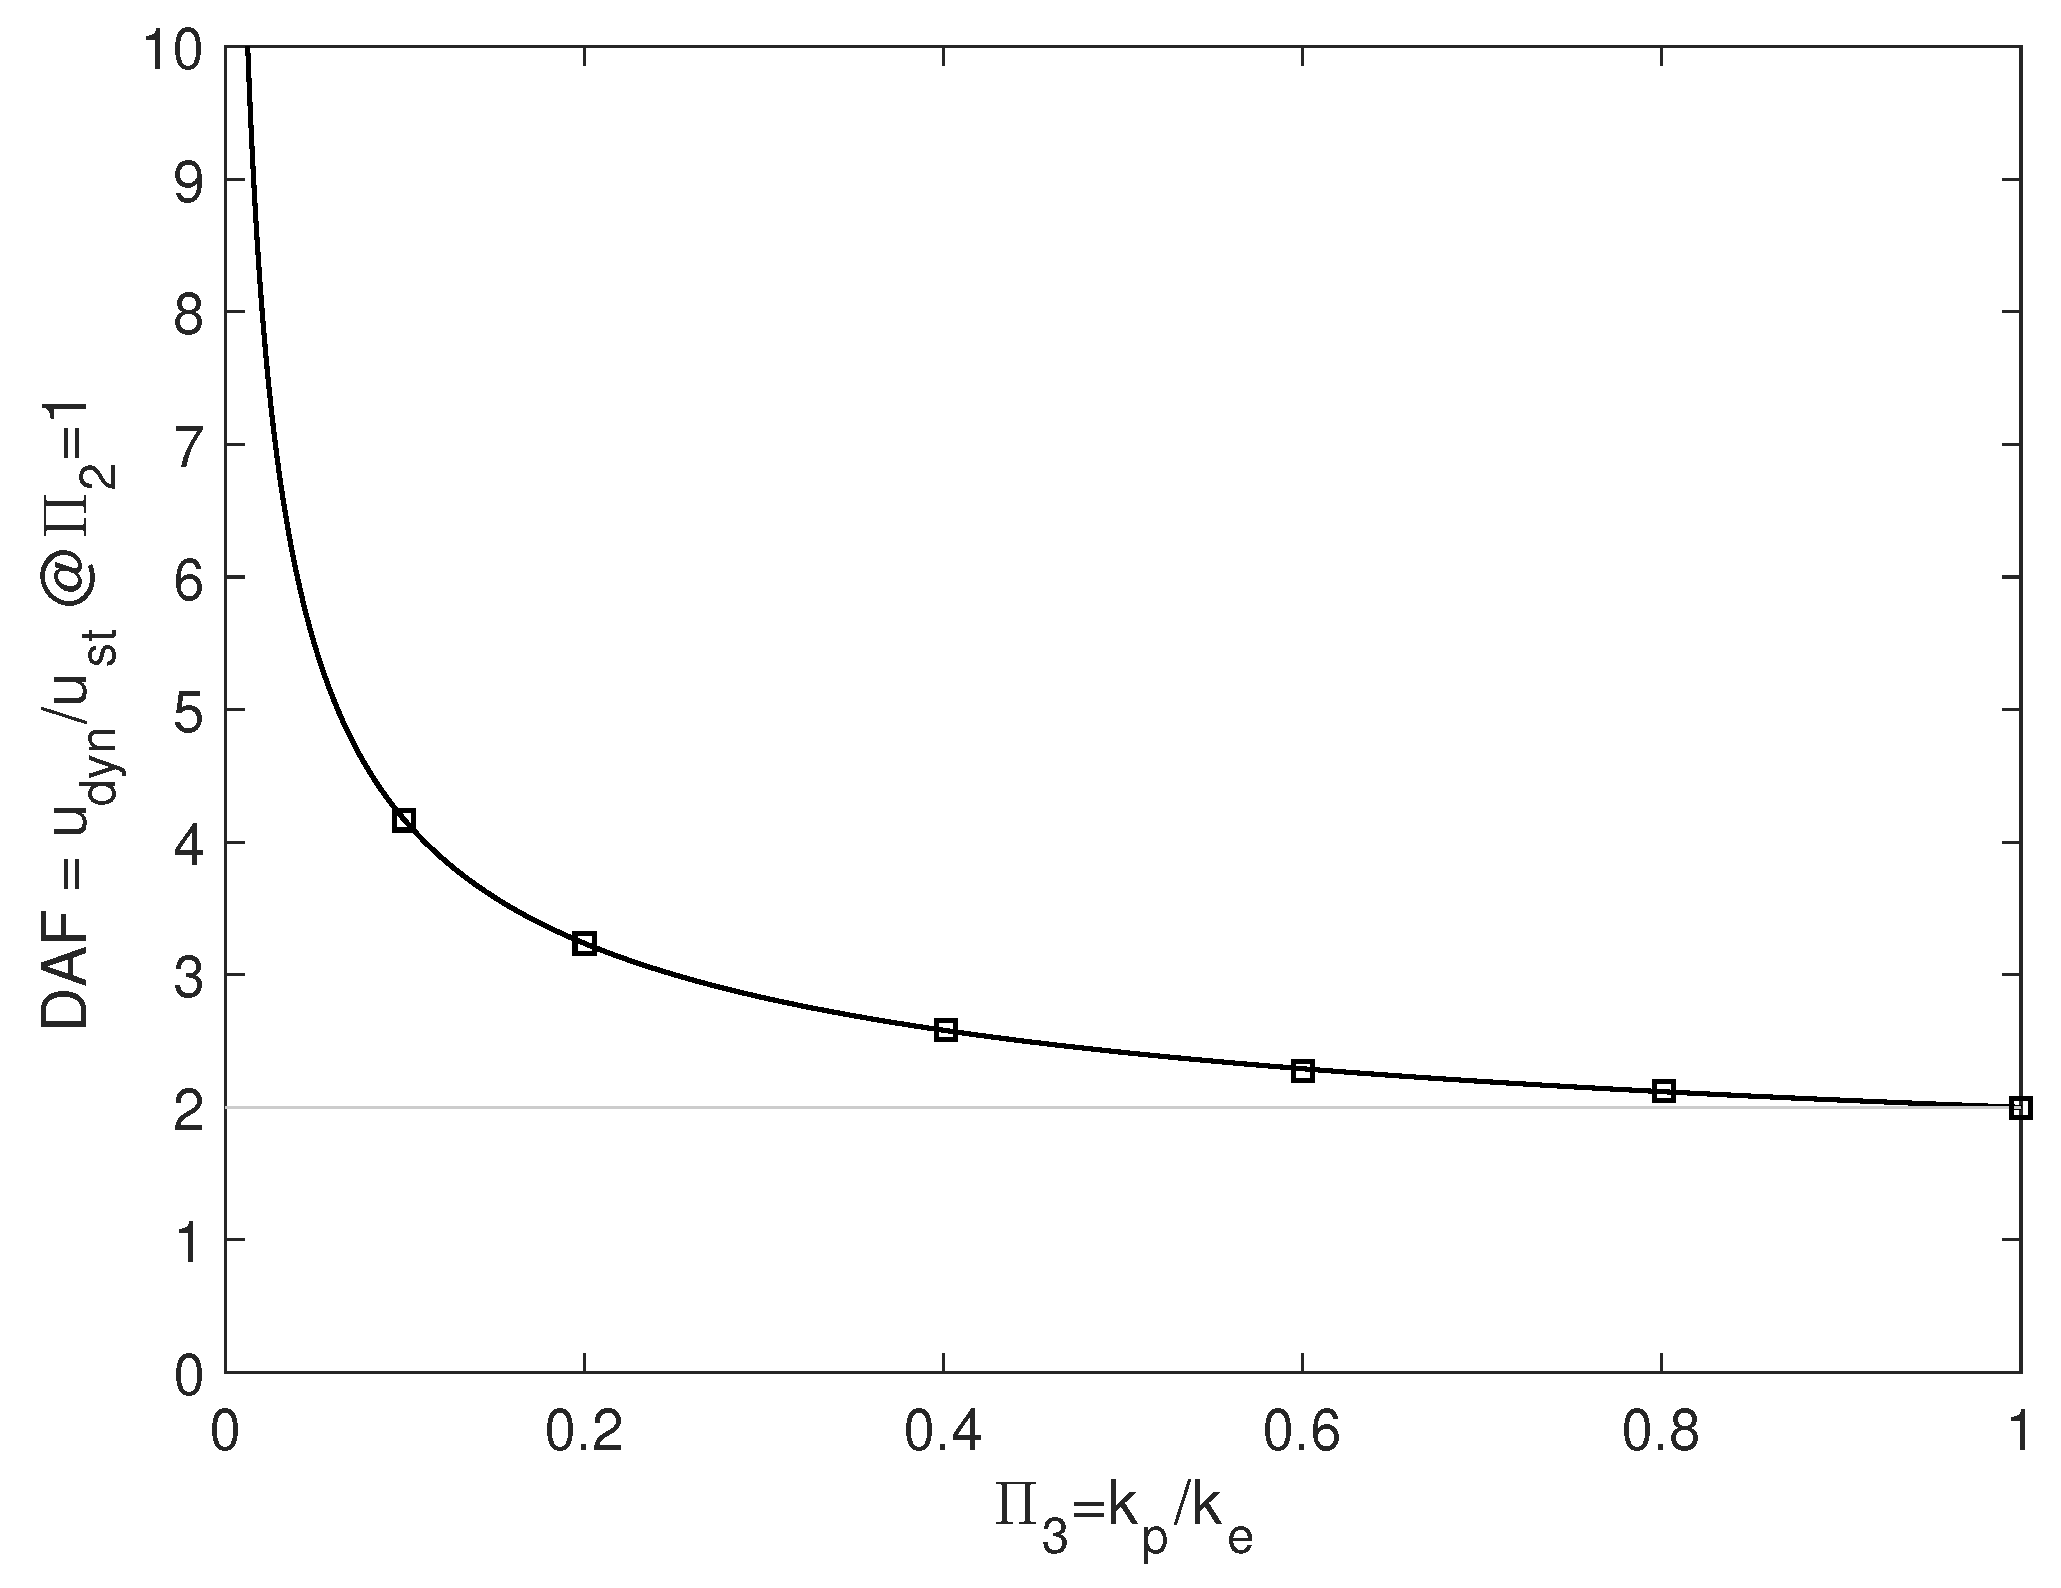
2.3. Dynamic Amplification Factor (DAF)

The maximum dynamic displacement u d y n of the SDOF system was computed through the expressions reported in Appendix A assigning an arbitrary value to the repeating variables, for example, m = 1 kg, k e = 1 N/m and F y = 1 N. The solution was implemented into a Matlab script consists in applying, in the order, Equations (A3), (A4), (A9), (A10), (A12), and, finally, Equation (A8). The displacement due to quasi-static loading of the system was determined as
u s t = f k e f F y u y + f F y k p f > F y . .
The dimensionless displacement was computed for both the dynamic analysis, Π 1 d y n , and the quasi-static loading Π 1 s t = u s t / u y . Figure 4 depicts the relationship between normalised displacements, forces and ratios between tangential stiffnesses. Observing the dashed curves, related to the quasi-static loading process, the elastic-plastic law of the connecting device clearly emerges. The curves as f / F y = 1 and diverges for larger forces depending on the hardening stiffness. On the contrary, the continuous curves accounting for the dynamics of the system show a different behaviour, diverging for f / F y > 0 . 5 .
The dynamic amplification factor was computed as
D A F = Π 1 d y n Π 1 s t = u d y n u s t .
Figure 5 reports the DAF for various dimensionless external forces Π 2 and stiffnesses ratios Π 3 . It is shown that for systems with an elastic-plastic characteristics the D A F 2 . In particular, the well-known value D A F = 2 occurs if k p = k e , that is, the system can be though as pure elastic. The dynamic amplification factor for elastic-plastic with hardening systems increases for f > F y / 2 and has a peak for f = F y . This is due to the fact that the mass has its maximum velocity at u y , when the system turns from elastic to plastic, resulting in the maximum discrepancy between the dynamic and the quasi-static maximum displacements. A decreasing trend of the DAF curves is observed for f > F y . They asymptotically tend to 2 for large f / F y ratios since the plastic phase is predominant if f F y , that is, the restoring force in the device depends on the tangent stiffness k p .
Figure 6 plots the maximum values of the dynamic amplification factor, DAF, for f = F y , that is, Π 2 = 1 , where the peaks in Figure 5 were observed. The maxima curve has a vertical asymptote for Π 3 = 0 corresponding to k p = 0 , that is, an elastic perfectly plastic system. As observed, the maximum DAF is 2 for k e = k p .

3. Proposed Method for the Simplified Analysis

As a result of the previous sections, it results that the dynamic behaviour of the equivalent system is ruled by parameters of the compliance curve, namely, the tangent stiffnesses, the force in the removed element and the yielding force of the system. As emerges in Equation (4), the equivalent mass of the SDOF oscillator is not needed to estimate its maximum dynamic displacement u d y n . Besides, mass information is required if the force is not applied instantaneously.
The proposed method consists in computing a compliance law and applying the dimension-less analysis to estimate the dynamic amplification factor, DAF. The analysis is performed with respect to reinforced concrete planar frame structures, for which a quick and preliminary assessment is required. The proposed approach is based on the following assumptions: the frame has regular bays geometry, that is, the widths of the bays are (at least across the considered column) equal; the concrete beams have equal capacity and ductility properties for all the floors (at least across the considered column); following column removal, the damage propagates on the frame structure through a zipper-type progressive collapse mode [36] which can be idealised with the formation of plastic hinges at both ends of the beams spanning from the considered column, as sketched in Figure 7a. The procedure consists in the following steps:
1.
the capacity and the ductility properties of the beams are assessed and a bending moment-curvature (BM- χ ) relationship is obtained. The bending moment at yielding, M y , and the ultimate bending moment, M u , and the corresponding kinematic quantities, χ y and χ u , are considered as representative for the behaviour of the concrete cross-section;
2.
the axial force, N , acting in the removed column is computed considering the loads applied on its tributary area, that is, half of the dead and live loads each beam plus the weight of the upper columns.
3.
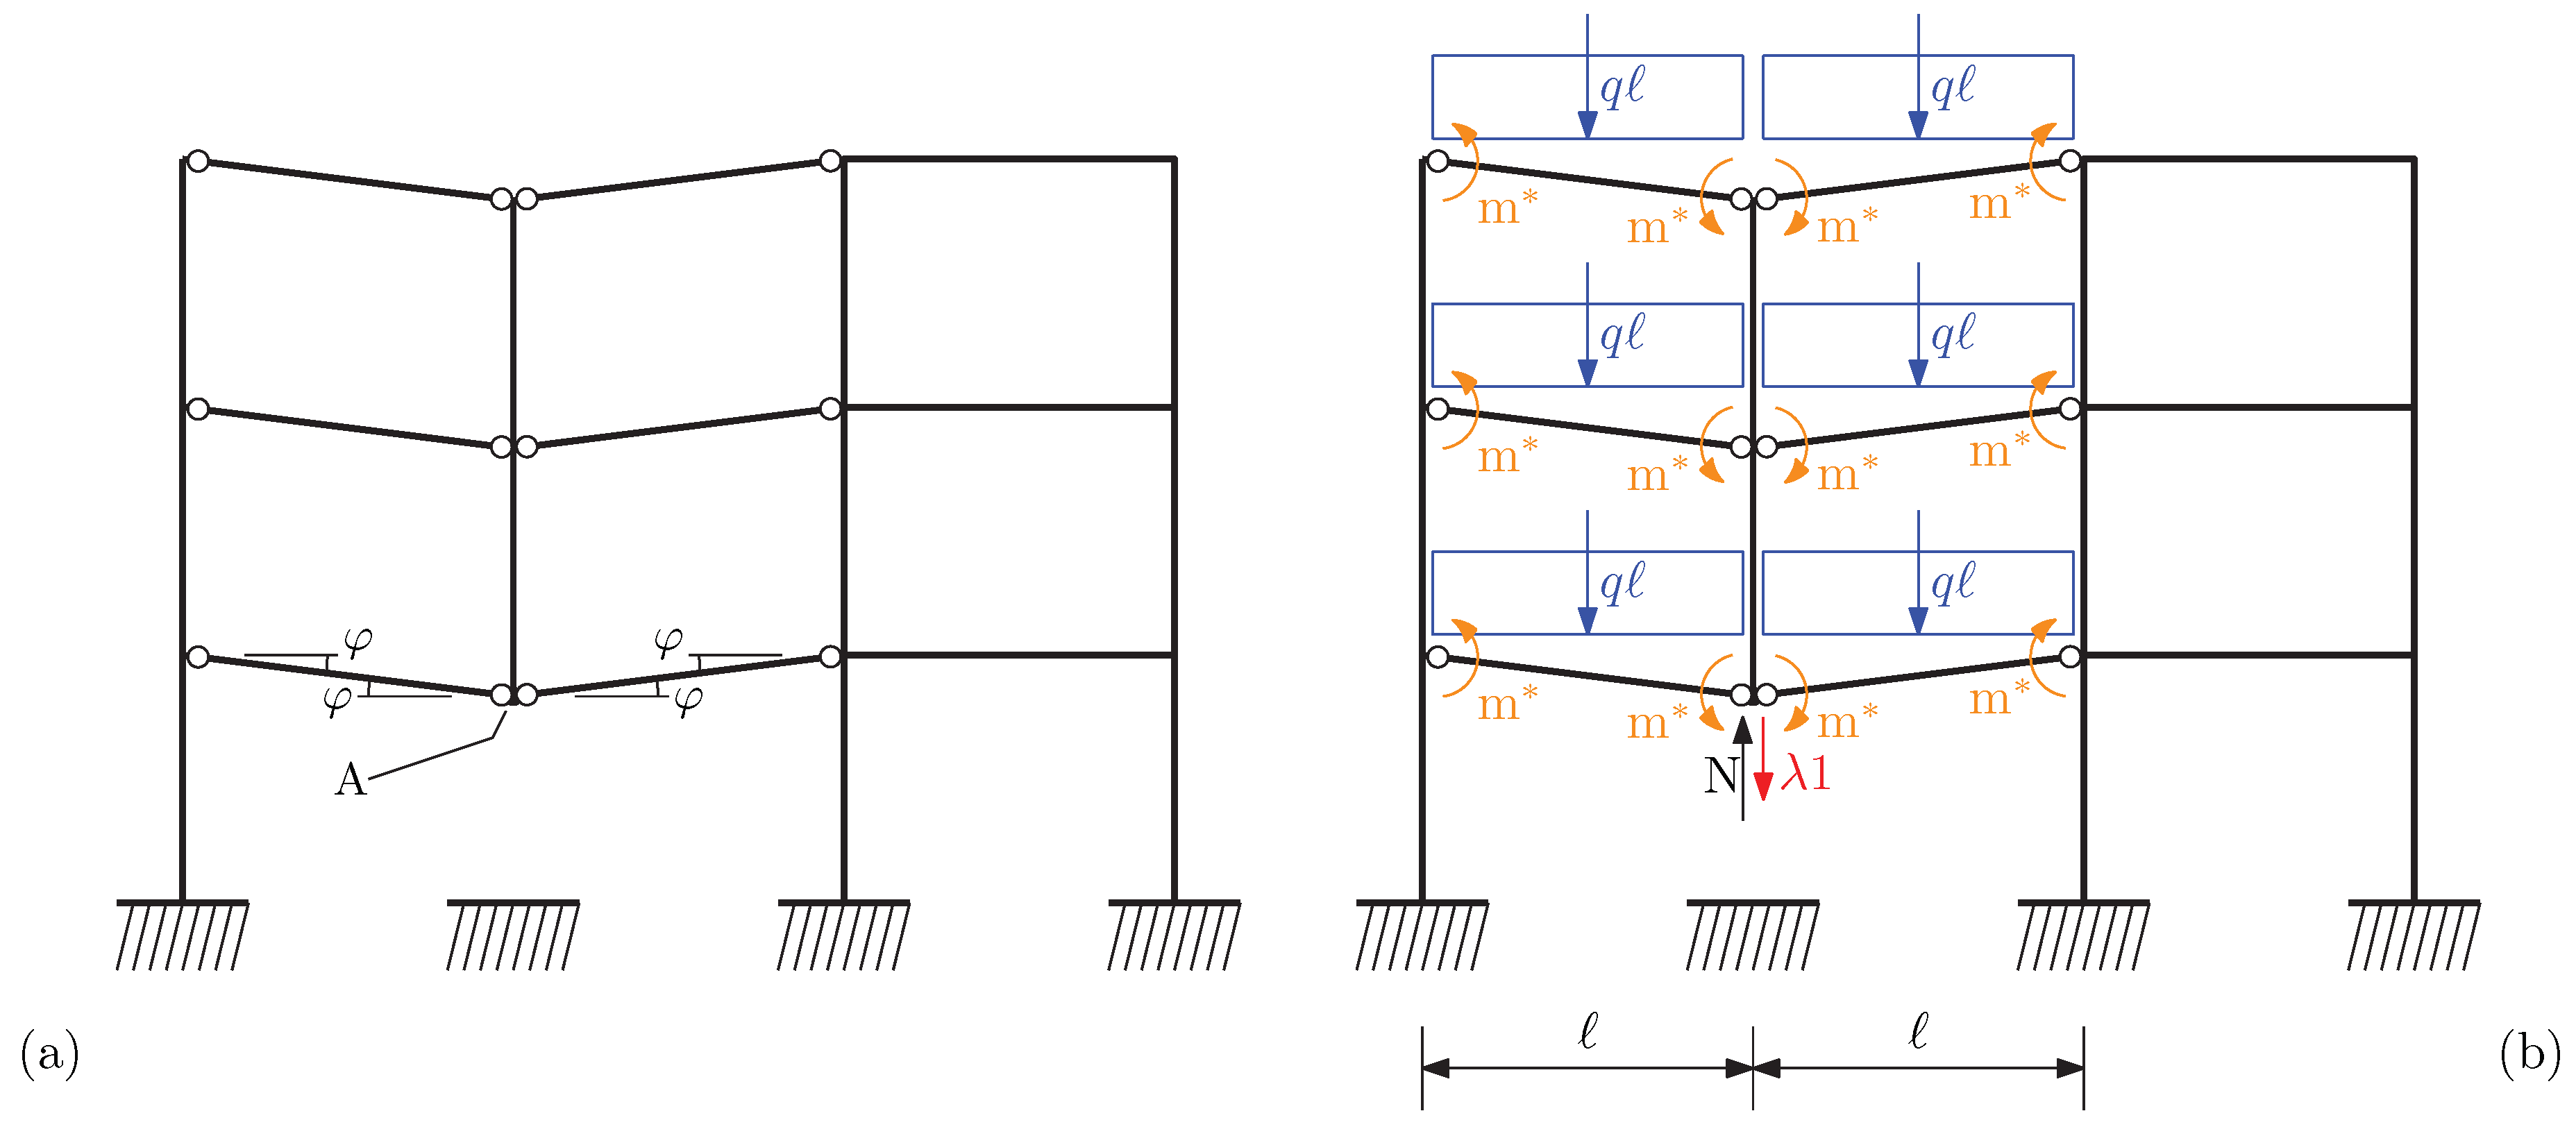
the mechanism that originates following column removal is studied and the upper bound theorem of the plastic analysis is applied. With reference to Figure 7b, the replacement axial force N previously computed is inserted in the mechanism as an upward force located in A; bending moments m * are applied in the plastic hinges. A downward variable force, that is, column removal force, λ 1 is inserted in A. The value of λ for which the virtual work principle (VWP) holds defines an upper bound collapse load, λ m * [37];
4.
the chord rotation of beams ends, θ * , is computed and an approximate downward displacement of node A is obtained as δ * = θ * ;
5.
the compliance curve is built repeating points 3. and 4. considering the yielding and ultimate capacities of the beams. The yielding force, F y , is computed through the load multiplier λ M y and the corresponding displacement, δ y , through the chord rotation at yielding, θ y . A similar approach is required for the ultimate point, that is, for F u and δ u . The tangent stiffnesses in the elastic and in the plastic with hardening part of the curve are evaluated as
k e = F y δ y k p = F u F y δ u δ y ;
6.
the displacement due to a quasi-static column removal process is evaluated as
u s t = N k e .
The dimensionless quantities Π 1 , Π 2 and Π 3 are computed and the dynamic amplification factor is evaluated following the steps reported in Appendix A;
7.
the maximum dynamic displacement is computed as u d y n = D A F u s t .
The approach can be adapted from middle to side sudden column removal accounting for the actions deriving from a different tributary area. The mechanisms that originates still considers that plastic hinges form in the beams, where the whole rotation is assumed to occur. Thus, the column stays vertical, and, implicitly, in the elastic stage. This simplification allows to derive the vertical displacement as δ * = θ * .

4. An Example

The proposed method was applied on a test structure consisting in a three storey-four columns frame with interstorey height equal to 3 m and beams length equal to 4 m. The 400 mm × 400 mm square columns are longitudinally reinforced with 4 ϕ 20 bars in the corners and 8 ϕ 16 bars along the sides and transversely reinforced with ϕ 10 stirrups 100 mm-spaced. The 300 mm-deep rectangular beams are 500 mm wide and reinforced with 4+4 ϕ 16 bars and ϕ 10 stirrups 100 mm-spaced. Yield stress and Young’s modulus of the reinforcement steel are 500 MPa and 200 GPa, respectively; the concrete is ascribed to C25/30 class according to Eurocode 2 [38]. The frame is subjected to a 10 kN/m live load; beam and column linear weights are 3.60 kN/m and 3.84 kN/m, respectively. Figure 8 sketches the frame and identifies the suddenly removed middle column at the bottom floor. The top end of the removed element is set as the control node and its vertical displacement as the control displacement. The steps of the simplified method are proposed in reference to the enumerated list reported in Section 3.
1.
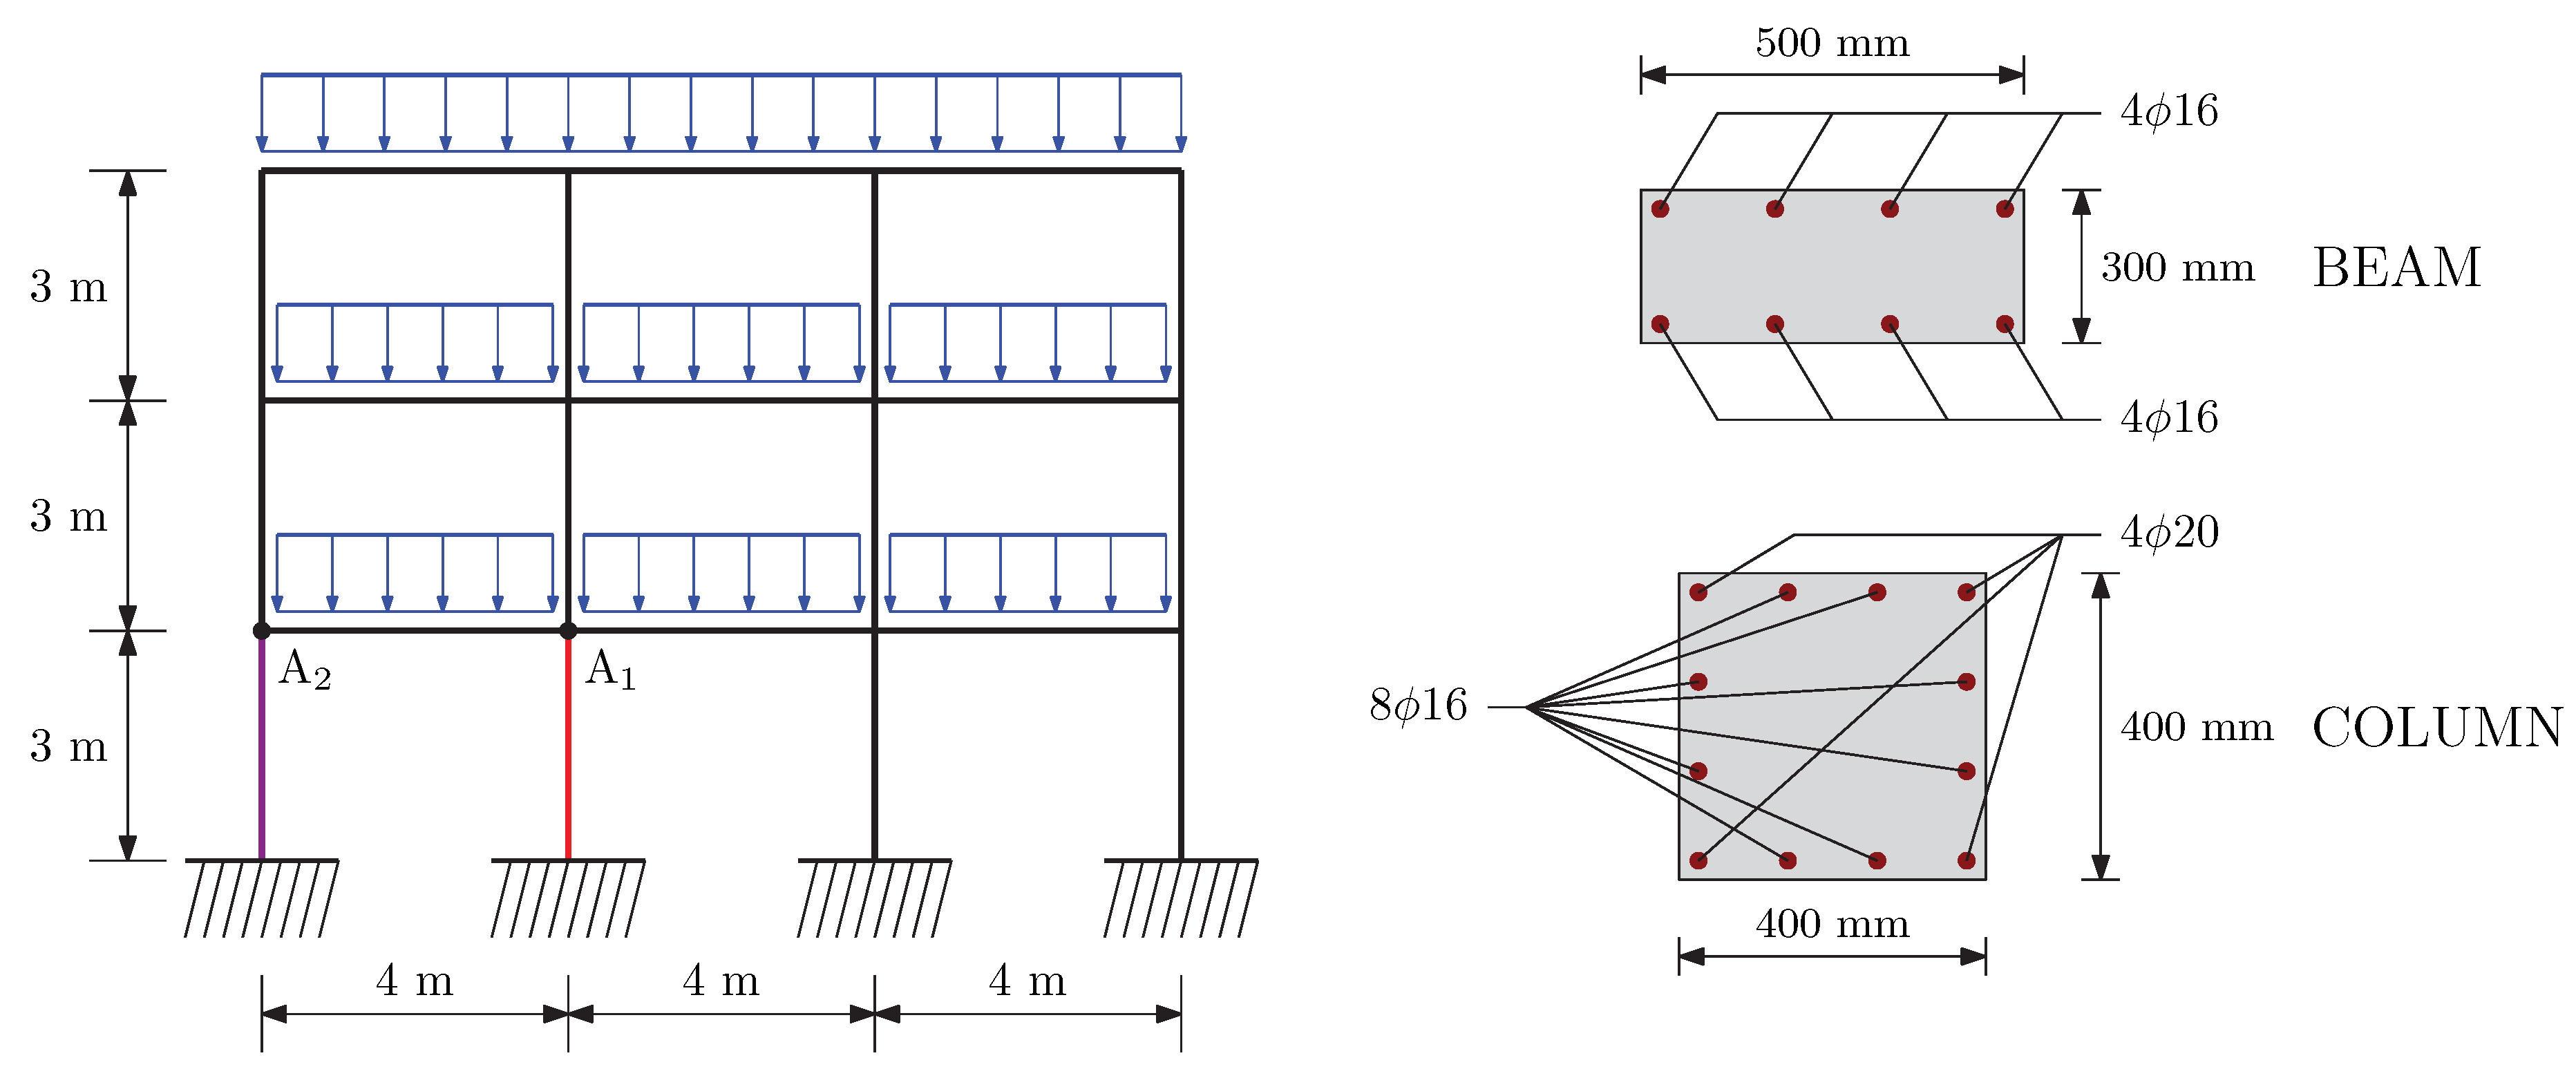
The analytical model proposed by Park and Paulay [39] was adopted for the evaluation of the bending moments and the corresponding curvatures. It results a bending moment at yielding equal to M y = 94 . 5 kNm and a curvature equal to χ y = 1 . 18 × 10 2 m 1 . Referring to the ultimate capacity, it follows that at the ultimate concrete compressive strain, ε c u = 0 . 0035 , the compression steel is not yielding. The ultimate bending moment and curvature are M u = 102 . 8 kNm and χ u = 8 . 16 × 10 2 m 1 , respectively.
2.
The axial force in the selected column was evaluated considering the tributary area of the column, that is, half length of the beam. The force results from the following expression
N = n f D L + L L + g b w c n f + g c n f 1 h ,
where D L and L L are the dead and the live loads, respectively, g b and g c are the linear weights of beam and column, respectively, is the length of the beam, h is the interstorey height, n f is the number of floors and w c is the width of the column. For the present example, the axial force is N = 181 . 9 kN.
3.
The upper bound theorem of the plastic analysis was applied and the load multiplier that defines the collapse load λ m * is determined as
λ m * = 1 4 n f m * + N n f D L + L L + g b w c g c n f 1 h .
Substituting the values of the yielding and the ultimate bending moments it results λ M y = 283 . 5 and λ M u = 308 . 5 , respectively.
4.
The chord rotation of beams end were computed through the analytical models proposed in the Italian Building Code [40,41] for an equivalent cantilever: the elastic rotation is due to an elastic curvature increasing from zero (at the free end of the cantilever) to χ y (at the opposite end); the plastic curvature, that is, χ u χ y , is kept constant on the plastic hinge length [42]. According to the aforementioned approach, chord rotation at yielding is θ y = 0 . 01112 radians, while ultimate chord rotation is equal to θ u = 0 . 03117 radians. The corresponding downward displacements are δ y = 44 mm and δ u = 125 mm.
5.
The bilinear compliance curve is derived from the data previously obtained. It results F y = 283 . 5 kN and F u = 308 . 5 kN. Thus, the tangent stiffnesses in the elastic and the hardening phase are computed through Equations (7), resulting in k e = 6,443,181 N/m and k p = 311,482 N/m.
6.
the displacement due to a quasi-static column removal process was computed through Equation (8) as u s t = 28 . 4 mm. The displacement at yielding to be inserted in the dimensionless quantities computed at the following point is u y = δ y = 44 mm.
7.
The dimensionless quantities were computed according to Section 2.2 as
Π 2 = N F y = 0 . 640 Π 3 = k e k p = 0 . 049
from which Π 1 d y n = 1 . 379 is computed. Referring to the dimensionless static displacement, it results Π 1 s t = 0 . 640 .
8.
The dynamic amplification factor is
D A F = 1 . 379 0 . 640 = 2 . 155 ,
from which it results u d y n = 61 . 3 mm.

Special Case: Side Column Removal

The formulae proposed in the previous section refer to the removal of a middle column. With reference to the violet removed beam represented in Figure 8, a side column removal is analysed in the following. The approach is similar to the middle column removal case and the hypothesis that plastic hinges are located in the beams holds. Hence, Equation (9) can be rewritten as
N = n f D L + L L 2 + g b w c 2 n f + g c n f 1 h .
Similarly, the expression of the load multiplier of Equation (10) turns into
λ m * = 1 2 n f m * + N n f D L + L L + g b w c 2 g c n f 1 h .

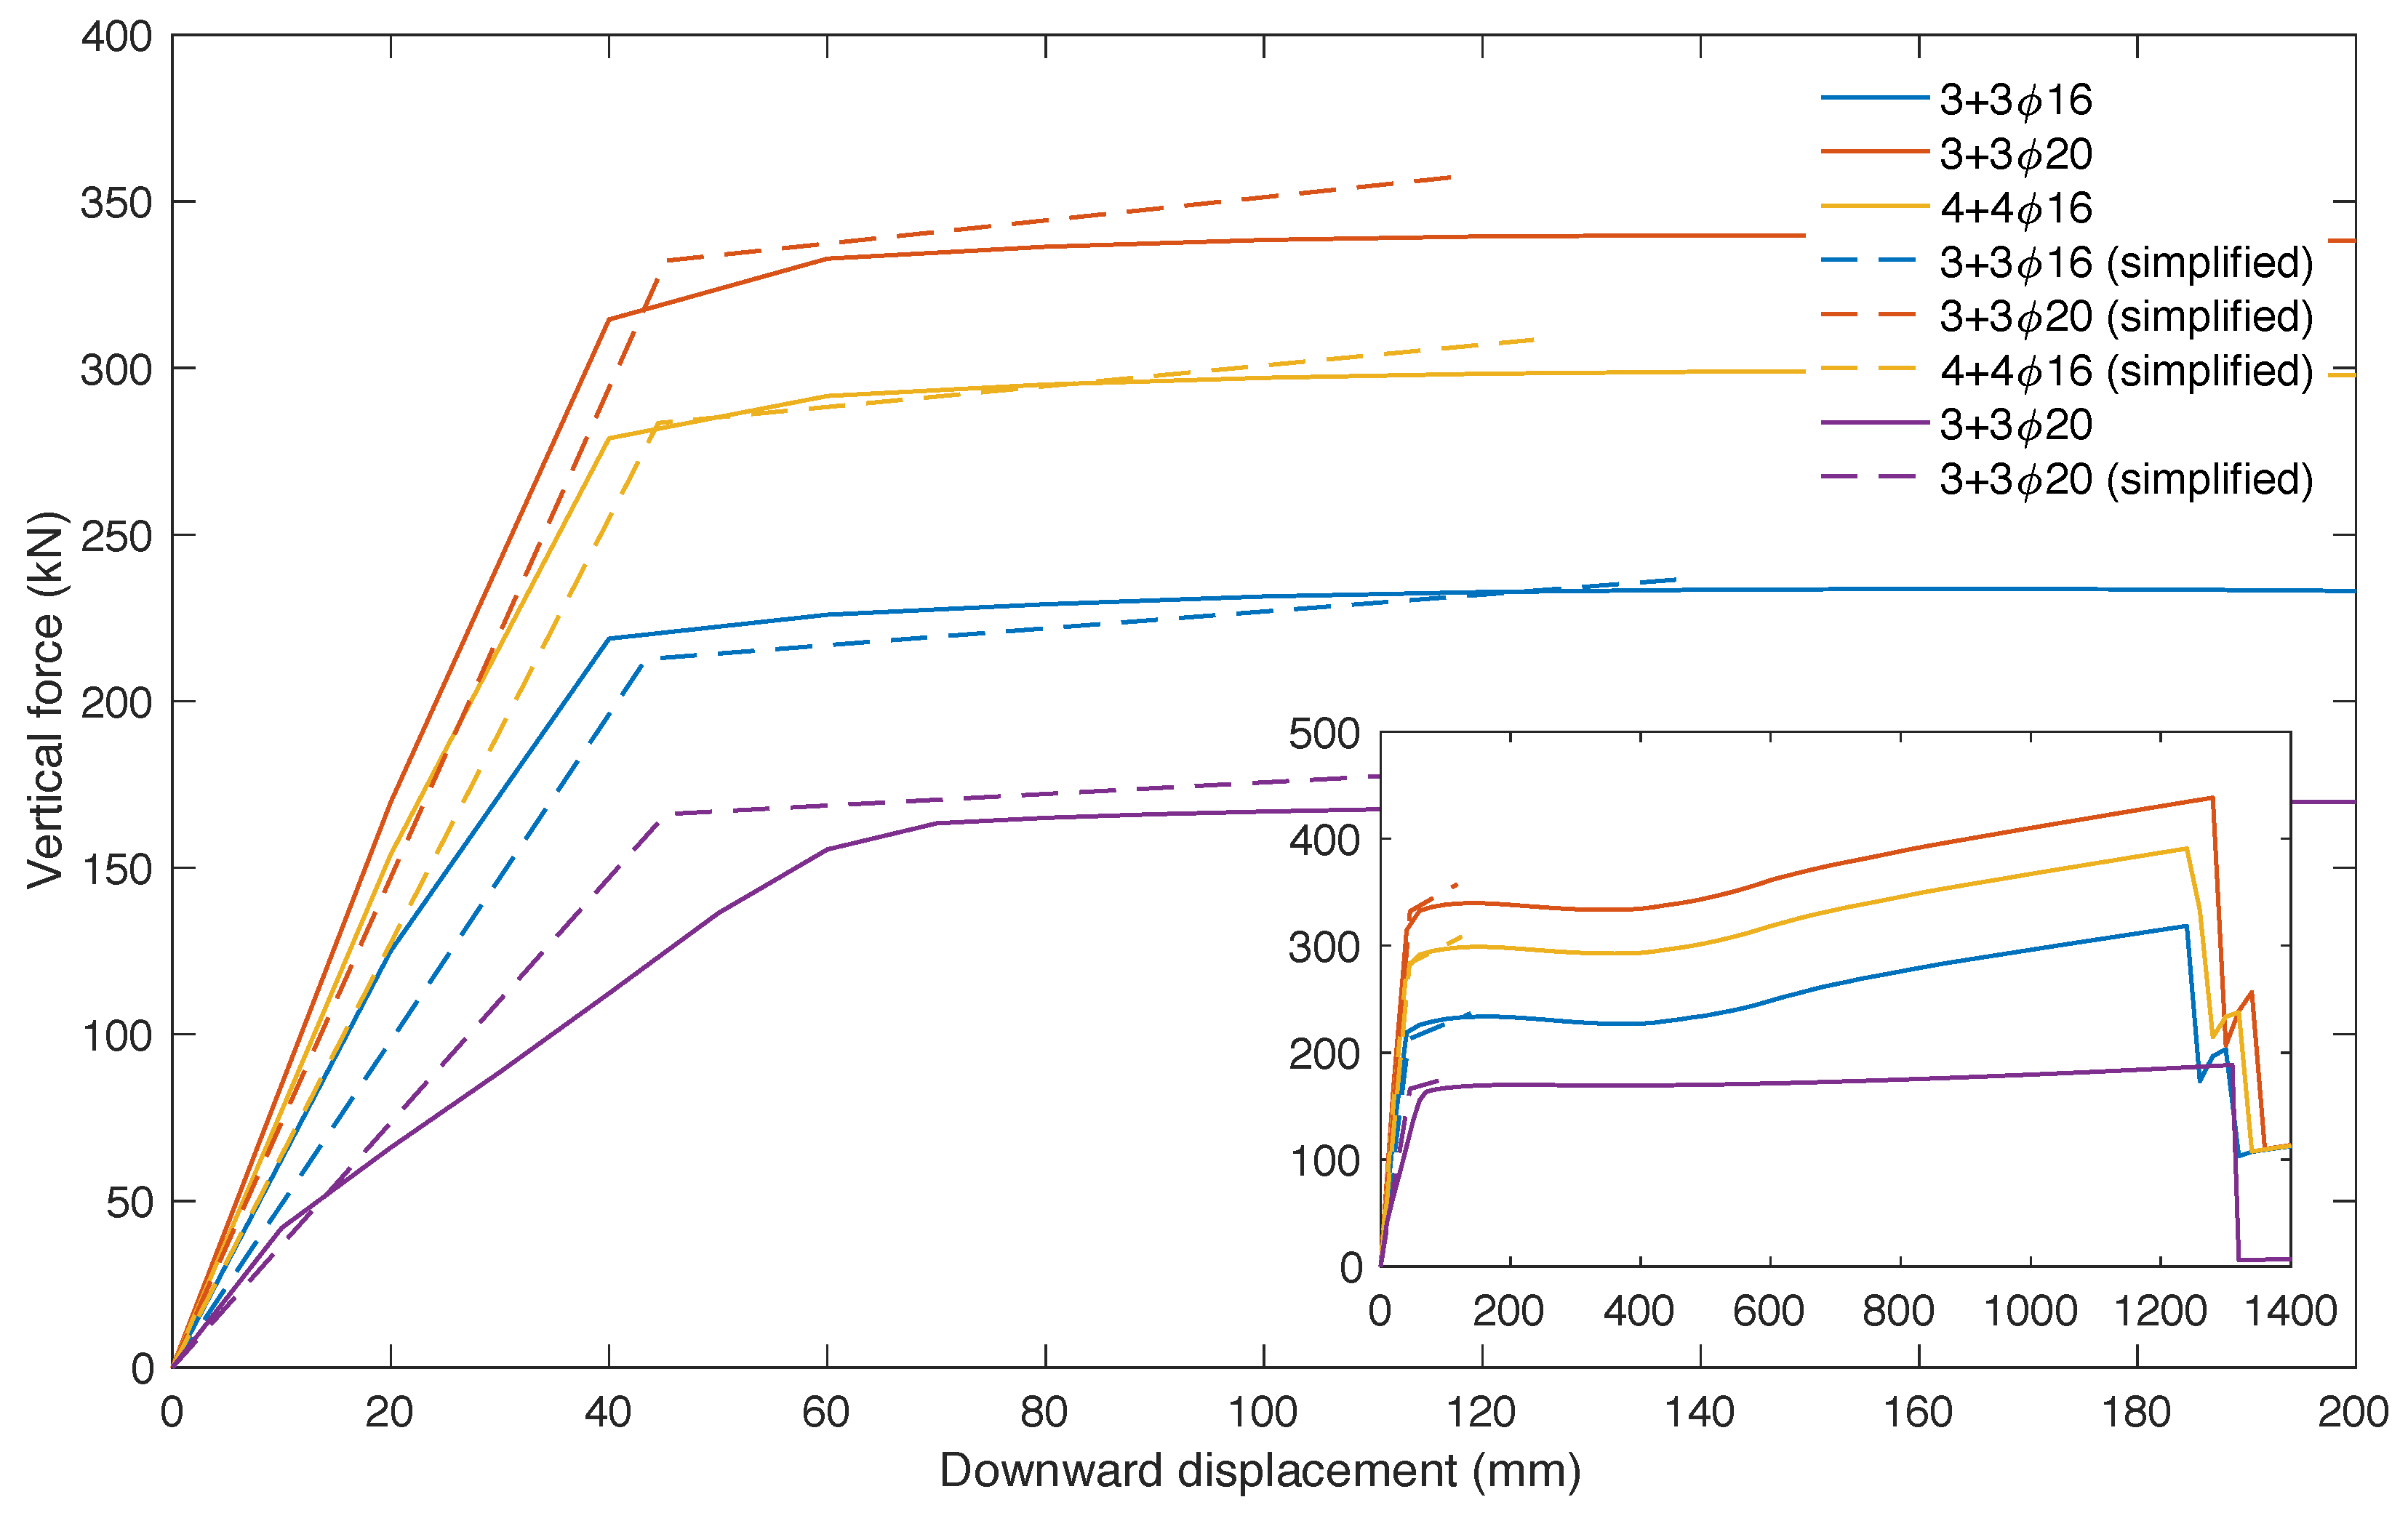
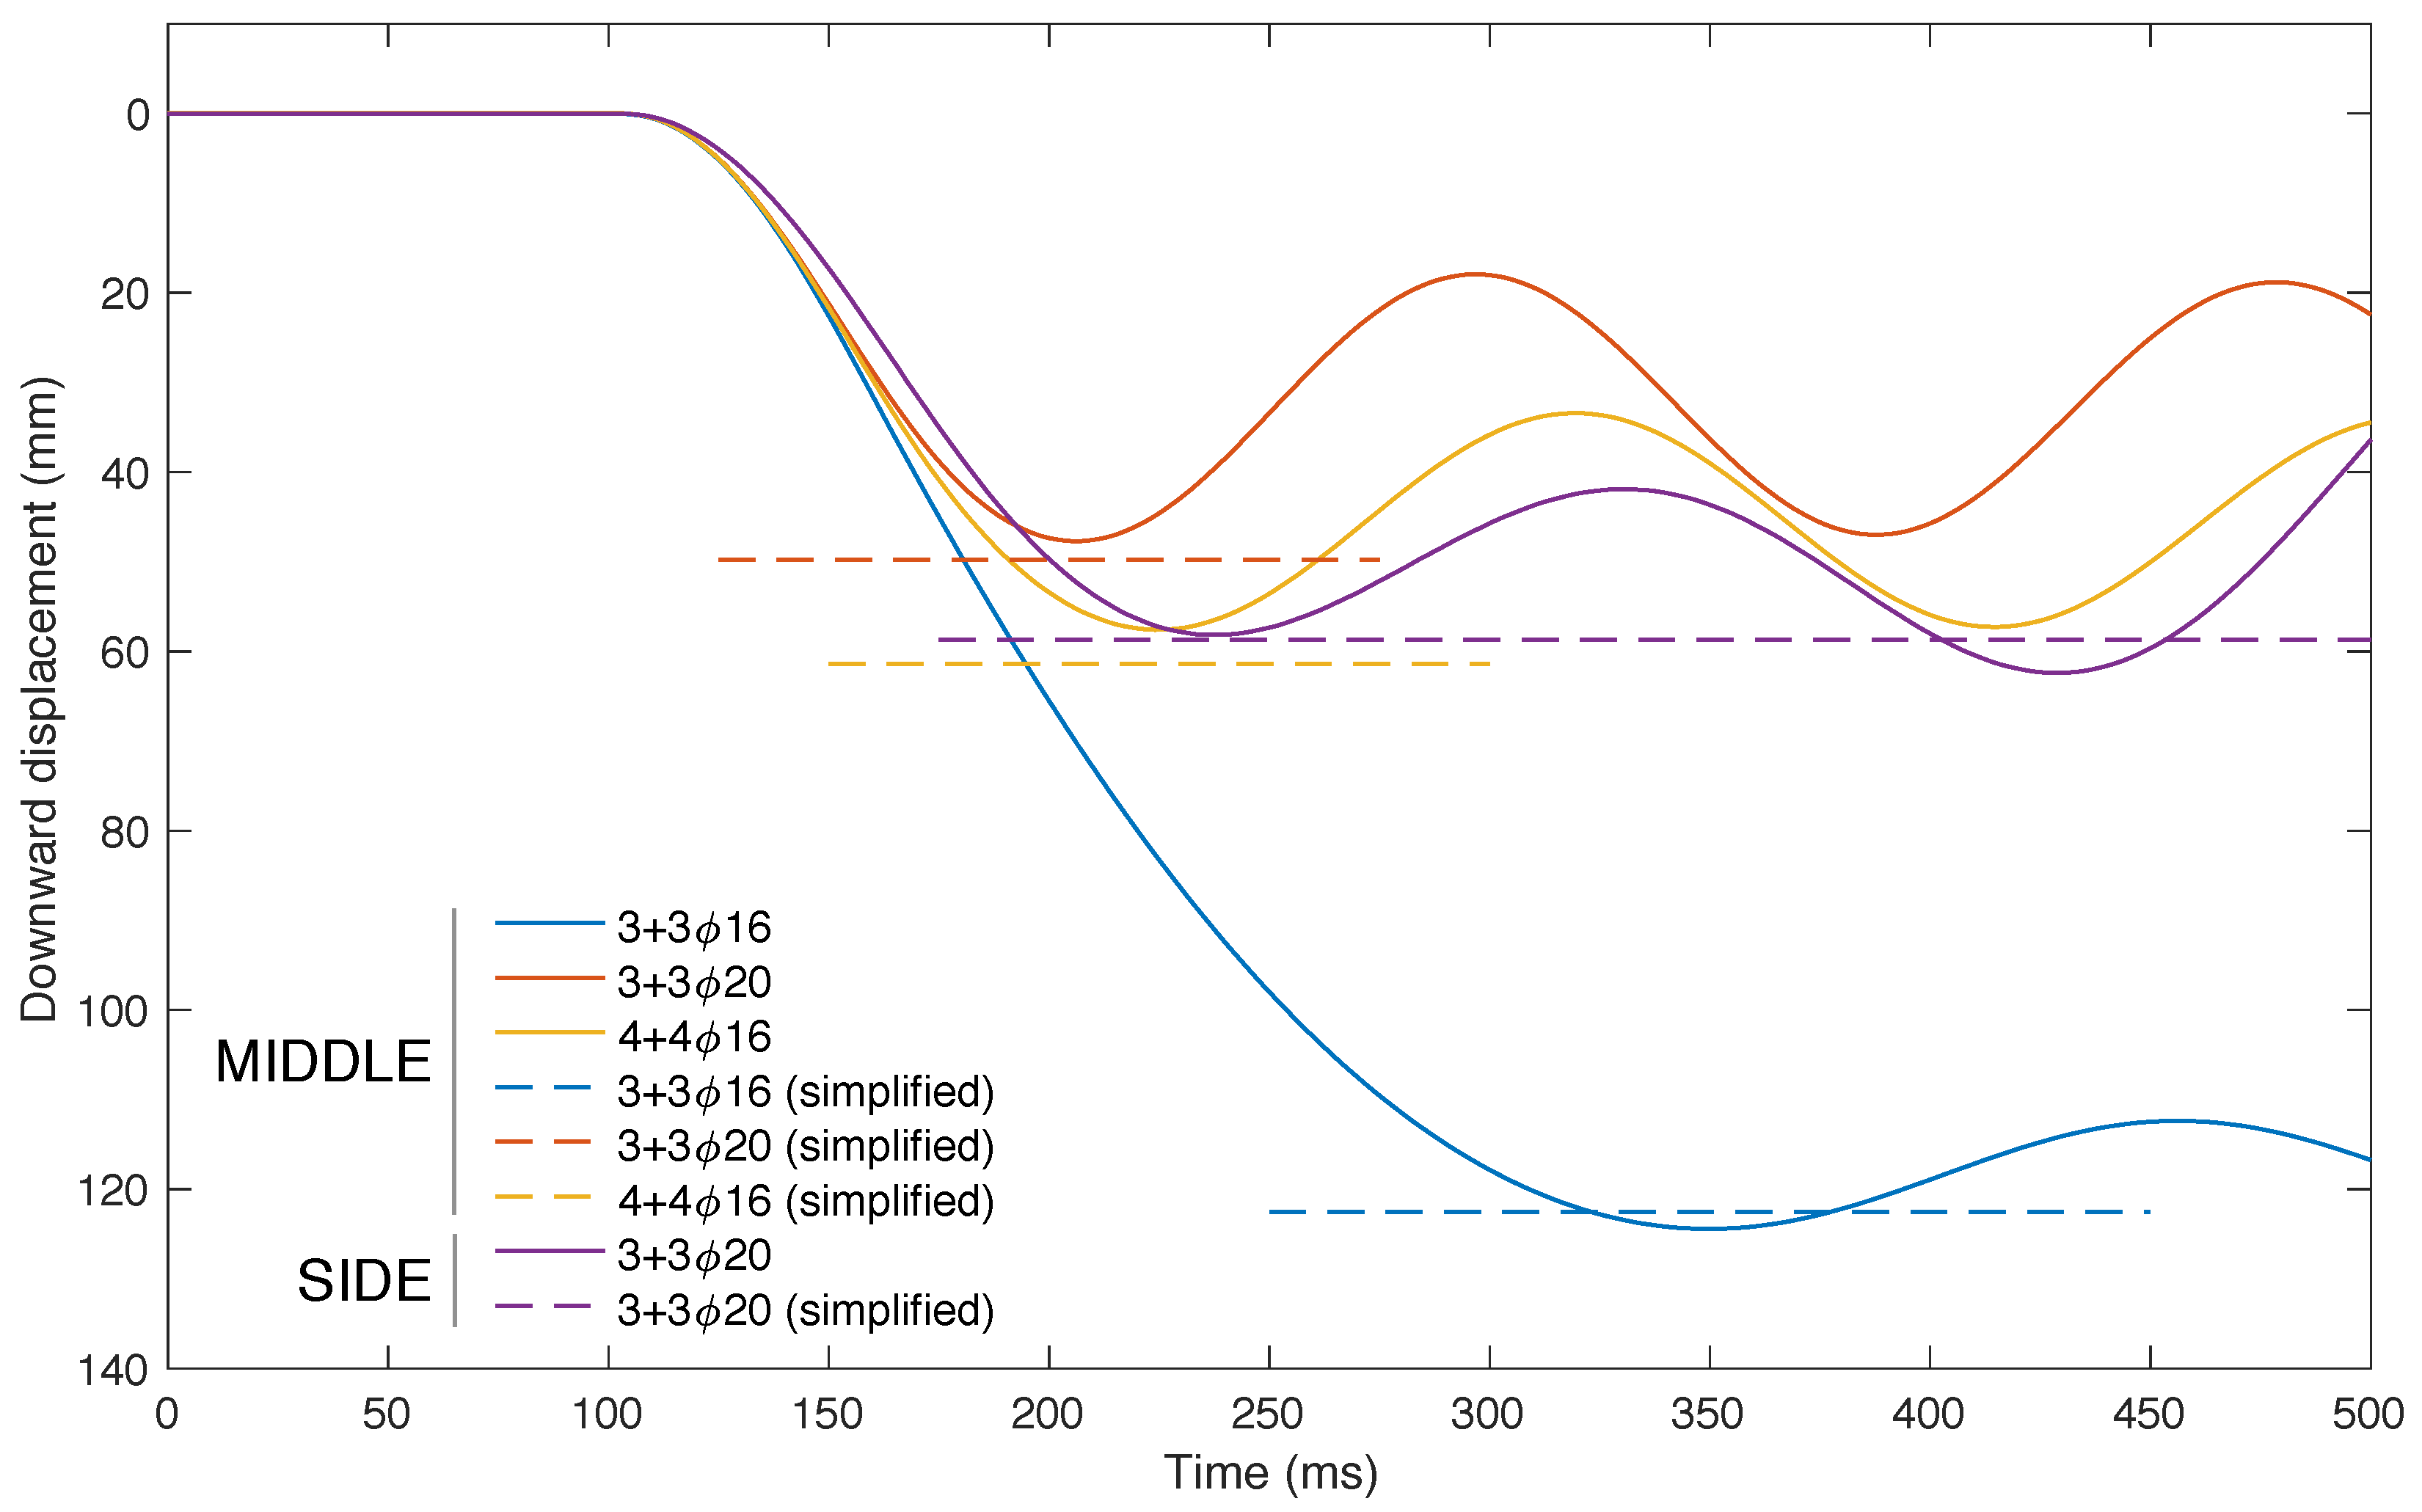
5. Comparison with Numerical Simulations

Various numerical simulations were performed to assess the quality of the simplified methodology. SeismoStruct, a fibre-based commercial software capable of a large variety of static and dynamic analyses, was adopted [43]. The geometry of the example structure was inserted in the FE (Finite Elements) model and material and cross-section properties were assigned to the elements. The material nonlinearity derives from the fibre-based approach, for which a uniaxial stress-strain relationship is assigned to each fibre [44]. Concrete behaviour is represented through a uniaxial uniform confinement model [45] while a bilinear stress-strain model with kinematic strain hardening is assumed for the reinforcement steel bars. The sectional state of the elements is obtained through the integration across the fibres that discretize the cross section. Inelastic elements with plastic hinges according to the model proposed by Scott and Fenves [46] are adopted in the FE model. The dynamic column removal is simulated with the application of an opposite force on the node onto which the replacement force acts [1,6,30]. In the simulations that are reported in the following, the force application starts at 0.1 s and lasts 0.01 s (column removal time), that is, it can be considered as a sudden column removal. The analysis is performed with 0.001 s time integration steps adopting the integration scheme proposed by Hilber et al. [47]. Both middle and side columns removals were simulated. Three different amounts of reinforcement in the beams were adopted: 3+3 ϕ 16 and 4+4 ϕ 16 for middle column removal and 3+3 ϕ 20 for either middle or side column removal. For each configuration, the compliance curve was numerically obtained through a displacement controlled pushdown analysis, the incremental force represented by a downward force acting on the control node. It results that the vertical displacement due to a quasi-static column removal occurs when the incremental force equals in magnitude the axial force in the removed column. Figure 9 reports the compliance curves obtained in the simplified analysis and in the simulations. It is first noted that the range of vertical displacement differs: this is due to the capability of the approximate method to model the true nonlinear behaviour and resisting mechanisms that raise in such phenomenon, such as, arch resisting mechanism and catenary effects [17,21]. Meanwhile, the yielding forces and the elastic parts of the compliance laws are very close, meaning that the simplified approach approximate the real behaviour of the system well. As expected, the simplified hardening phase is limited due to the ultimate rotational capacity of the element. The previous considerations holds for middle column removal. Referring to side column removal (in violet in Figure 9), it results that the pushdown analysis shows a less rigid elastic part, but with similar yielding force.
Figure 10 depicts the results of the FE dynamic sudden column removal. After the removal, the system oscillates around the equilibrium position, which can be different from the one obtained with a quasi-static damage. Side column removal (violet curve) shows oscillations with variable amplitude due to the redistribution of the forces and across the whole frame. The X-axis is limited at 500 ms and depicts the maximum downward displacement of the control node, that is, 63.2 mm that occurs during the second oscillation. The dashed lines indicate the maximum dynamic displacements derived from the simplified analysis. It is shown that the proposed approach overestimates the downward displacement for 3+3 ϕ 20 (middle column) and 4+4 ϕ 16 cases, and underestimates it in the remaining cases. Table 1 reports the maximum values and compares the simplified and the numerical solutions. For each numerical simulation, the static, the dynamic displacements and the corresponding dynamic amplification factor (DAF n u m ) are reported. For such structures, DAFs larger that 2 are in accordance with the numerical and experimental results obtained by other scholars [5,26,27,28]. Referring to the accuracy of the simplified approach, the error is within the bound ± 10 % .

6. Conclusions

This paper has presented and discussed a simplified approach for the estimation of the maximum dynamic displacement in reinforced concrete frames subjected to sudden column loss. An equivalent load application process has been adopted for exploring the effects of the damage on the structure. Despite simple, the instantaneous load application in a numerical step-by-step analysis provides an upper bound of the true displacement that can be observed if the damage progressively act. Different to the simplified procedure illustrated by Izzuddin et al. [4], following which the compliance curve is obtained applying the gravity loads on an unloaded damaged structure, the present approach considers a damage process occurring on a loaded structure.
Awareness about the phenomena that can occur in systems when subjected to forces which magnitude is large enough to engender plastic deformations is necessary for the study the effects of loading scenarios not considered during the ordinary design, such as sudden column removal or explosions on civil engineering structures. It has been proved that, despite simplified, the proposed methodology catch the dynamic behaviour of a frame structure subjected to column removal. The comparison between the results obtained with the straightforward approach herein described surprisingly has shown good agreement with the nonlinear dynamic time-history numerical analyses. Membrane actions, which provide a contribution to the capacity of the system under large displacements, have not been considered in the method. For the purposes of the simplified method, the overstrenght provided by membrane effects acts as a safety margin.
This approach is suitable in the preliminary design stage, when information about the structure is bare. The Authors implemented it on a spreadsheet into which the basic geometry of the frame, cross-section properties and acting loads are assigned. Solving the procedure, the dynamic displacement is estimated. By varying the variables, say the amount of reinforcement, the size of the elements, a preliminary design for robustness is performed. The validity of the resulting dynamic response lies in the fact that the amplification factor computed with the analytical formula overestimates the true value [13]. Obviously, the simple considerations on the dynamic response of structures to step force can be extended to other loading scenario, such as impacts due to natural phenomena [22]. In addition, this approach could be extended to other types of structures into which it is possible to identify a failure mechanism, say in steel frames or in timber structures. The possibility of including column removal time and strain rate effects into the present simplified formulation is still an open question [30] and need to be addressed in the future.

Author Contributions

Conceptualisation, V.D.B. and F.K.; methodology and formal analysis, V.D.B.; writing, V.D.B. and F.K.; writing—review and editing, all the authors; funding acquisition, B.C. All authors have read and agreed to the published version of the manuscript.

Funding

This research was partially funded by the Italian Civil Protection Department (DPC) under the framework of ReLUIS 2019-2021 project.

Conflicts of Interest

The authors declare no conflict of interest. The founders had no role in the design of the study; in the collection, analyses, or interpretation of data; in the writing of the manuscript, or in the decision to publish the results.

Appendix A. Solution of the Nonlinear SDOF System

For the purposes of the present analysis, it is supposed that the mass, initially at rest, that is, u ( 0 ) = 0 and u ˙ ( 0 ) = 0 , is subjected to a force f at time t = 0 . For displacements u < u y , the connecting device behaves like an elastic spring and the elastic dynamic equilibrium equation is
m u ¨ + k e u = f .
Applying the initial conditions the solution of the differential equation is
u = f k e 1 cos ω e t ,
where ω e is the angular frequency of the system considering the elastic stiffness k e , that is, ω e 2 = k e / m . The solution represents an oscillation centred in f / k e . Equation (A2) holds if | u | u y , that is, for f 2 F y . If f > 2 F y the device would experience an initial elastic phase followed by a plastic deformation. The device yields at a time t obtained imposing u = u y in Equation (A2). The yielding point is marked with Y in Figure 3. Remembering that k e u y = F y , it results
t = 1 ω e arccos 1 F y f .
At t = t the speed of the mass is
u ˙ t = f k e ω e sin ω e t .
For t > t the system is in the plastic phase. The restoring force is
F R = F y + k p u u y .
The dynamic equilibrium equation of this phase is
m u ¨ + k p u = f F y + k p u y .
This second order differential equation, that is, Equation (A6), is solved considering the following Cauchy boundary conditions
u t = u y u ˙ t = f k e ω e sin ω e t .
It results
u = A sin ω p t + B cos ω p t + f F y k p + u y
with
A = F y f k p sin ω p t + u ˙ t ω p cos ω p t ,
B = F y f k p cos ω p t u ˙ t ω p sin ω p t .
The velocity of the mass is
u ˙ = A ω p cos ω p t B ω p sin ω p t .
The system reaches its maximum elongation u + (point U + in Figure 3) when u ˙ = 0 , that is, at time t s t computed as
t s t = 1 ω p arctan A B + k π ,
where k is either 0 or 1 depending if A / B is positive or negative, respectively. The corresponding elongation u + is obtained inserting t s t into Equation (A8). The restoration force in the device evaluated through Equation (A5) as
F U + = k p A sin ω p t s t + B cos ω p t s t + f k p u y .
The force in the device ( F U + > f ) calls back the mass m, which starts moving with negative velocity. The process occurs along the unloading curve of Figure 3, which a linear elastic relationship (with tangent stiffness k e ) between position and restoring force. The residual displacement, that is, the displacement in the unloaded device is u r = u + F U + F y k e + u y . The equation of motion describing this phase of the process is
m u ¨ + k e u u r = f .
The integral of the equation and its initial conditions are
u = C sin ω e t + D cos ω e t + f k e + u r u t s t = u + u ˙ t s t = 0 .
Equation (A15) represents an oscillatory solution between u + and u = 2 u r u + (points U + and U , respectively), that is, around the position u n = f / k e + u r (point N in Figure 3). The maximum force in the device is F U + .

References

  1. De Biagi, V.; Parisi, F.; Asprone, D.; Chiaia, B.; Manfredi, G. Collapse resistance assessment through the implementation of progressive damage in finite element codes. Eng. Struct. 2017, 136, 523–534. [Google Scholar] [CrossRef]
  2. Abbasnia, R.; Nav, F.; Usefi, N.; Rashidian, O. A new method for progressive collapse analysis of RC frames. Struct. Eng. Mech. 2016, 60, 31–50. [Google Scholar] [CrossRef]
  3. Starossek, U. Typology of progressive collapse. Eng. Struct. 2007, 29, 2302–2307. [Google Scholar] [CrossRef]
  4. Izzuddin, B.; Vlassis, A.; Elghazouli, A.; Nethercot, D. Progressive collapse of multi-storey buildings due to sudden column loss–Part I: Simplified assessment framework. Eng. Struct. 2008, 30, 1308–1318. [Google Scholar] [CrossRef] [Green Version]
  5. Tsai, M.H. An analytical methodology for the dynamic amplification factor in progressive collapse evaluation of building structures. Mech. Res. Commun. 2010, 37, 61–66. [Google Scholar] [CrossRef]
  6. Brunesi, E.; Nascimbene, R. Extreme response of reinforced concrete buildings through fiber force-based finite element analysis. Eng. Struct. 2014, 69, 206–215. [Google Scholar] [CrossRef]
  7. Almusallam, T.; Elsanadedy, H.; Abbas, H.; Alsayed, S.; Al-Salloum, Y. Progressive collapse analysis of a RC building subjected to blast loads. Struct. Eng. Mech. 2010, 36, 301–319. [Google Scholar] [CrossRef]
  8. Liu, R.; Davison, B.; Tyas, A. A study of progressive collapse in multi-storey steel frames. In Proceedings of the Structures Congress 2005: Metropolis and Beyond, New York, NY, USA, 20–24 April 2005; pp. 1–9. [Google Scholar]
  9. Olmati, P.; Petrini, F.; Bontempi, F. Numerical analyses for the structural assessment of steel buildings under explosions. Struct. Eng. Mech. 2013, 45, 803–819. [Google Scholar] [CrossRef] [Green Version]
  10. Weerheijm, J.; Mediavilla, J.; Van Doormaal, J. Explosive loading of multi storey RC buildings: Dynamic response and progressive collapse. Struct. Eng. Mech. 2009, 32, 193–212. [Google Scholar] [CrossRef]
  11. Yu, J.; Guo, Y. Nonlinear SDOF model for dynamic response of structures under progressive collapse. J. Eng. Mech. 2015, 142, 04015103. [Google Scholar] [CrossRef]
  12. Stephen, D.; Lam, D.; Forth, J.; Ye, J.; Tsavdaridis, K. An evaluation of modelling approaches and column removal time on progressive collapse of building. J. Constr. Steel Res. 2019, 153, 243–253. [Google Scholar] [CrossRef]
  13. Gudmundsson, G.; Izzuddin, B. The ‘sudden column loss’ idealisation for disproportionate collapse assessment. Struct. Eng. 2010, 88, 22–26. [Google Scholar]
  14. Sasani, M.; Kropelnicki, J. Progressive collapse analysis of an RC structure. Struct. Des. Tall Spec. Build. 2008, 17, 757–771. [Google Scholar] [CrossRef]
  15. Lu, X.; Lin, K.; Li, Y.; Guan, H.; Ren, P.; Zhou, Y. Experimental investigation of RC beam-slab substructures against progressive collapse subject to an edge-column-removal scenario. Eng. Struct. 2017, 149, 91–103. [Google Scholar] [CrossRef]
  16. Yu, J.; Tan, K.H. Experimental and numerical investigation on progressive collapse resistance of reinforced concrete beam column sub-assemblages. Eng. Struct. 2013, 55, 90–106. [Google Scholar] [CrossRef]
  17. Yu, J.; Tan, K.H. Structural behavior of RC beam-column subassemblages under a middle column removal scenario. J. Struct. Eng. 2013, 139, 233–250. [Google Scholar] [CrossRef]
  18. Bao, Y.; Lew, H.S.; Kunnath, S.K. Modeling of reinforced concrete assemblies under column-removal scenario. J. Struct. Eng. 2014, 140, 04013026. [Google Scholar] [CrossRef]
  19. Valipour, H.R.; Foster, S.J. Finite element modelling of reinforced concrete framed structures including catenary action. Comput. Struct. 2010, 88, 529–538. [Google Scholar] [CrossRef]
  20. Pham, A.T.; Tan, K.H.; Yu, J. Numerical investigations on static and dynamic responses of reinforced concrete sub-assemblages under progressive collapse. Eng. Struct. 2017, 149, 2–20. [Google Scholar] [CrossRef]
  21. Pham, A.T.; Tan, K.H. A simplified model of catenary action in reinforced concrete frames under axially restrained conditions. Mag. Concr. Res. 2017, 69, 1115–1134. [Google Scholar] [CrossRef]
  22. Marchelli, M.; De Biagi, V. Dynamic effects induced by the impact of debris flows on protection barriers. Int. J. Prot. Struct. 2019, 10, 116–131. [Google Scholar] [CrossRef]
  23. Ventura, A.; De Biagi, V.; Chiaia, B. Structural robustness of RC frame buildings under threat-independent damage scenarios. Struct. Eng. Mech. 2018, 65, 689–698. [Google Scholar]
  24. Clough, R.; Penzien, J. Dynamics of Structures; Computers & Structures; Pearson: Harlow, UK, 1995. [Google Scholar]
  25. Chopra, A. Dynamics of Structures. Theory and Applications to Earthquake Engineering, 4th ed.; Pearsons: Harlow, UK, 2014. [Google Scholar]
  26. Tsai, M.H.; Lin, B.H. Dynamic amplification factor for progressive collapse resistance analysis of an RC building. Struct. Des. Tall Spec. Build. 2009, 18, 539–557. [Google Scholar] [CrossRef]
  27. Tsai, M.H.; You, Z.K. Experimental evaluation of inelastic dynamic amplification factors for progressive collapse analysis under sudden support loss. Mech. Res. Commun. 2012, 40, 56–62. [Google Scholar] [CrossRef]
  28. Powell, G. Progressive collapse: Case studies using nonlinear analysis. In Proceedings of the Structures Congress 2005: Metropolis and Beyond, New York, NY, USA, 20–24 April 2005; pp. 1–14. [Google Scholar]
  29. Tavakoli, H.R.; Kiakojouri, F. Numerical study of progressive collapse in framed structures: A new approach for dynamic column removal. Int. J. Eng. Trans. A: Basics 2013, 26, 685–692. [Google Scholar] [CrossRef]
  30. Kiakojouri, F.; Sheidaii, M.R.; De Biagi, V.; Chiaia, B. Progressive Collapse Assessment of Steel Moment-Resisting Frames Using Static-and Dynamic-Incremental Analyses. J. Perform. Constr. Facil. 2020, 34, 04020025. [Google Scholar] [CrossRef]
  31. De Biagi, V.; Chiaia, B. Complexity and robustness of frame structures. Int. J. Solids Struct. 2013, 50, 3723–3741. [Google Scholar] [CrossRef] [Green Version]
  32. Kiakojouri, F.; Sheidaii, M.R. Effects of finite element modeling and analysis techniques on response of steel moment-resisting frame in dynamic column removal scenarios. Asian J. Civ. Eng. 2018, 19, 295–307. [Google Scholar] [CrossRef]
  33. Makris, N.; Black, C. Dimensional analysis of rigid-plastic and elastoplastic structures under pulse-type excitations. J. Eng. Mech. 2004, 130, 1006–1018. [Google Scholar] [CrossRef]
  34. Langhaar, H. Dimensional Analysis and Theory of Models; Wiley: New York, NY, USA, 1951. [Google Scholar]
  35. Barenblatt, G. Scaling, Self-Similarity, and Intermediate Asymptotics: Dimensional Analysis and Intermediate Asymptotics; Cambridge University Press: Cambridge, UK, 1996. [Google Scholar]
  36. Kiakojouri, F.; De Biagi, V.; Chiaia, B.; Sheidaii, M.R. Progressive collapse of framed building structures: Current knowledge and future prospects. Eng. Struct. 2020, 206, 110061. [Google Scholar] [CrossRef]
  37. Megson, T.H.G. Structural and Stress Analysis; Butterworth-Heinemann: Oxford, UK, 2019. [Google Scholar]
  38. CEN. EN 1992-1-1:2004 Eurocode 2: Design of Concrete Structures; Comité Européen de Normalisation: Brussels, Belgium, 2004. [Google Scholar]
  39. Park, R.; Paulay, T. Reinforced Concrete Structures; John Wiley & Sons: Hoboken, NJ, USA, 1975. [Google Scholar]
  40. Italian Ministry for Infrastructures and Transports. Aggiornamento delle Norme tecniche per le costruzioni. Gazz. Uff. Della Repubb. Ital. 2018, 42, 1–368. [Google Scholar]
  41. Italian Ministry for Infrastructures and Transports. Istruzioni per l’applicazione dell’Aggiornamento delle “Norme tecniche per le costruzioni” di cui al DM 17 gennaio 2018. Gazz. Uff. Della Repubb. Ital. 2019, 35, 1–348. [Google Scholar]
  42. Mpampatsikos, V.; Nascimbene, R.; Petrini, L. A critical review of the RC frame existing building assessment procedure according to Eurocode 8 and Italian seismic code. J. Earthq. Eng. 2008, 12, 52–82. [Google Scholar] [CrossRef]
  43. Seismosoft Ltd. SeismoStruct—A Computer Program for Static and Dynamic Nonlinear Analysis of Framed Structures. Available online: www.seismosoft.com (accessed on 28 April 2020).
  44. Seismosoft Ltd. SeismoStruct Technical Information Sheet. 2018. Available online: www.seismosoft.com (accessed on 28 April 2020).
  45. Mander, J.B.; Priestley, M.J.; Park, R. Theoretical stress-strain model for confined concrete. J. Struct. Eng. 1988, 114, 1804–1826. [Google Scholar] [CrossRef] [Green Version]
  46. Scott, M.H.; Fenves, G.L. Plastic hinge integration methods for force-based beam–column elements. J. Struct. Eng. 2006, 132, 244–252. [Google Scholar] [CrossRef]
  47. Hilber, H.M.; Hughes, T.J.; Taylor, R.L. Improved numerical dissipation for time integration algorithms in structural dynamics. Earthq. Eng. Struct. Dyn. 1977, 5, 283–292. [Google Scholar] [CrossRef] [Green Version]
Figure 1. Scheme for the evaluation of the damage on a frame. The central bottom column is the removed element. (a) First, the internal forces in the element are evaluated. (b) Then, the element is removed and a nodal force, equal but opposite to the internal force is applied to the top node. (c) Finally, an opposite force is suddenly applied to the system to simulate sudden column removal. In (d) a sketch of the equivalent SDOF system is reported.
Applsci 10 03081 g001
Figure 2. Sketch of the single degree of freedom (SDOF) system. The nonlinear device is denoted with letter (d). On the right-hand side the dynamic forces acting on the mass are reported: m u ¨ is the inertia force, F R is the restoring force of the device, which depends on its elongation u, f is the applied force.
Applsci 10 03081 g002
Figure 3. Elastic-plastic law of the connecting device. Explanations of the letters in the plot are reported in the text.
Applsci 10 03081 g003
Figure 4. Loading force - displacement curves for various values of Π 3 . Continuous lines relates to the dynamic analysis, that is, Π 1 d y n , while the dashed lines relate to the quasi-static loading, that is, Π 1 s t .
Applsci 10 03081 g004
Figure 5. Dynamic amplification factor for various normalised loading and stiffness ratios. Squares represents the dynamic amplification factor (DAF) obtained through the numerical simulations.
Applsci 10 03081 g005
Figure 6. Dynamic amplification factor for various stiffness ratios Π 3 in the range 0 ; 1 for Π 2 = 1 . The grey line corresponds to DAF=2. Squares represents the DAF obtained through the numerical simulations.
Applsci 10 03081 g006
Figure 7. A sketch of the plastic hinges that originates when the column is removed is sketched in (a). The mechanism can be described with a unique coordinate, for example, the rotation φ . The forces applied on the structure onto which the virtual work principle (VWP) is applied is depicted in (b).
Applsci 10 03081 g007
Figure 8. A sketch of the test frame onto which the simplified method is applied. The removed middle column is reported in red, the removed side column in violet. The corresponding control nodes are marked with letters A 1 and A 2 , respectively. The geometry and the reinforcement layouts of beams and columns are depicted on the right-hand side.
Applsci 10 03081 g008
Figure 9. Compliance curves for the four reinforcement amounts in the beams and column removal position. Solid lines (–) correspond to the FE simulations, while dashed lines (- -) to the simplified bilinear compliance law. The downward displacement is limited to 200 mm in main plot, while the secondary axes (that have the same labels as the primary ones) depict the full pushdown analysis up to 1400 mm.
Applsci 10 03081 g009
Figure 10. Time-histories of the downward displacement of the control point under the sudden column removal process (for both middle and side elements). Column removal starts at 0.1 s and lasts 0.01 s. The dashed lines illustrate the dynamic displacements obtained with the simplified method herein presented.
Applsci 10 03081 g010
Table 1. Comparison between numerical and simplified analysis by varying the amount of reinforcement in the beams.
BeamsRemoved u st , num u dyn , num DAF num u dyn , simpl Error
ReinforcementColumn(mm)(mm) (mm)
3 + 3 ϕ 16Middle32.4124.43.84122.5−1.5%
3 + 3 ϕ 20Middle23.347.72.0449.8+4.4%
4 + 4 ϕ 16Middle25.857.62.2361.3+6.4%
3 + 3 ϕ 20Side39.263.21.6158.7−7.7%

