Article

Weather-Based Prediction Strategy inside the Proactive Historian with Application in Wastewater Treatment Plants

Department of Automation and Applied Informatics, Faculty of Automation and Computers, University Politehnica Timișoara, 300223 Timișoara, Romania
*
Author to whom correspondence should be addressed.
Appl. Sci. 2020, 10(9), 3015; https://doi.org/10.3390/app10093015
Submission received: 12 April 2020 / Revised: 22 April 2020 / Accepted: 23 April 2020 / Published: 26 April 2020
(This article belongs to the Special Issue Control and Automation)

Abstract

:
The current landscape in the water industry is dominated by legacy technical systems that are inefficient and unoptimized. In recent years, sustained efforts could be identified, especially under the guidance of the Industrial Internet of Things (IIoT) paradigm, in order to develop an increased level of both connectivity and intelligence in the functioning of industrial processes. This led to the emergence of the data accumulation concept, materialized in the practical sphere by Historian applications. Although various classic Historian solutions are available, the capability to optimize and influence the monitored system in a proactive way, resulting in increased efficiency, cost reduction, or quality indicators improvements, could not be identified to date. Following a proposed software reference architecture for such a proactive Historian, a data dependency identification strategy and some obtained recipes for energy efficiency improvements in the water industry were developed. However, a complete solution for real industrial processes represents complex research. The current paper contributes to this research effort by developing part of the reference architecture that predicts the future evolution of the monitored system, based on weather dependency and forecast, thus sustaining the effort to achieve a fully functional, real-world, tested and validated proactive Historian application, with potential to bring significant direct benefits to the water industry.

1. Introduction

The technical solutions and processes that are specific to the water industry present a very heterogeneous characteristic, being simultaneously highly dispersed from a geographical standpoint, thus contributing to defining a landscape currently prevailed by legacy systems. Although viable solutions at the time of their implementation, the large majority of legacy systems that can be found today in the water industry are inefficient by current standards, thus transforming the water industry into the perfect environment for receiving quality, availability, and efficiency improvements.
The Industrial Internet of Things (IIoT) concept [1,2,3,4] groups a wide spectrum of industry-oriented principles [5,6], aimed at different objectives, most of which can be achieved by developing intelligent communication between different technical entities. This aspect places the superior and enhanced connectivity, interoperability, and information exchange at the core of the IIoT paradigm, which transposes from a practical standpoint to a continuous effort to connect industrial computers, sensors, and actuators to the internet [7]. The improved communication as a result of the IIoT implementation opens the way for developing more intelligent and sophisticated future systems, capable of improving the working characteristics of technical systems (such as availability, cost reduction, safety, productivity), by applying autonomous optimization techniques to the systems [8].
The importance of developing the interoperability between industrial systems is emphasized in [9], where the authors propose a communication framework that brings both efficiency and interoperability improvements for service-based architecture. Their work prepares the appropriate context for implementing future distributed monitoring and control applications. Such advances in industrial communications have recently led to the emergence of the ideas around bringing both fog computing and Big Data concepts closer to the industry, in accordance with the IIoT guidelines, because of the data accumulation phenomenon that occurs. In this direction, Aazam et al. conclude in [10] that a middleware support is required between the industrial environment and the cloud services. This middleware can be represented by the fog computing [11], which is capable of providing local computing support. On the other hand, the large amount of generated data requires Big Data technologies in the industry, and the paper from [12] presents a survey of the Big Data solutions that are already integrated into the industry, while [13] focuses on identifying the high performing Big Data techniques that can be applied to industrial data.
Despite classic Historian applications [14,15,16] that store the large amounts of generated data into industrial environments dominated by the IIoT principles are widely available and do not represent a novelty anymore, the most recent trends in this area are to develop solutions that can make use of the already-gathered data. The future Historian application will be intelligent and proactive, using the stored data to identify dependencies and relations between the characteristics of the monitored system, which, in turn, will be used to predict the future evolution of the technical system, as a starting point for optimizing the monitored system, in an autonomous, non-invasive, unassisted-by-human manner, being placed in the fog computing area close to the monitored system. Although such an Historian application cannot be identified to date, progress is being made toward this development direction. The study from [17] proposes efficiency improvements to a classic Historian application, while a distributed and configurable data analytics infrastructure is presented in [18]. Another distributed, wireless monitoring system is presented in [19], the problem of predictive maintenance is tackled in [20], and lightweight, Raspberry Pi-based, classic Historian solutions are presented in both [21] and [22]. In a similar research direction as that followed in this paper, Salvador et al. in [23] aim toward a proactive Historian by implementing a predictive control strategy of a water distribution network that is based on Historian gathered data. Although several researches are focusing on this gathered data capitalization toward industrial systems optimization, a fully functional, real-world, tested and validated proactive Historian solution has not been achieved to date.
In order to implement a proactive Historian solution, a software reference architecture is primarily needed and, although [24] presents general reference architectures for IIoT and [25] suggests design patterns that should be applied in IIoT, the most suitable software architecture option for a proactive Historian is described in [26]. The architecture proposed by the authors is specifically targeted for a proactive Historian type of application, dividing the required software modules into three distinct layers. The architecture is based on an already-existing classic Historian solution, which is capable of storing chosen working parameters of a technical system and structures the required modules that need to be added in order to transform a classic solution into a proactive solution. The first layer of the proposed architecture is responsible for identifying relations and dependencies between the measured characteristics by using historical stored data and external context data. The identified relations and dependencies, alongside future context data, are used as input for the second layer of the reference architecture, which must be capable of predicting the future evolution of the technical system. The last layer of the reference architecture capitalizes on the results of the previous layer, making use of the future prediction in order to decide how to influence this predicted future evolution so that chosen objectives (such as cost reduction, efficiency improvements, substances consumption reduction, maintenance improvements) are met. Ultimately, the third layer of the reference architecture should be capable of directly influencing the monitored technical system, through actuators, transferring the optimizations to the real-world system. Implementing the entire reference architecture would result in obtaining a closed-loop Historian system, which monitors a technical system, adjusts it for optimization, monitors the system reaction to the adjustment, and so on. Besides presenting the aforementioned reference architecture, the authors also implemented and tested the first level of the architecture in [26], illustrating test cases from the water industry, with reference to a drinking water treatment plant.
The current paper picks up the state of the research that was reached in [26] and takes it further down the long path to implement the entire reference architecture and obtain the first proactive Historian application capable of optimizing the monitored system without any human assistance. Achieving the final goal of this research direction demands a considerable research, implementation, and testing effort, which must be divided into several stages. The initial step was taken in [22], where the authors developed a classic Historian solution, but in a lightweight and low-cost implementation, perfectly suited for the industrial requirements. Then, important steps toward the proactive direction were made in [26], where a reference architecture was proposed, the first level of it also being implemented and tested in the water industry. The current paper falls in line with this research, representing the next significant step toward the ultimate goal. The contributions of the current paper are as follows: Improve the implementation of the first level of the reference architecture described in [26]; integrate historical weather data into the relations and dependencies identification algorithm developed in [26]; implement the second level of the reference architecture (which predicts the future evolution of the monitored system), based on the weather forecast and the results of the first layer. The unavoidable cybersecurity concerns that naturally arise from developing this type of software application are considered by the authors as being beyond the scope of the current paper.
In order to test the contributions of the current paper, several test cases are considered from the water industry, regarding a real wastewater treatment plant. This type of plant was chosen because of the typical close dependencies that exist between wastewater treatment plants and weather characteristics.
The following section presents the typical processes that take place inside a wastewater treatment plant, discloses defining problems, and emphasizes the typical weather influence over such plants, as well as detailing the main contributions of the current paper, regarding both the improvements that were made to the first level of the reference architecture and the implementation of the second level of algorithms. Section 3 illustrates the test cases that were used for validating the implementation described in the previous section in a real wastewater treatment plant environment. Section 4 dissects and discusses the results of the test cases presented in the previous section, while Section 5 concludes the paper.

2. Materials and Methods

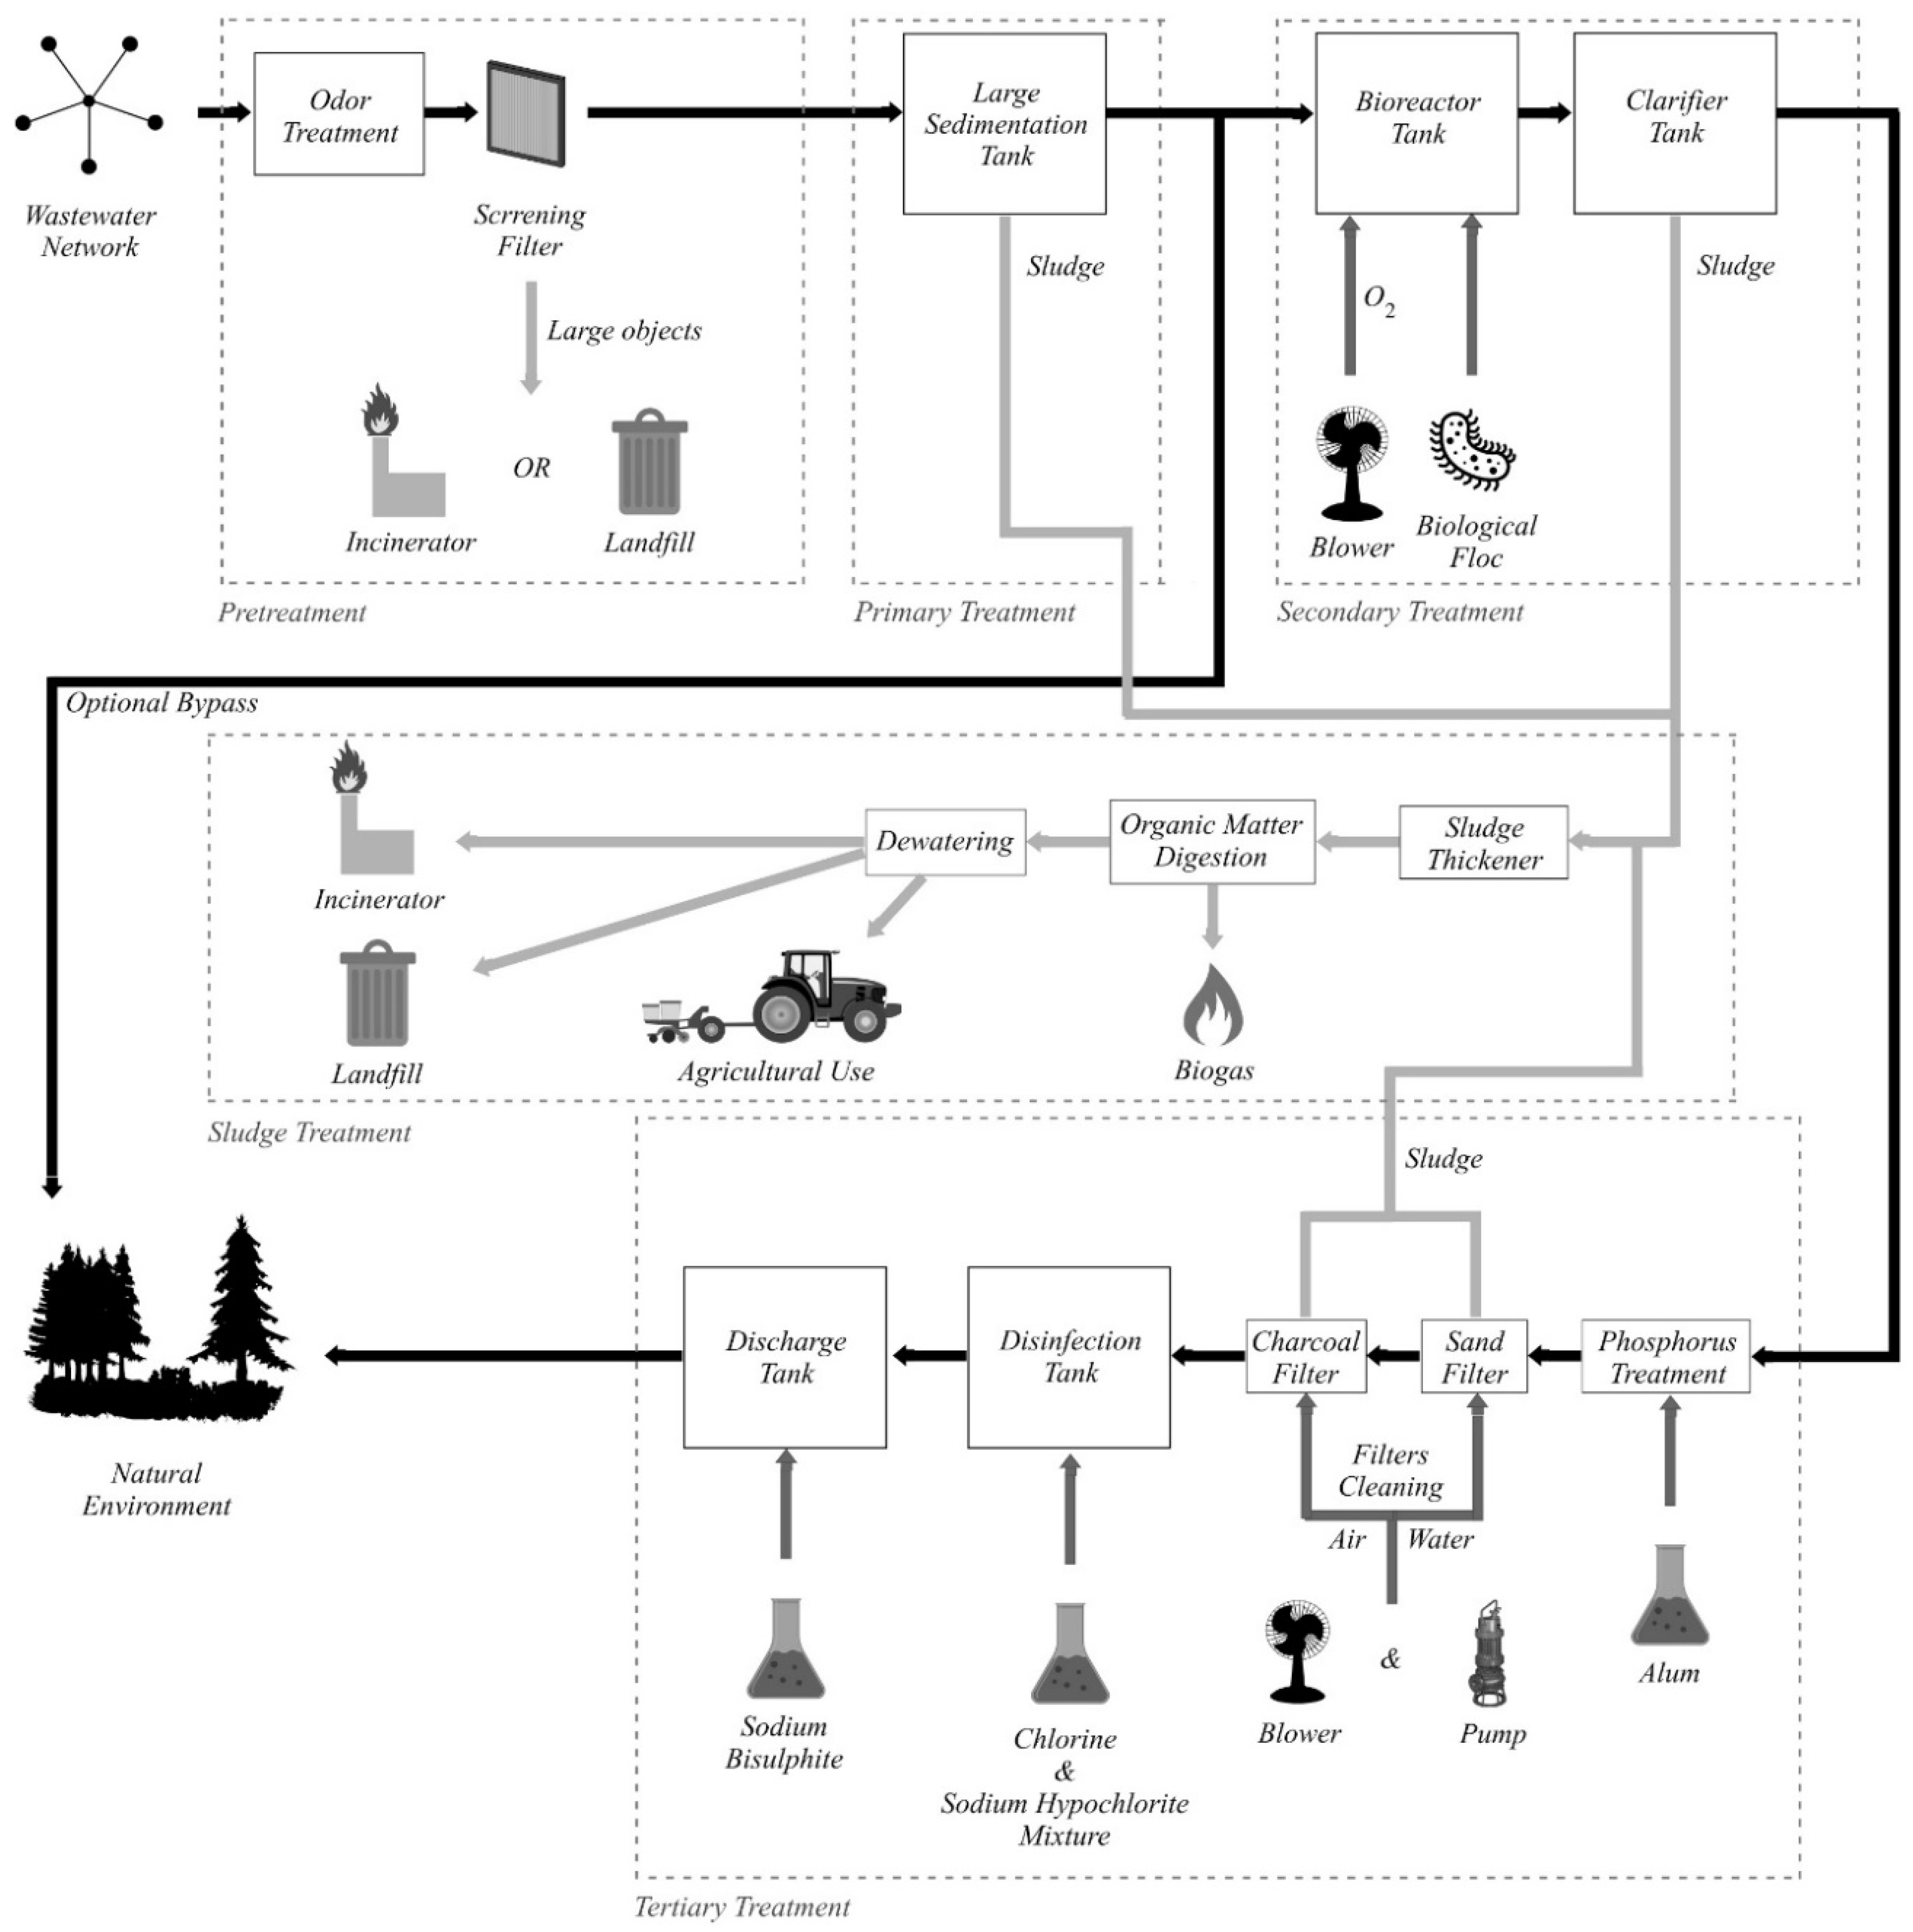
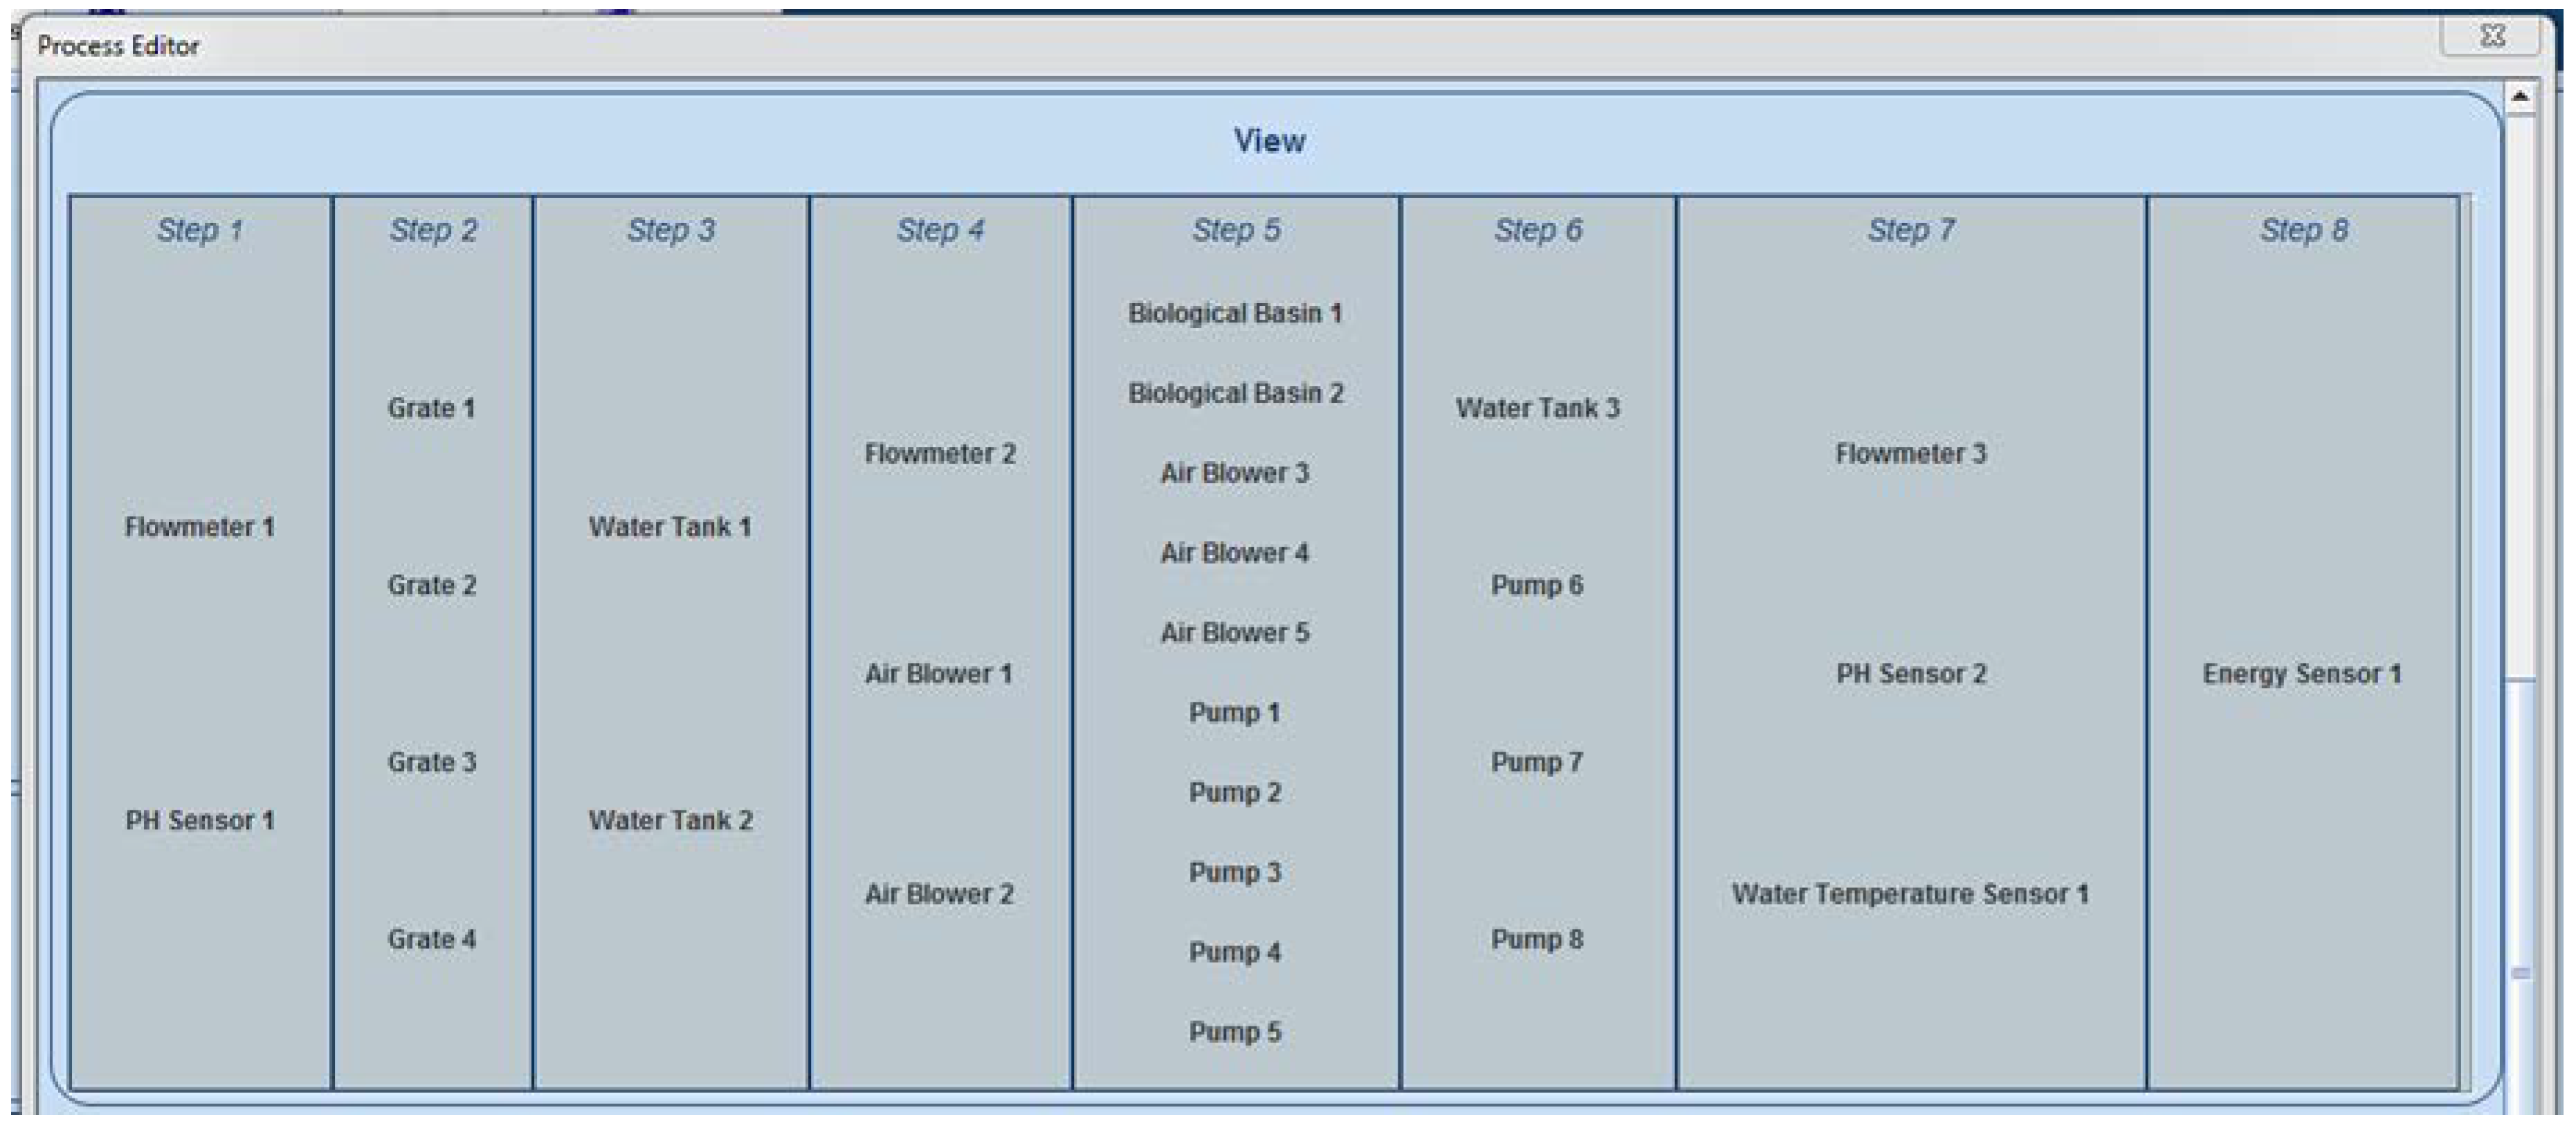
2.1. Wastewater Treatment Plant Typical Processes

The representative processes that usually take place inside a wastewater treatment plant (WWTP) are summarized in Figure 1, and further detailed in this section. The treatment process is divided, from a logical standpoint, into multiple stages: Pretreatment, primary treatment, secondary treatment, tertiary treatment, and sludge treatment.
The wastewater enters the treatment plant from the wastewater network, where the source of the water is residential, institutional, commercial, industrial, rain, or a mix of the aforementioned. After the water enters the treatment plant, the pretreatment processes are initiated. Firstly, odor treatment can be applied so that the plant surrounding areas are protected from the foul smell that naturally accompanies wastewater. The odor treatment process may not be necessary at some plants. There are two distinct methods of odor treatment: Air treatment and liquid treatment. If the air treatment method is applied, the wastewater is contained in large tanks, which are hermetically covered with specially designed odor control covers. The air trapped under the cover, inside the tanks, is extracted by a ventilation system and undergoes treatment before it is released to the environment. Regarding the liquid treatment method, different chemicals that neutralize the foul smell-producing elements are introduced in the wastewater. The second process that takes place during pretreatment is screening, where the wastewater is passed through filters in order to remove both grit and large objects such as bottles, plastics, tree branches, sanitary items, and cotton buds. It is very important to remove such objects early in the process because they can damage the plant equipment if present in future steps of the treatment process. The removed objects are either incinerated or disposed in landfills.
After the pretreatment is completed, the wastewater enters the primary treatment stage, where the remaining solid matter is separated from the wastewater. In this stage, large sedimentation tanks are used, in which the wastewater clarifies. The sludge settles at the bottom of the tank, while grease and oil rise to the surface. The sludge is removed and directed to the sludge treatment process, while the grease and oil can be used for soap making.
After the primary treatment, an optional bypass exists so that the treated water can be sent directly to the natural environment without entering the secondary and tertiary treatment stages. This bypass is used during heavy rainfall by plants that receive wastewater from a combined sewer system. In this case, the secondary and tertiary treatment stages are bypassed in order to protect them from hydraulic overloading, the mixture of sewage and rainwater receiving only primary treatment before being sent back to the natural environment. In some plants, the bypass is implemented directly at the inlet, so the wastewater is not even screened. In addition, for larger plants without a complete gravitational bypass, high-energy consumer pumps are used to transfer the untreated water directly into the emissary when the large amounts of wastewater exceed the capacity of the plant.
The secondary treatment stage objective is to remove the biological matter from the wastewater, by using a bioreactor tank where both oxygen (introduced with blowers) and a biological floc (bacteria and microorganisms that consume the remaining organic matter) are inserted into the wastewater. Before exiting the secondary treatment, wastewater is sent into a clarifier tank, where large particles settle down at the bottom (sludge) and are extracted for the sludge treatment process. In order to maintain the optimal process parameters during the biological treatment, a pH adjustment must take place, involving different chemicals (Ca(OH)2, CaCO3, Na2CO3, NaOH, etc.).
The last stage is the tertiary treatment, which is similar to the drinking water treatment process, the resulting water quality being close to drinking water quality. Firstly, a chemical compound (usually alum, Al2(SO4)3, but polyaluminum chloride or ferric chloride, FeCl3, can also be used) is injected into the wastewater in order to remove the phosphorus. In some plants, the phosphorus removal can be implemented during different stages, such as the large sedimentation tank, during biological treatment, or later, in the clarifier tank. If the phosphorus is removed by the biological treatment, the chemical treatment becomes an auxiliary method. Then, the water passes through a sand filter and a charcoal filter before entering a disinfection tank, where a mixture of chlorine and sodium hypochlorite is added. Lastly, the water is sent into the discharge tank where sodium bisulfite is used in order to chemically dechlorinate the water because residual chlorine is toxic to aquatic species. The water exiting the tertiary treatment is released into the natural environment in rivers, lakes, or other local waterways. Another important periodic process that takes place during tertiary treatment is the filters cleaning, in which the sand and charcoal filters are washed with air and water, the resulting sludge being sent to the sludge treatment process.
Each of the primary, secondary, and tertiary treatment stages produce sludge, which is also processed inside the WWTP, during the sludge treatment process. Firstly, the sludge enters the thickening procedure, which is conducted inside a sludge thickener, an equipment resembling a clarifier tank with an added stirring mechanism. Then, the sludge goes through the organic matter digestion process, which reduces the amount of organic matter in the sludge. Three different digestion options can be used: Aerobic digestion, anaerobic digestion, and composting. The digestion process can produce biogas (a mixture of CO2 and methane), which can be used at the plant for powering equipment. The last sludge treatment process is dewatering, in which the sludge is commonly placed in drying beds. The dried sludge is either burned in incinerators, sent to landfills or used as fertilizer in agriculture.

2.2. Wastewater Treatment Plant Defining Problems and Weather Dependency

Some of the defining problems that can be identified in a WWTP are:
  • Overloading of the plant: This can cause overheating of the blowers, which, in turn, causes a low-oxygen level in the bioreactor tank, thus reducing the efficiency of the secondary treatment stage. Plant overloading can also lead to sludge leakage from the settling tank.
  • High substances consumption: For instance, the odor treatment process requires continuous adjustment of the used substances, depending on the input wastewater concentration and content. The wastewater content is highly dependent on the weather conditions.
  • High energy costs: Around 30% of the annual WWTP operation costs is represented by the electricity consumption. Considering a developed country, an estimate of about 2–3% of the entire nation’s electrical power is consumed for wastewater treatment. This can be significantly improved by optimizing the biological treatment processes.
  • Equipment and/or algorithmic faults that can lead to various problems.
  • Undersized treatment plants: Most plants were developed 10–20 years ago, becoming undersized for the current loads since then, leading to the choice of increasing the load and costs in order to maintain a thorough cleaning process or discharging the partially treated wastewater to the environment and keeping the costs lower.
A WWTP’s operation is influenced by the weather conditions, the most significant being the precipitation amount. In case of very heavy rainfall, the WWTP may use the bypass channel, thus resulting in a high increase in operational costs (electricity and substances usage) or pollution. Even if the rain amount does not produce wastewater that can be legally sent to the environment after just primary treatment, the amount of rain highly influences the content and concentration of the wastewater present in the WWTP, which, in turn, influences the biological treatment that is applied in the secondary treatment stage and the chemical addition amounts and concentrations in the tertiary treatment. Besides rain, the temperature can also influence the WWTP, primarily from the odor treatment process standpoint, but also from the biological treatment in the secondary stage and sludge dewatering (when outdoor drying beds are used) processes standpoints. In addition, a storm or strong winds, particularly in the autumn, can generate large quantities of tree branches and leaves that can clog the screening filter during pretreatment.
Considering the typical processes that take place inside a WWTP, the defining problems and the usual weather influence on WWTPs that were previously presented, the conclusion emerges that a WWTP represents the perfect environment that can benefit from a solution capable of identifying the exact dependencies and relations that exist between the measured characteristics of a WWTP and meteorological characteristics. Furthermore, using those relations and dependencies for predicting the future evolution of the plant characteristics can provide a valuable foundation for optimizing the WWTP in order to reduce costs, lower energy consumption, decrease substance consumption, and improve maintenance. Due to these considerations, although the implemented solution presented in the following section represents a generic approach, it was deployed for testing and validating purposes in a WWTP environment, where the potential to make an impact is considerable.

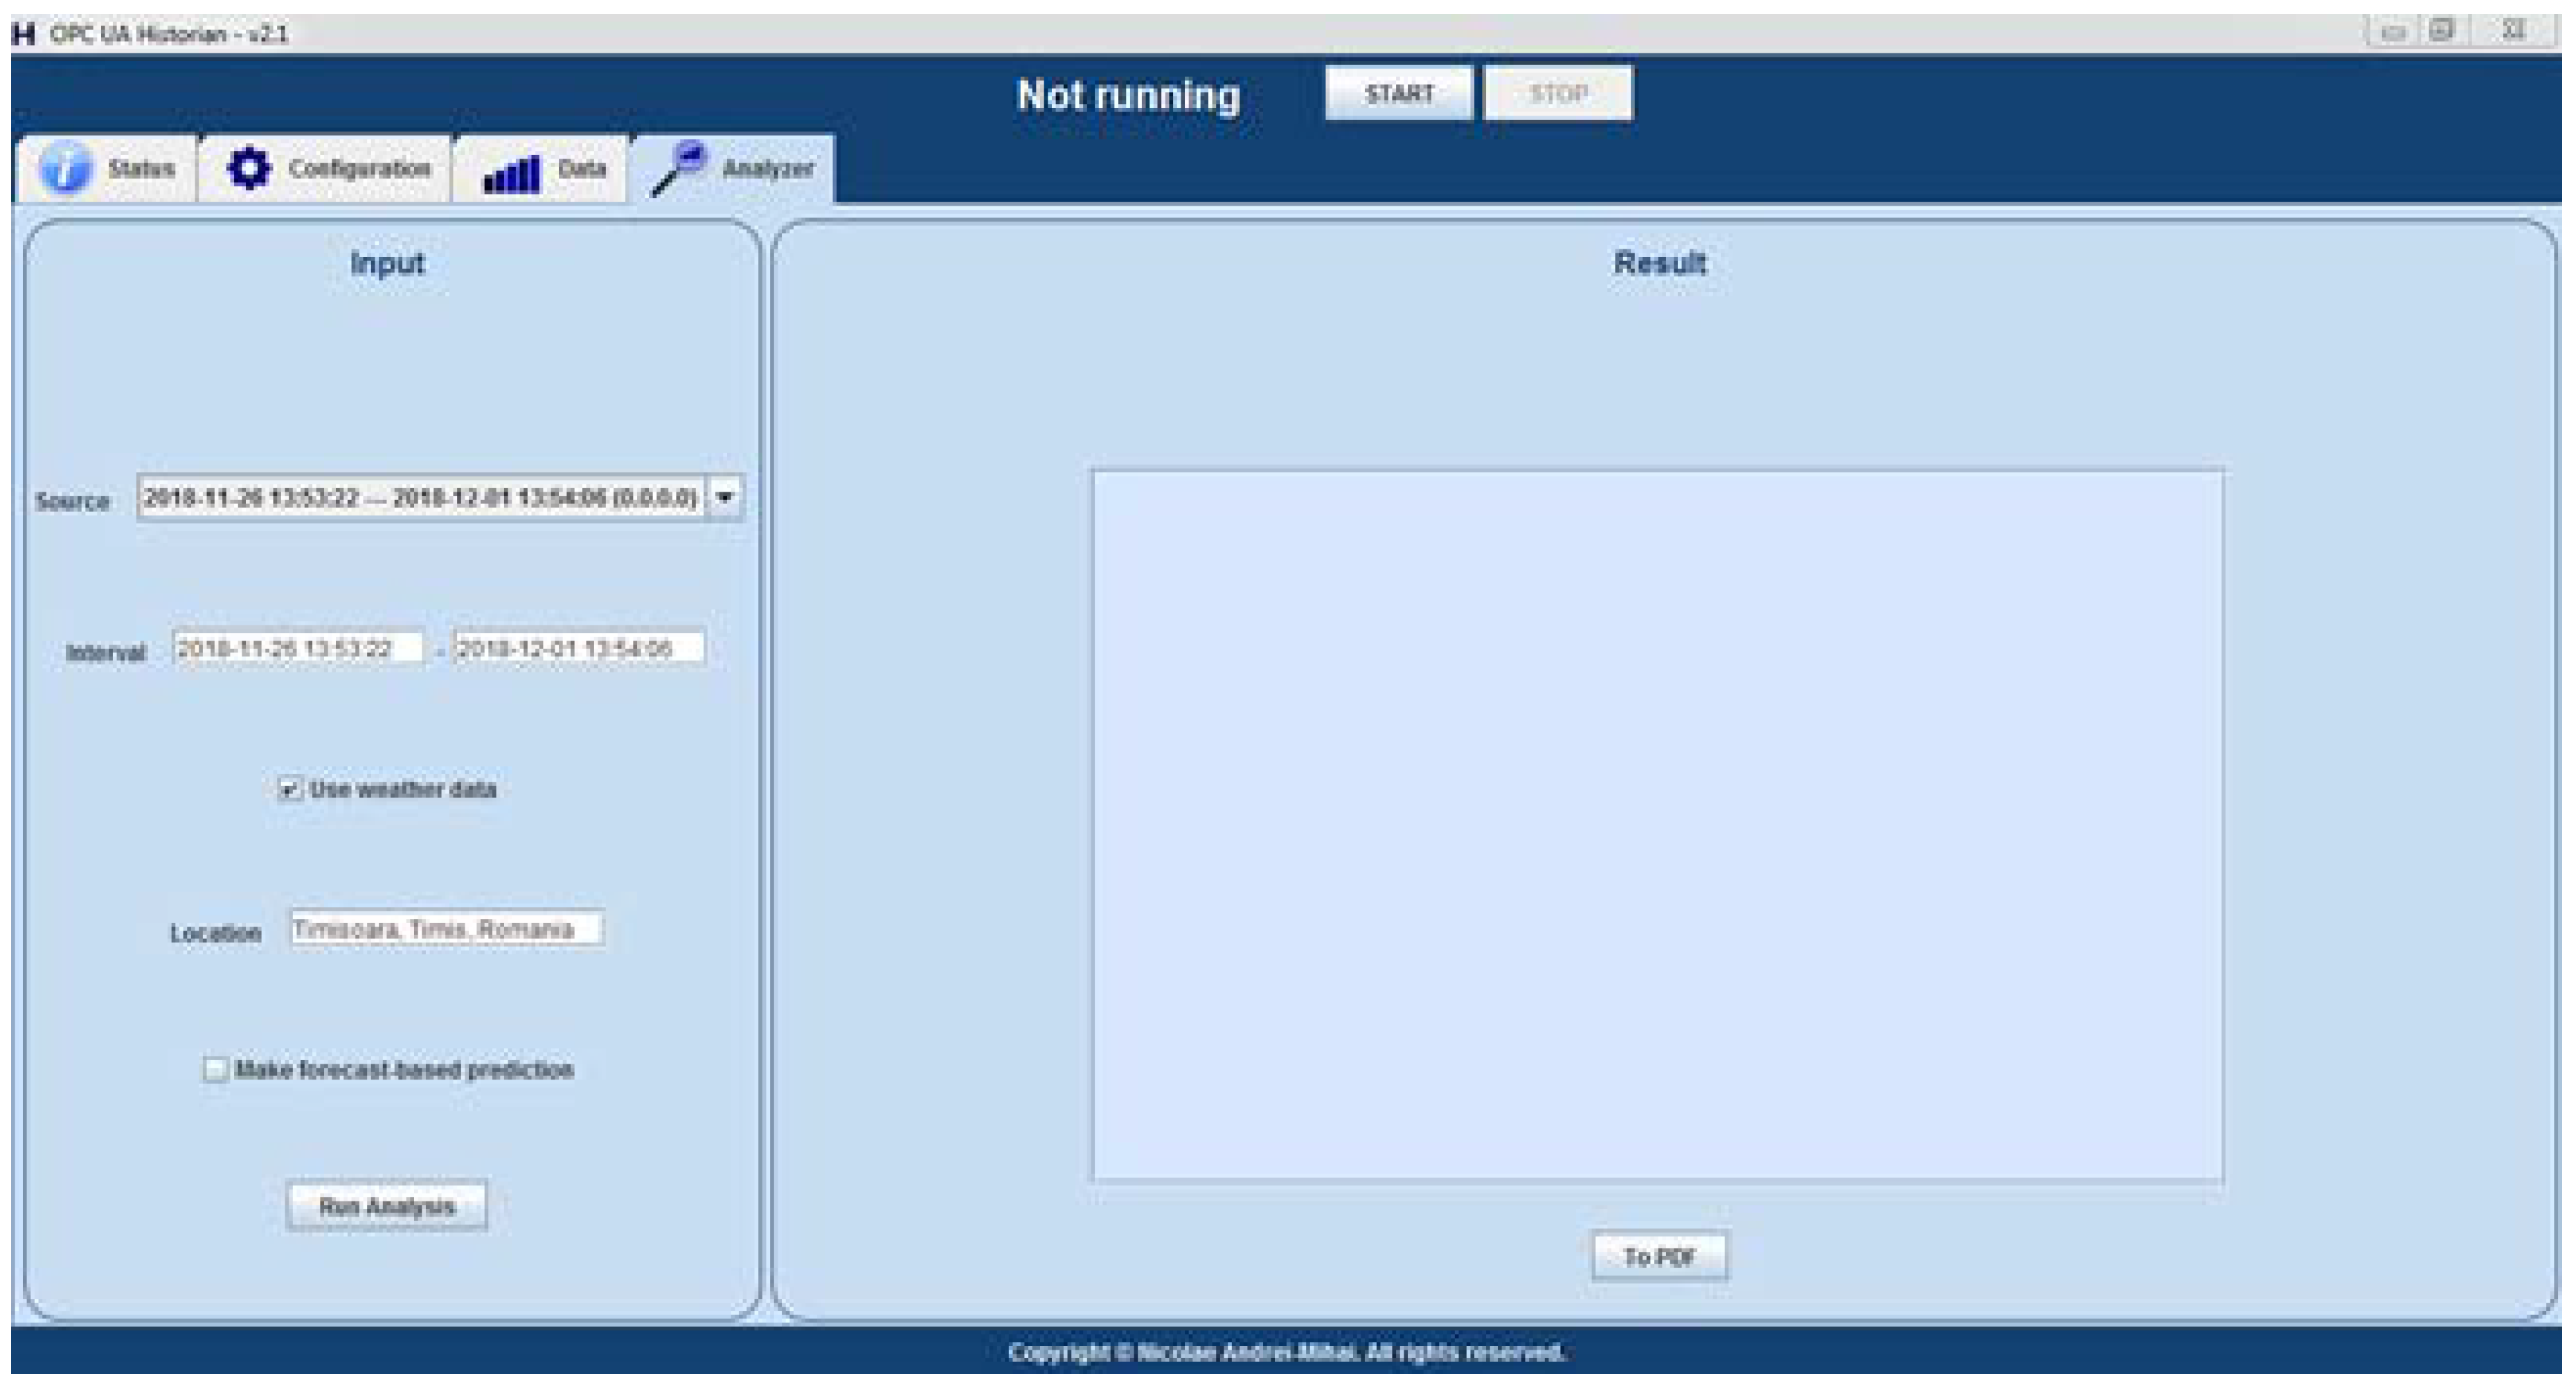
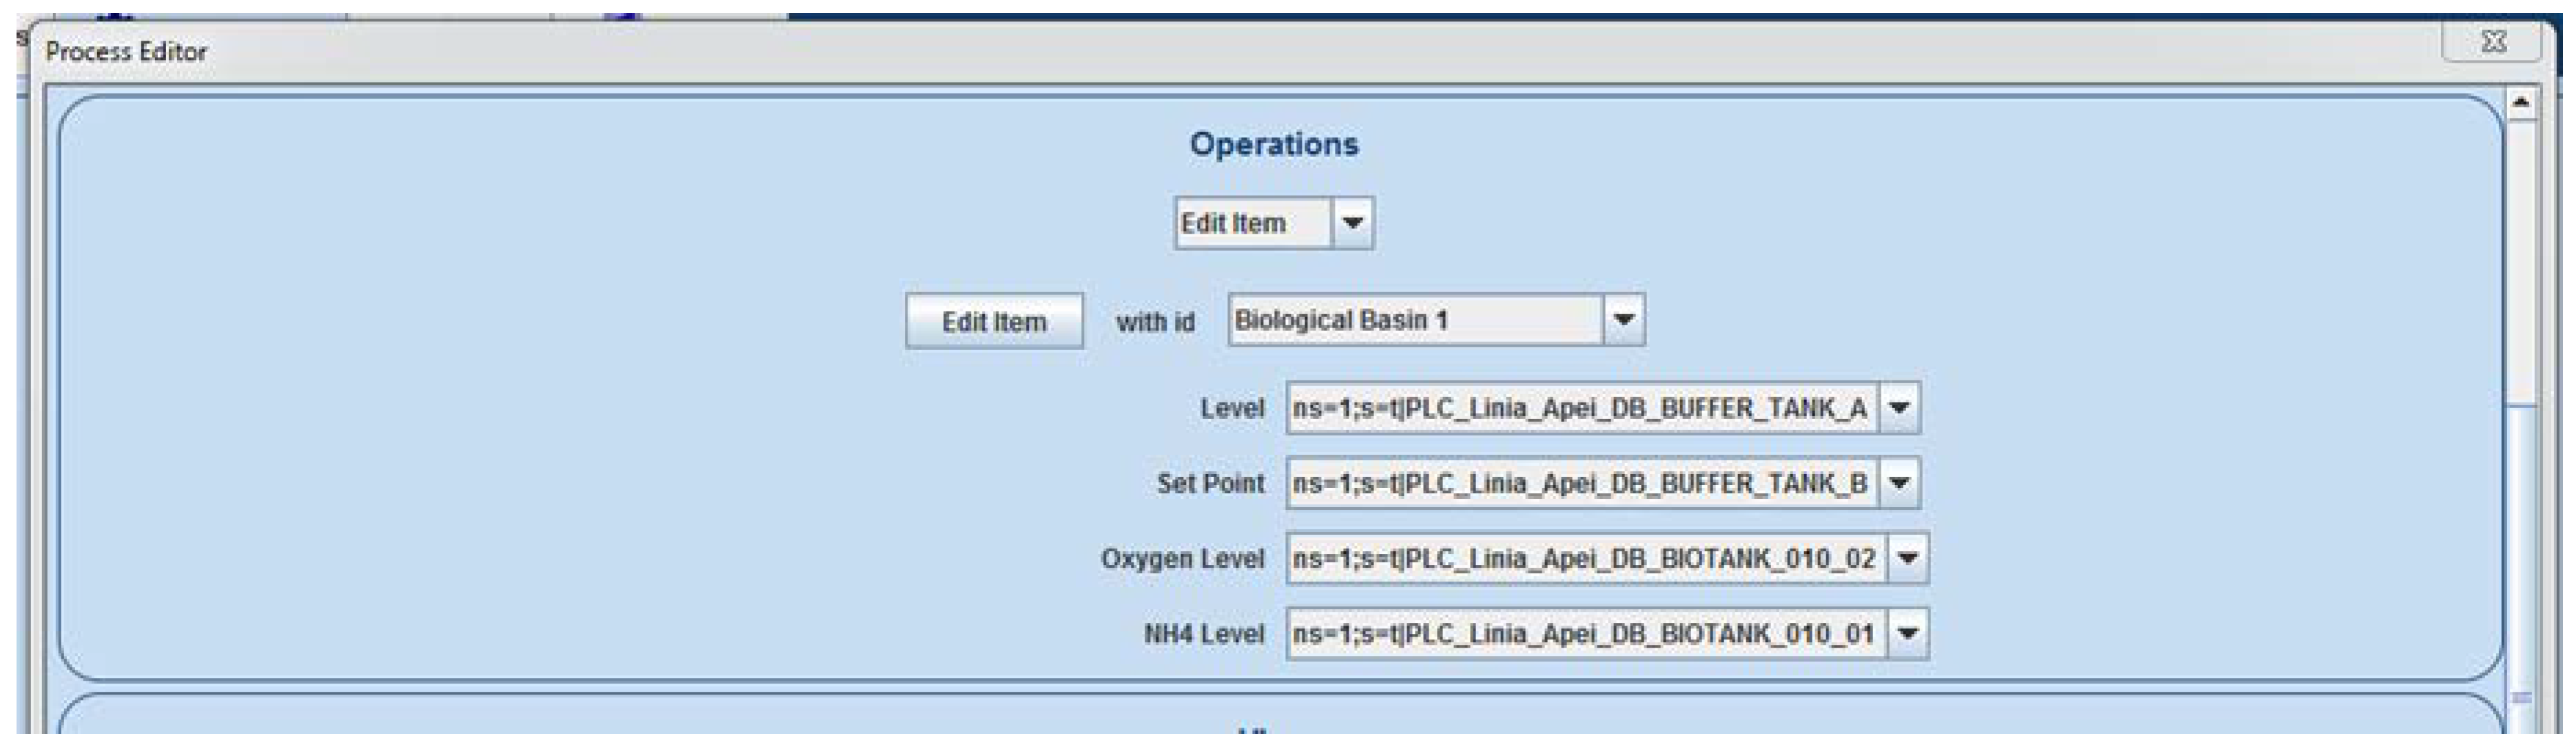
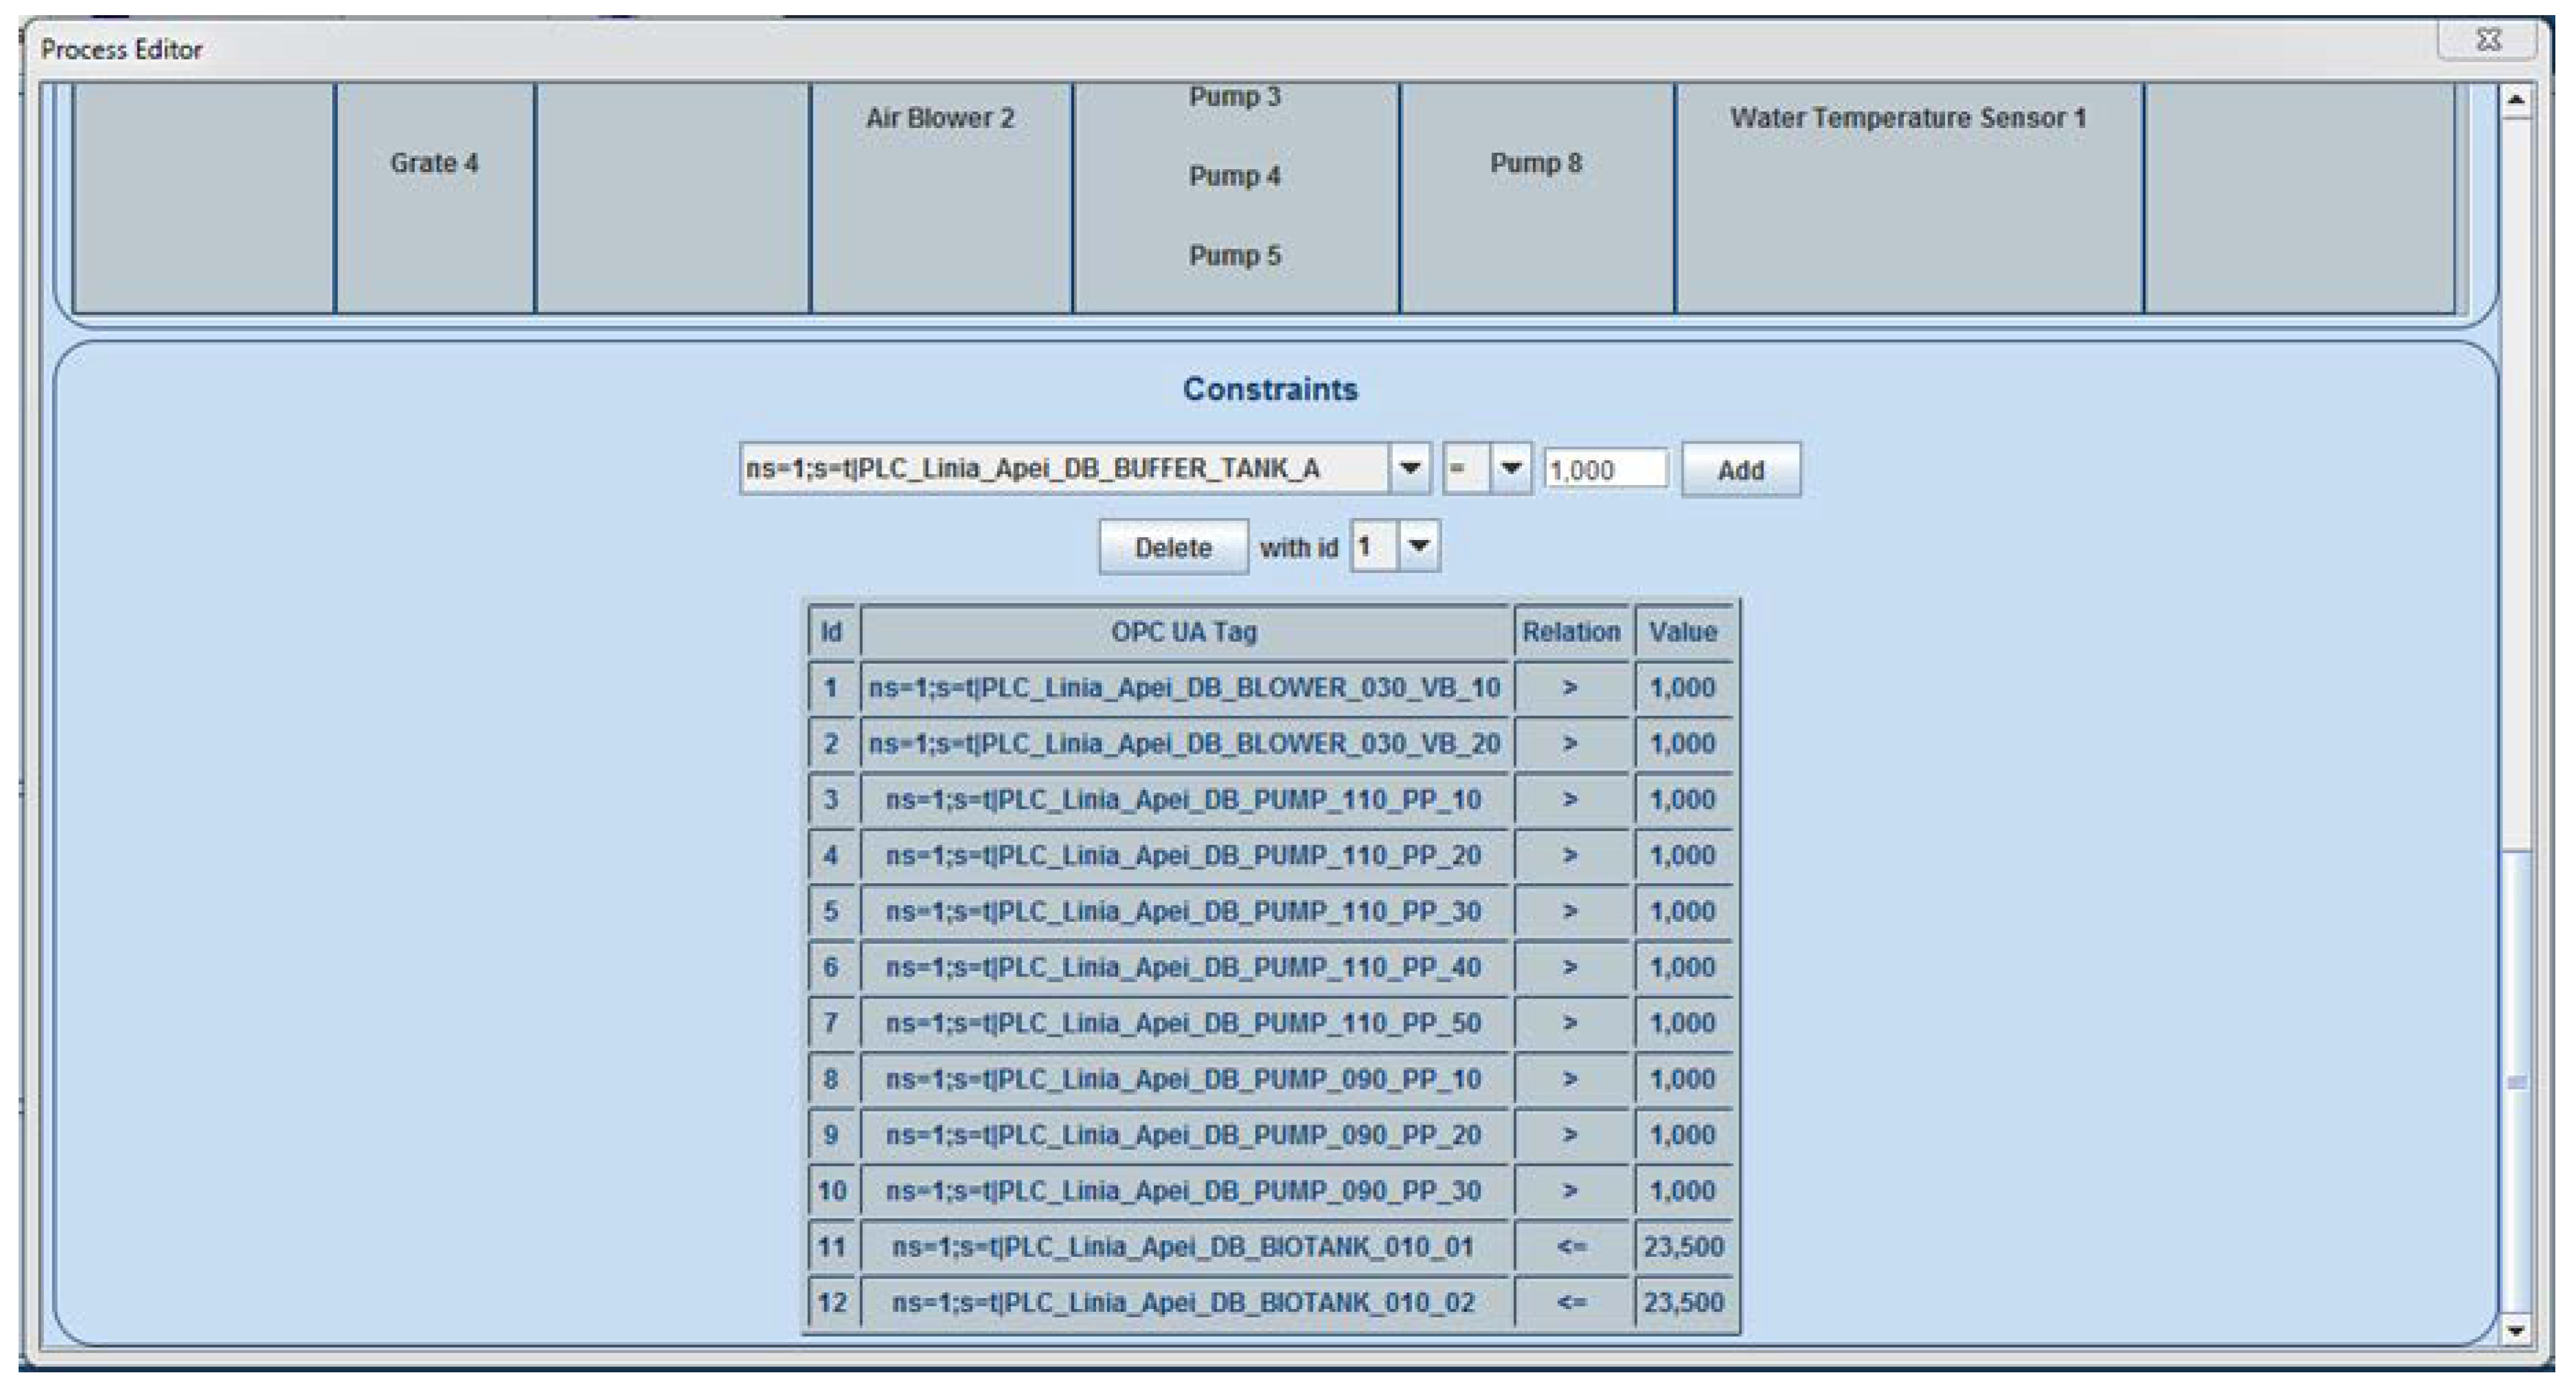
2.3. The Implemented Solution

As previously mentioned, the solution that was implemented in this paper is based on the state of the research that was achieved in [26], making use of the already-implemented both Historian application and the first level of the proactive Historian reference architecture. This already-available technological state was tested and validated in the water industry as well (results from the already-implemented first-level algorithms were used in [27] to successfully achieve energy consumption reduction in a drinking water treatment plant, by 9% for short-term tests and by 30% for long-term tests using only part of the proposed algorithm), so it represents a reliable platform on which to build and develop, following the ultimate goal of accomplishing a fully functional proactive Historian application.
In order to merge the implementation of the second level of the reference architecture into the constantly developing application, several improvements and changes were required to the solution already implemented in [26].
First, after long-term tests, a small improvement was made to the first-level algorithm accuracy, which, in some cases, resulted in impacting differences. The computations were adjusted in order to achieve more accuracy (in the form of decimals) in relating identified data dependencies.
Another change was made regarding the choice of the reference tag. In [26], the implemented algorithm required the user to choose a reference from the available tags, and the remaining tags were analyzed regarding the chosen tag. In order to materialize a broader understanding of all the relations and dependencies that exist inside the monitored system, the implementation presented in this paper removed the need for choosing a reference tag. Instead of this approach, each of the monitored tags are set as a reference, one at a time, and the relations identifying algorithm developed in [26] is run once for each reference.
By adopting the aforementioned change related to the reference choice, new data structures are required for storing the results generated by the first-level algorithm. The relations identifying algorithm was adjusted in order to build an oriented graph of dependencies, where the results of the algorithm execution are stored. The built graph is oriented, weighted, and can contain cycles. The results are modeled using the following convention:
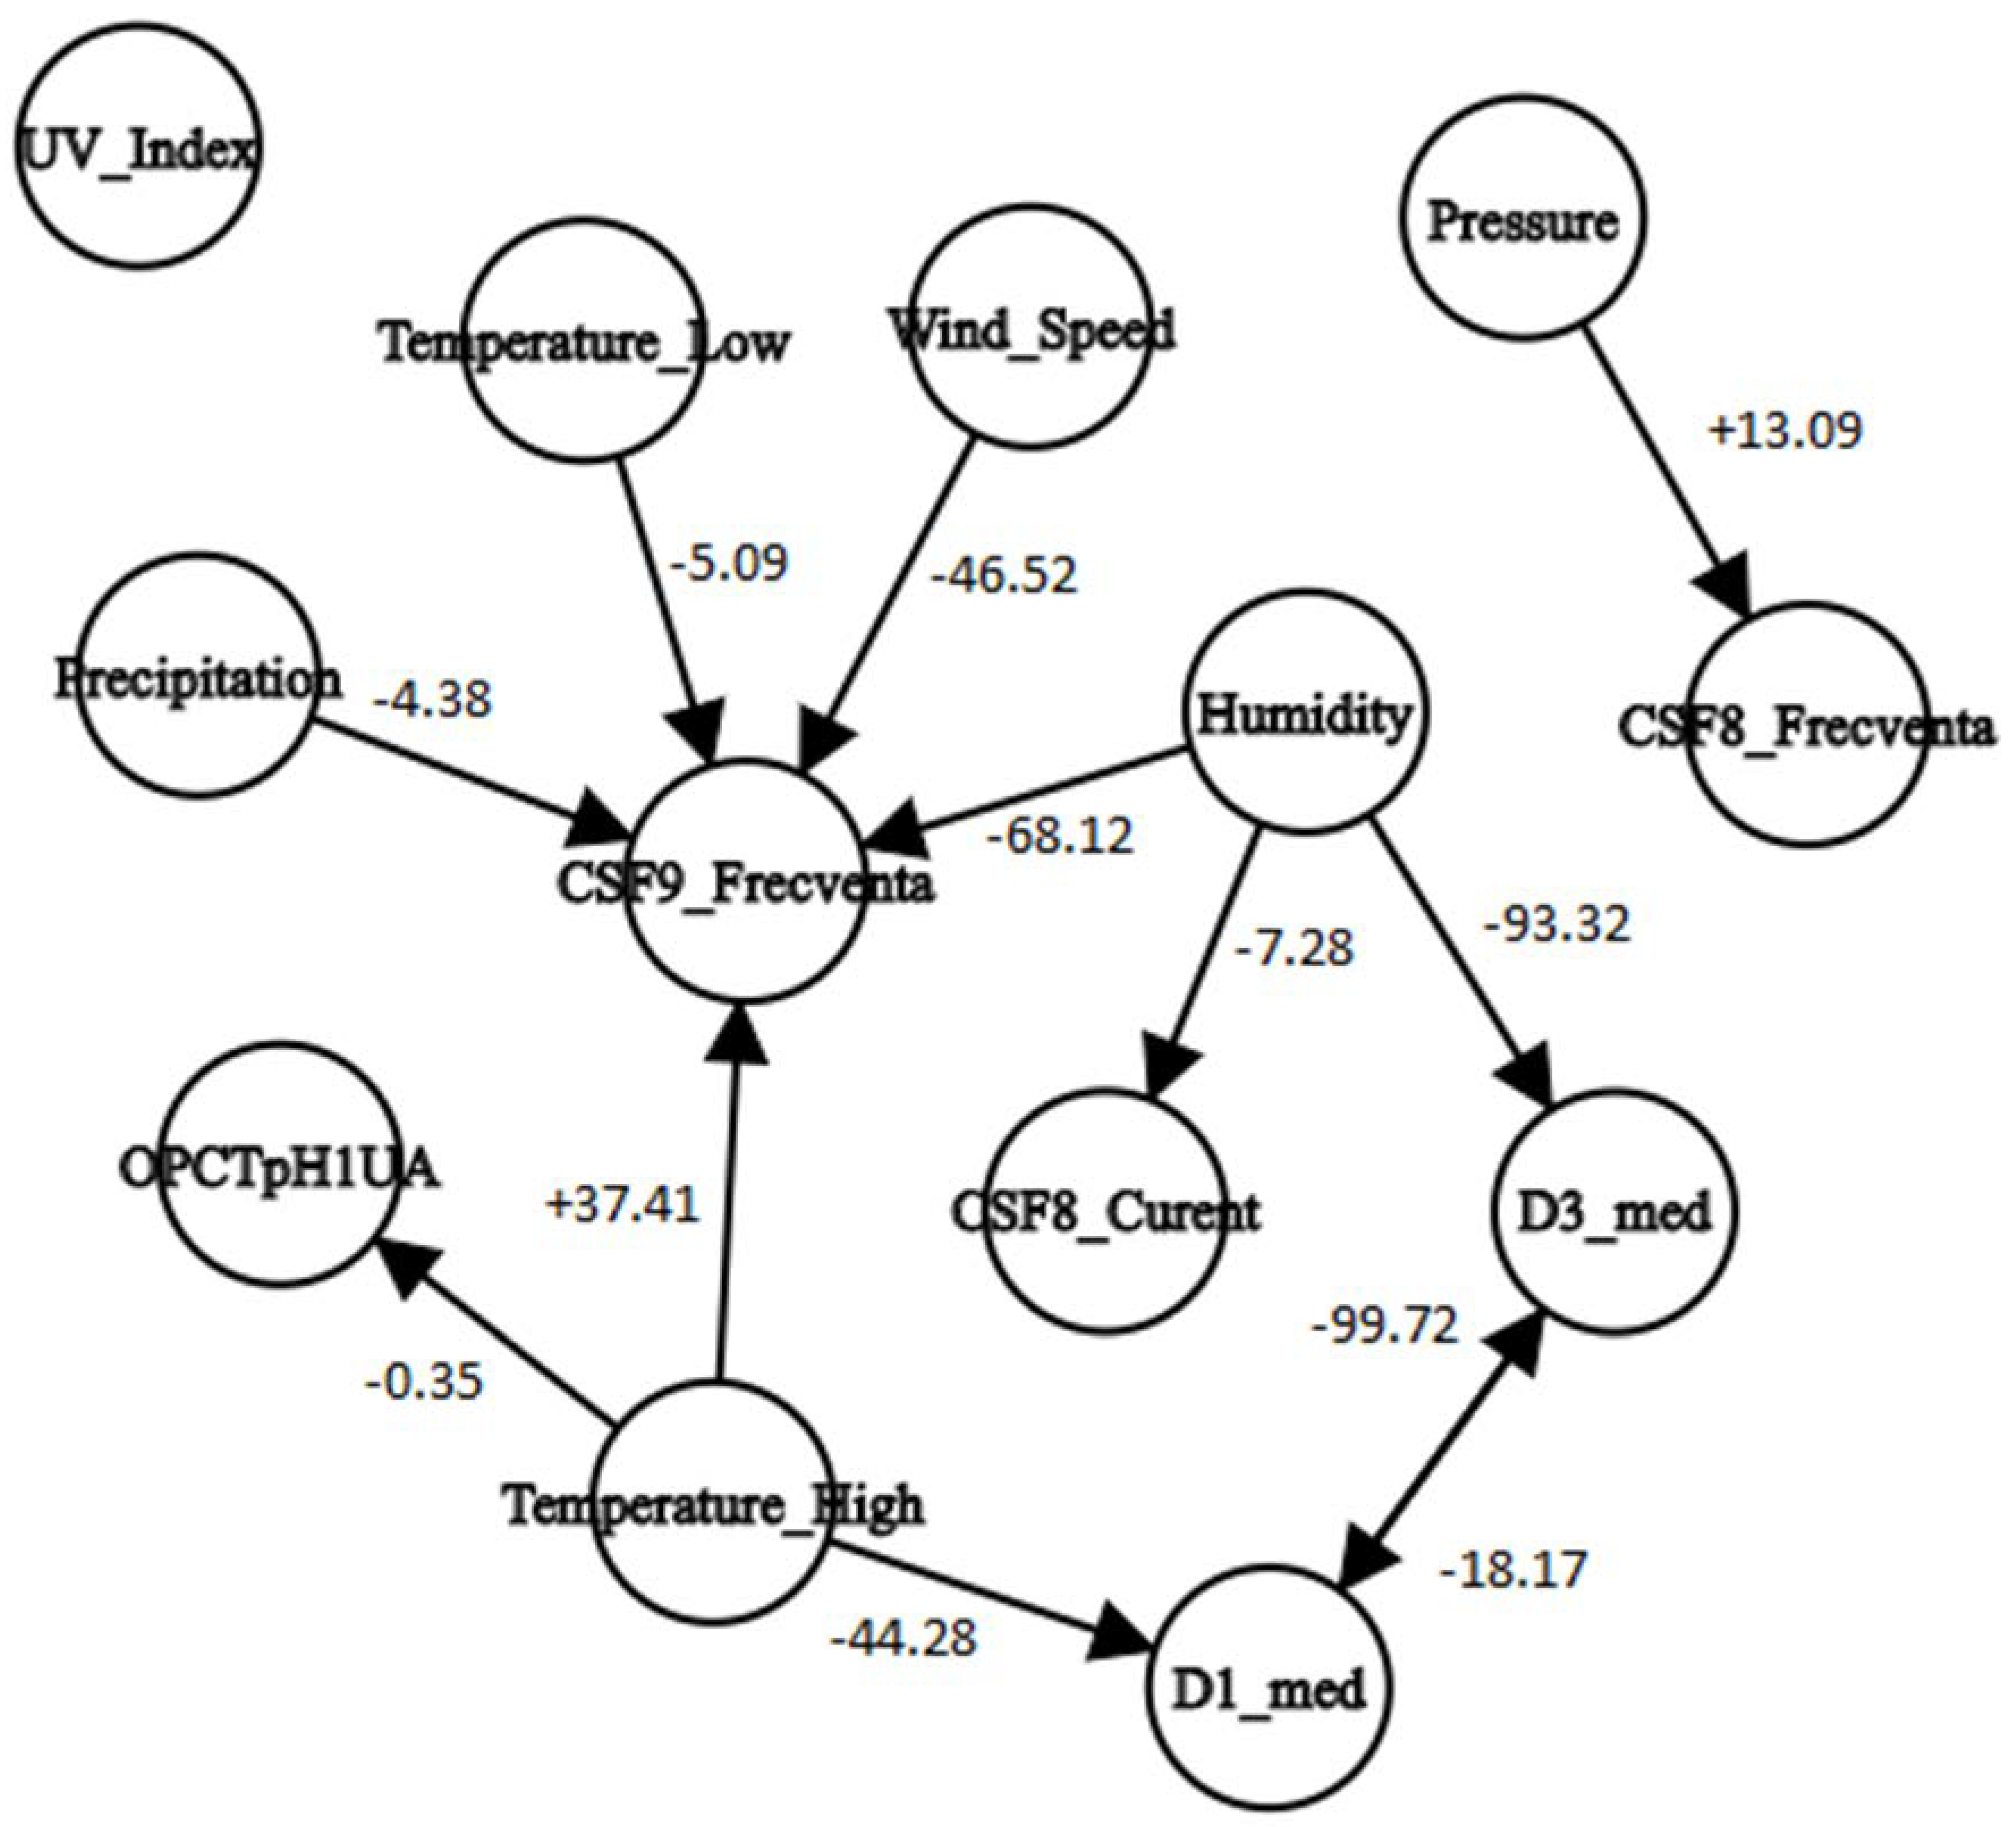
  • An arc from node i to node j with weight -N signifies when node i was set as the reference,
  • A dependency of node j on node i was identified,
  • The measured values of node j evolving inversely proportional (minus sign) to the node i values, in a quantitative proportion of N% (this percent represents the quantitative result identified by the analysis; more details regarding this percent is available in [26]).
In the current implementation, the dependencies graph is stored using the adjacency matrix. Inside the matrix, line i contains the dependency values (please refer to [26] for details) of all nodes j on the columns when node i is used as a reference. The dependencies graph represents essential input for the second level of the reference architecture.
The last improvement that was brought to the solution developed in [26] consists of the possibility to involve the meteorological characteristics in the relations analysis. Historical weather data can be used in the relations and dependencies identification algorithm (at the first level of the reference architecture) at user demand. The historical weather data source is the DarkSky online service [28]. If the user chooses to use historical weather data, the values of the relevant weather characteristics for the water industry (maximum temperature, minimum temperature, precipitation amount, humidity, atmospheric pressure, wind speed, and ultraviolet (UV) index) are obtained from [28] for each of the days in which tags values that are involved in the analysis exist. As a requirement for obtaining the weather data, the geographical location of the monitored technical system must be provided by the user. The longitude and latitude of the location that are required for calling the weather application programming interface (API) are obtained from the user-provided address, using [29]. After having at disposal the values of each of the 7 meteorological characteristics considered of interest, each of them is used as a reference, one at a time, in the relations identifying algorithm, which computes only the dependency of the technical system tags on the weather features. The weather features dependency on the technical system tags does not make sense, so it is not computed. As a consequence, if the user chooses to include historical weather data into the first-level algorithm analysis, the adjacency matrix of the dependencies graph will be deformed, containing i + o lines and i columns (where i signifies the number of tags from inside the monitored system and o signifies the number of tags from outside the system, essentially the number of meteorological features), meaning that the graph will not contain any arcs from a technical system-monitored tag to a weather feature.
The improvements described above have led to the modification of the Historian application graphical user interface (GUI), where the new interface elements are presented in Figure 2. The user may enable the Historian to be augmented with the predictive algorithm from the second layer of the reference architecture. This action is only allowed if the historical weather data are used in the relations and dependencies identification algorithm, at the first level.
Improvements in the developed solution from [26] were necessary for the second level of the reference architecture. The section follows with the predictive algorithm development, placed at the second level in the reference architecture. The algorithm predicts the future evolution of the monitored technical system, based on the weather forecast and the relations and dependencies identified by the first-level algorithms.
The execution of the developed prediction algorithm is conditioned by the following prerequisites:
  • the dependencies graph generated by the first-level algorithms must be available;
  • weather forecast data must be obtained from [28];
  • the most recent values of the monitored tags (which are used as initial values in the prediction process) must be extracted from the database (it is not necessary that they represent the current values; if the current values are not available, then the most recent ones are used);
Considering the valid prerequisites, the prediction algorithm is launched in execution, and Figure 3 below summarizes an overview of the implemented algorithm.
When the predictive algorithm starts predicting values for a new day, it first initializes the monitored tag values from the technical system. For the first day of prediction, the initial values for the system tags are the most recent values from the database. For the remaining predicted days, the initial values are the same as those computed/predicted by the algorithm for the previous day.
The forecast weather data can be obtained from [28] for a maximum of 7 days (d) ahead, thus leading to a breadth-first traversal of the dependencies graph for each of the chosen weather features in each of the 7 d ahead. The standard breadth-first traversal algorithm was adjusted in order to remember the node from which the traversal arrived at the current node, information required by the function that processes the current node (process_node function is presented in Figure 3). The root node of the breadth-first traversals is always a weather feature, meaning that, starting from the weather features-predicted evolution, the algorithm can predict the evolution of the technical system tags, based on the identified dependency between the weather features and the system characteristics that were identified by the first-level algorithm. By executing the breadth-first traversal, all the existing relations between the technical system tags are considered in a global manner. For instance, if technical system characteristic A is directly influenced by temperature and technical system characteristic B is inversely influenced by A, the weather forecast indicating an increase in temperature for the following day, only computing characteristic A’s new value based on the temperature increase, does not offer an accurate prediction of the system’s overall evolution, because the increase in A causes a decrease in B as well. These kinds of cases are fully covered by the implemented algorithm, thus seeking to obtain a realistic prediction.
The development of the process_node function is based on:
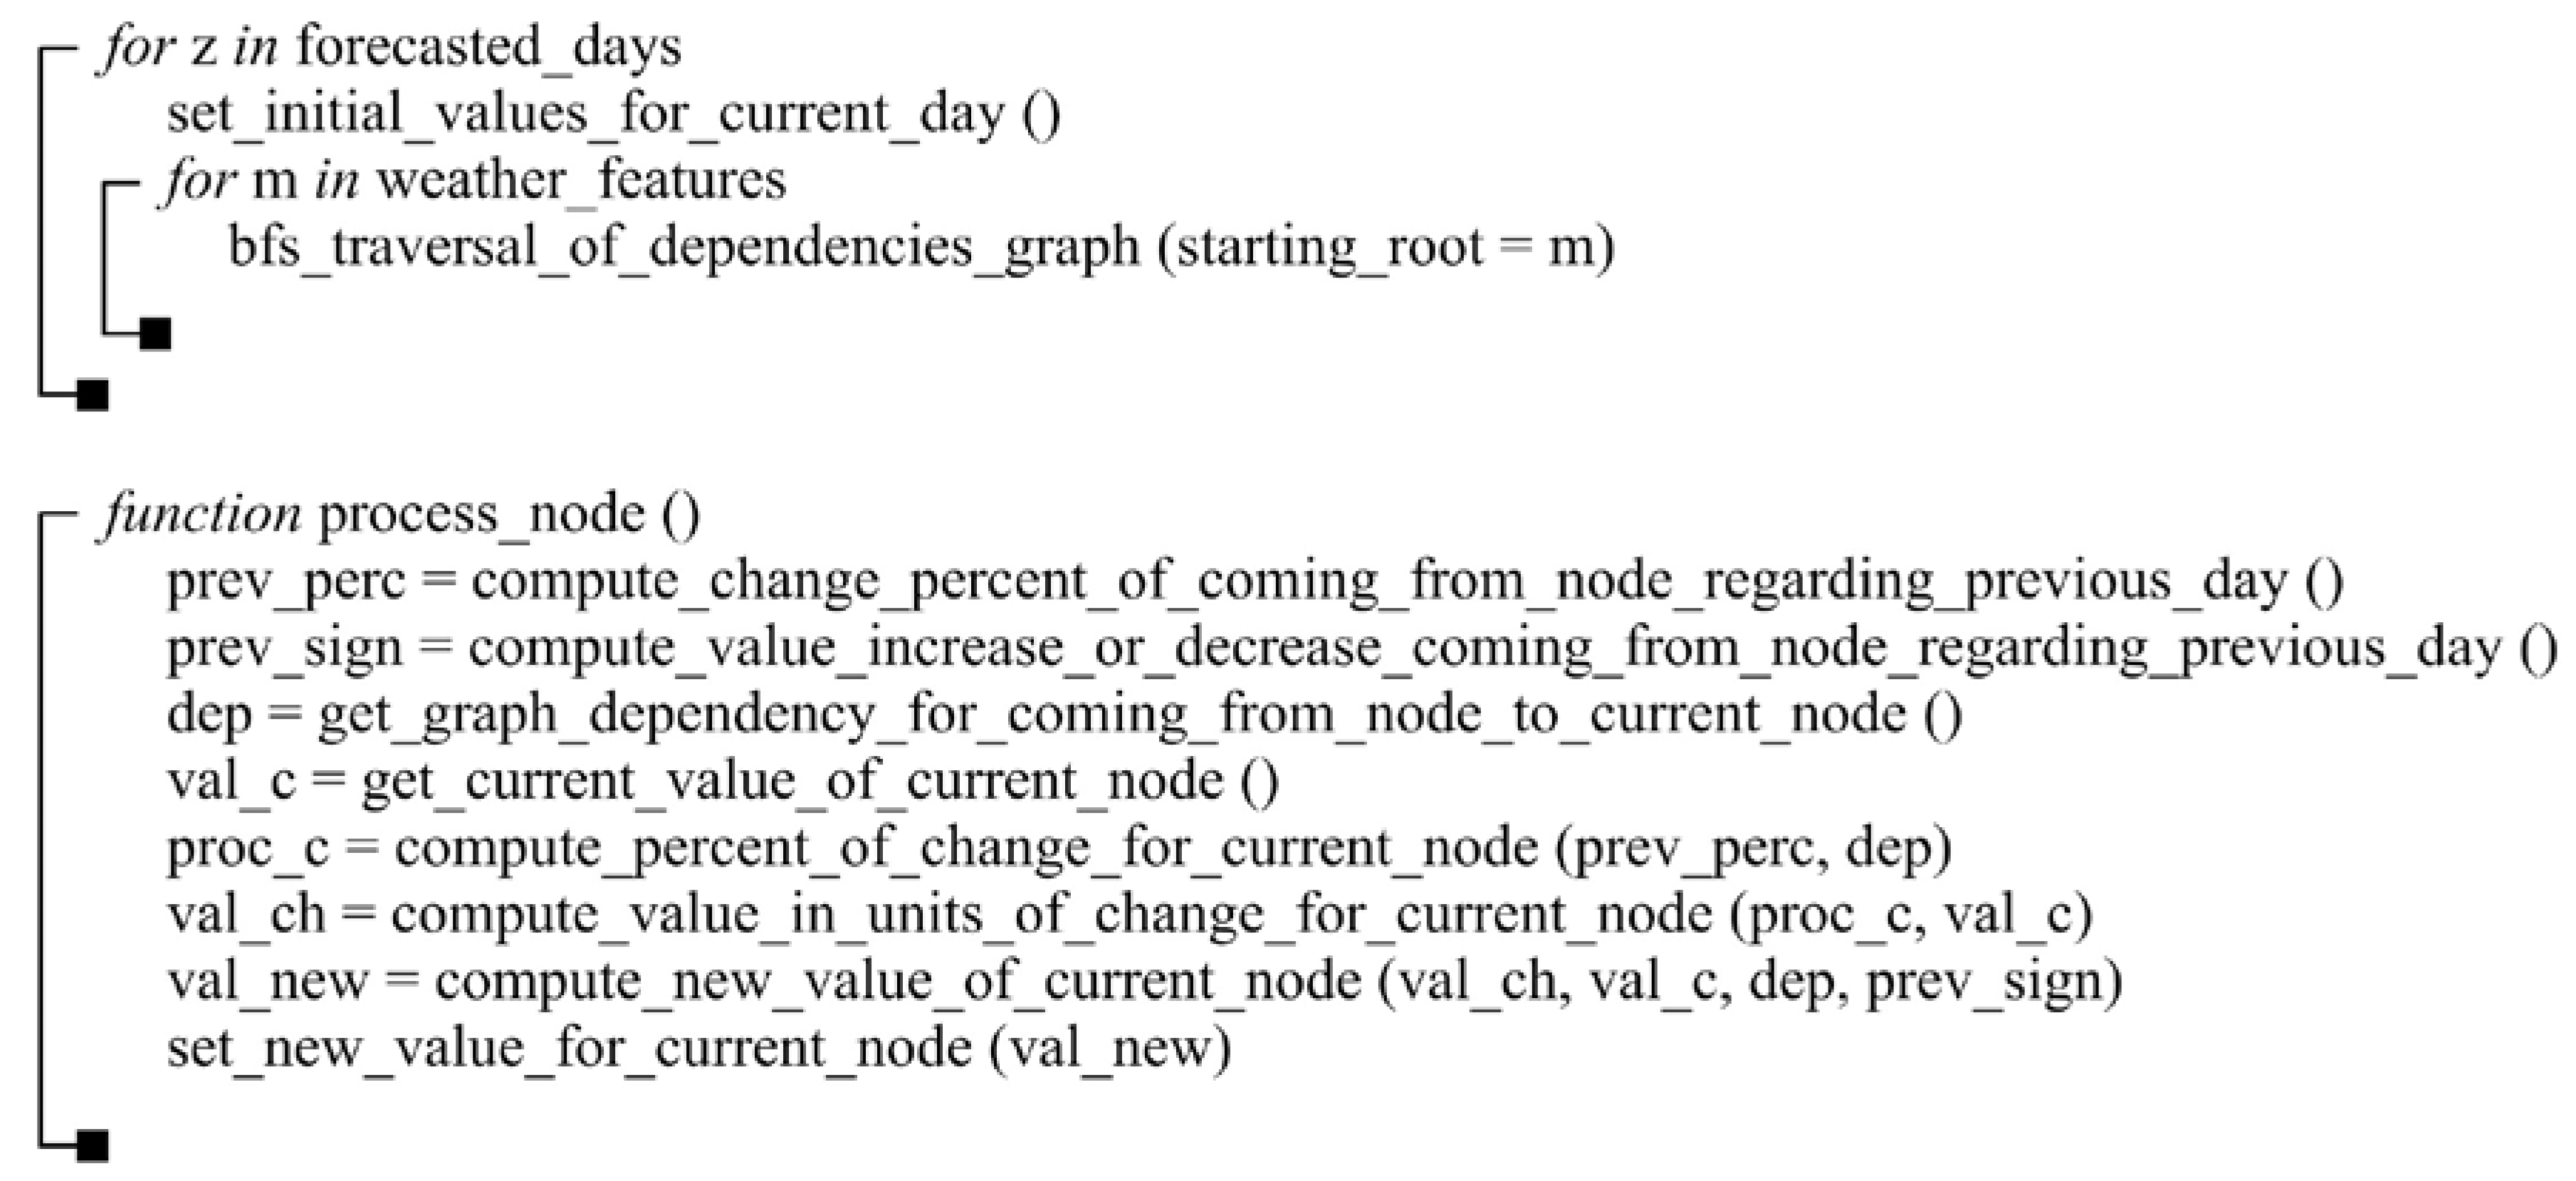
  • computing the percent of change in the previous node (the node from which the arc leading to the current node starts), by comparing the previous node’s current value and the node’s previous day value.
  • computing the sign of change (if the previous node’s value increased or decreased from the previous day).
  • using the percent of change in the previous node and the dependency from the graph, the predictive algorithm computes the percent of change for the current node (more details regarding the value of dependency in the graph can be found in [26]).
  • the percent of change for the current node is further used alongside the current value of the current node in order to identify the value of change (in units) for the current node. The value of change is onwards used together with the current value of the current node, the corresponding dependency from the graph, and the sign of change for the previous node, in order to compute the new value of the current node.
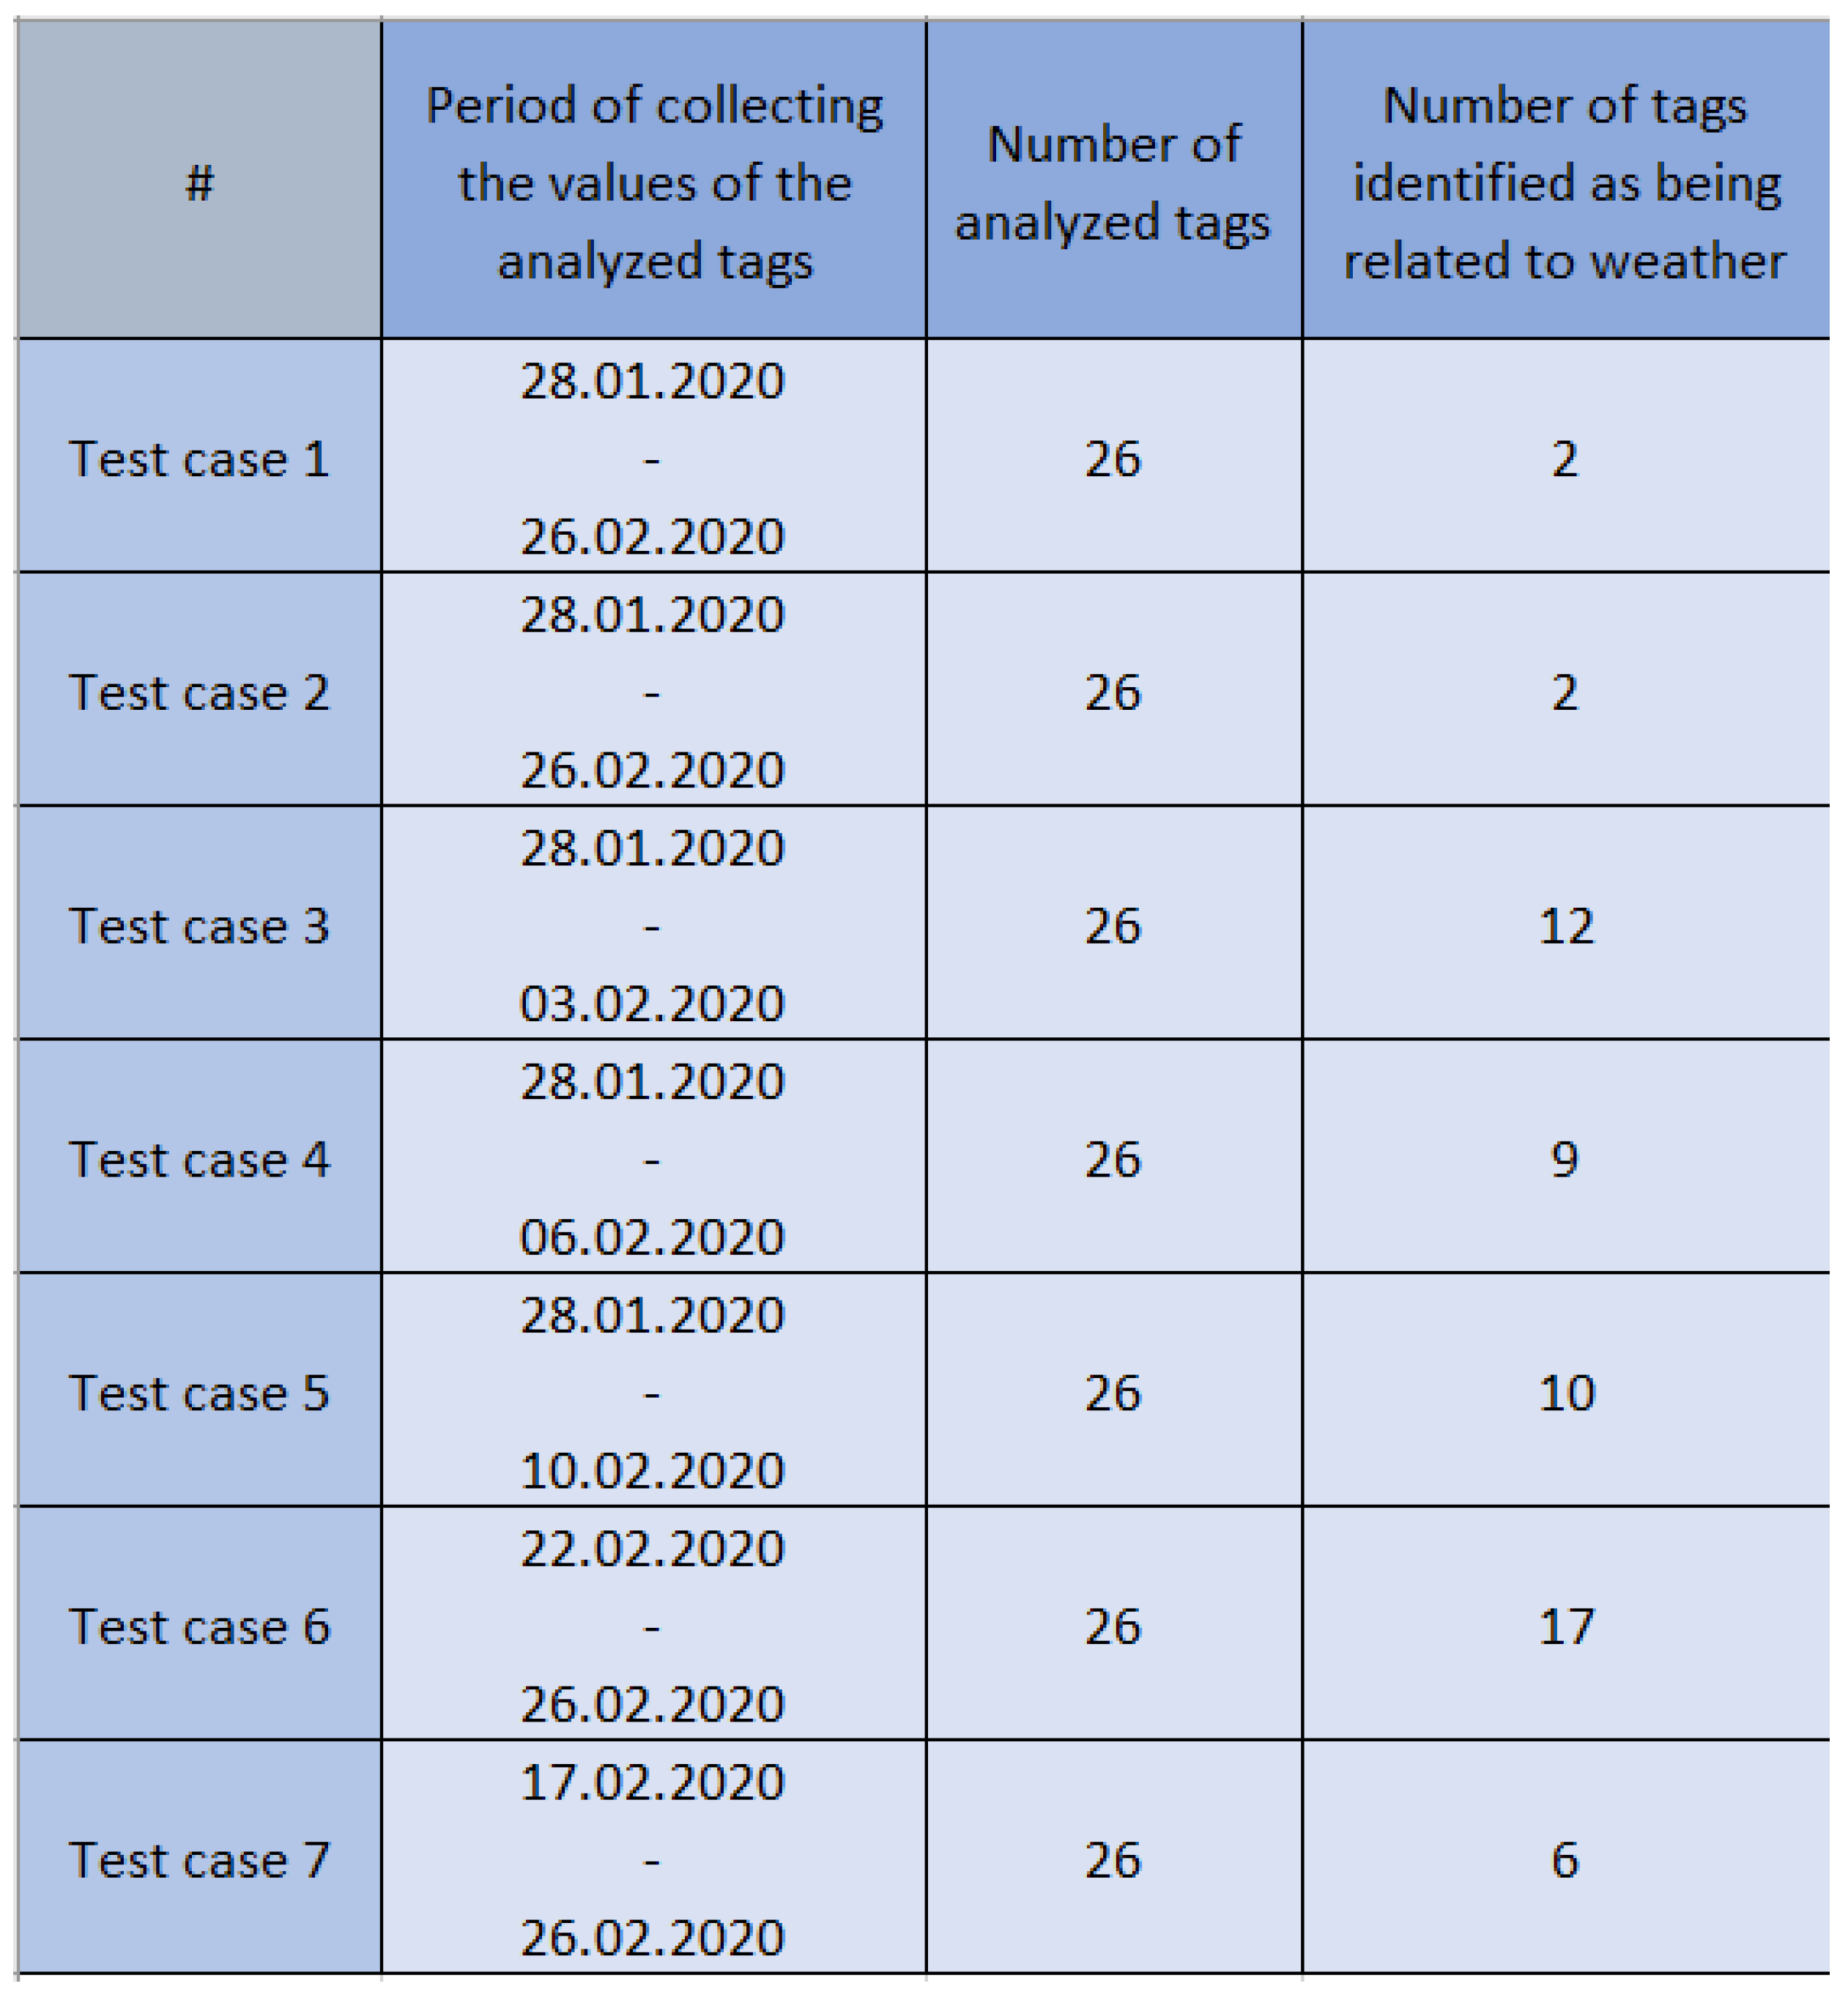
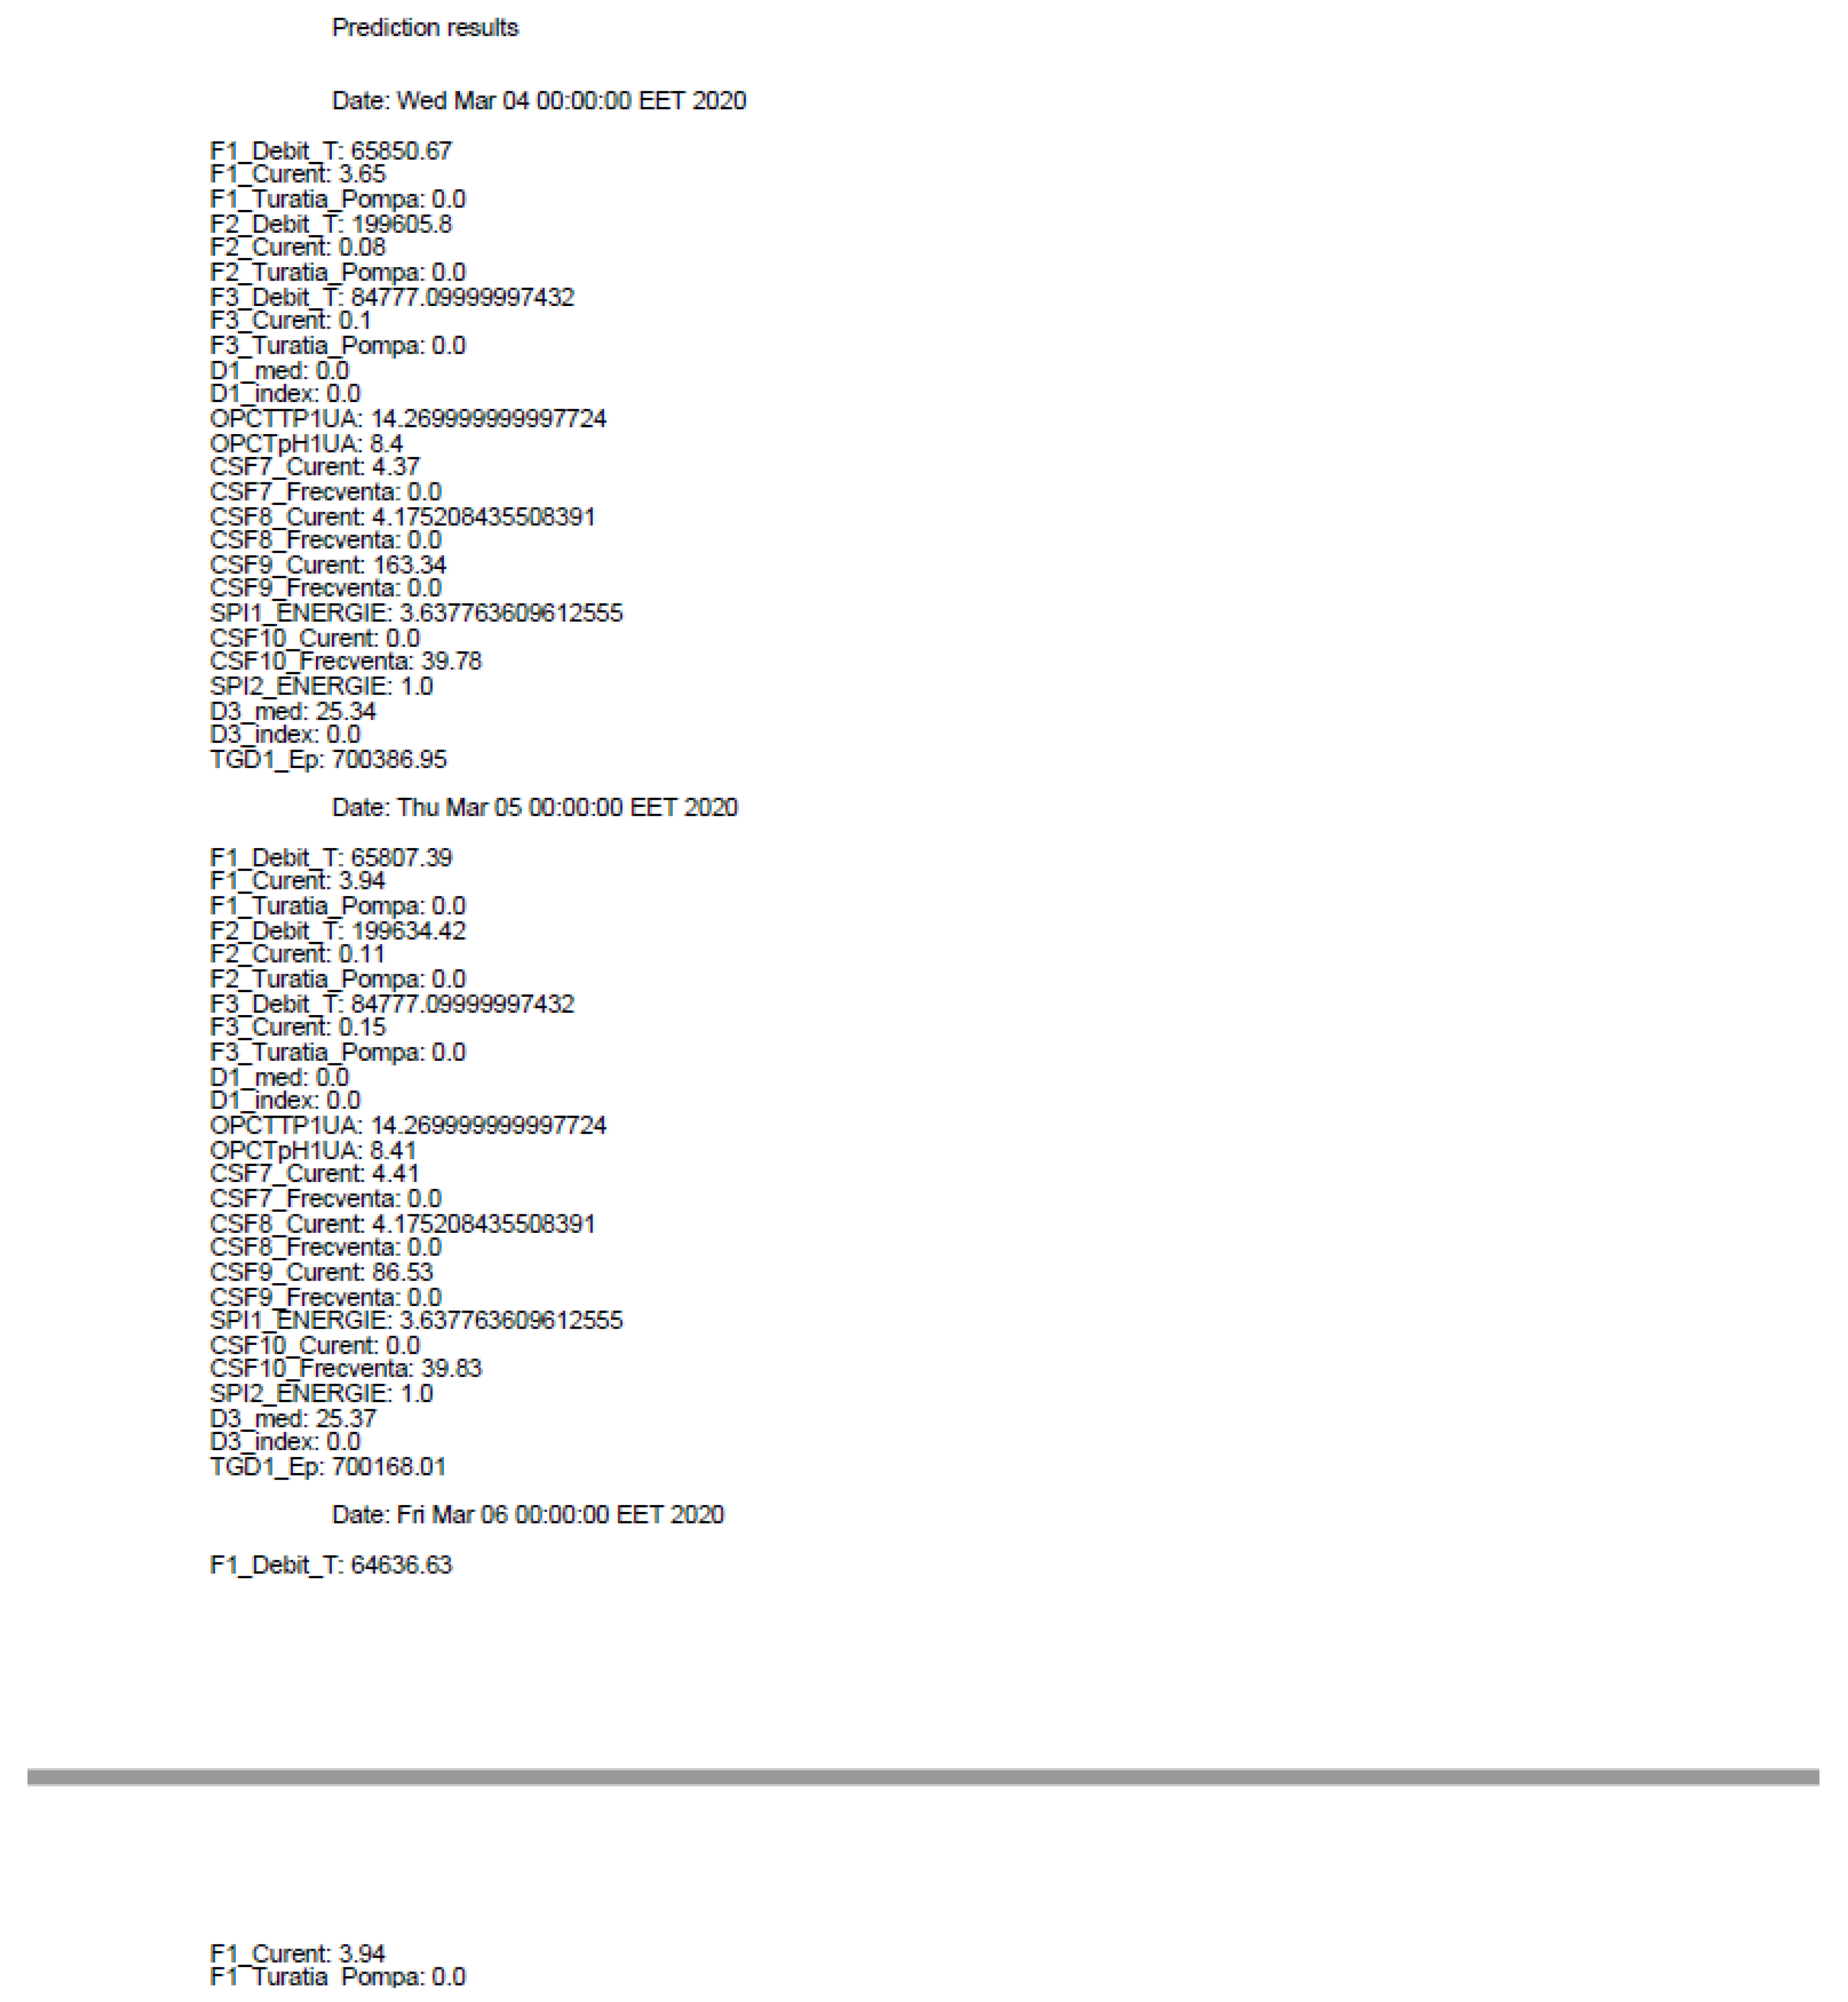
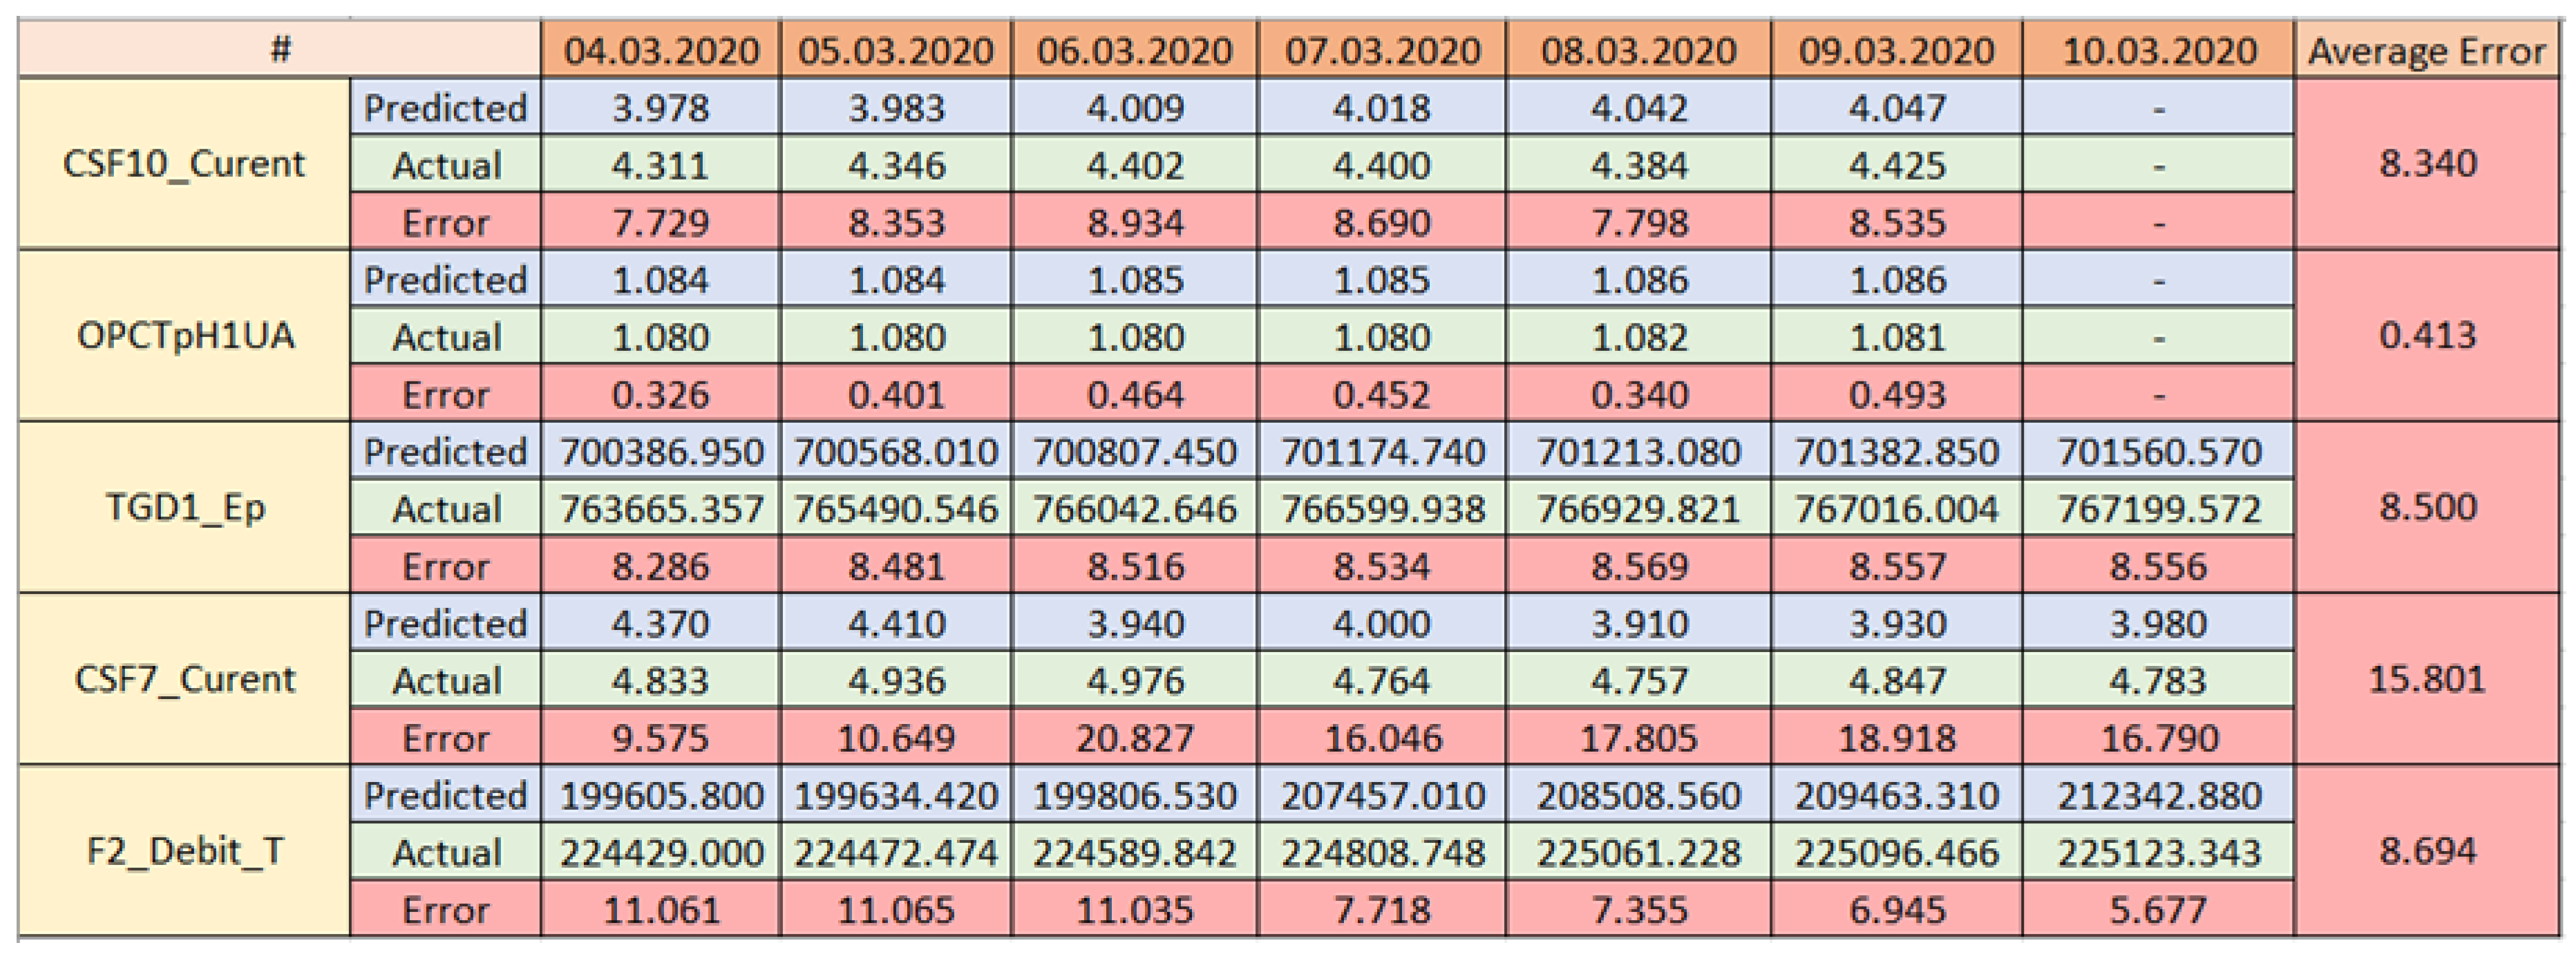
The output of the implemented algorithm represents the predicted values for the monitored tags from the technical system for 7 d of the prediction.
Thus far, the presented research implementation of the second layer follows a generic approach and can extend the water domain to any industry that relates to weather data. However, in order to apply and test the algorithm, a specific process is absolutely necessary.
After implementing the second layer of the reference architecture, it became obvious that the relations and dependencies identification algorithm and the predictive algorithm could both receive a significant accuracy improvement by capitalizing on different process-specific information, which can be used during algorithm execution (e.g., knowing that a specific Open Platform Communications Unified Architecture (OPC UA) tag signifies the ‘fault’ code for a pump can be used during analysis in order to avoid false-positives identification for dependencies between the pump energy consumption and other values; knowing that from a process point of view, the aeration process requires a blower that implicitly consumes energy; knowing process flow of the specific process; etc.). The process-aware Historian concept is essential for correct predictions, recipes, relevant data dependency analysis, and constraint and objective function interpretation. To be able to gather and use those process-specific information, the Historian application received a newly developed software module (Process Editor), which allows the creation of a model of a monitored process, inside the Historian application. Multiple processes can be defined, from which only one can be set as the currently used one, thus facilitating an easy switch between different monitored processes. Therefore, the process-aware Historian will request essential data mapping from the user according to the predefined process components characteristics. A defined process inside the Process Editor contains steps, which, in turn, contains items. There are multiple predefined item types from which the user can choose (water source, air blower, pump, flowmeter, water tank, etc.), each item having its own predefined characteristics (example for a biological basin: Level, set point, oxygen level, NH4 level). For each characteristic, the user can set an OPC UA tag from the server list, thus assigning a meaning to each monitored OPC UA tag. Figure 4 presents the editing of an item from the Process Editor, while Figure 5 presents a process of a WWTP, as defined in the Historian Process Editor. Furthermore, the possibility of adding different constraints to the process was also implemented and is illustrated in Figure 6.
Considering the generic approach of the Historian application, which is intended at not restricting it only to the water industry, even though predefined item types and characteristics are offered, the implementation created a generic framework, which makes use of two Java String arrays (containing all the predefined elements), for both building the required GUI elements and interacting with the Extensible Markup Language (XML) structure used for storing the process definition. This approach implies that adding and/or removing items or item characteristics requires just a small change in an array of Strings (no additional changes are required at GUI elements building or XML interaction), thus keeping the application suitable for easy expansion toward other industries.

3. Results

With the purpose of testing and validating the newly implemented features described in the previous section of this paper, multiple test cases were considered in the water industry, regarding a real WWTP, owned and operated by the local water company.
The tests were conducted by making use of the most recent Historian application version available, which included the implementation of both level 1 and 2 of the reference architecture, while being installed on the Raspberry Pi platform.
Figure 7 details the seven test cases that were considered for validating the second level of the reference architecture implementation. Each test case is covered over a period of time where data are collected (a set of relevant process data from a WWTP can contain 200–2000 tags, although the total number of tags from a WWTP can exceed 6000). From the entire set of tags, the monitored tags are defined as relevant to predict regarding the weather evolution. The number of analyzed tags for value prediction was 26 in all seven test cases. The 26 tags were chosen by the authors as being the most relevant and having the most potential of being used in any future optimization, representing mostly electric current consumptions for different pumps and air blowers and different water volumes inside the treatment plant and water quality indicators, such as turbidity.
Initially, the Historian application was used to store the measured values of the chosen tags for the time period presented in Figure 7, a task that did not involve any proactive features and could have been carried out by any classic Historian application. Afterward, the proactive features were assessed by executing the predictive algorithm for each test case, using the GUI controls illustrated in Figure 2 above. The inputs for the test execution included historical weather data alongside the stored values of the tags from the monitored system and started with the execution of the first level algorithm (the improved version described in the previous section, deriving from that implemented in [26]), which generated as output the dependencies graphs (a different one for each test case), such as the example depicted in Figure 8 (corresponding to test case 7). In building the representation from Figure 8, only the tags (and their corresponding relations) that were found dependent on at least one weather characteristic were considered, where a drawing approach containing all the monitored system tags (and their corresponding relations) made it difficult to follow.
The dependencies graphs (such as that shown in Figure 8) were used as input, in addition to the weather forecast (obtained from [28]) and the latest tags values at the moment of analysis, for the predictive algorithm described in the previous section. The outcome consisted of the algorithm successfully computing the predicted values of each of the 26 tags from the monitored system for the following 7 d starting from the execution date, in each of the seven test cases. Basically, the developed prediction algorithm accurately estimated the impact the forecasted weather will have on the technical system, by identifying and understanding (from the historical stored data) the relations that exist between the weather and the technical system tags. An example of the numerical results of the algorithm execution (for test case 5) is presented in Figure 9, where the illustrated pdf document has been exported directly from the Historian application.

4. Discussion

After computing the prediction, the Historian application was left in operation to store the values of all the monitored tags for a period of 7 d (the prediction is made for 7 d ahead); thus, at the end of the 7 d for which predicted values were available, the actual values, recorded from the WWTP, were also available, facilitating an assessment of the prediction algorithm viability.
For supporting an identification of conclusive aspects, in each of the seven test cases considered, the predicted values were compared to the actual values; the most significant results, considering all test cases, regarding the possibility of future optimizations and improvements in the monitored technical system, as summarized in Figure 10, are displayed in the following more detailed explanation.
Figure 10 presents five OPC UA tags (CSF10_Curent, OPCTpH1UA, TGD1_Ep, CSF7_Curent, and F2_Debit_T), whose values were identified as being related to the evolution of different weather characteristics. For each of those tags, Figure 10 illustrates the predicted value (blue lines) and the actual value (green lines) in each of the seven predicted days (the seven columns with headers containing dates). The error lines (red lines) present the prediction error for each day (computed in percent, using the following formula: E = (ABS (P – A) * 100) / A, where E = error, P = predicted value, A = actual value, and ABS = function returning the absolute value). The last column (“Average Error”) represents the arithmetic mean of the error values computed per day of the respective tag.
In the continuation of this section, the interpretation of the results presented in Figure 10 follows, with regard to the optimization possibilities of a WWTP.
Tag CSF10_Curent represents the intensity (in amps) of the electric current consumed by a pump, which is used for the transfer of wastewater from mechanical treatment to biological treatment inside a WWTP. This pump intensifies in usage as more wastewater enters the system and has a similar behavior as the bypass pump. Being able to accurately predict the usage of those pumps signifies the capability to predict the usage amount of the bypass system, which also has a huge impact on both the overall power consumption of the WWTP and the overall substances consumption of the WWTP. The usage of the transfer pumps and the bypass system is dependent on rainfall for the majority of the plants, leading to the conclusion that the prediction algorithm can bring significant added value to this area.
Tag OPCTpH1UA signifies the water turbidity, measured at the exit of the WWTP, a characteristic that shows the water quality after receiving the treatment inside the WWTP. This characteristic must meet legal requirements regarding its limits, and predicting it helps in better estimates of the future consumption of substances.
Tag TGD1_Ep represents the overall WWTP energy consumption, its accurate prediction being imperatively needed for any energy-related optimization.
Tag CSF7_Curent represents the intensity (in amps) of the electric current consumed by an air blower that introduces oxygen into a biological basin. Estimating this value accurately opens the possibility of understanding and predicting the energy consumption of a biological basin and its weight in the overall energy consumption.
Tag F2_Debit_T signifies the water volume at the WWTP entrance, where its correct prediction allows for an accurate estimate of the overall energy consumption, the overall substances consumption, and the bypass system usage. The water volume at the WWTP entrance is directly influenced to a large extent by meteorological characteristics (especially precipitation amount).
The differences between the considered test cases resulted from the various weather characteristics encountered during each considered period, such that the authors could identify different possible optimization paths to follow in the future third-level implementation of the reference architecture.
To conclude the results analysis, the seven test cases involved successfully capitalized on real data recorded from the WWTP, with promising results. Unfortunately, the exact overall accuracy of the predictive algorithm is very difficult to assess because it is directly influenced by the weather forecast accuracy. For example, a difference of 1 °C between the forecasted temperature and the actual temperature at a 5° value (average temperature during the period when the test cases were considered) leads to a 20% error that is introduced by the weather forecast accuracy, not by the implemented algorithm. In addition, analyzing historical data gathered in a period of time in which certain meteorological phenomena did not occur (for example, it did not rain) could lead to the situation in which the relations identifying algorithm does not find any dependency between some of the meteorological characteristics and technical system tags (even if they could exist). This implies that the algorithm’s overall accuracy could be better evaluated after considering some long-term test cases (covering multiple months or even years).
Due partly to the exponential growth of the dependencies graph dimensions when a larger number of variables are involved that makes it infeasible to track by human operators and partly to the paper space constraints, a test case involving a larger number of variables (over 100) cannot be presented in this section, by illustrating each step of the analysis, because the section presents examples from different test cases that are suitable for highlighting the necessary aspects. Nevertheless, taking into account all the tests performed by the authors, the latest Historian application version can be considered validated as a solution capable of computing the impact of the weather characteristics over a technical system from the industry, thus meeting the goals set for the current paper.

5. Conclusions

The state of the art in industrial automation research is focused toward the IIoT principles, guiding the industry into a more intelligent era, characterized in the incipient phase that is taking place currently by intelligent communication, improved interoperability, and connectivity. The transition toward this new era has already begun in recent years and is currently in full swing, where the huge potential is enabled by the new technologies being recognized by the industry as well. After this initial transition, the framework and infrastructure will be in place in order to develop the next significant level of improvements, in the form of intelligent, autonomous, proactive software applications, possessing the capabilities of analyzing technical systems and optimizing them for maximized performance. In the industry, a fog-based process-aware proactive Historian concept satisfies these requirements. The current research is hesitant in offering such solutions.
Addressing the challenge of developing the future generation of proactive Historian applications has been started by the authors with encouraging results. The current paper sustains this effort and brings the solution a step closer to the final goal. The presented contributions are bringing both improvements to the first level of the reference architecture, as well as contributions to the second level of the reference architecture in the form of predicting process values regarding integrated weather data as context data. The research is applied in the water industry, particularly for wastewater treatment plants. The testing is realized using wastewater-specific test cases, and the obtained results are promising. Although the water industry represents the main target of the current development, the software solution follows a generic mindset, which does not limit it to any specific industry.
To conclude, the current paper falls in line with a series of research papers in what is already starting to outline itself as a well-defined research direction, contributing to the efforts of achieving the fully functional, tested, validated, proactive Historian solution that will prove its value in tomorrow’s industry.

Author Contributions

Conceptualization, A.K.; methodology, A.K. and I.S.; software, A.N.; validation, A.N.; formal analysis, A.N.; investigation, A.K. and A.N.; writing—original draft preparation, A.N.; writing—review and editing, A.K.; supervision, I.S.; funding acquisition, A.K. and I.S. All authors have read and agreed to the published version of the manuscript.

Funding

This research received no external funding.

Conflicts of Interest

The authors declare no conflict of interest.

References

  1. Yury, S.; Samoylova, E. The internet of things as socio-technological institution of civil society in post-informational era. In Proceedings of the 2nd International Conference on Computer and Communication Systems (ICCCS), Krakow, Poland, 11–14 July 2017. [Google Scholar]
  2. Sisinni, E.; Saifullah, A.; Han, S.; Jennehag, U.; Gidlund, M. Industrial Internet of Things: Challenges, Opportunities, and Directions. IEEE Trans. Ind. Inf. 2018, 99, 4724–4734. [Google Scholar] [CrossRef]
  3. Perera, C.; Liu, C.H.; Jayawardena, S.; Chen, M. A Survey on Internet of Things From Industrial Market Perspective. IEEE Access 2014, 2, 1660–1679. [Google Scholar] [CrossRef]
  4. Nicolae, A.; Korodi, A.; Silea, I. An Overview of Industry 4.0 Development Directions in the Industrial Internet of Things Context. Rom. J. Inf. Sci. Tech. 2019, 22, 183–201. [Google Scholar]
  5. Strasser, T.I.; Andrén, F.P.; Vrba, P.; Šuhada, R.; Moulis, V.; Farid, A.M.; Rohjans, S. An Overview of Trends and Developments of Internet of Things Applied to Industrial Systems. In Proceedings of the 44th Annual Conference of the IEEE Industrial Electronics Society (IECON), Washington, DC, USA, 21–23 October 2018. [Google Scholar]
  6. Xu, H.; Yu, W.; Griffith, D.; Golmie, N. A Survey on Industrial Internet of Things: A Cyber-Physical Systems Perspective. IEEE Access 2018, 6, 78238–78259. [Google Scholar] [CrossRef]
  7. Vandikas, K.; Tsiatsis, V. Performance evaluation of an IoT platform. In Proceedings of the IEEE Eighth International Conference on Next Generation Mobile Apps, Services and Technologies (NGMAST), Oxford, UK, 10–12 September 2014. [Google Scholar]
  8. Khan, W.A.; Wisniewski, L.; Lang, D.; Jasperneite, J. Analysis of the requirements for offering industrie 4.0 applications as a cloud service. In Proceedings of the 26th IEEE International Symposium on Industrial Electronics (ISIE), Edinburgh, UK, 19–21 June 2017. [Google Scholar]
  9. Eliasson, J.; Delsing, J.; Derhamy, H.; Salcic, Z.; Wang, K. Towards industrial Internet of Things: An efficient and interoperable communication framework. In Proceedings of the IEEE International Conference on Industrial Technology (ICIT), Seville, Spain, 17–19 March 2015. [Google Scholar]
  10. Aazam, M.; Zeadally, S.; Harras, K.A. Deploying Fog Computing in Industrial Internet of Things and Industry 4.0. IEEE Trans. Ind. Inf. 2018, 14, 4674–5682. [Google Scholar] [CrossRef]
  11. Gazis, V.; Leonardi, A.; Mathioudakis, K.; Sasloglou, K.; Kikiras, P.; Sudhaakar, R. Components of fog computing in an industrial internet of things context. In Proceedings of the 12th Annual IEEE International Conference on Sensing, Communication, and Networking - Workshops (SECON Workshops), Seattle, WA, USA, 22–25 June 2015. [Google Scholar]
  12. Al-Gumaei, K.; Schuba, K.; Friesen, A.; Heymann, S.; Pieper, C.; Pethig, F.; Schriegel, S. A Survey of Internet of Things and Big Data Integrated Solutions for Industrie 4.0. In Proceedings of the 23rd International Conference on Emerging Technologies and Factory Automation (ETFA), Turin, Italy, 4–7 September 2018. [Google Scholar]
  13. Geng, D.; Zhang, C.; Xia, C.; Xia, X.; Liu, Q.; Fu, X. Big Data-Based Improved Data Acquisition and Storage System for Designing Industrial Data Platform. IEEE Access 2019, 7, 44574–44582. [Google Scholar] [CrossRef]
  14. Eren, H. Assessing the health of sensors using data historians. In Proceedings of the IEEE Sensors Applications Symposium (SAS), Brescia, Italy, 7–9 February 2012. [Google Scholar]
  15. Mazur, D.C.; Entzminger, R.A.; Kay, J.A. Enhancing Traditional Process SCADA and Historians for Industrial and Commercial Power Systems With Energy (Via IEC 61850). In Proceedings of the IEEE/IAS 50th Industrial & Commercial Power Systems Technical Conference (I&CPS), Fort Worth, TX, USA, 20–23 May 2014. [Google Scholar]
  16. Fras, A.; Dang, T. Improving industrial application’s performances with an Historian. In Proceedings of the IEEE International Conference on Industrial Technology (ICIT), Hammamet, Tunisia, 8–10 December 2004. [Google Scholar]
  17. Jankowski, T.; Davis, G.; Holmes, J.; Kemper, G. Increasing data historian efficiency. In Proceedings of the IEEE-IAS/PCA 53rd Cement Industry Technical Conference, St. Louis, MO, USA, 22–26 May 2011. [Google Scholar]
  18. Kefalakis, N.; Roukounaki, A.; Soldatos, J. A Configurable Distributed Data Analytics Infrastructure for the Industrial Internet of things. In Proceedings of the 15th International Conference on Distributed Computing in Sensor Systems (DCOSS), Santorini Island, Greece, 29–31 May 2019. [Google Scholar]
  19. Mateev, V.; Marinova, I. Distributed Internet of Things System for Wireless Monitoring of Electrical Grids. In Proceedings of the 20th International Symposium on Electrical Apparatus and Technologies (SIELA), Bourgas, Bulgaria, 3–6 June 2018. [Google Scholar]
  20. Prakash, C.; Thakur, S. Smart Shut-Down and Recovery Mechanism for Industrial Machines Using Internet of Things. In Proceedings of the 8th International Conference on Cloud Computing, Data Science & Engineering (Confluence), Noida, India, 11–12 January 2018. [Google Scholar]
  21. Kulkarni, P.H.; Kute, P.D.; More, V.N. IoT based data processing for automated industrial meter reader using Raspberry Pi. In Proceedings of the 2016 International Conference on Internet of Things and Applications (IOTA), Pune, India, 22–24 January 2016. [Google Scholar]
  22. Nicolae, A.; Korodi, A. Node-Red and OPC UA Based Lightweight and Low-Cost Historian with Application in the Water Industry. In Proceedings of the IEEE 16th International Conference on Industrial Informatics (INDIN), Porto, Portugal, 18–20 July 2018; pp. 1012–1017. [Google Scholar]
  23. Salvador, J.R.; de la Peña, D.M.; Ramirez, D.R.; Alamo, T. Historian Data Based Predictive Control of a Water Distribution Network. In Proceedings of the European Control Conference (ECC), Limassol, Cyprus, 12–15 June 2018. [Google Scholar]
  24. Weyrich, M.; Ebert, C. Reference Architectures for the Internet of Things. IEEE Softw. 2016, 33, 112–116. [Google Scholar] [CrossRef]
  25. Bloom, G.; Alsulami, B.; Nwafor, E.; Bertolotti, I.C. Design patterns for the industrial Internet of Things. In Proceedings of the 14th IEEE International Workshop on Factory Communication Systems (WFCS), Imperia, Italy, 13–15 June 2018. [Google Scholar]
  26. Nicolae, A.; Korodi, A.; Silea, I. Identifying Data Dependencies as First Step to Obtain a Proactive Historian: Test Scenario in the Water Industry 4.0. Water 2019, 11, 1144. [Google Scholar] [CrossRef] [Green Version]
  27. Korodi, A.; Crisan, R.; Nicolae, A.; Silea, I. Industrial Internet of Things and Fog Computing to Reduce Energy Consumption in Drinking Water Facilities. Processes 2020, 8, 282. [Google Scholar] [CrossRef] [Green Version]
  28. Dark Sky API Weather Service. Available online: https://darksky.net/dev (accessed on 12 April 2020).
  29. OpenStreetMap Nominatim Service for Converting an Address to Longitude and Latitude. Available online: https://nominatim.openstreetmap.org/ (accessed on 12 April 2020).
Figure 1. Typical wastewater treatment plant (WWTP) processes.
Applsci 10 03015 g001
Figure 2. The new graphical user interface (GUI) elements of the Historian application.
Applsci 10 03015 g002
Figure 3. Summarized overview of the implemented prediction algorithm.
Applsci 10 03015 g003
Figure 4. Editing an item in the Historian Process Editor.
Applsci 10 03015 g004
Figure 5. A process of a WWTP, as defined in the Historian Process Editor.
Applsci 10 03015 g005
Figure 6. WWTP process constraints in the Historian Process Editor.
Applsci 10 03015 g006
Figure 7. The 7 test cases considered for validation of the implementation.
Applsci 10 03015 g007
Figure 8. The dependencies graph for test case 7.
Applsci 10 03015 g008
Figure 9. Prediction algorithm output for test case 5.
Applsci 10 03015 g009
Figure 10. The most significant results of the test cases.
Applsci 10 03015 g010

