Surface Plasmon Resonance Sensor Based on Polypyrrole–Chitosan–BaFe2O4 Nanocomposite Layer to Detect the Sugar


 , ,
, ,  , and
, and
Abstract
1. Introduction
2. Materials and Methods
2.1. Materials
2.2. Preparation of Polypyrrole–Chitosan–BaFe2O4
2.2.1. Synthesis of BaFe2O4
2.2.2. Synthesis of PPy–Chi–BaFe2O4 Composite Layer
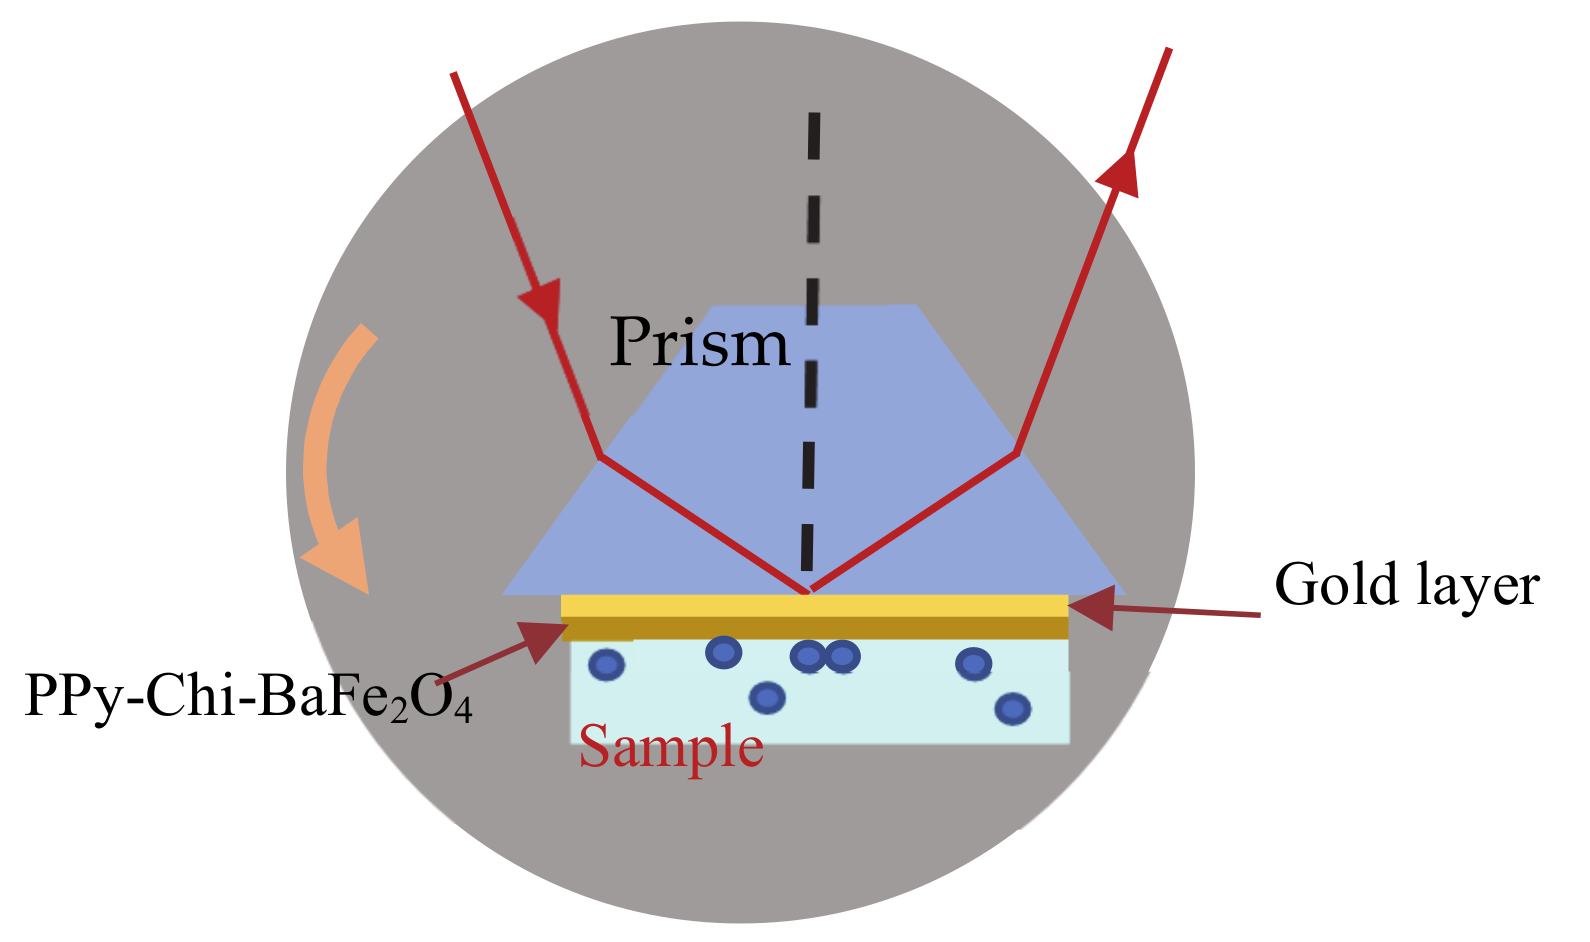
2.3. Surface Plasmon Resonance Setup
2.4. Preparation of Sugar Solution
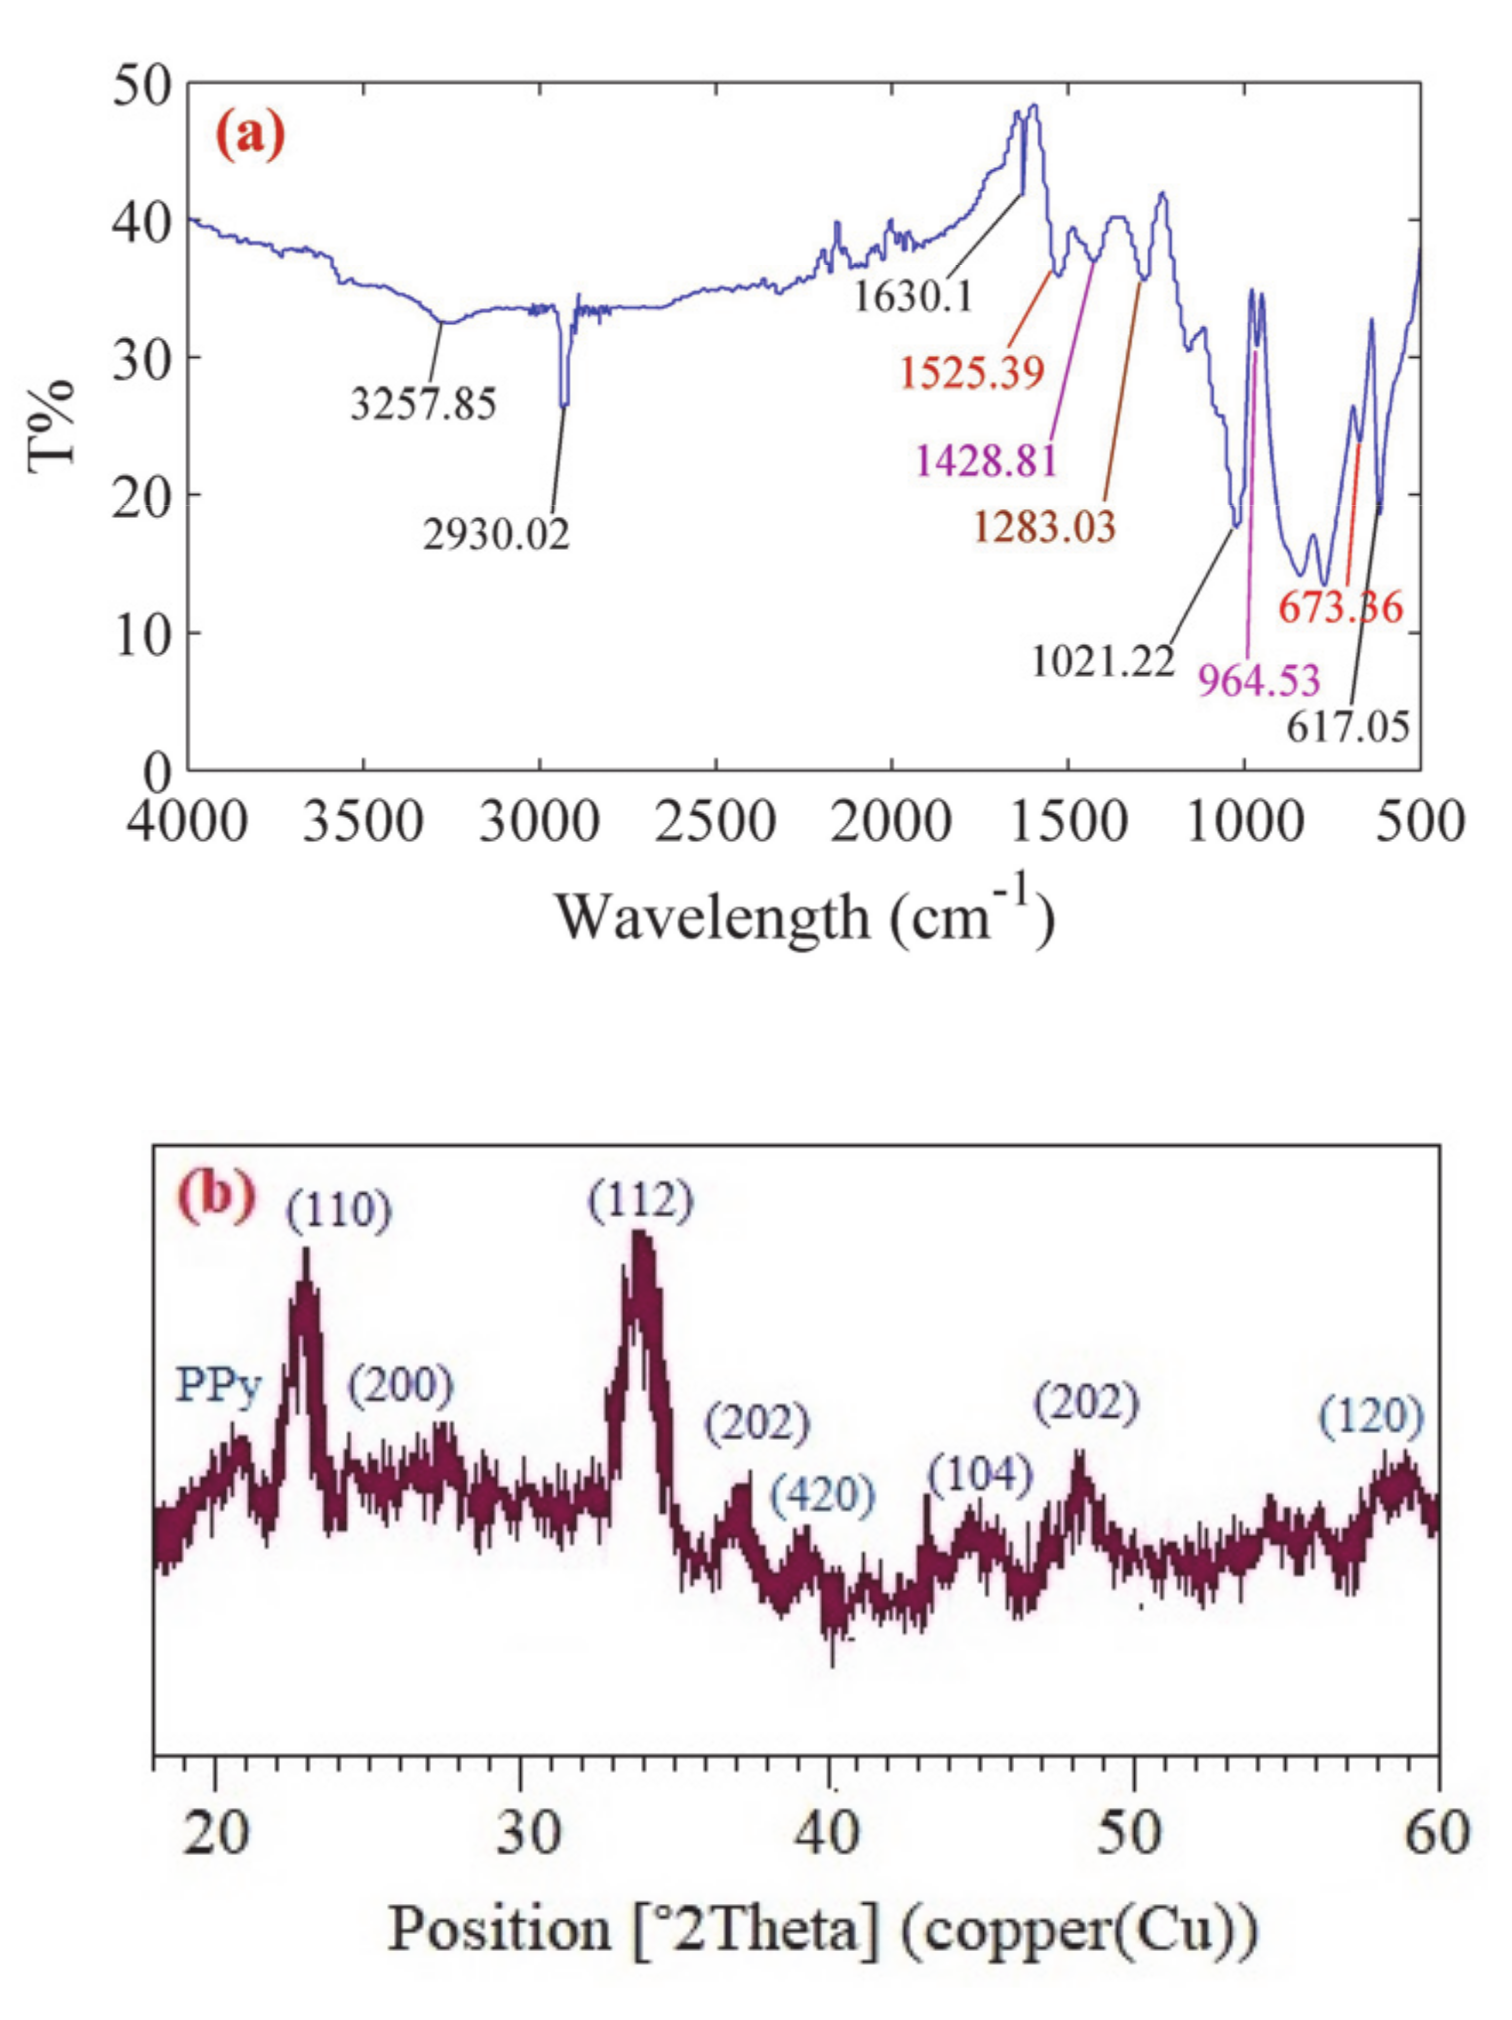
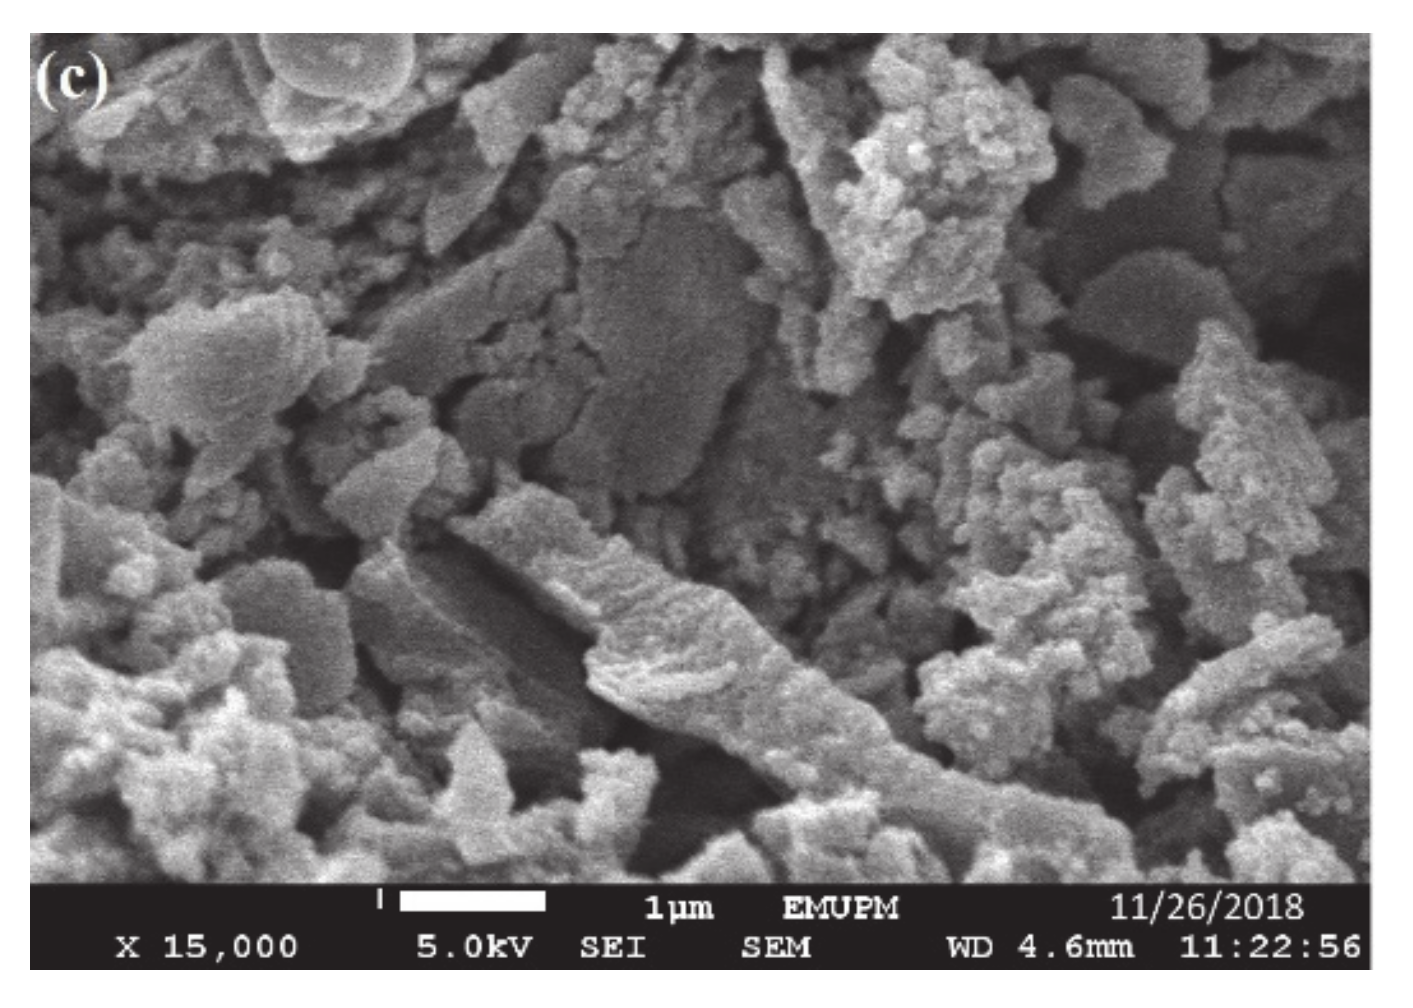
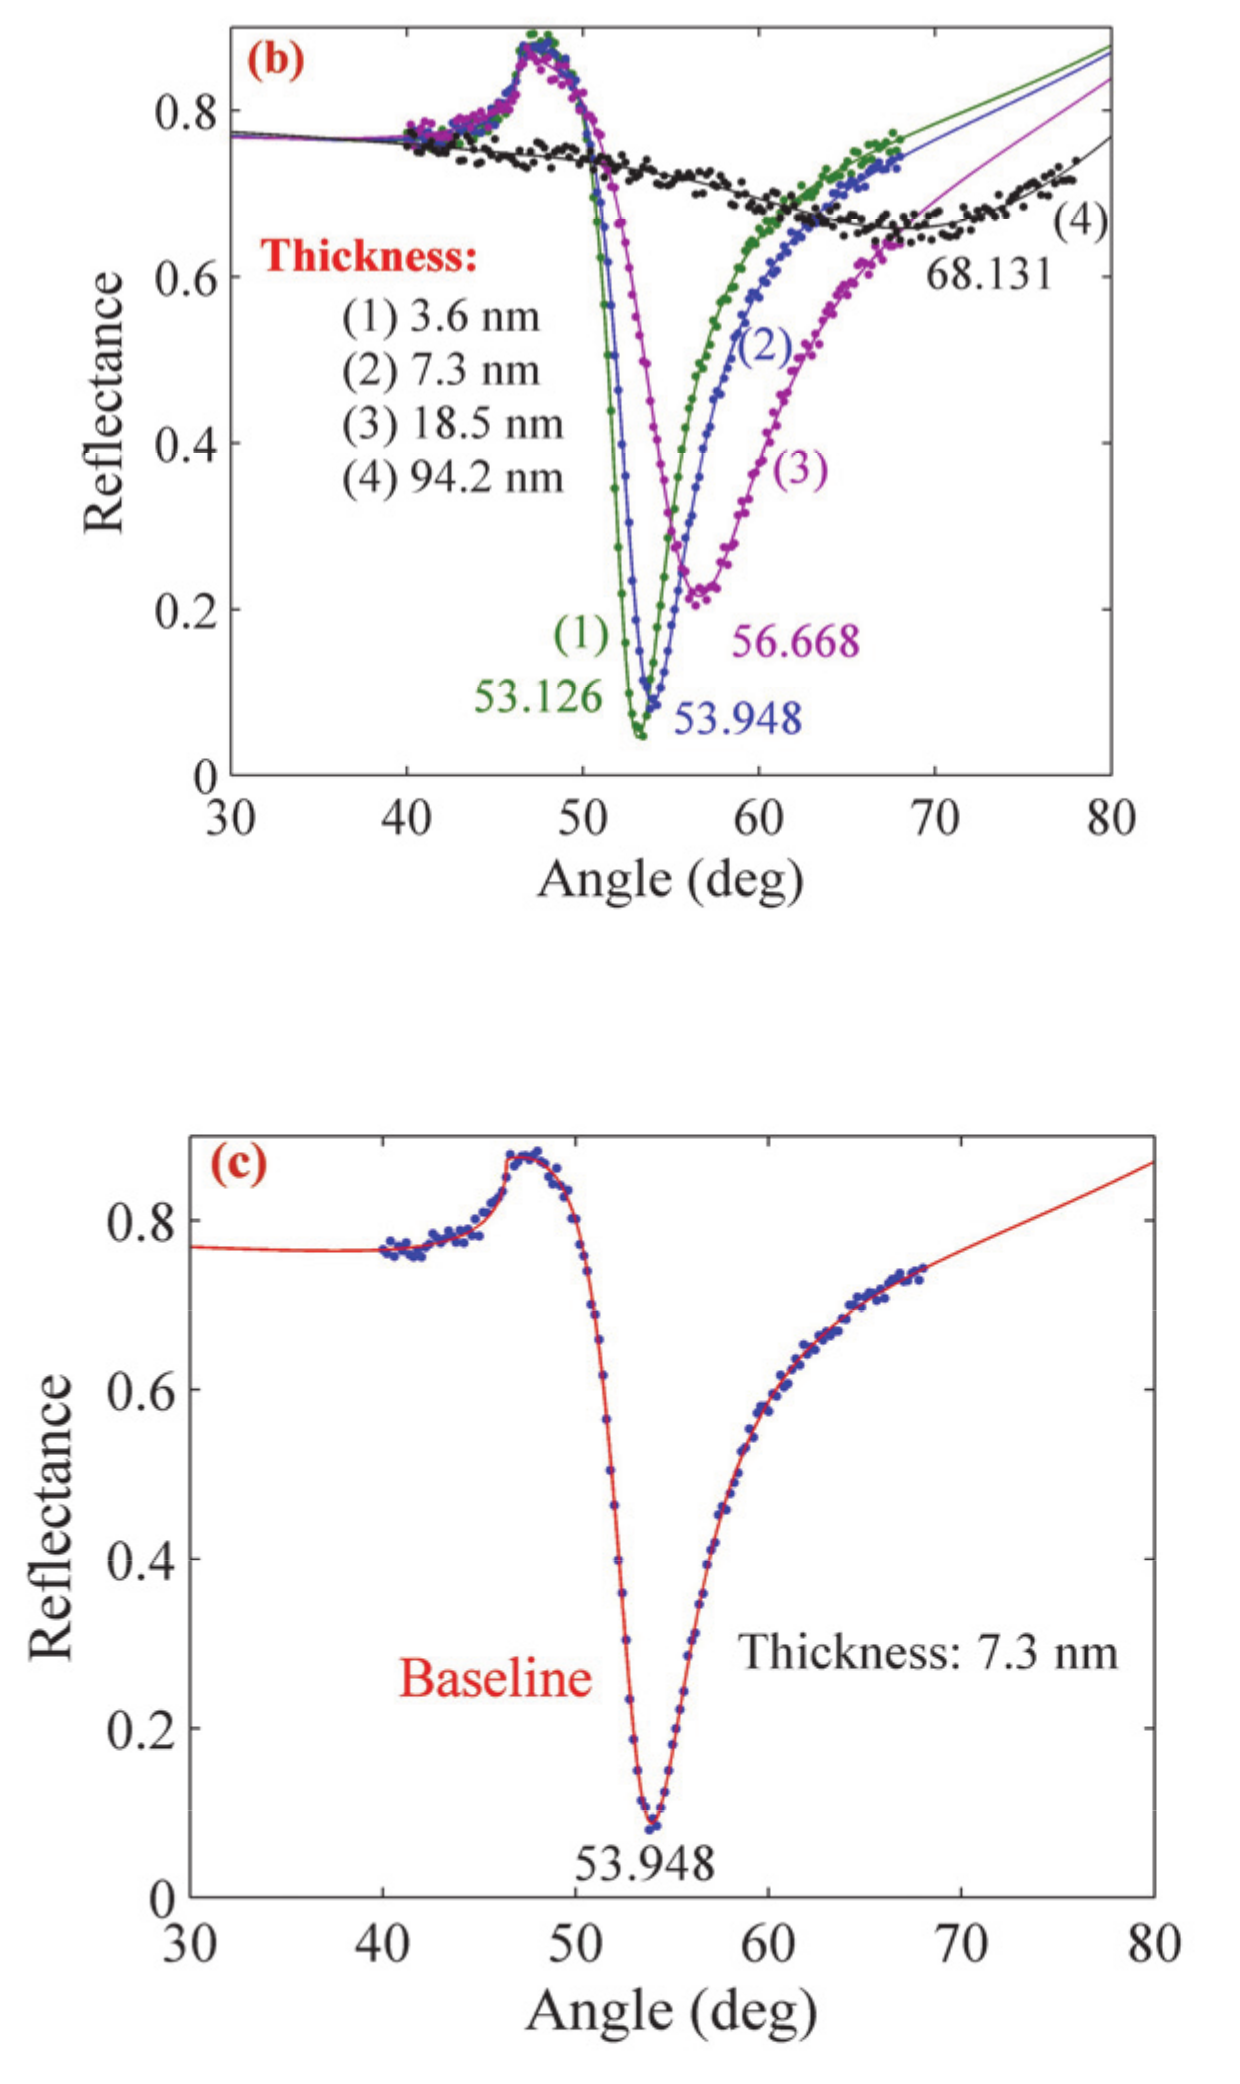
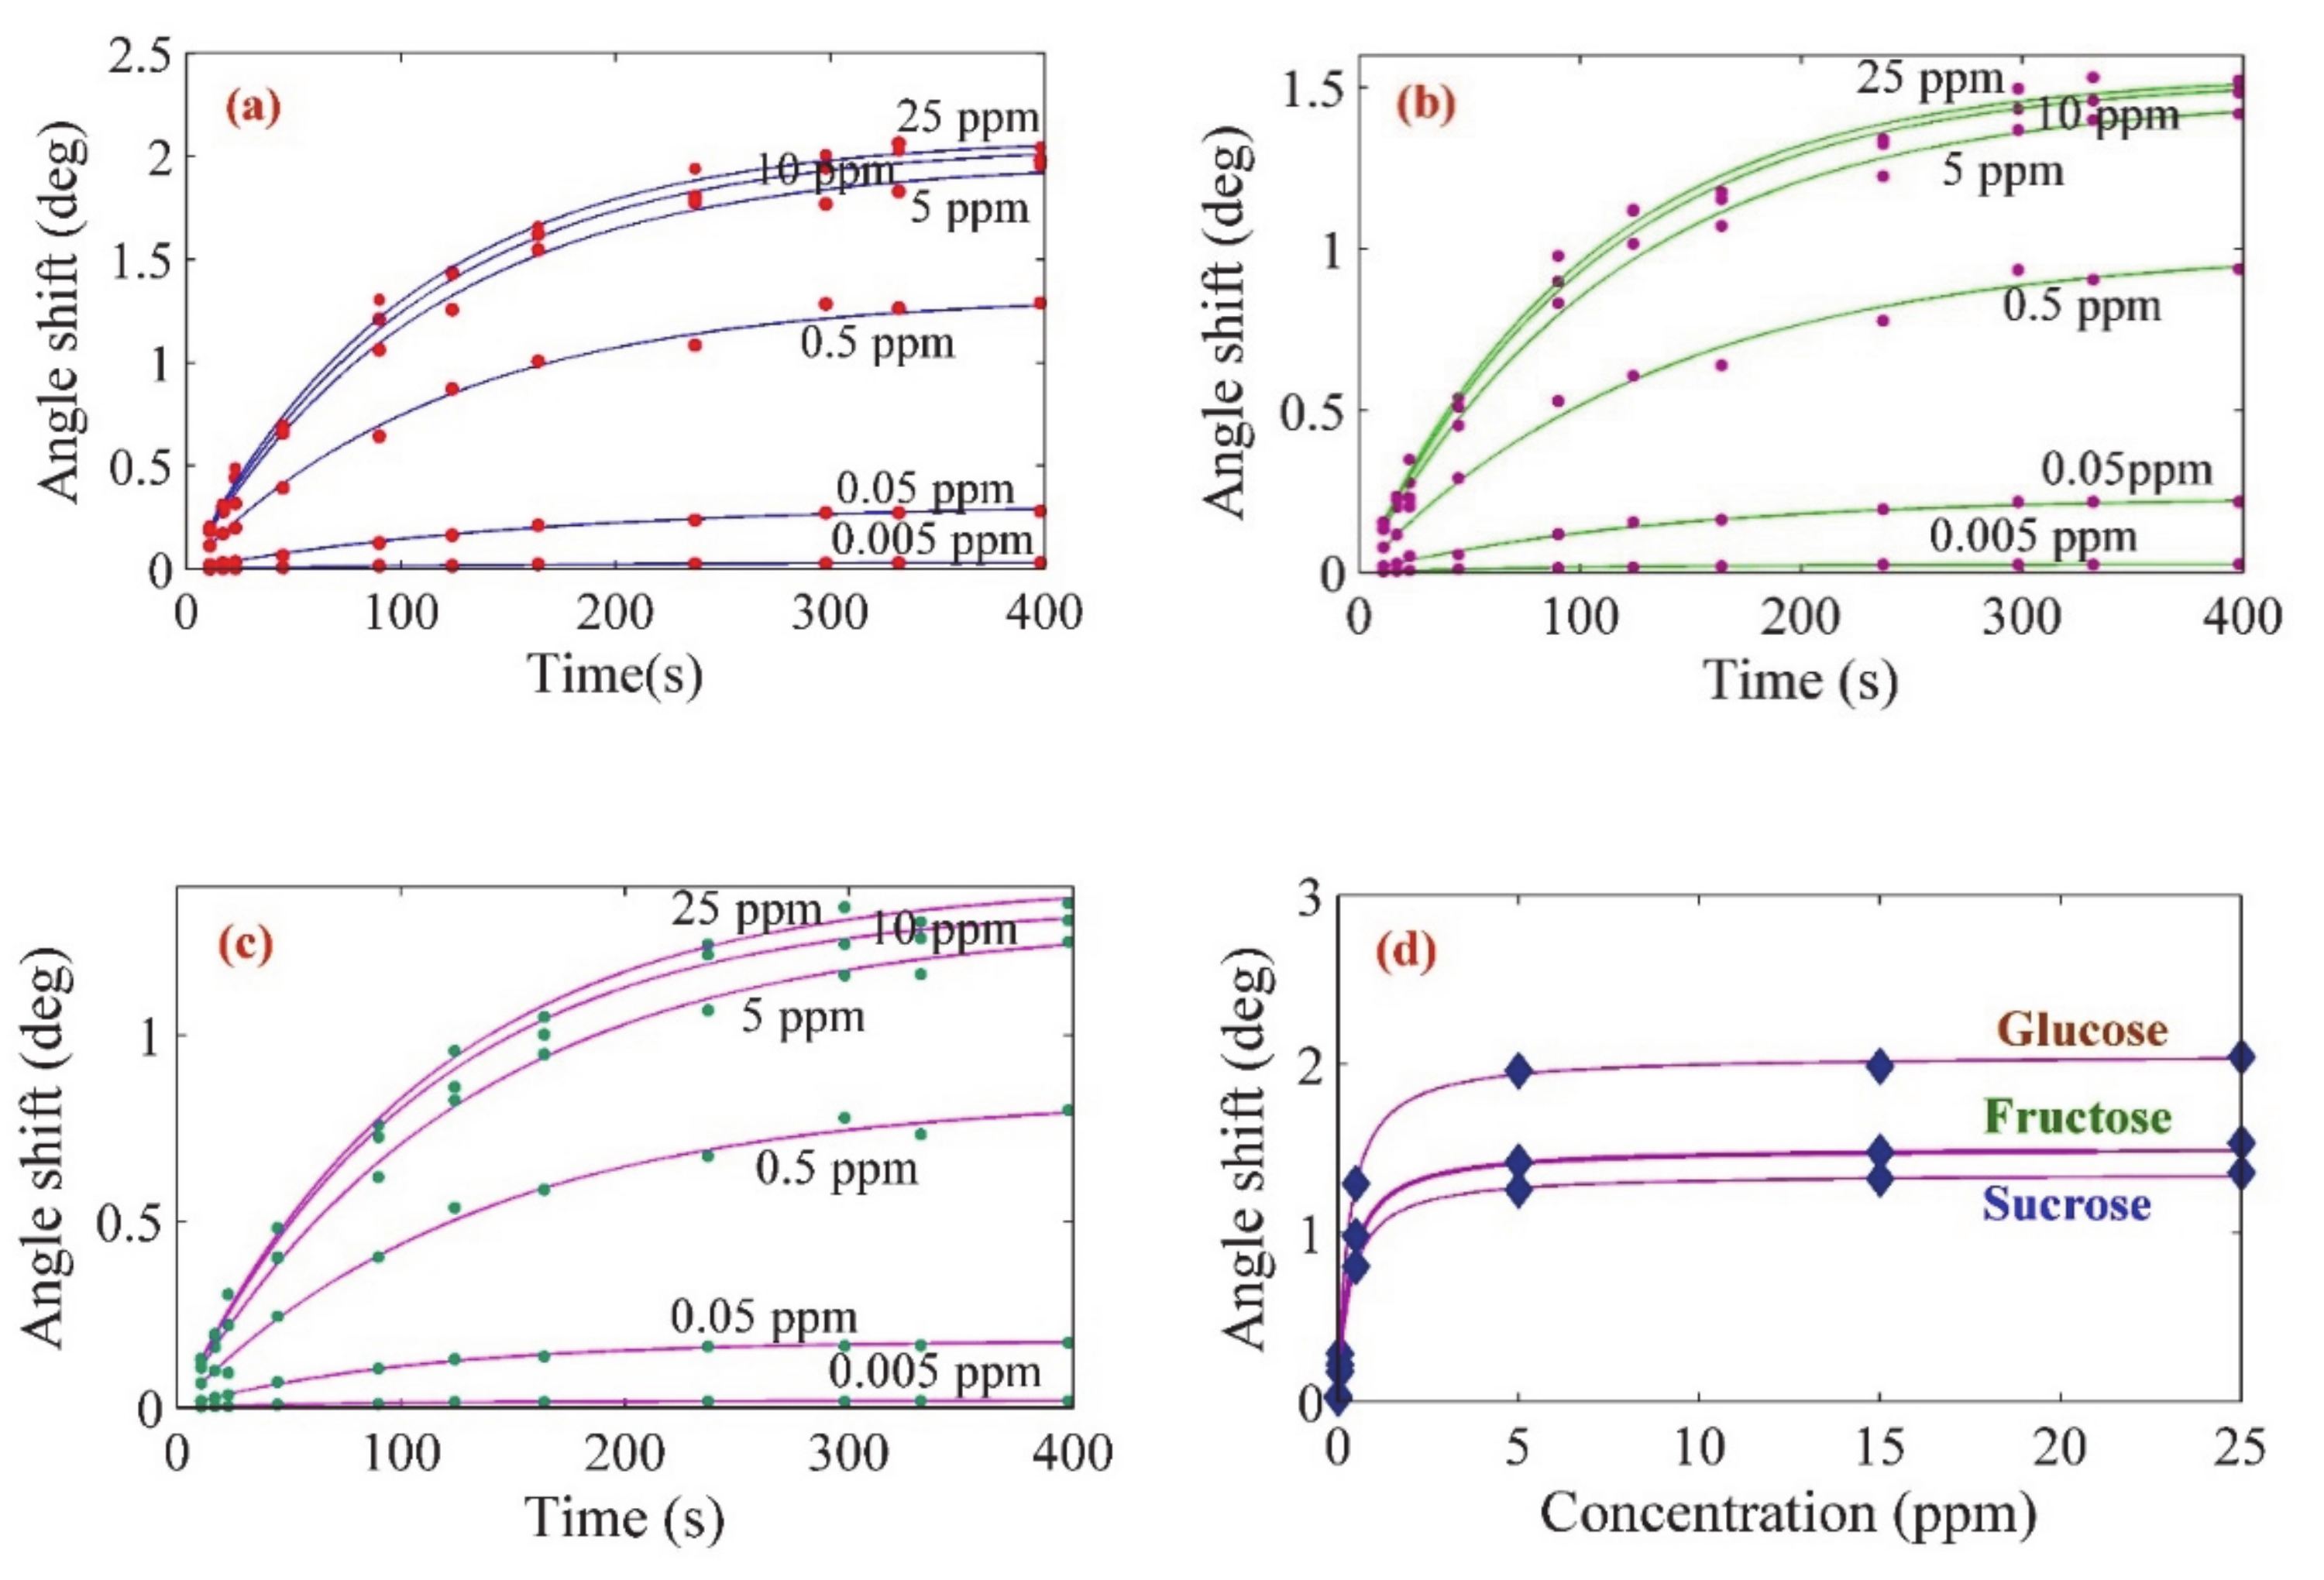
3. Results and Discussion
4. Conclusions
Author Contributions
Funding
Acknowledgments
Conflicts of Interest
References
- Taguchi, M.; Ptitsyn, A.; McLamore, E.S.; Claussen, J.C. 2014 Nanomaterial-mediated Biosensors for Monitoring Glucose. J. Diabetes Sci. Technol. 2014, 8, 403–411. [Google Scholar] [CrossRef] [PubMed]
- Su, L.; Feng, J.; Zhou, X.; Ren, C.; Li, H.; Chen, X. Colorimetric Detection of Urine Glucose Based ZnFe2O4 Magnetic Nanoparticles. Anal. Chem. 2012, 84, 5753–5758. [Google Scholar] [CrossRef] [PubMed]
- Yadava, J.; Rani, A.; Singh, V.; Murari, B.M. Prospects and limitations of non-invasive blood glucose monitoring using near-infrared spectroscopy. Biomed. Signal Process. Control. 2015, 18, 214–227. [Google Scholar] [CrossRef]
- Pandey, R.; Paidi, S.K.; Valdez, T.A.; Zhang, C.; Spegazzini, N.; Dasari, R.R.; Barman, I. Noninvasive Monitoring of Blood Glucose with Raman Spectroscopy. Acc. Chem. Res. 2017, 50, 264–272. [Google Scholar] [CrossRef]
- Nor, N.M.; Razak, K.A.; Lockman, Z. Physical and Electrochemical Properties of Iron Oxide Nanoparticles-modified Electrode for Amperometric Glucose Detection. Electrochim. Acta 2017, 248, 160–168. [Google Scholar]
- Wahjudi, P.N.; Patterson, M.E.; Lim, S.; Yee, J.K.; Mao, C.S.; Paul, L. Measurement of Glucose and Fructose in Clinical Samples Using Gas Chromatography/Mass Spectrometry. Clin. Biochem. 2010, 43, 198–207. [Google Scholar] [CrossRef]
- Damborský, P.; Švitel, J.; Katrlík, J. Optical biosensors. Essays Biochem. 2016, 60, 91–100. [Google Scholar]
- Yeh, Y.-L. Real-time measurement of glucose concentration and average refractive index using a laser interferometer. Opt. Laser. Eng. 2008, 46, 666–670. [Google Scholar] [CrossRef]
- Yu-Lung, L.; Tsung-Chih, Y.A. Polarimetric glucose sensor using a liquid crystal polarization modulator driven by a sinusoidal signal. Opt. Commun. 2006, 259, 40–48. [Google Scholar]
- Chien, C.; Wen-Chuan, K.; Tung-Sheng, H.; Hui-Kang, T.A. Phase sensitive optical rotation measurement in a scattered chiral medium using a Zeeman laser. Opt. Commun. 2004, 203, 259–266. [Google Scholar]
- Torii, T.; Chiba, H.; Tanabe, T.; Oyama, Y. Measurements of glucose concentration in aqueous solutions using reflected THz radiation for applications to a novel sub-THz radiation non-invasive blood sugar measurement method. Digit. Health 2017, 3, 1–5. [Google Scholar] [CrossRef] [PubMed]
- Sadrolhosseini, A.R.; Rashid, S.A.; Jamaludin, N.; Noor, A.S.M.; Isloor, A.M. Surface plasmon resonance sensor using polypyrrole-chitosan/graphene quantum dots layer for detection of sugar. Mater. Res. Express 2019, 6, 075028. [Google Scholar] [CrossRef]
- Kun Huang, C.; Cheng Chih, H.; Chin, C.D. 2003 Interferometric optical sensor for measuring glucose concentration. Appl. Opt. 2003, 42, 5774–5776. [Google Scholar]
- Kolomenskii, A.A.; Gershon, P.D.; Schuessler, H.A. Sensitivity and detection limit of concentration and adsorption measurements by laser-induced surface plasmon resonance. Appl. Opt. 1997, 36, 6539–6547. [Google Scholar] [CrossRef]
- Toghill, K.E.; Compton, R.G. Electrochemical non-enzymatic glucose sensors: A perspective and an evaluation. Int. J. Electrochem. Sci. 2010, 5, 1246–1301. [Google Scholar]
- Amir AL-Mokaram, A.M.A.; Yahya, R.; Abdi, M.; Ekramul Mahmud, H.N.M. One-step electrochemical deposition of Polypyrrole–Chitosan–Iron oxide nanocomposite films for non-enzymatic glucose biosensor. Mater. Lett. 2016, 183, 90–93. [Google Scholar] [CrossRef]
- Karyakin, A.A.; Vuki, M.; Lukachova, L.V.; Karyakina, E.E.; Orlov, A.V.; Karpachova, G.P.; Wang, J. Processible polyaniline as an advanced potentiometric pH transducer. Appl. Biosens. Anal. Chem. 1999, 71, 2534–2540. [Google Scholar] [CrossRef]
- Ramanavicius, A.; Kausaite, A.; Ramanaviciene, A.; Acaite, J.; Malinauskas, A. 2006 Redox enzyme–glucose oxidase–initiated synthesis of polypyrrole. Synth. Met. 2006, 156, 409–413. [Google Scholar] [CrossRef]
- Portaccio, M.; Lepore, M.; Della Ventura, B.; Stoilova, O.; Manolova, N.; Rashkov, I.; Mita, D.G. Fiber-optic glucose biosensor based on glucose oxidase immobilised in a silica gel matrix. J. Sol-Gel Sci. Technol. 2009, 50, 437–448. [Google Scholar] [CrossRef]
- Salimi, A.; Compton, R.G.; Hallaj, R. Glucose biosensor prepared by glucose oxidase encapsulated sol-gel and carbonnanotube-modified basal plane pyrolytic graphite electrode. Anal. Biochem. 2004, 333, 49–56. [Google Scholar] [CrossRef]
- Wei, H.; Wang, E. Fe3O4 Magnetic Nanoparticles as Peroxidase Mimetics and Their Applications in H2O2 and Glucose Detection. Anal. Chem. 2008, 80, 2250–2254. [Google Scholar] [CrossRef] [PubMed]
- Naseri, M.; Naderi, E.; Sadrolhosseini, A.R. Effect of Phase Transformation on Physical and Biological Properties of PVA/CaFe2O4 Nanocomposite. Fiber Polym. 2016, 17, 1667–1674. [Google Scholar] [CrossRef]
- Candeia, R.A.; Souza, M.A.F.; Bernardi, M.I.B.; Maestrelli, S.C.; Santos, I.M.G.; Souza, A.G.; Longo, E. Monoferrite BaFe2O4 applied as ceramic pigment. Ceram. Int. 2007, 33, 521–525. [Google Scholar] [CrossRef]
- Sadrolhosseini, A.R.; Naseri, M.; Rashid, S.A. Polypyrrole-chitosan/nickel-ferrite nanoparticle composite layer for detecting heavy metal ions using surface plasmon resonance technique. Opt. Laser Technol. 2017, 93, 216–223. [Google Scholar] [CrossRef]
- Sadrolhosseini, A.R.; Naseri, M.; Kamari, H.M. Surface plasmon resonance sensor for detecting of arsenic in aqueous solution using polypyrrole-chitosan-cobalt ferrite nanoparticles composite layer. Opt. Commun. 2017, 383, 132–137. [Google Scholar] [CrossRef]
- Sadrolhosseini, A.R.; Noor, A.S.M.; Maarof, M.M. Application of Surface Plasmon Resonance Based on Metal Nanoparticle. In Plasmonics—Principles and Applications; Kim, K.Y., Ed.; IntecOpen: London, UK, 2012; Volume 10, pp. 253–282. [Google Scholar]
- Jang, J.; Oh, J.H. Fabrication of a Highly Transparent Conductive Thin Film from Polypyrrole/Poly(methyl methacrylate) Core/Shell Nanospheres. Adv. Funct. Mater. 2005, 15, 494–502. [Google Scholar] [CrossRef]
- Moozarm Nia, P.; Lorestani, F.; Meng, W.P.; Alias, Y. A novel non-enzymatic H2O2 sensor based on polypyrrole nanofibers–silver nanoparticles decorated reduced graphene oxide nano composites. Appl. Surf. Sci. 2015, 332, 648–656. [Google Scholar] [CrossRef]
- Ruhi, G.; Modi, O.P.; Dhawan, S.K. Chitosan-polypyrrole-SiO2 composite coatings with advanced anticorrosive properties. Synth. Met. 2015, 200, 24–39. [Google Scholar] [CrossRef]
- Mandizadeh, S.; Salavati-Niasari, M.; Sadri, M. Hydrothermal synthesis, characterization and magnetic properties of BaFe2O4 nanostructure as a photocatalytic oxidative desulfurization of dibenzothiophene. Sep. Purif. Technol. 2017, 175, 399–405. [Google Scholar] [CrossRef]
- Utami, R.S.; Puspasari, I.; Shyuan, L.K.; Mohamed, A.B.; Alva, S. Effect of Process Parameters on the Synthesis of Polypyrrole by the Taguchi Method. MJAS 2016, 20, 660–669. [Google Scholar] [CrossRef]
- Moozarm Nia, P.; Meng, W.P.; Alias, Y. One-Step Electrodeposition of Polypyrrole-Copper Nano Particles for H2O2 Detection. J. Electrochem. Soci. 2016, 163, B8–B14. [Google Scholar]
- Sharma, K.K. Optics: Principles and Applications; Academic Press: CA, USA, 2006; pp. 120–180. [Google Scholar]
- Homola, J. Surface Plasmon Resonance Based Sensors; Springer: Berlin/Heidelberg, Germany, 2006; pp. 80–110. [Google Scholar]
- Beketov, G.V.; Shirshov, Y.M.; Shynkarenko, O.V.; Chegel, V.I. Surface plasmon resonance spectroscopy: Prospects of superstrate refractive index variation for separate extraction of molecular layer parameters. Sens. Actuators B 1998, 48, 432–438. [Google Scholar] [CrossRef]
- Shishehbore, M.R.; Afkhami, A.; Bagheri, H. Salicylic acid functionalized silica coated magnetite nanoparticles for solid phase extraction and preconcentration of some heavy metal ions from various real samples. Chem. Cent. J. 2011, 5, 1–10. [Google Scholar] [CrossRef] [PubMed]
- Sun, M.; Li, P.; Jin, X.; Ju, X.; Yan, W.; Yuan, J.; Xing, C. Heavy metal adsorption onto graphene oxide, amino group on magnetic nanoadsorbents and application for detection of Pb(II) by strip sensor. Food Agric. Immunol. 2018, 29, 1053–1073. [Google Scholar] [CrossRef]
- Zhang, W.; Li, X.; Zou, R.; Wu, H.; Shi, H.; Yu, S.; Liu, Y. Multifunctional glucose biosensors from Fe3O4 nanoparticles modified chitosan/graphene nanocomposites. Sci. Rep. 2015, 5, 11129. [Google Scholar] [CrossRef]


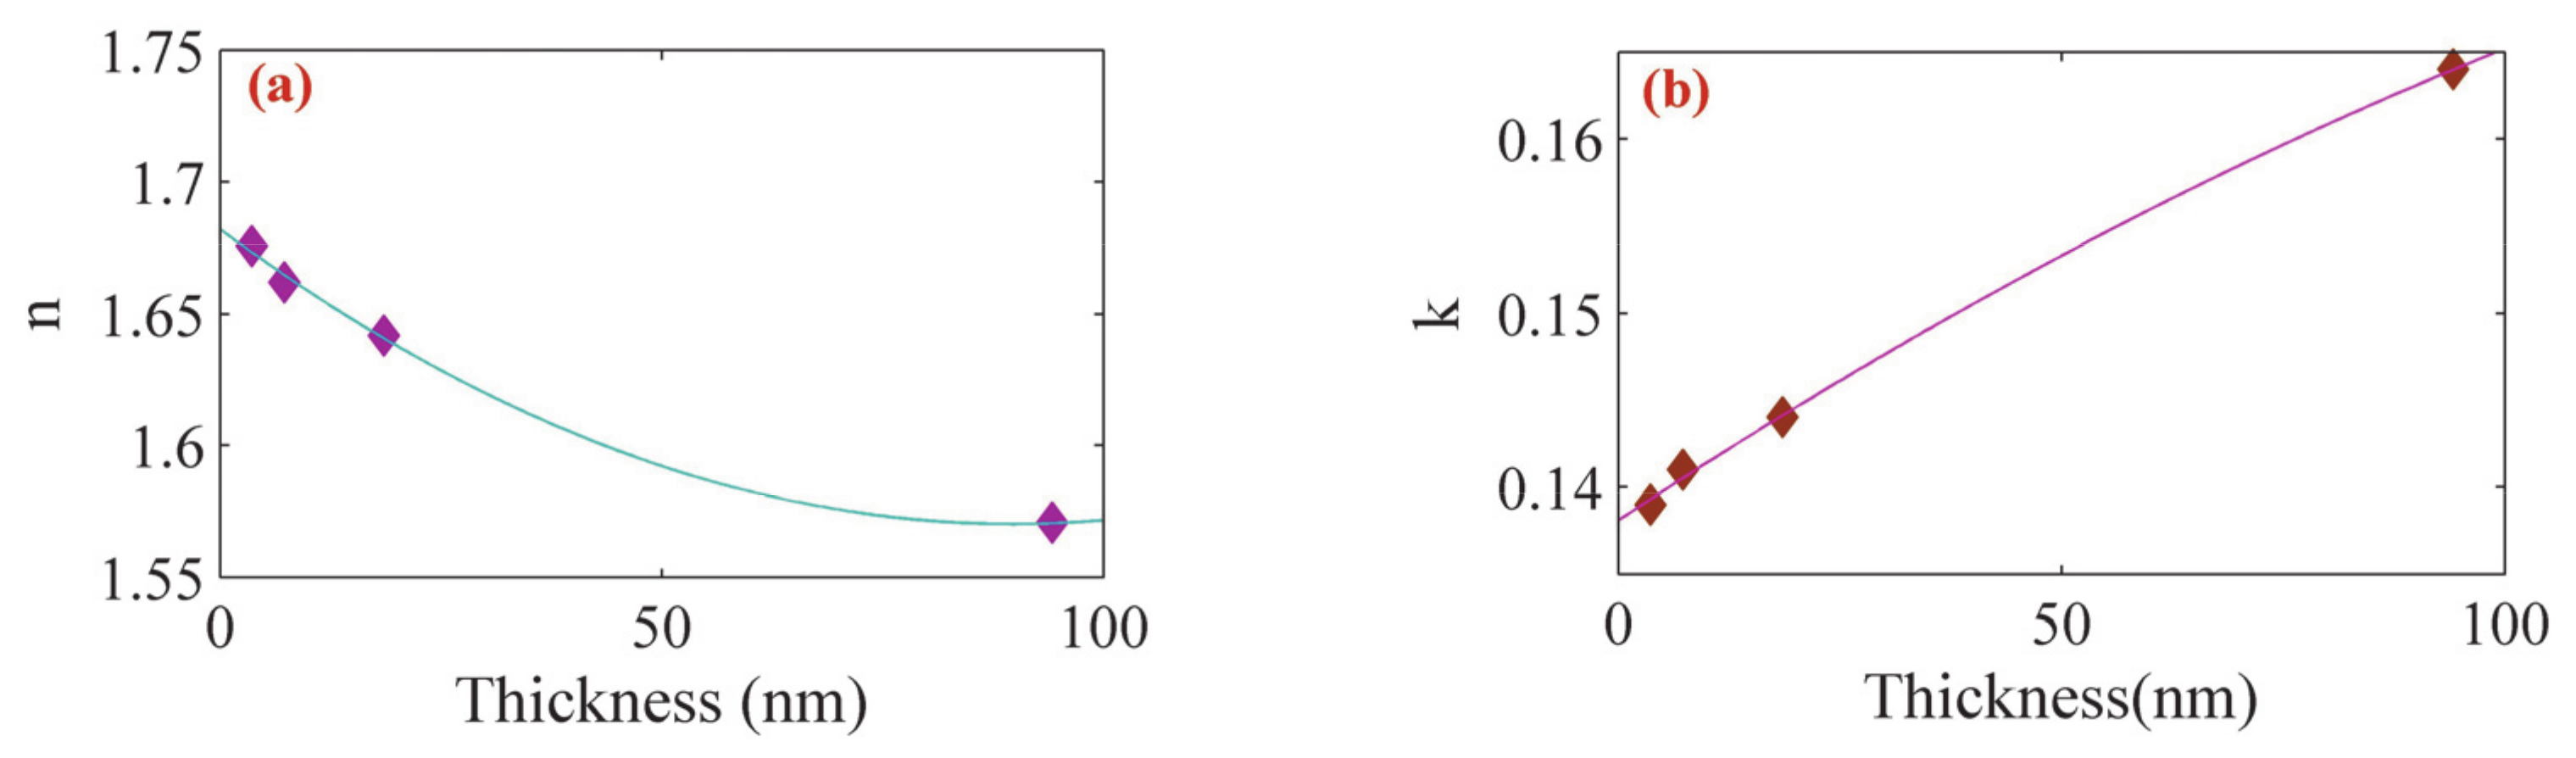
| Sample | Thickness (nm) (Profilometer) | Thickness (nm) (SPR Analysis) | Refractive Index | Resonance Angle | Reflectance |
|---|---|---|---|---|---|
| 1 | 3 | 3.6 | 1.67571 + 0.139i | 53.126° | 0.045 |
| 2 | 7 | 7.3 | 1.66191 + 0.141i | 53.948° | 0.088 |
| 3 | 18 | 18.5 | 1.64183 + 0.144i | 56.668° | 0.216 |
| 4 | 94 | 94.2 | 1.57072 + 0.164i | 68.131° | 0.658 |
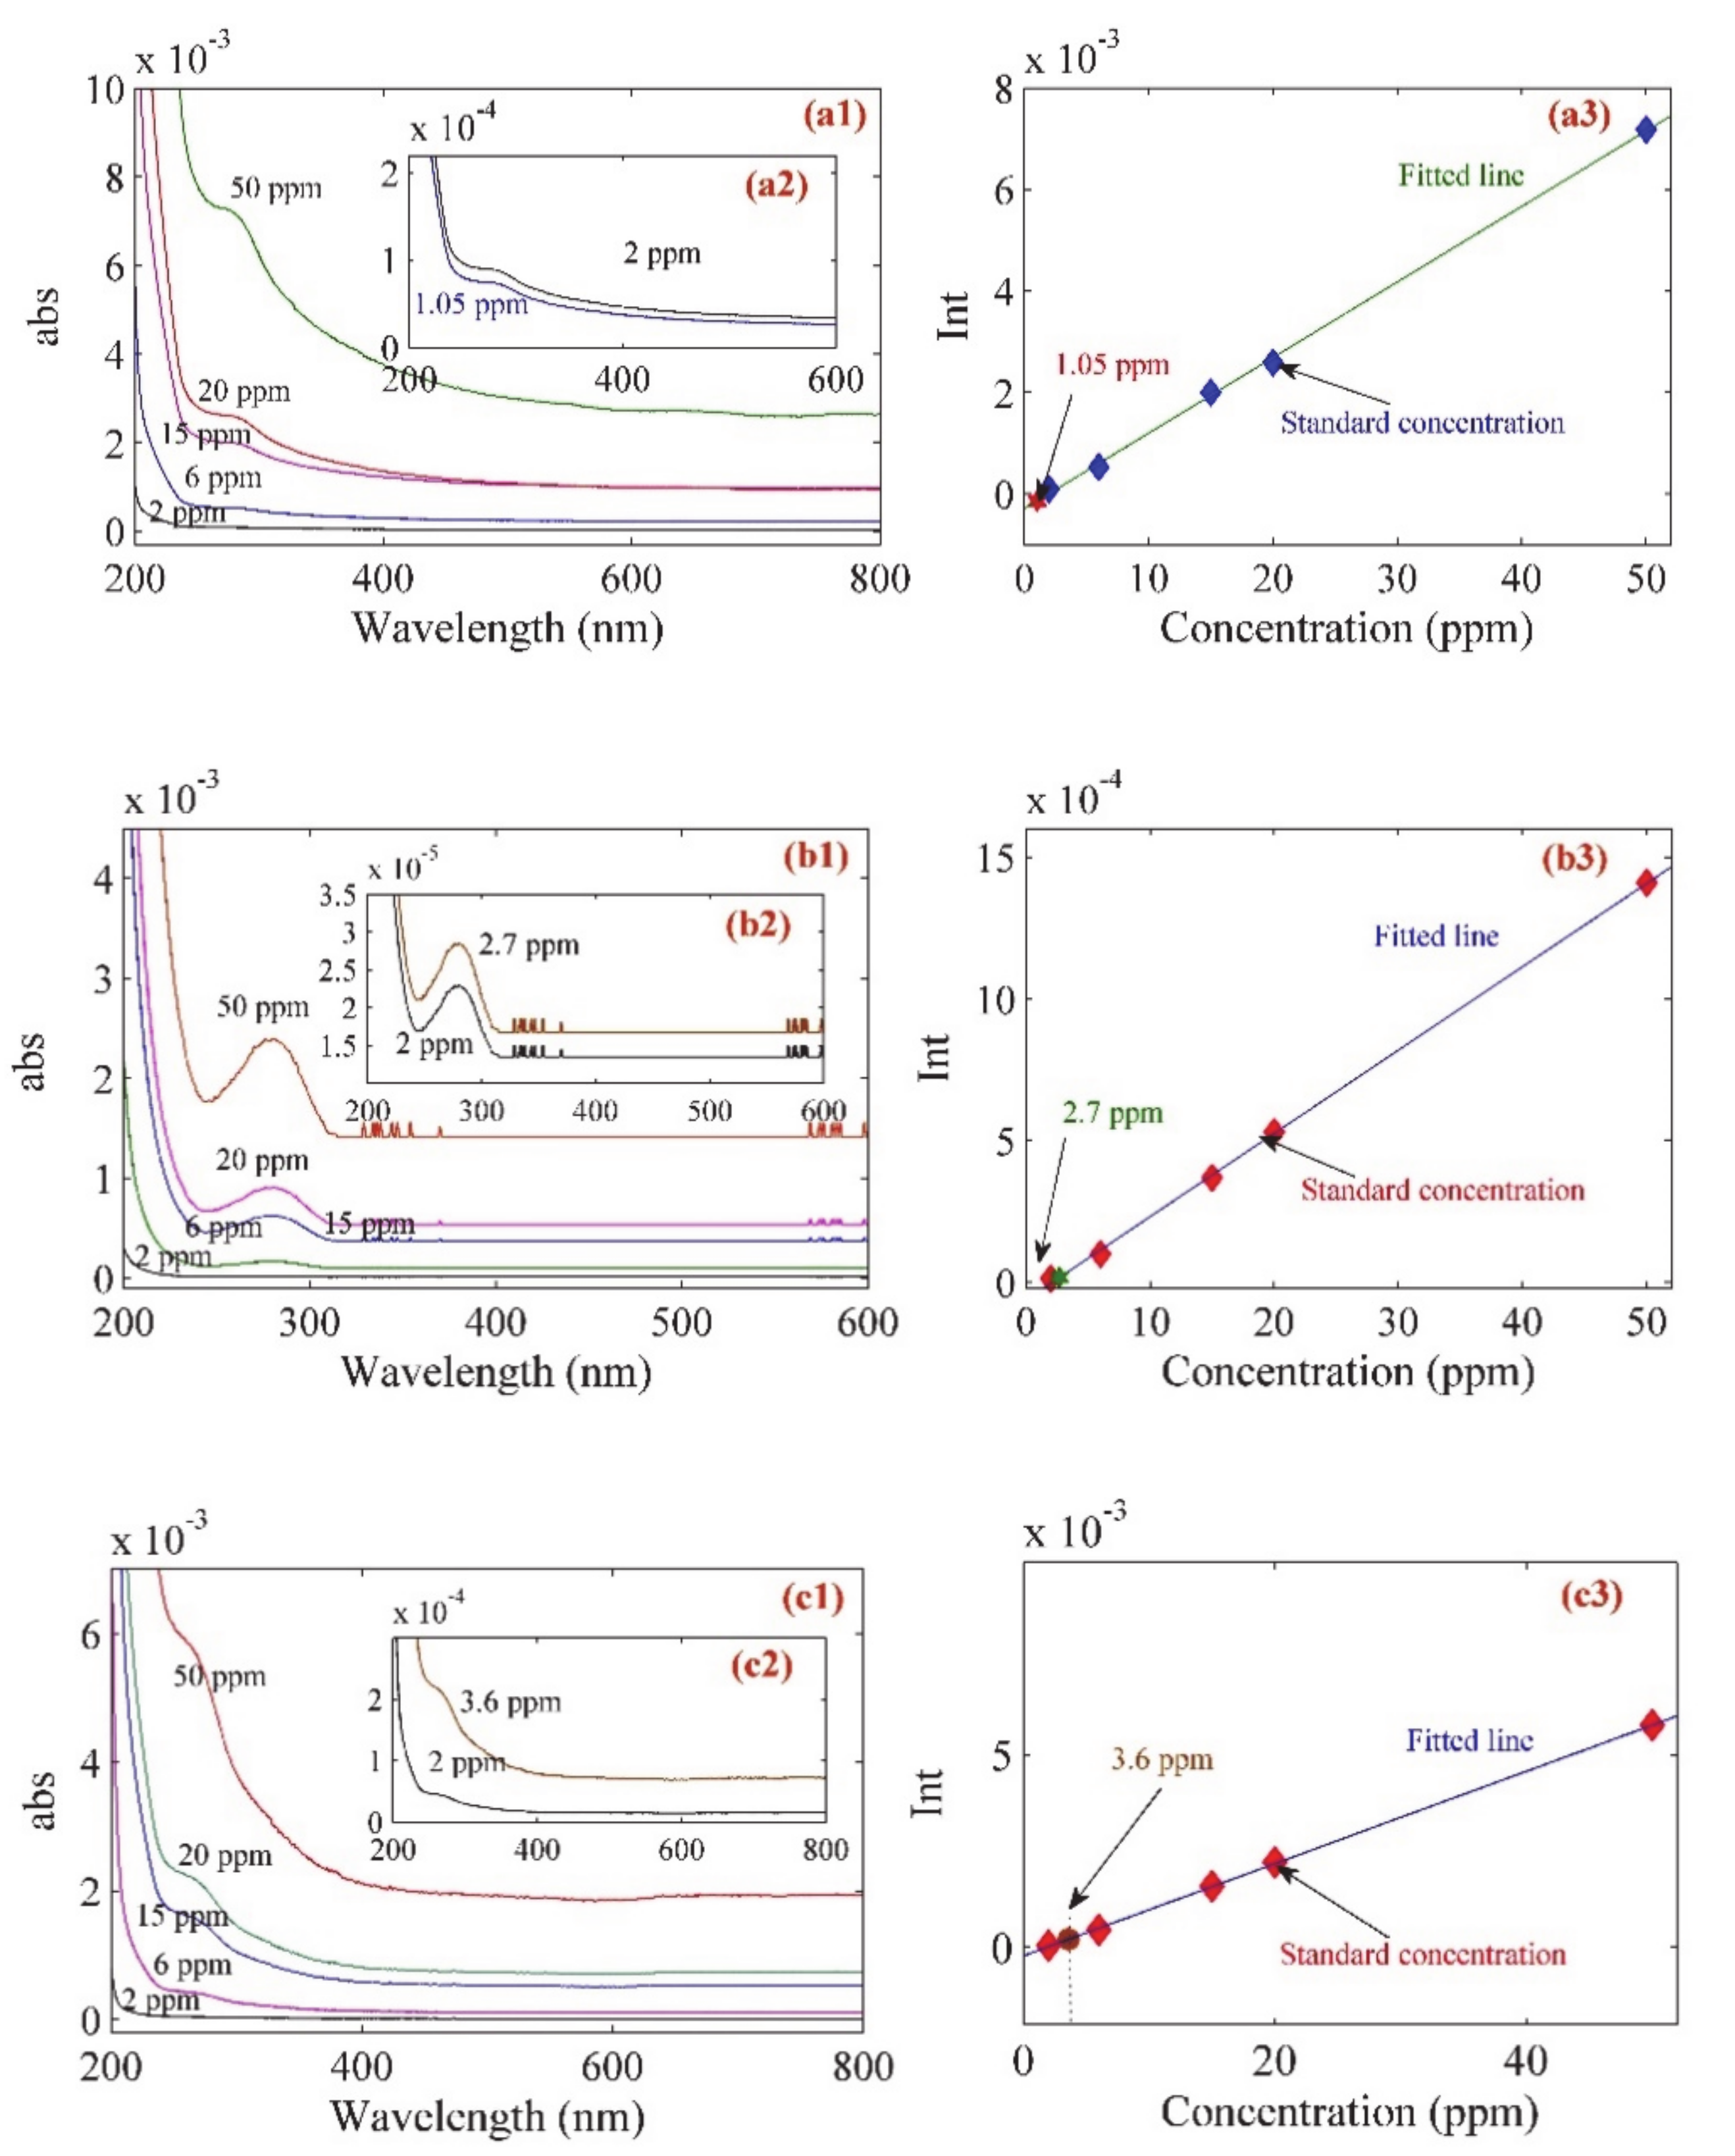
| Sample | Ci (ppm) | Cf(ppm) | Degree of Adsorption (Π) |
|---|---|---|---|
| Glucose | 15 (1.5 mg/dL) | 1.05 (0.105 mg/dL) | 93% |
| Fructose | 15 (1.5 mg/dL) | 2.7 (0.27 mg/dL) | 82% |
| Sucrose | 15 (1.5 mg/dL) | 3.6 (0.27 mg/dL) | 76% |
© 2020 by the authors. Licensee MDPI, Basel, Switzerland. This article is an open access article distributed under the terms and conditions of the Creative Commons Attribution (CC BY) license (http://creativecommons.org/licenses/by/4.0/).
Share and Cite
Sadrolhosseini, A.R.; Moozarm Nia, P.; Naseri, M.; Mohammadi, A.; Wing Fen, Y.; Shafie, S.; Kamari, H.M. Surface Plasmon Resonance Sensor Based on Polypyrrole–Chitosan–BaFe2O4 Nanocomposite Layer to Detect the Sugar. Appl. Sci. 2020, 10, 2855. https://doi.org/10.3390/app10082855
Sadrolhosseini AR, Moozarm Nia P, Naseri M, Mohammadi A, Wing Fen Y, Shafie S, Kamari HM. Surface Plasmon Resonance Sensor Based on Polypyrrole–Chitosan–BaFe2O4 Nanocomposite Layer to Detect the Sugar. Applied Sciences. 2020; 10(8):2855. https://doi.org/10.3390/app10082855
Chicago/Turabian StyleSadrolhosseini, Amir Reza, Pooria Moozarm Nia, Mahmoud Naseri, Ahmad Mohammadi, Yap Wing Fen, Suhidi Shafie, and Halimah Mohamed Kamari. 2020. "Surface Plasmon Resonance Sensor Based on Polypyrrole–Chitosan–BaFe2O4 Nanocomposite Layer to Detect the Sugar" Applied Sciences 10, no. 8: 2855. https://doi.org/10.3390/app10082855
APA StyleSadrolhosseini, A. R., Moozarm Nia, P., Naseri, M., Mohammadi, A., Wing Fen, Y., Shafie, S., & Kamari, H. M. (2020). Surface Plasmon Resonance Sensor Based on Polypyrrole–Chitosan–BaFe2O4 Nanocomposite Layer to Detect the Sugar. Applied Sciences, 10(8), 2855. https://doi.org/10.3390/app10082855