Analysis of Undrained Seismic Behavior of Shallow Tunnels in Soft Clay Using Nonlinear Kinematic Hardening Model

Abstract
1. Introduction
2. Constitutive Model and Calibration
2.1. Constitutive Model
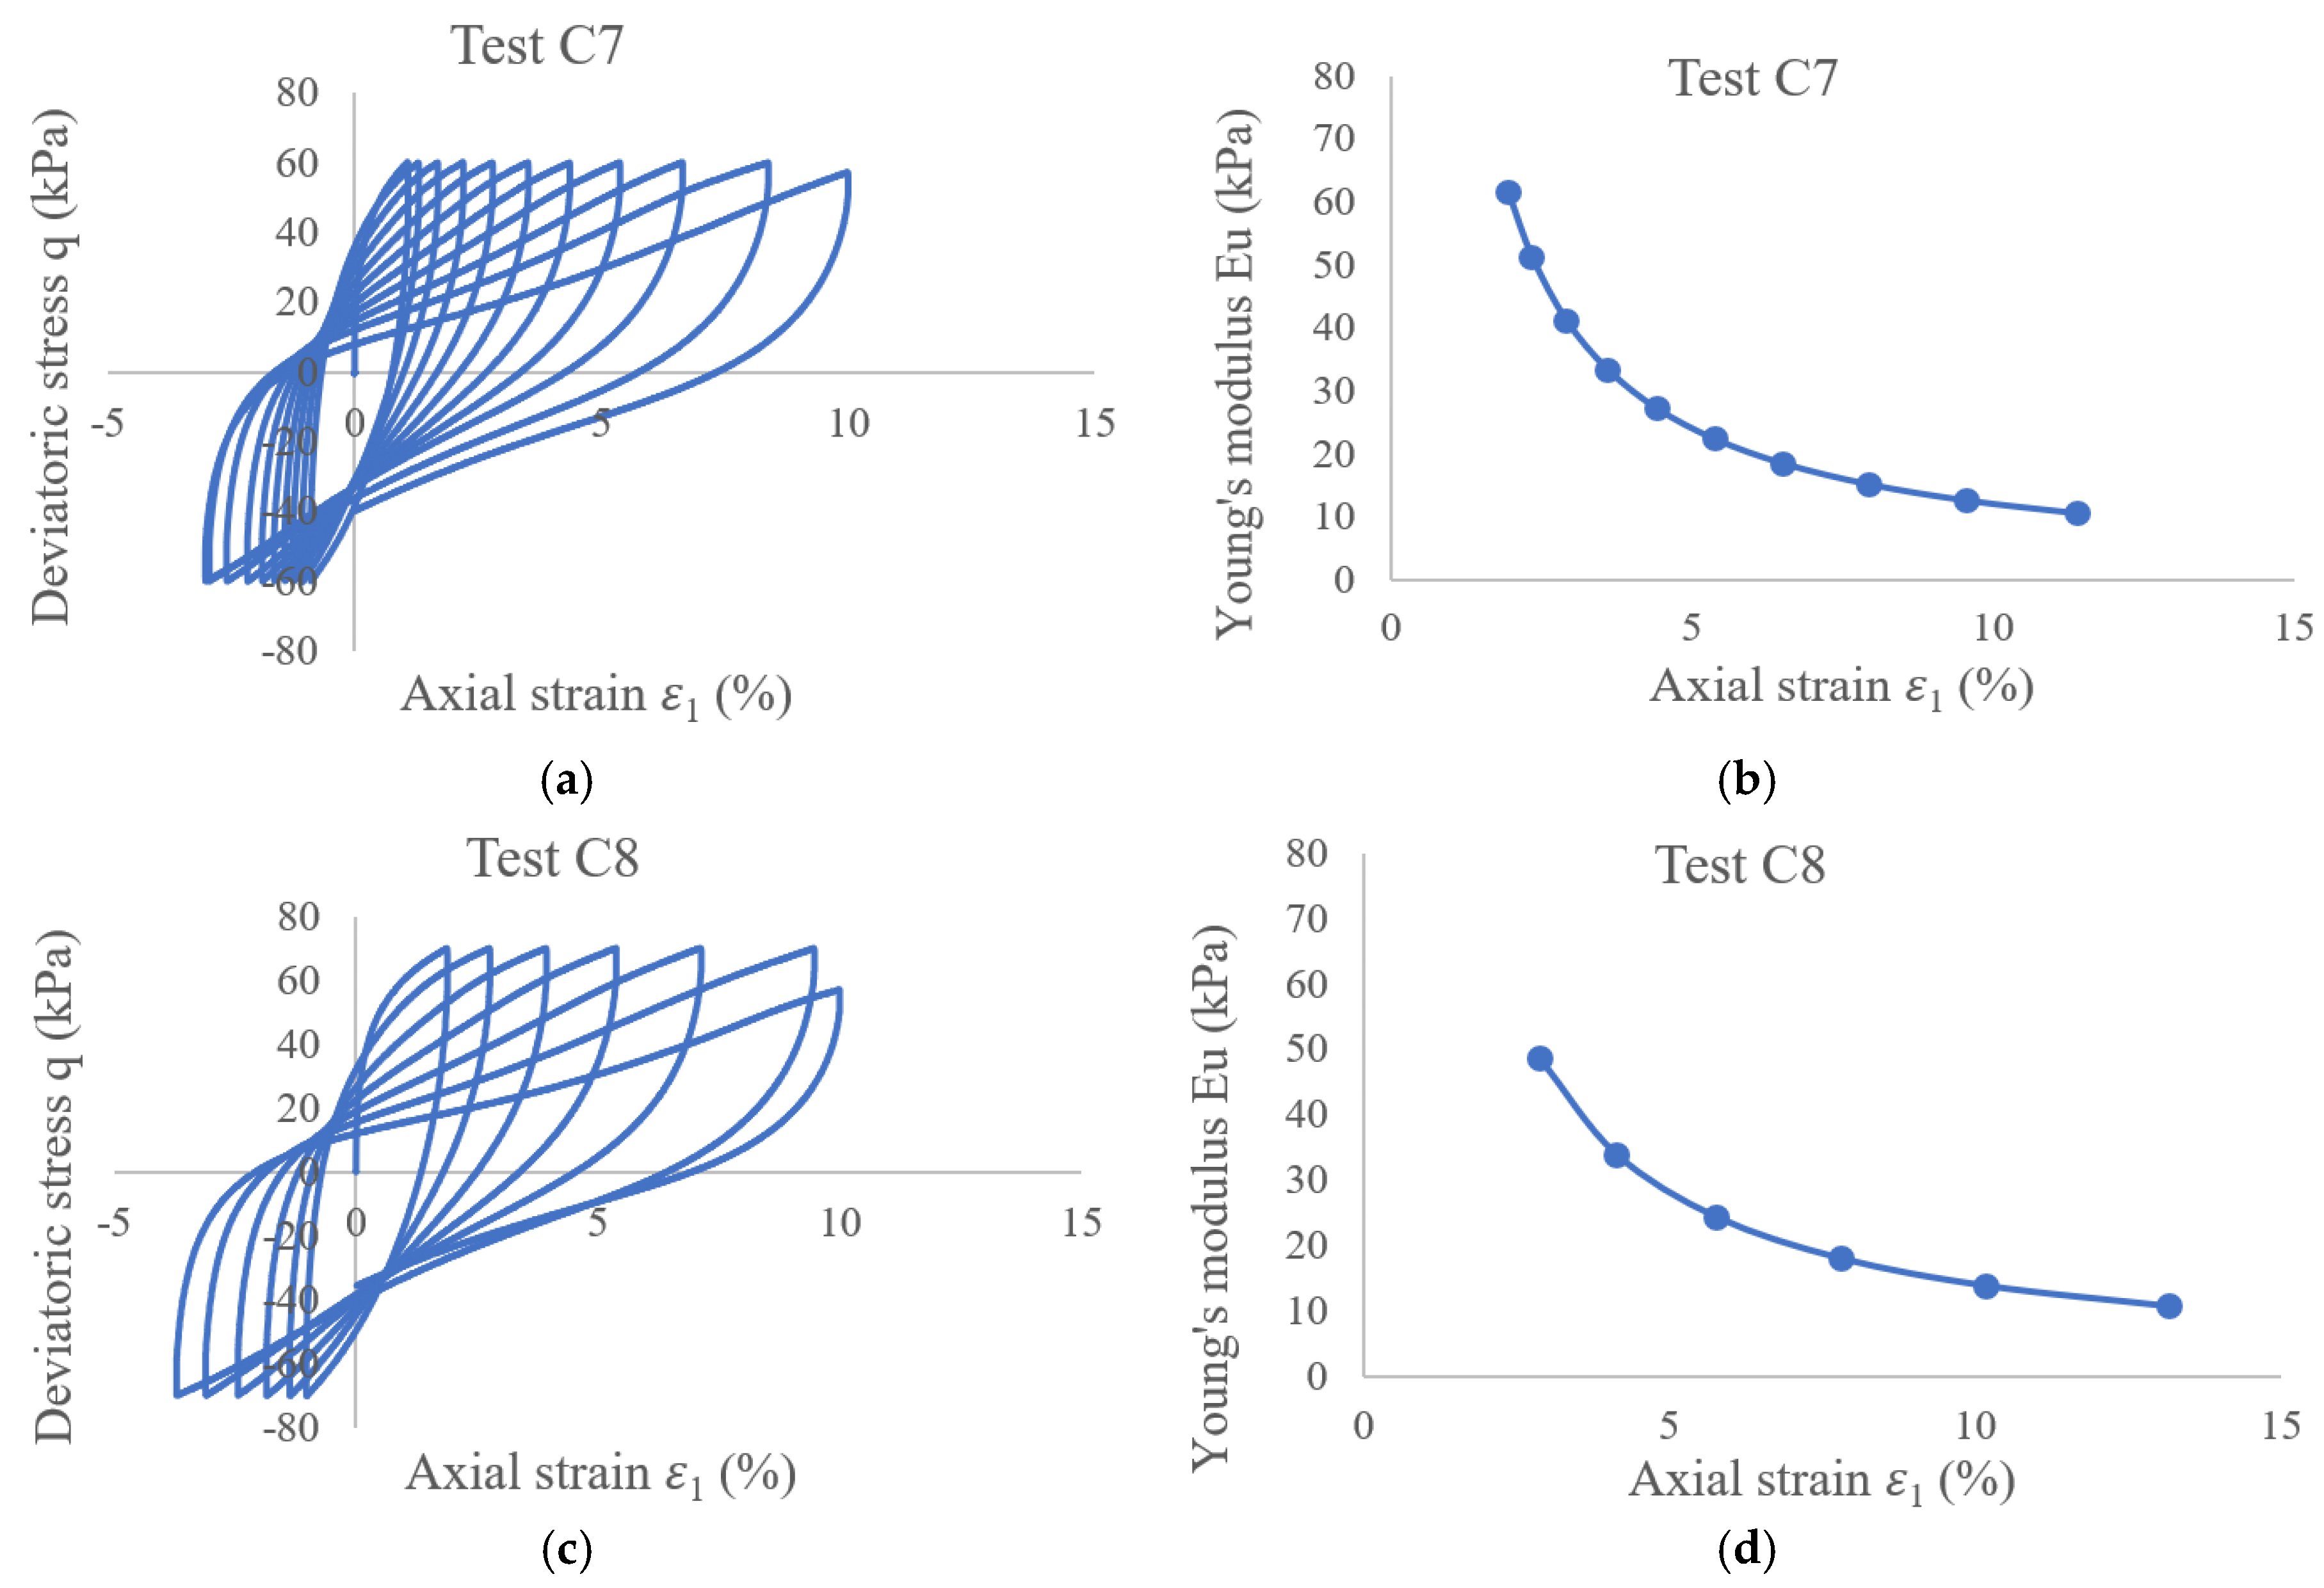
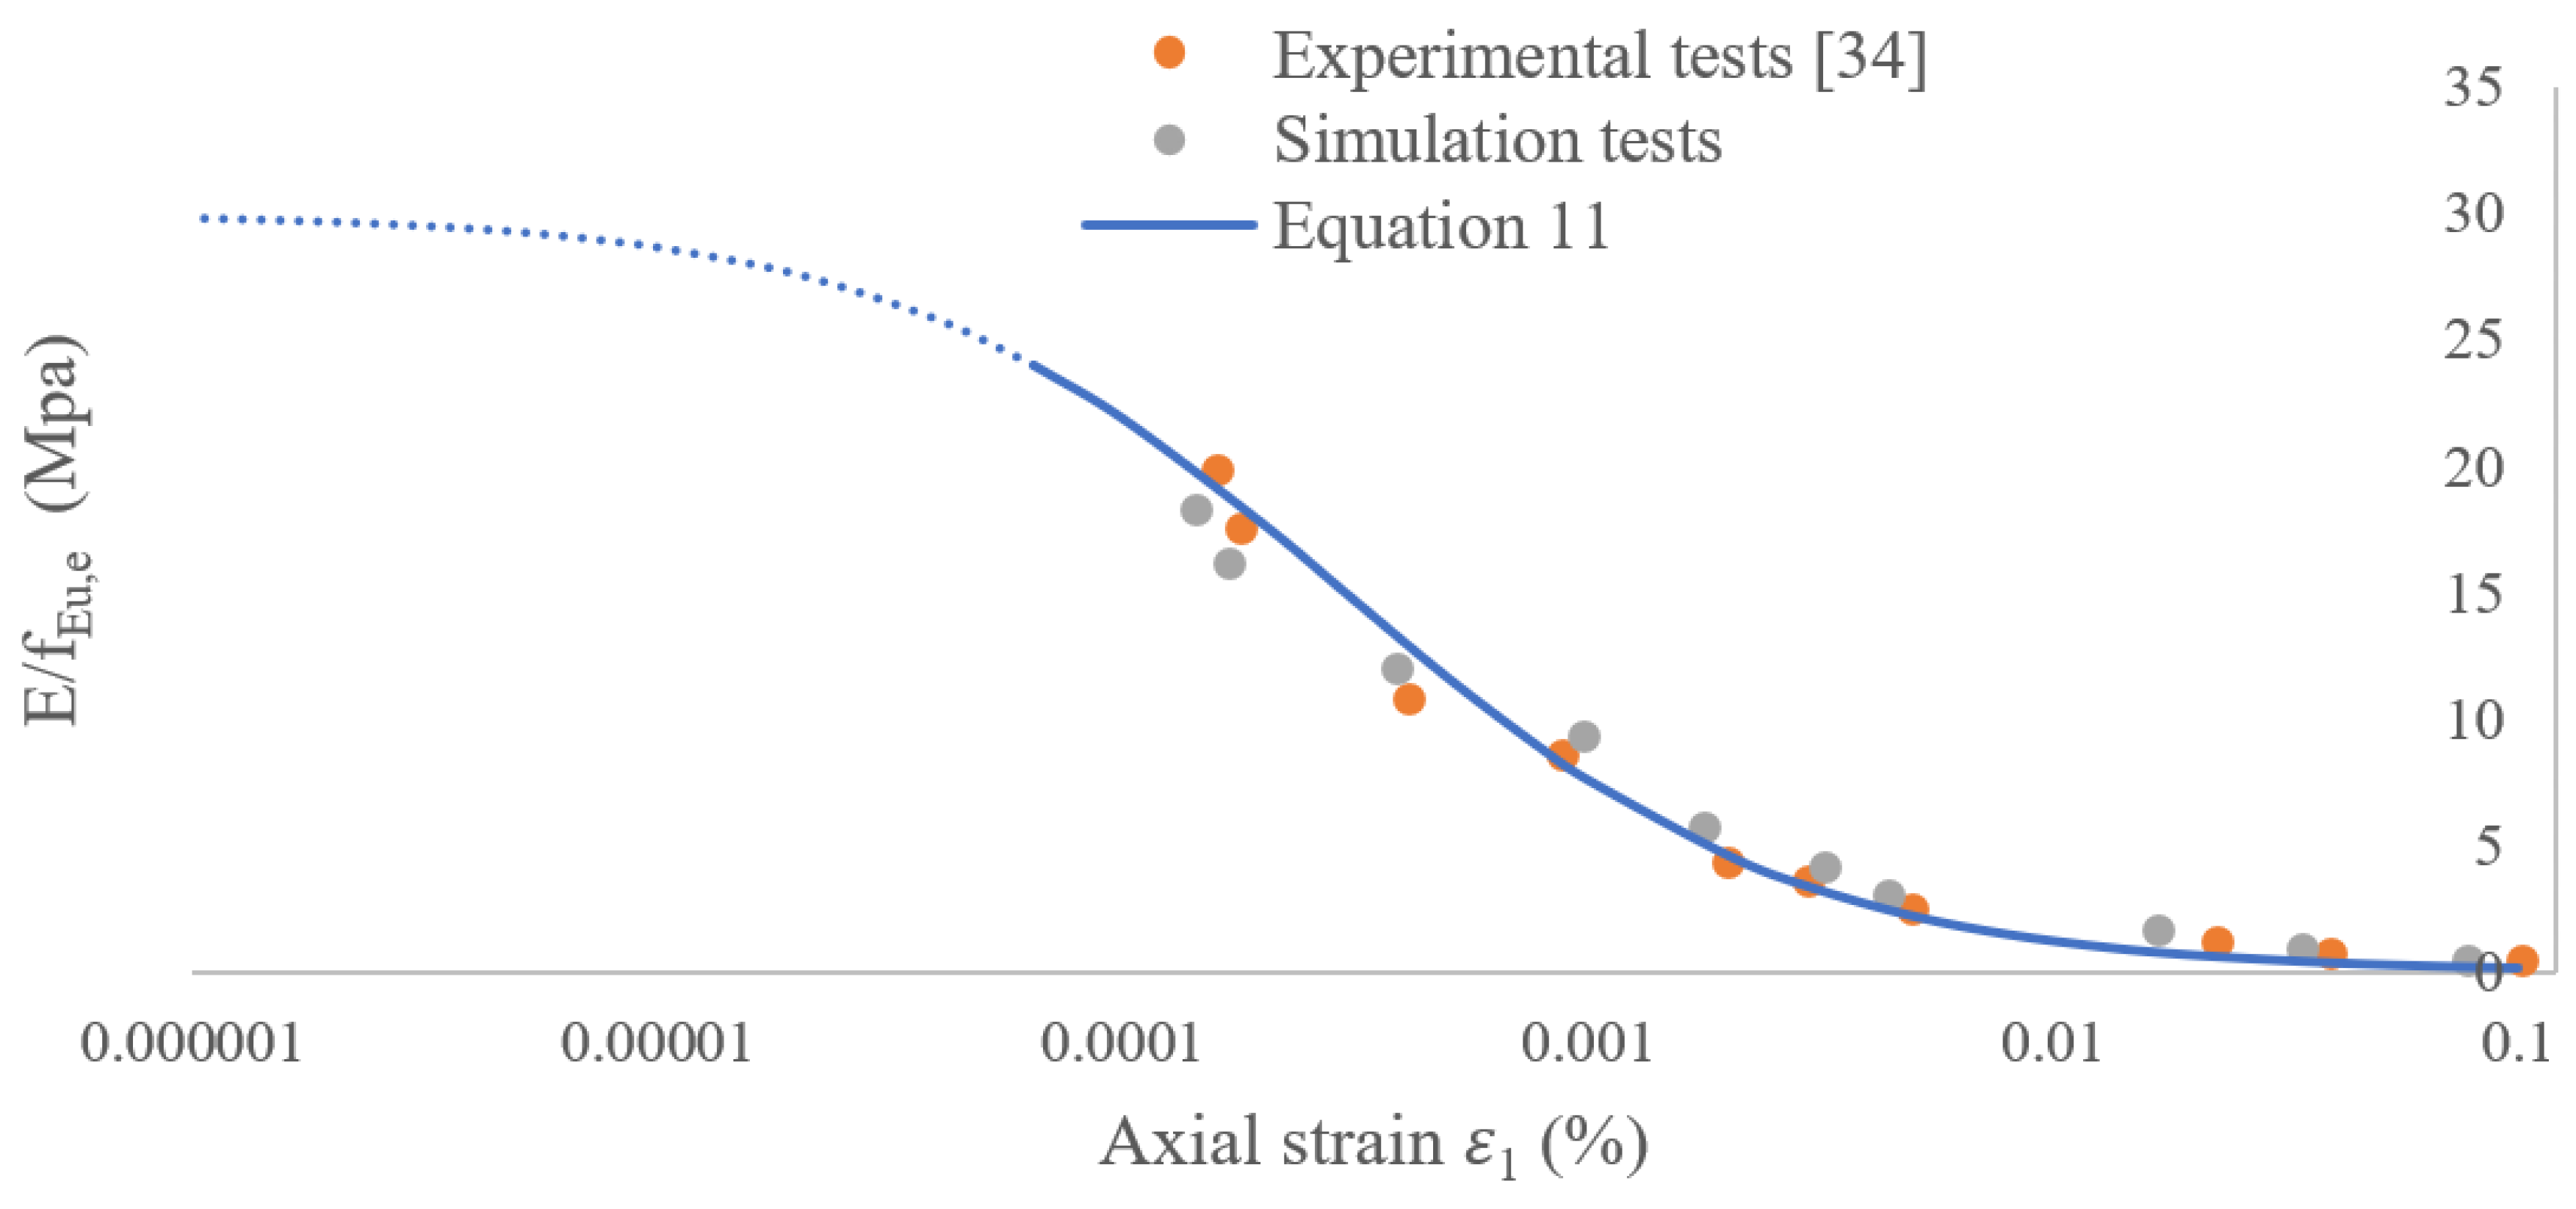
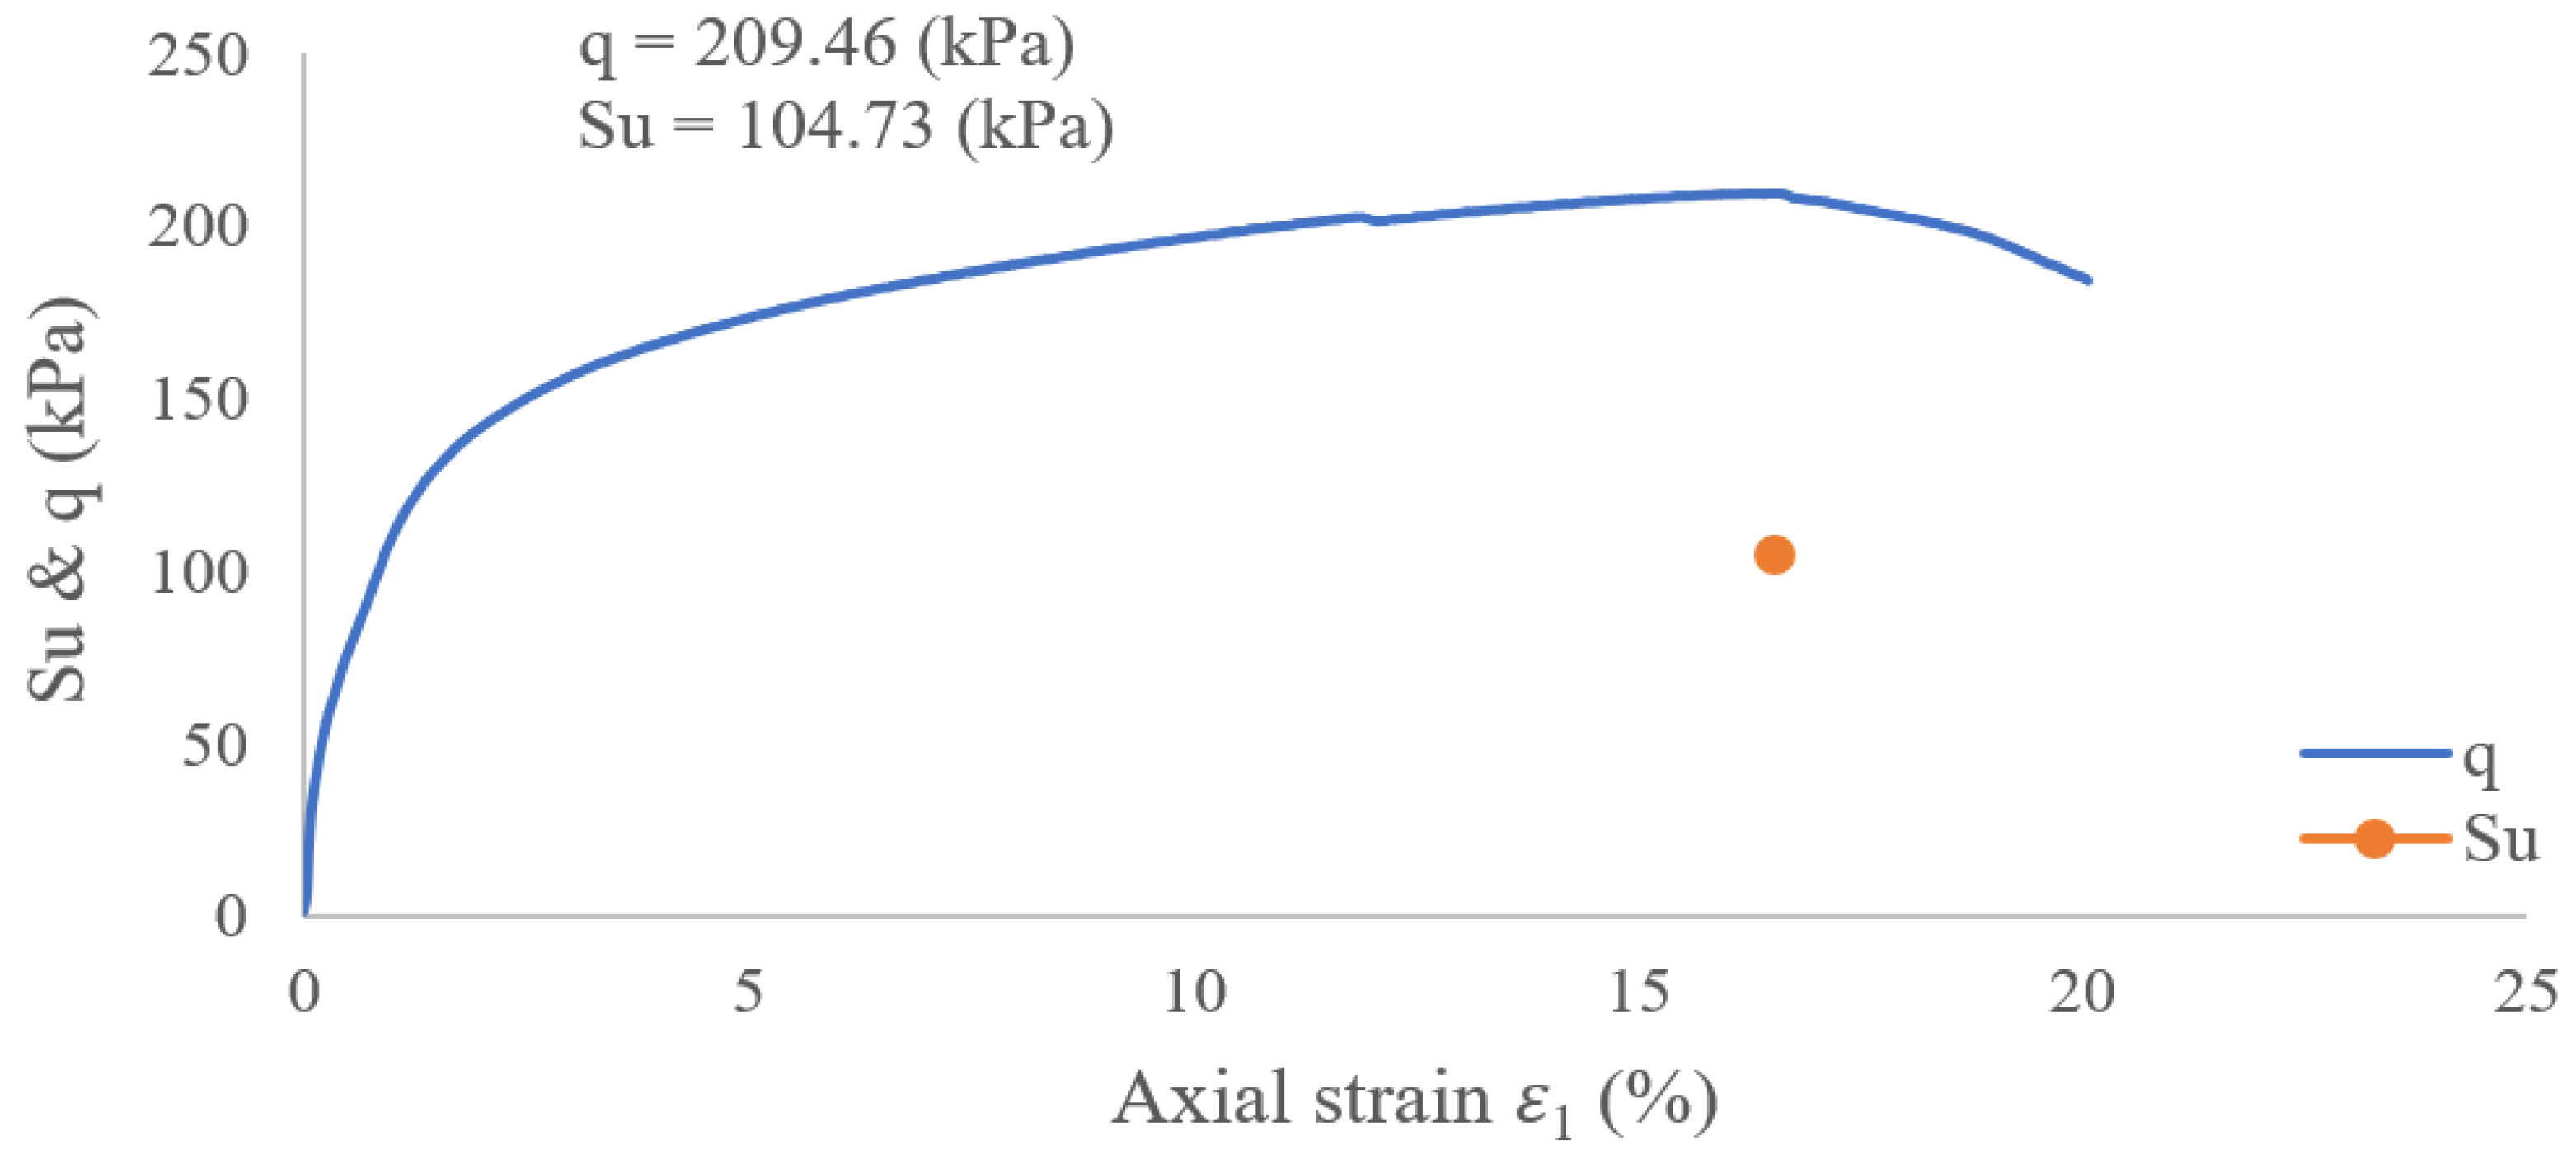
2.2. Calibration of Parameters and Model Validation
2.2.1. Determination of
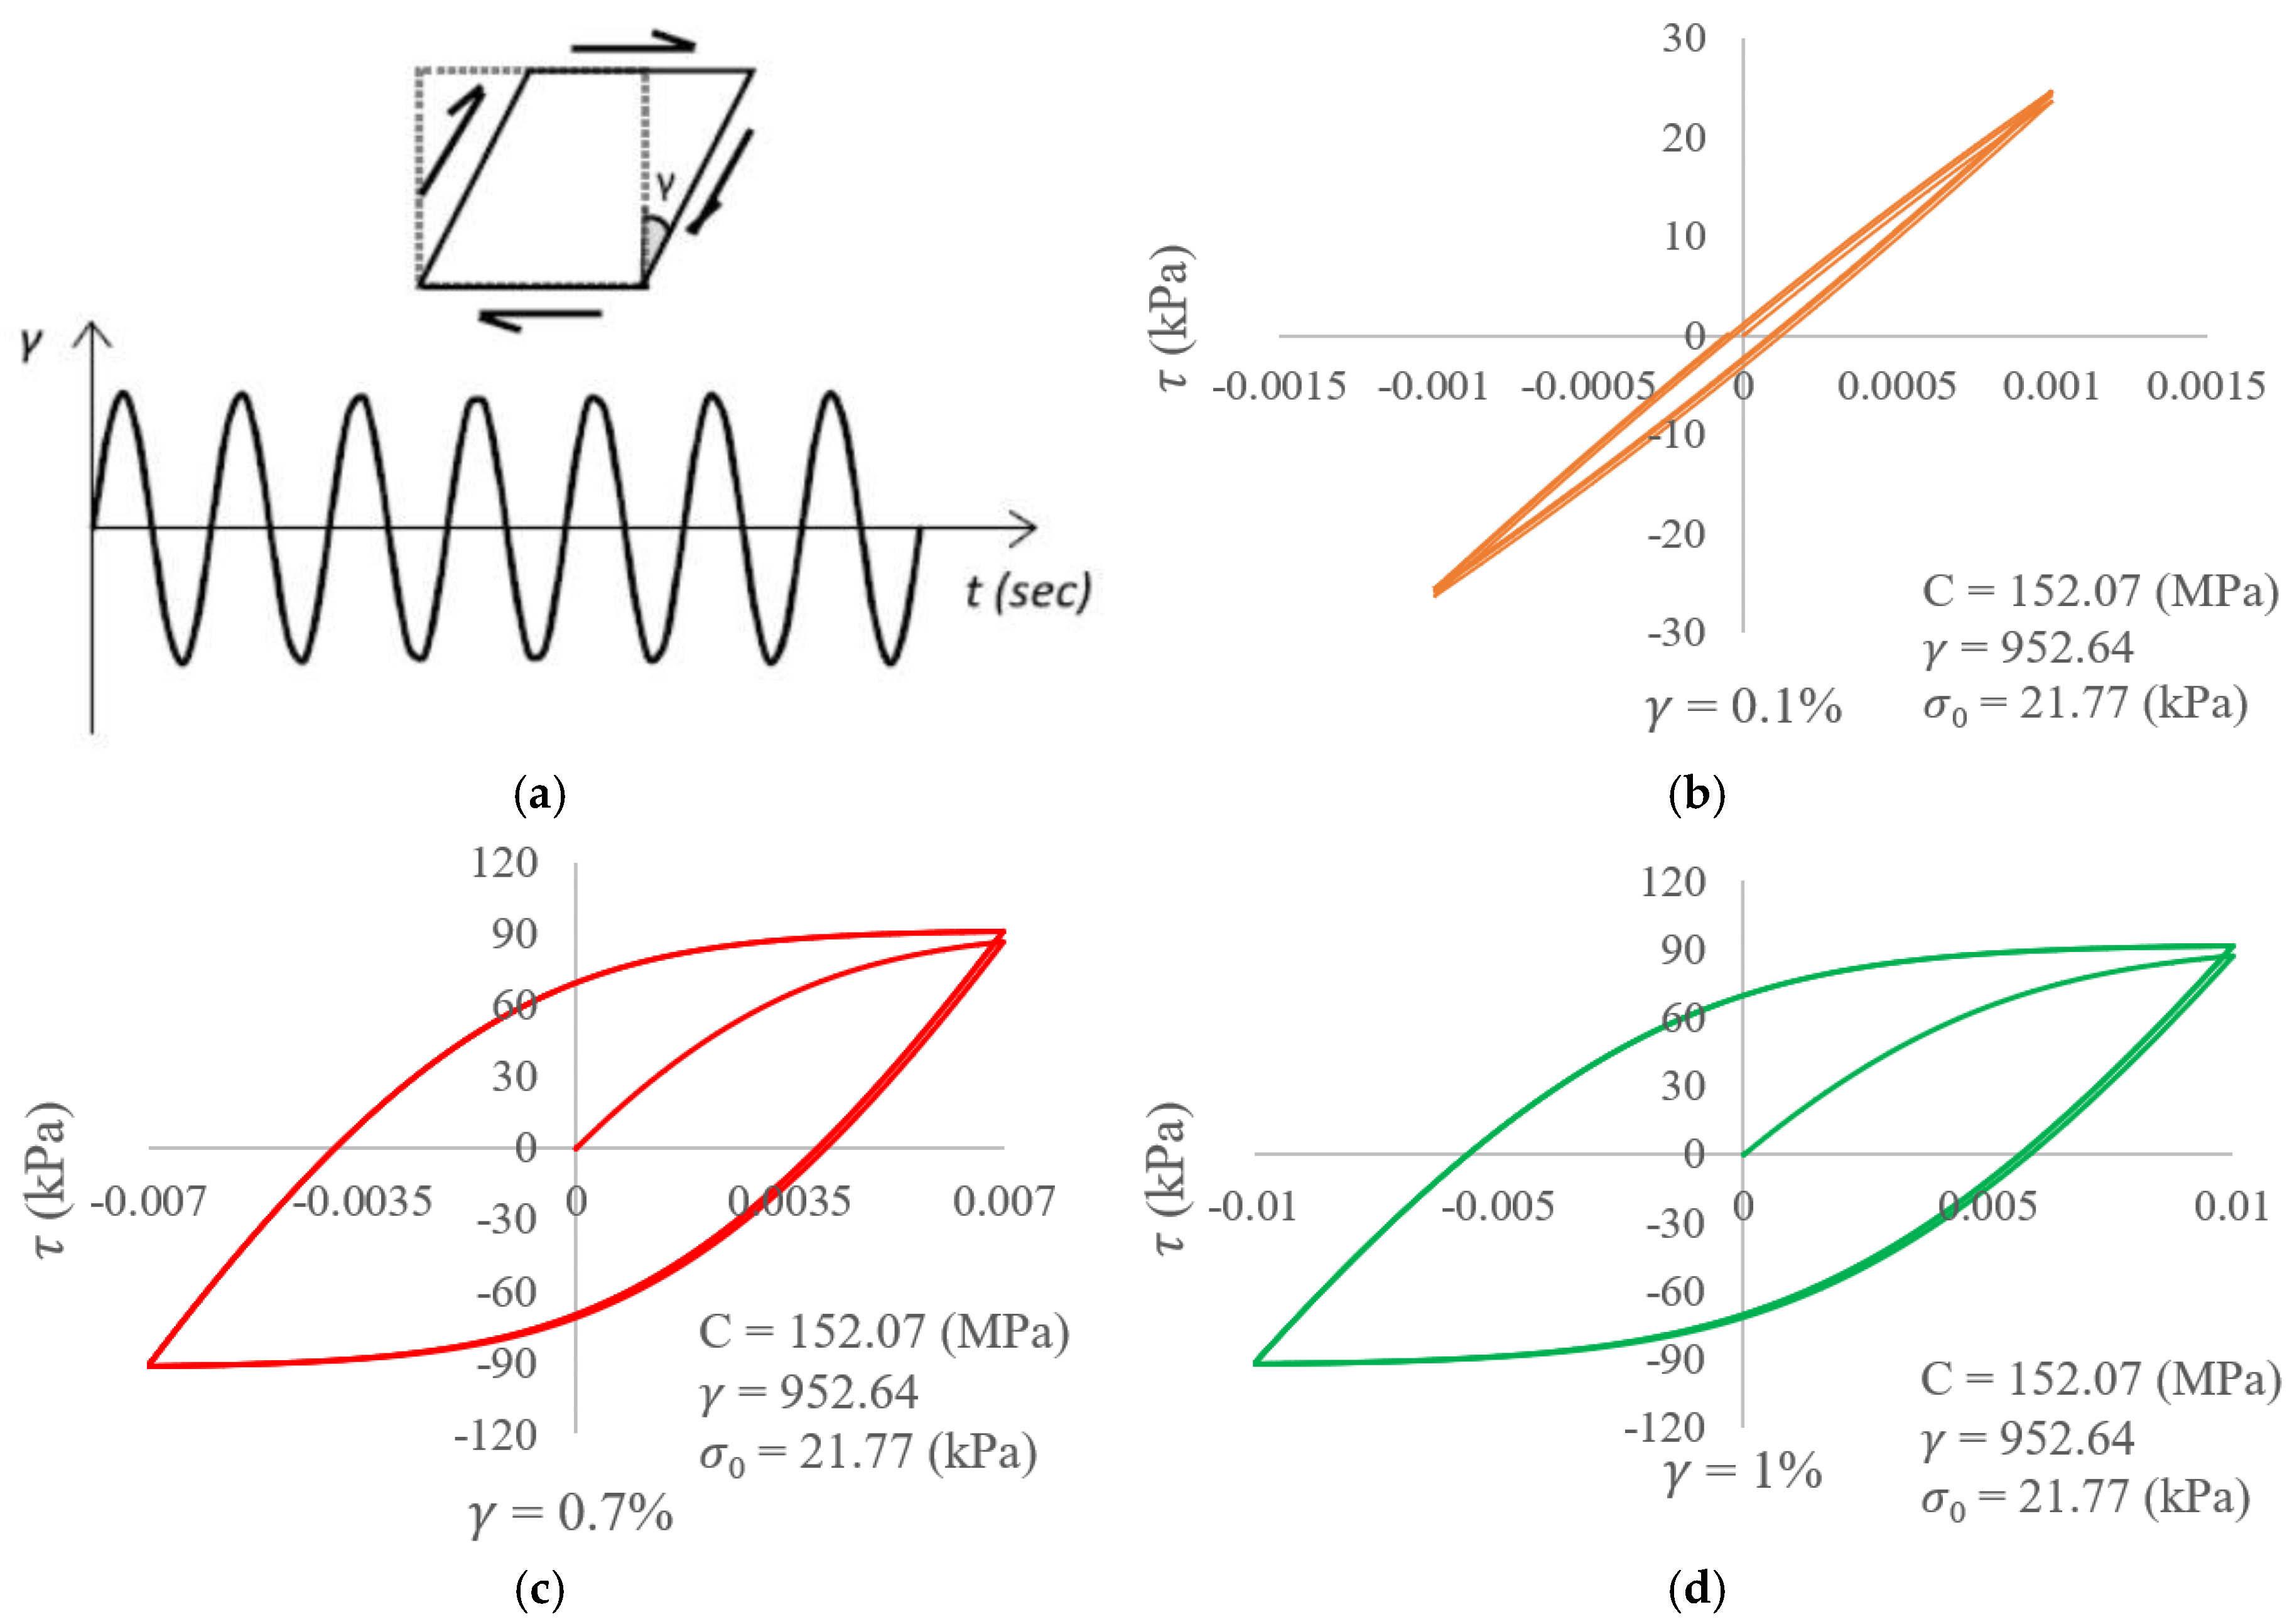
2.2.2. Determination of , , and
3. Finite Element Models
3.1. Model Descriptions
3.2. Results and Discussions
4. Conclusions
- Choosing the appropriate constitutive model to achieve logical results is key to evaluating the seismic behavior of the tunnel in numerical methods. The use of a nonlinear kinematic hardening model that considers the effect of soil stiffness degradation is appropriate for structures under cyclic loads.
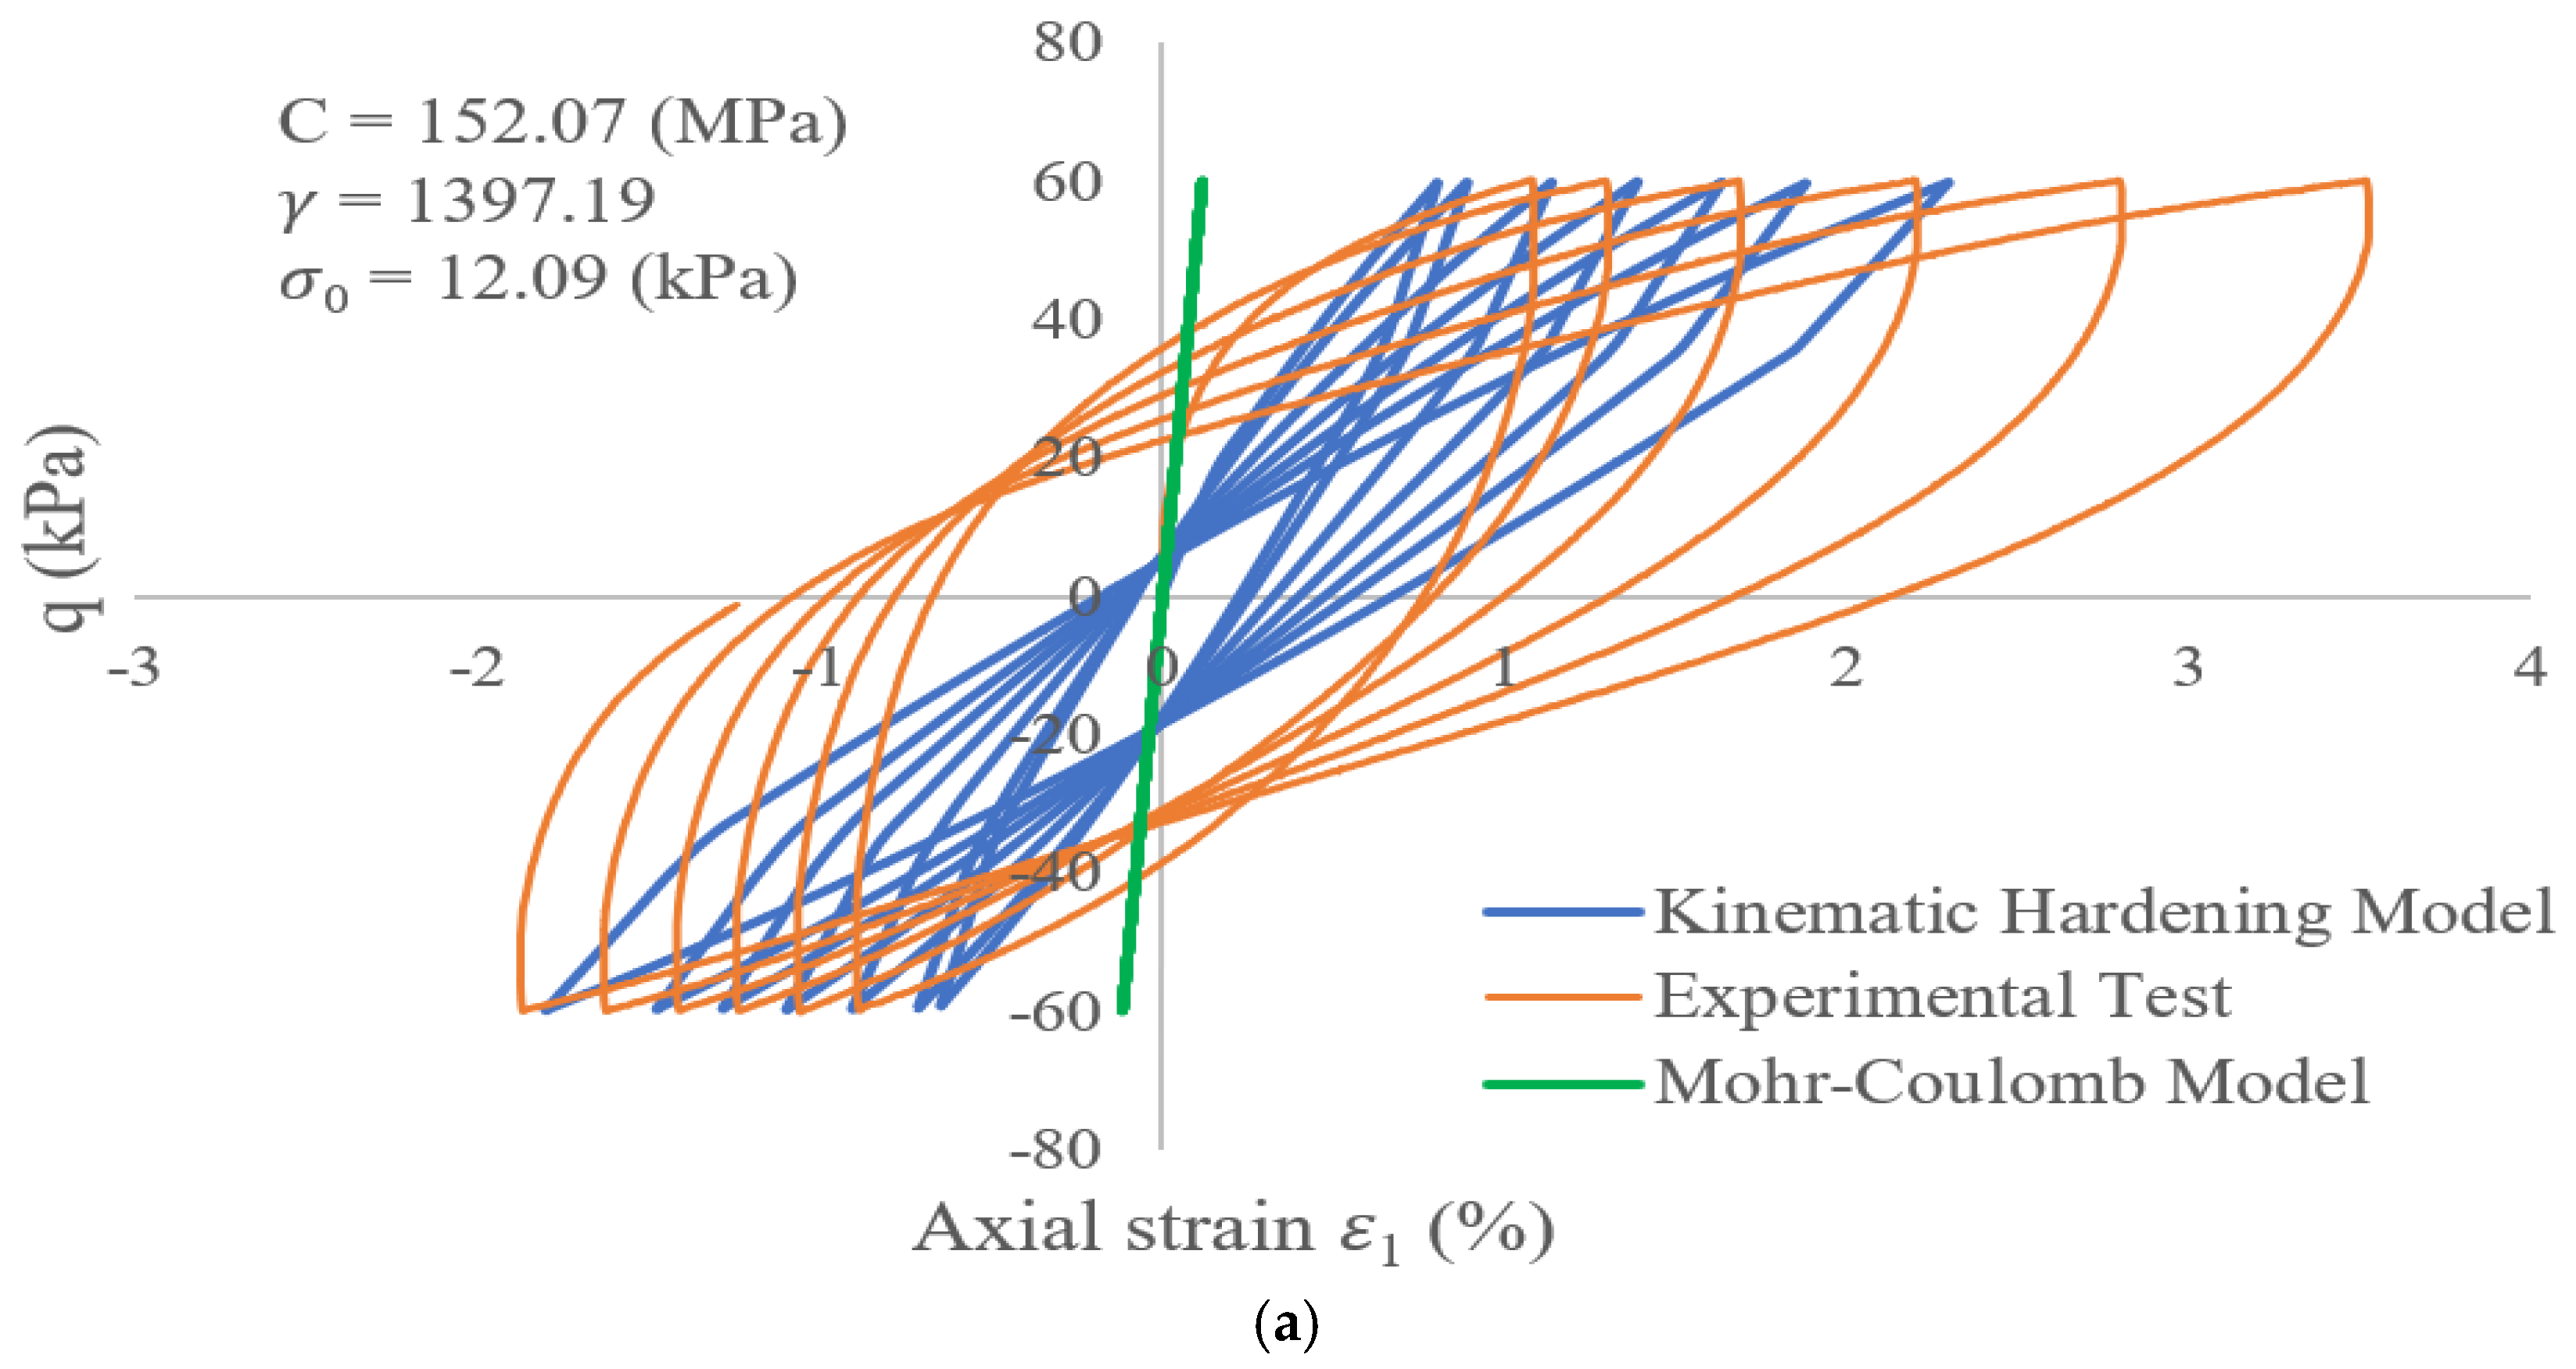
- Calibrating the parameters of the kinematic hardening constitutive model using the data from undrained cyclic triaxial tests afford results that are almost identical to those from using the Ishibashi and Zhang equations and data from simulation of the cyclic shear tests.
- The nonlinear kinematic hardening constitutive model can better demonstrate the cyclic deformation behavior of soils under cyclic loading than conventional and simple models such as the linear elastic–perfectly plastic Mohr–Coulomb model.
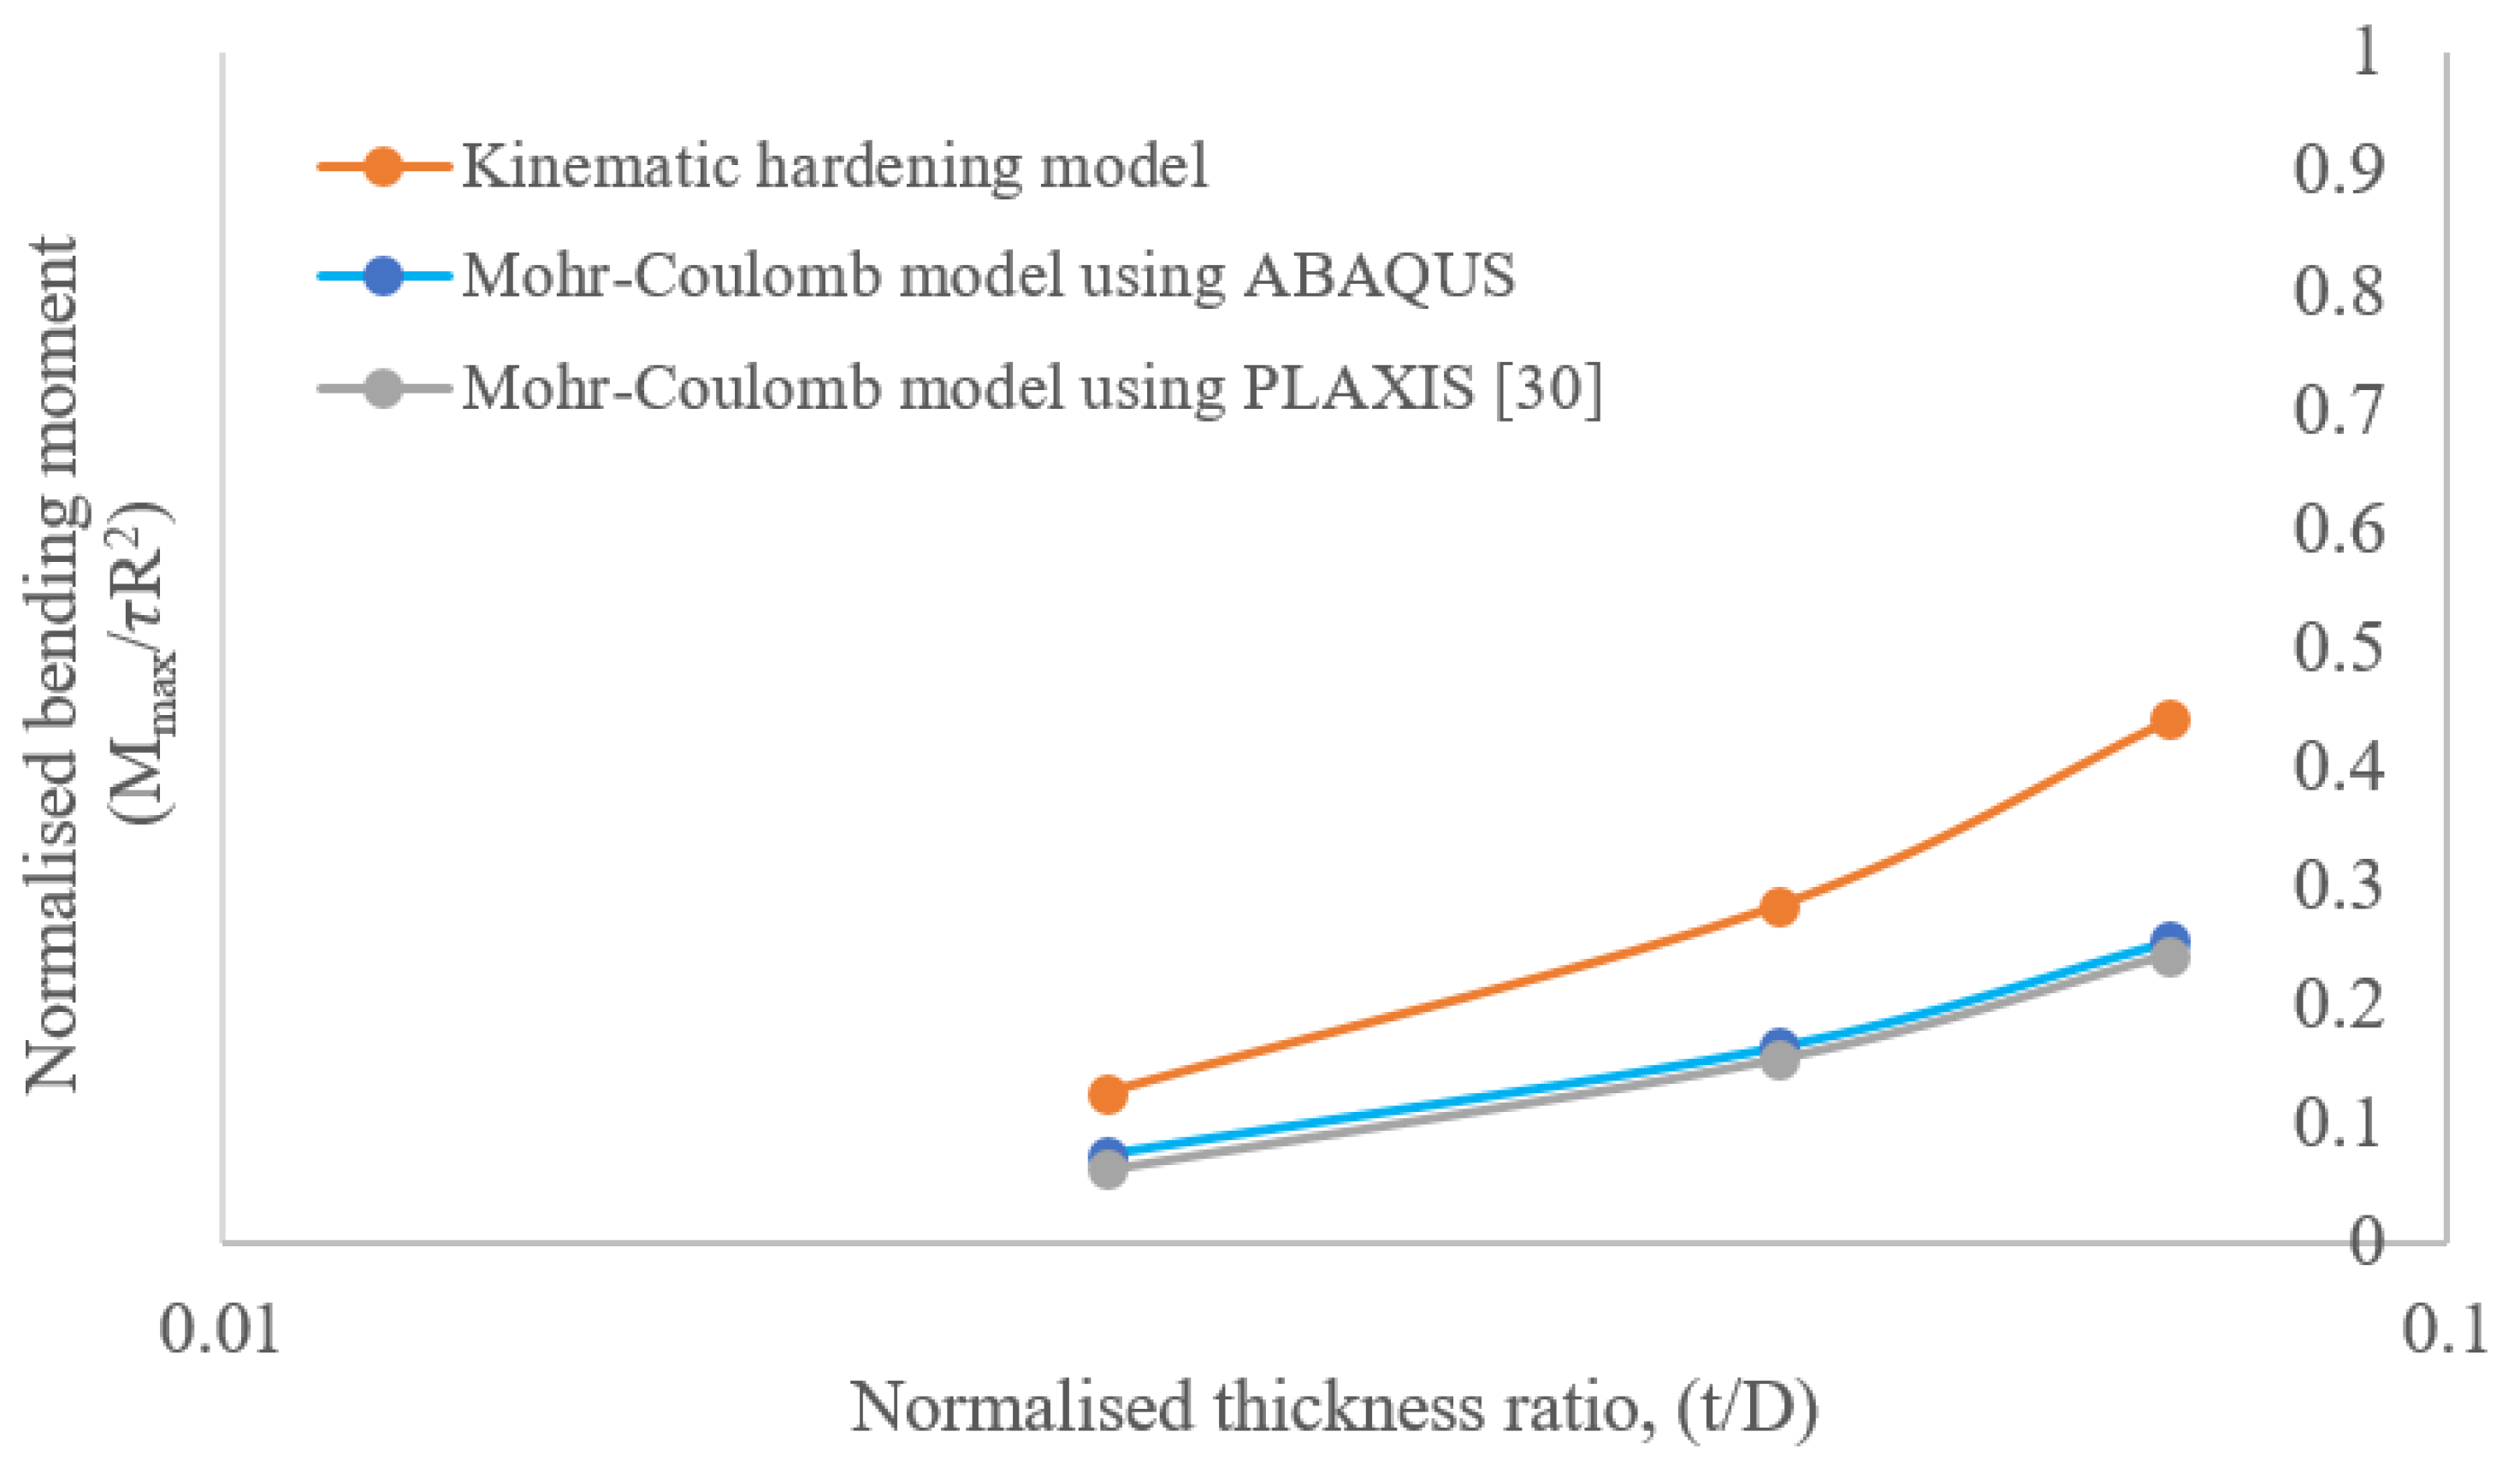
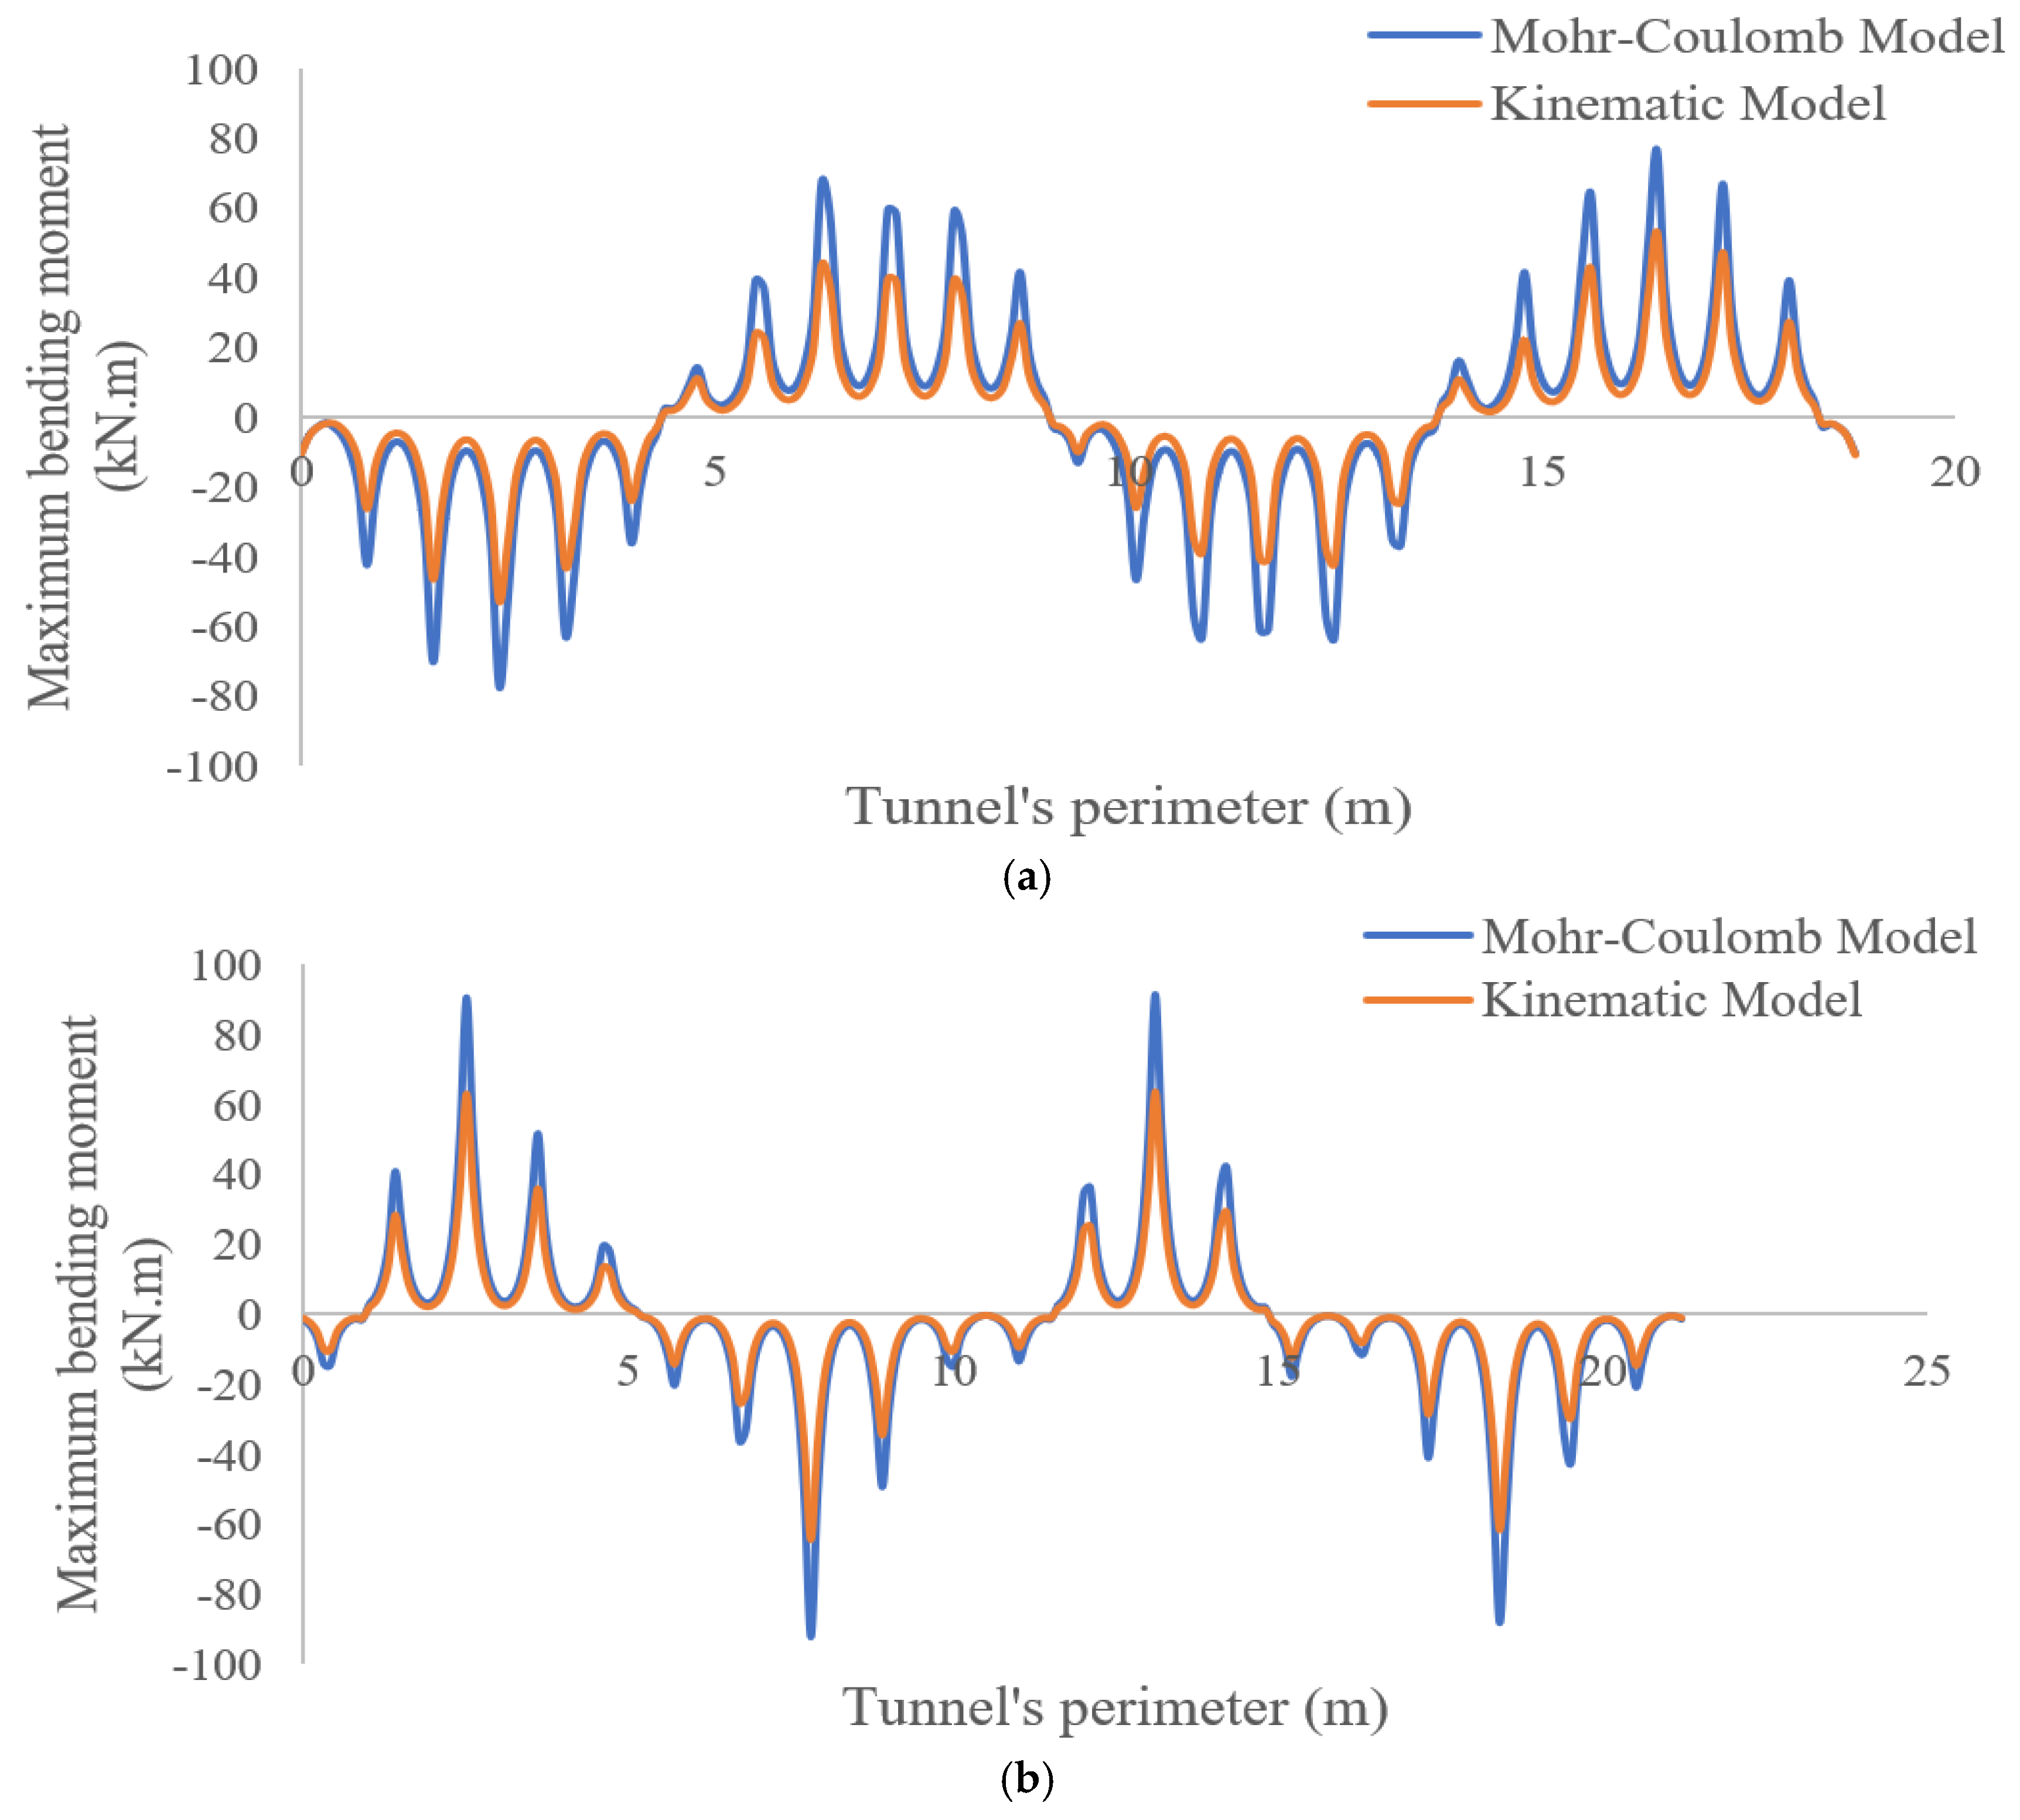
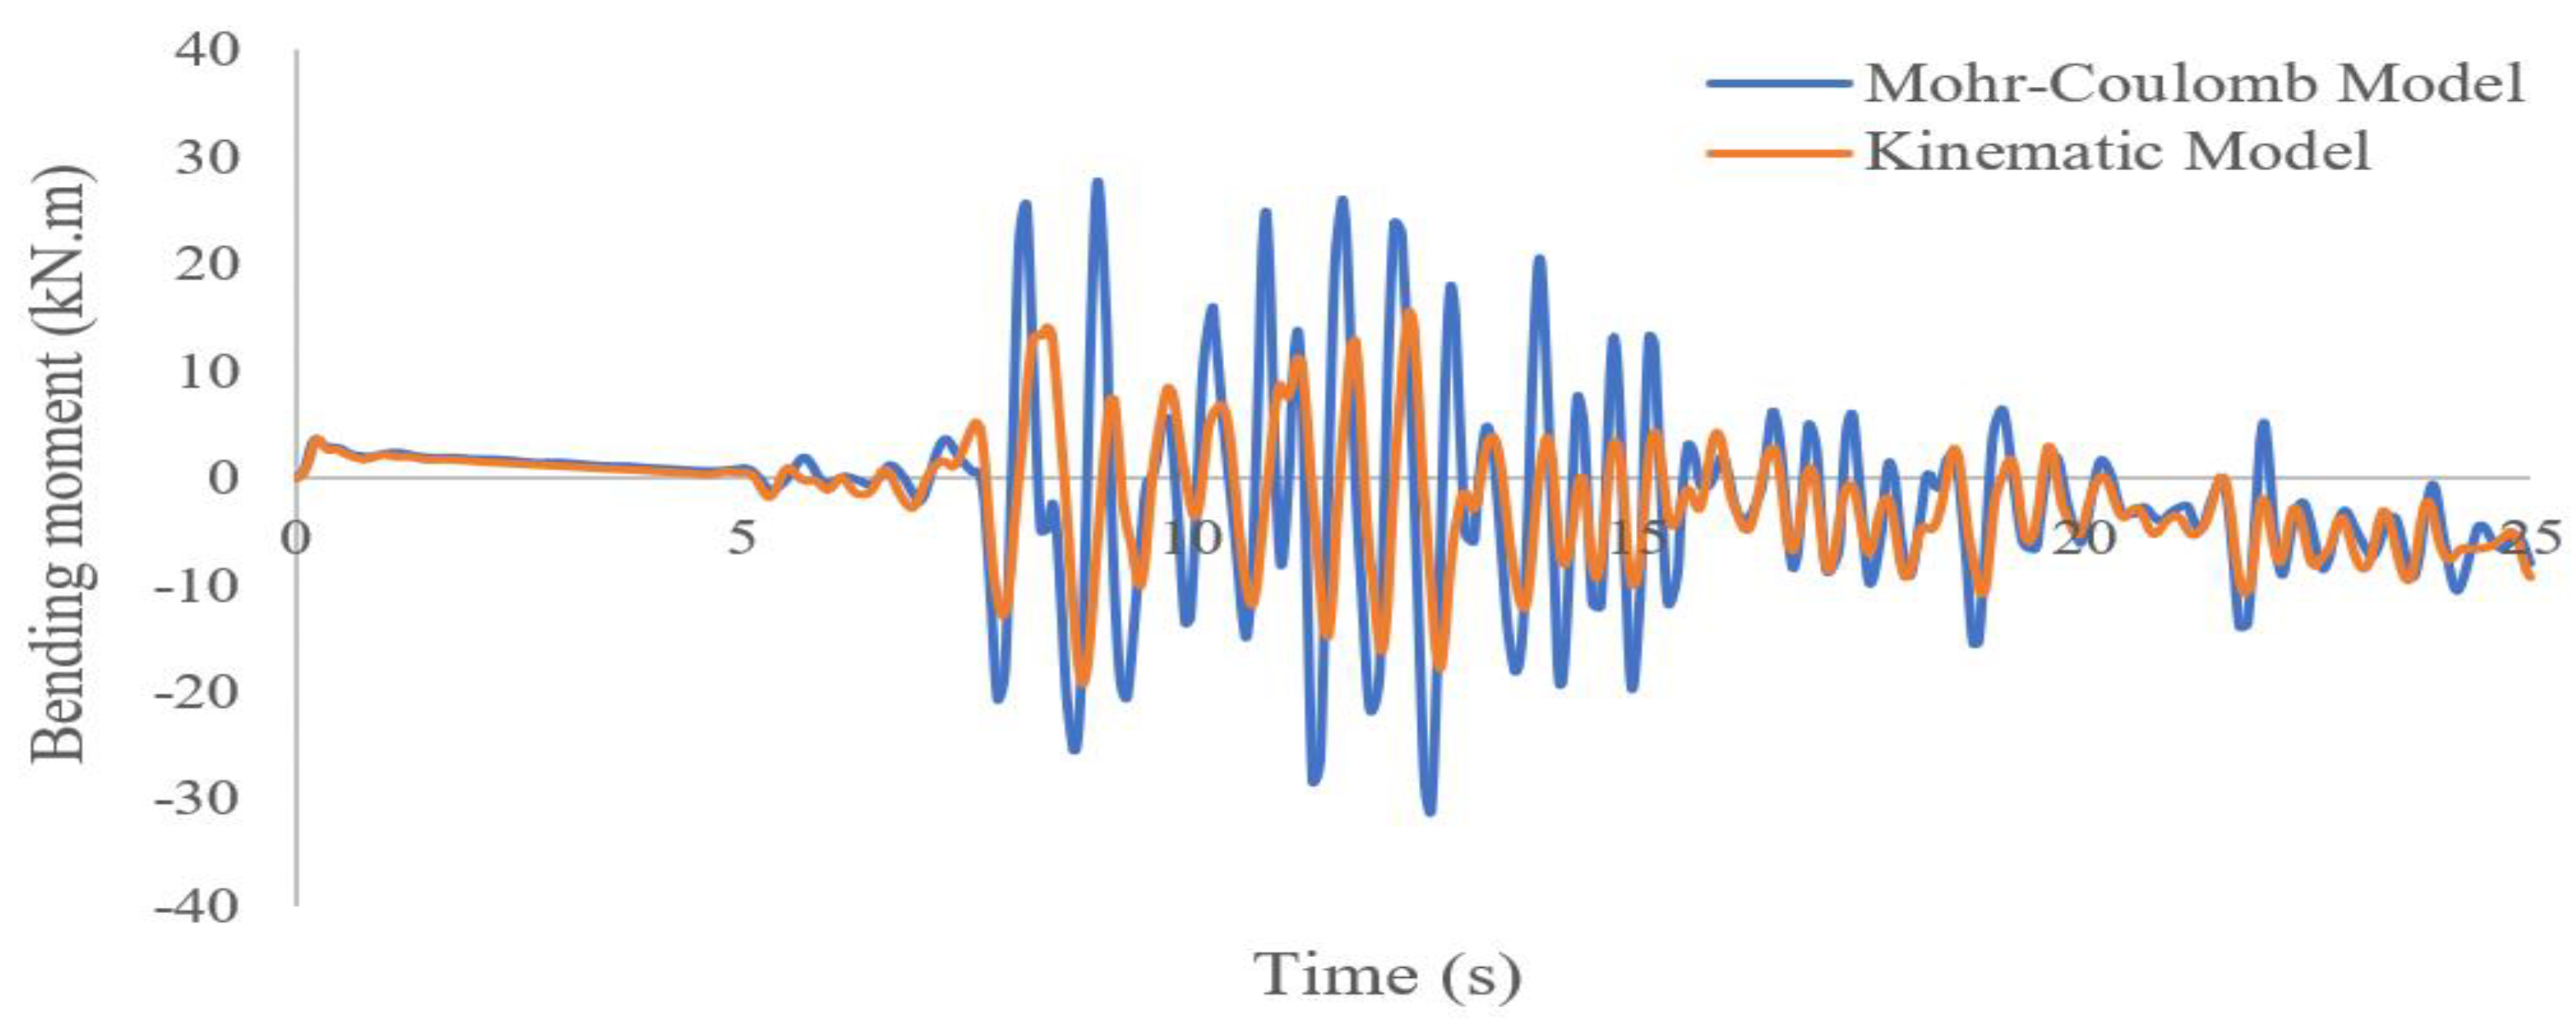
- The Mohr–Coulomb model overestimates the design and it is not economically acceptable. For example, the bending moments created in the tunnel lining are much larger in the Mohr–Coulomb model than in the kinematic model.
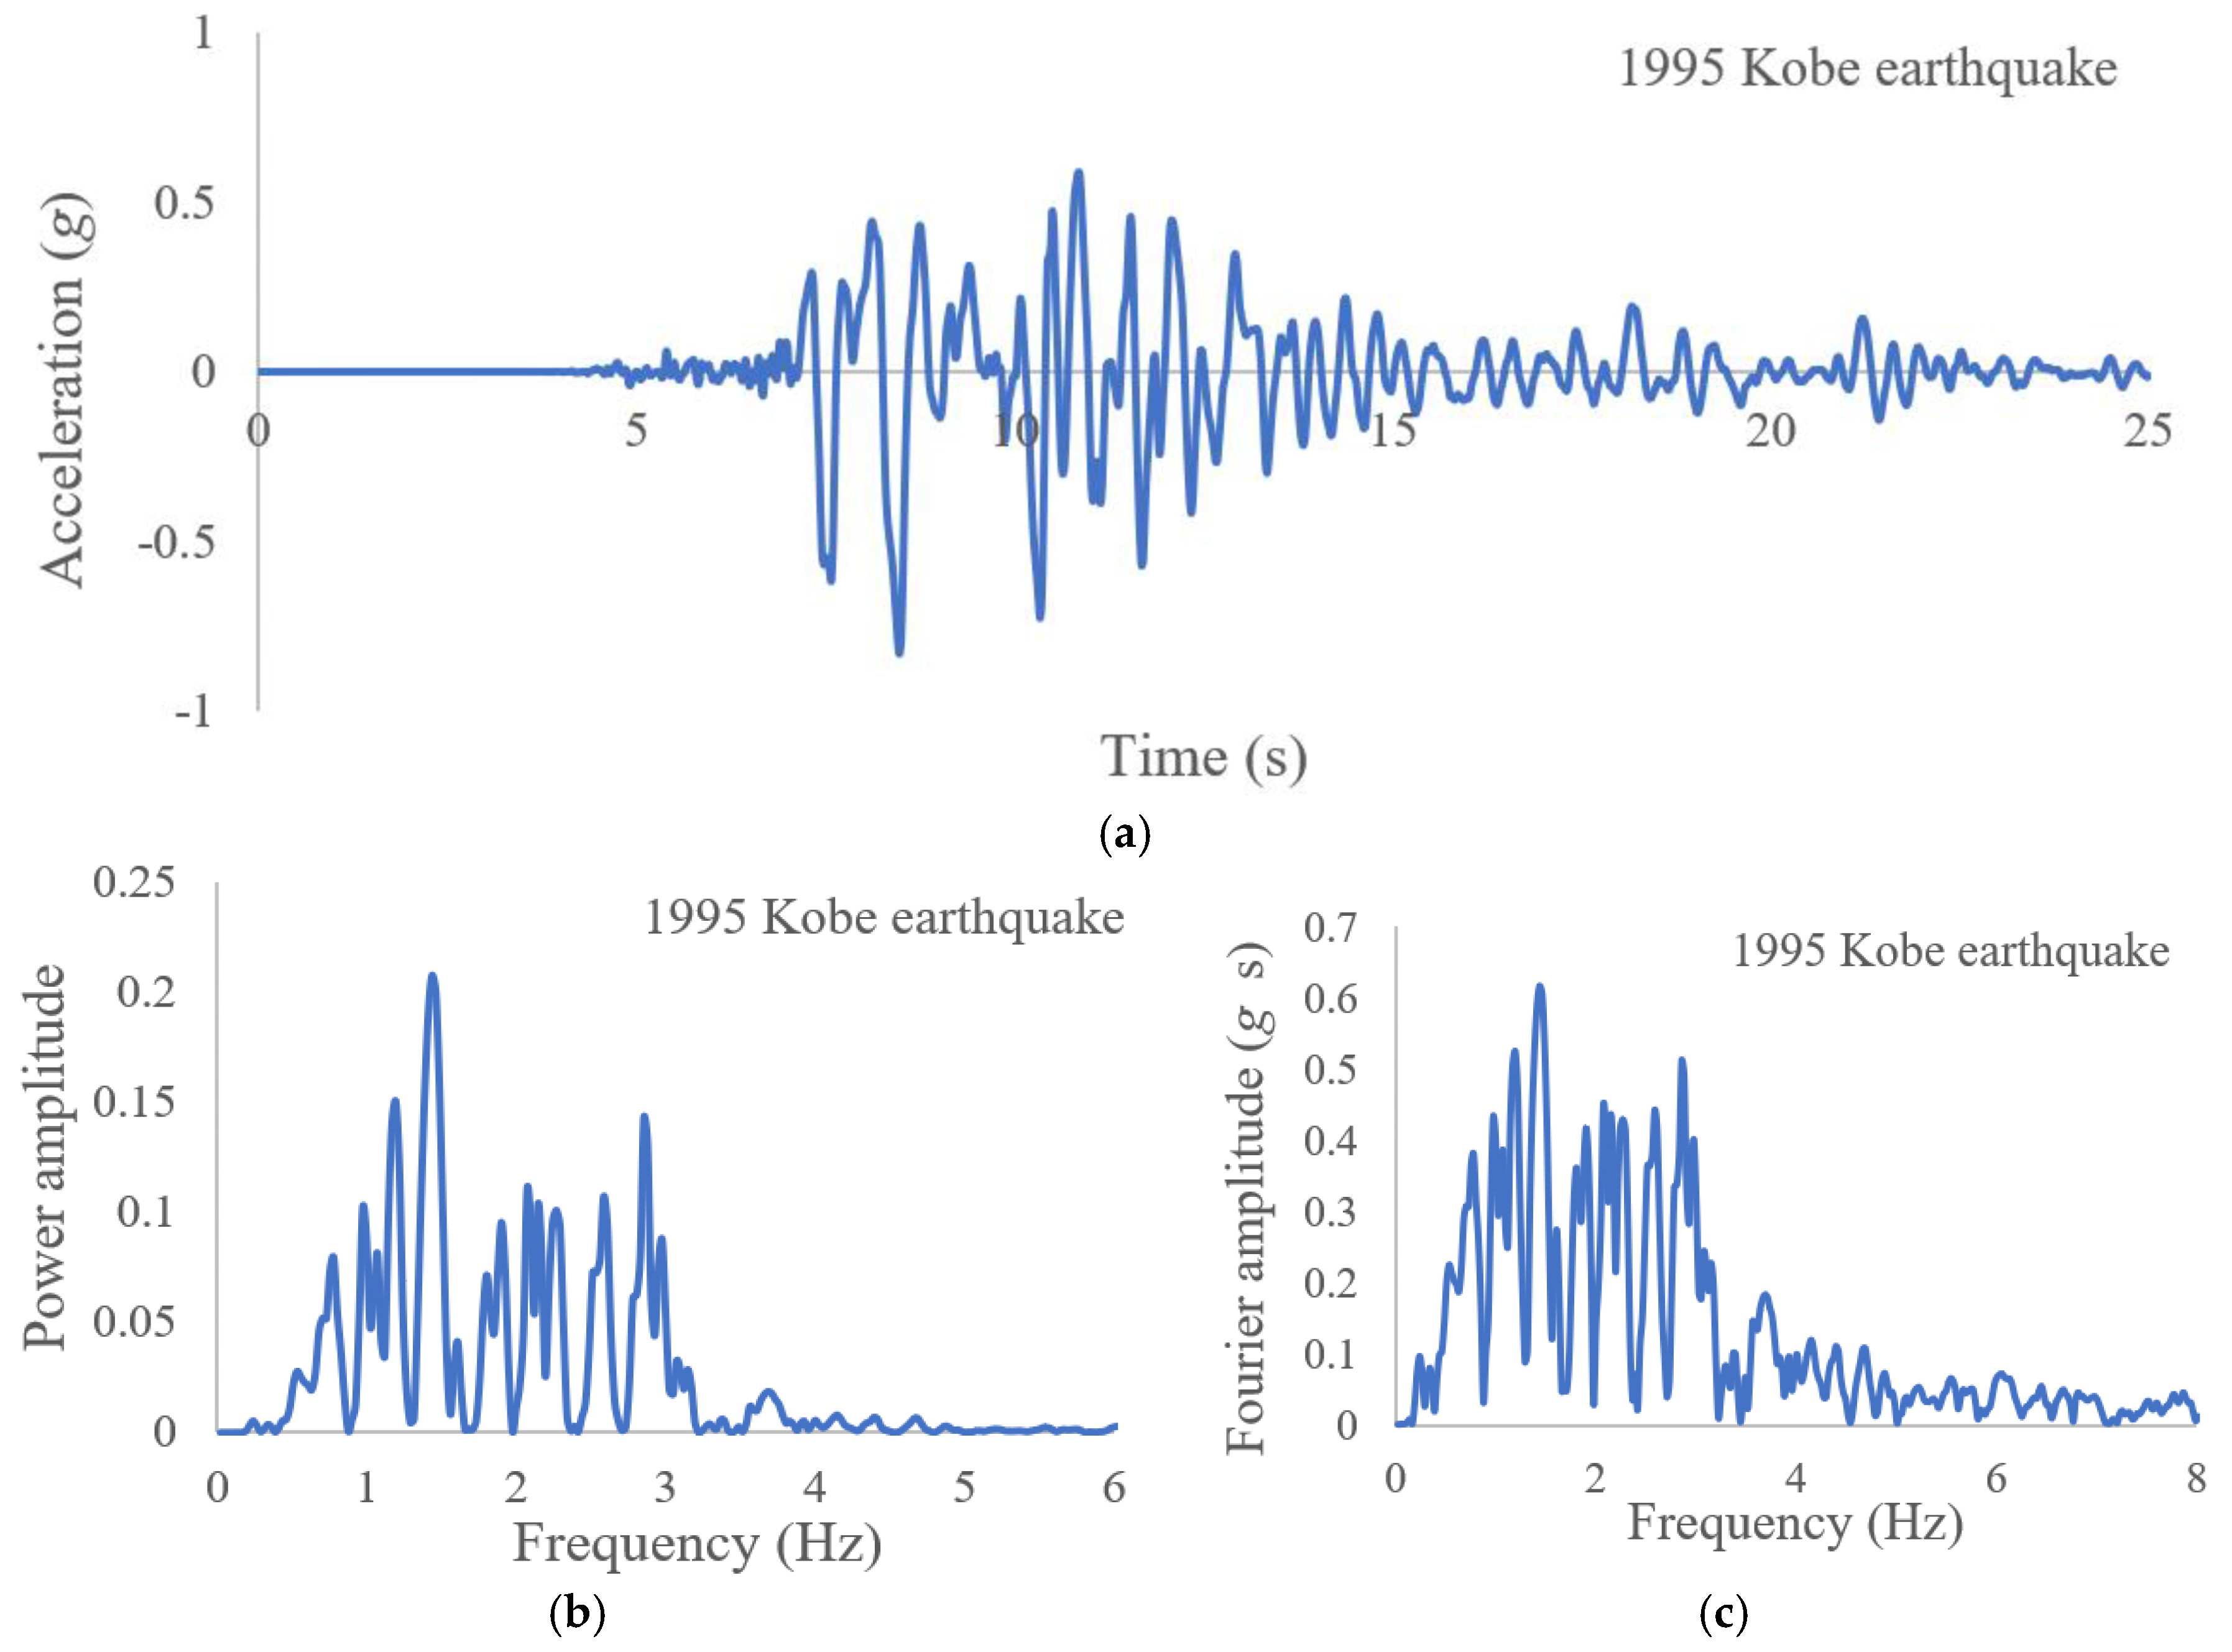
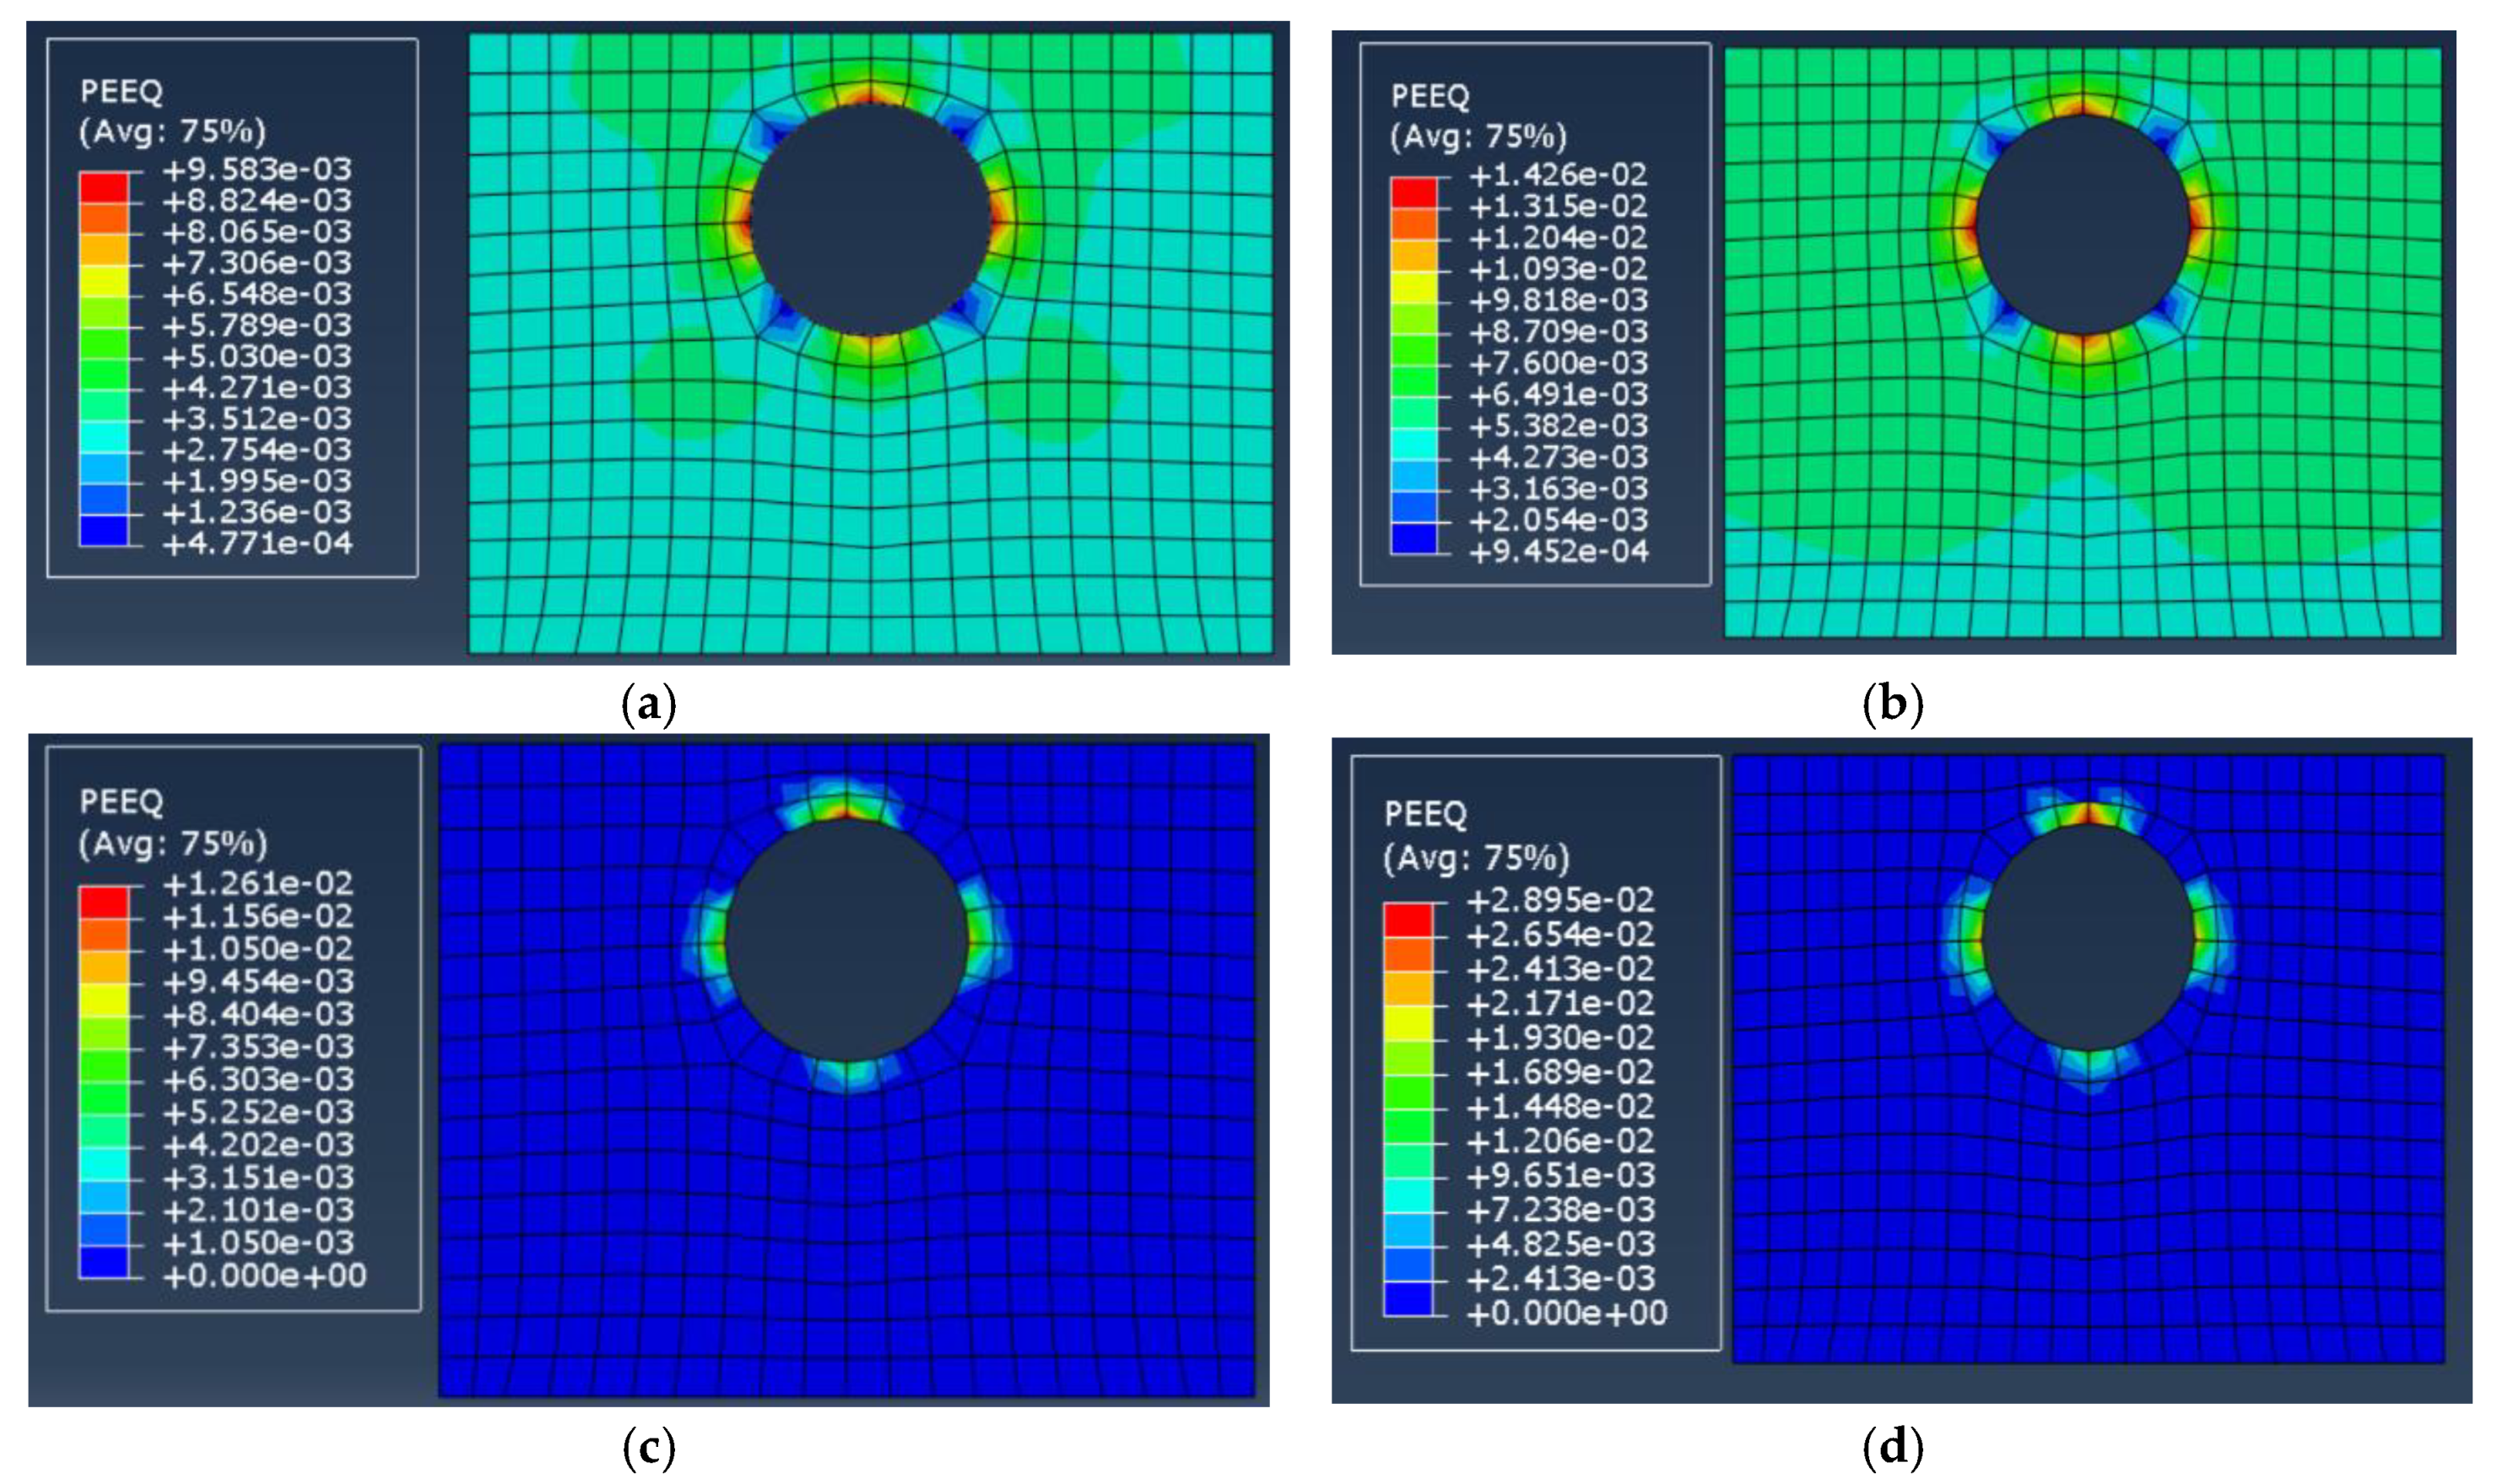
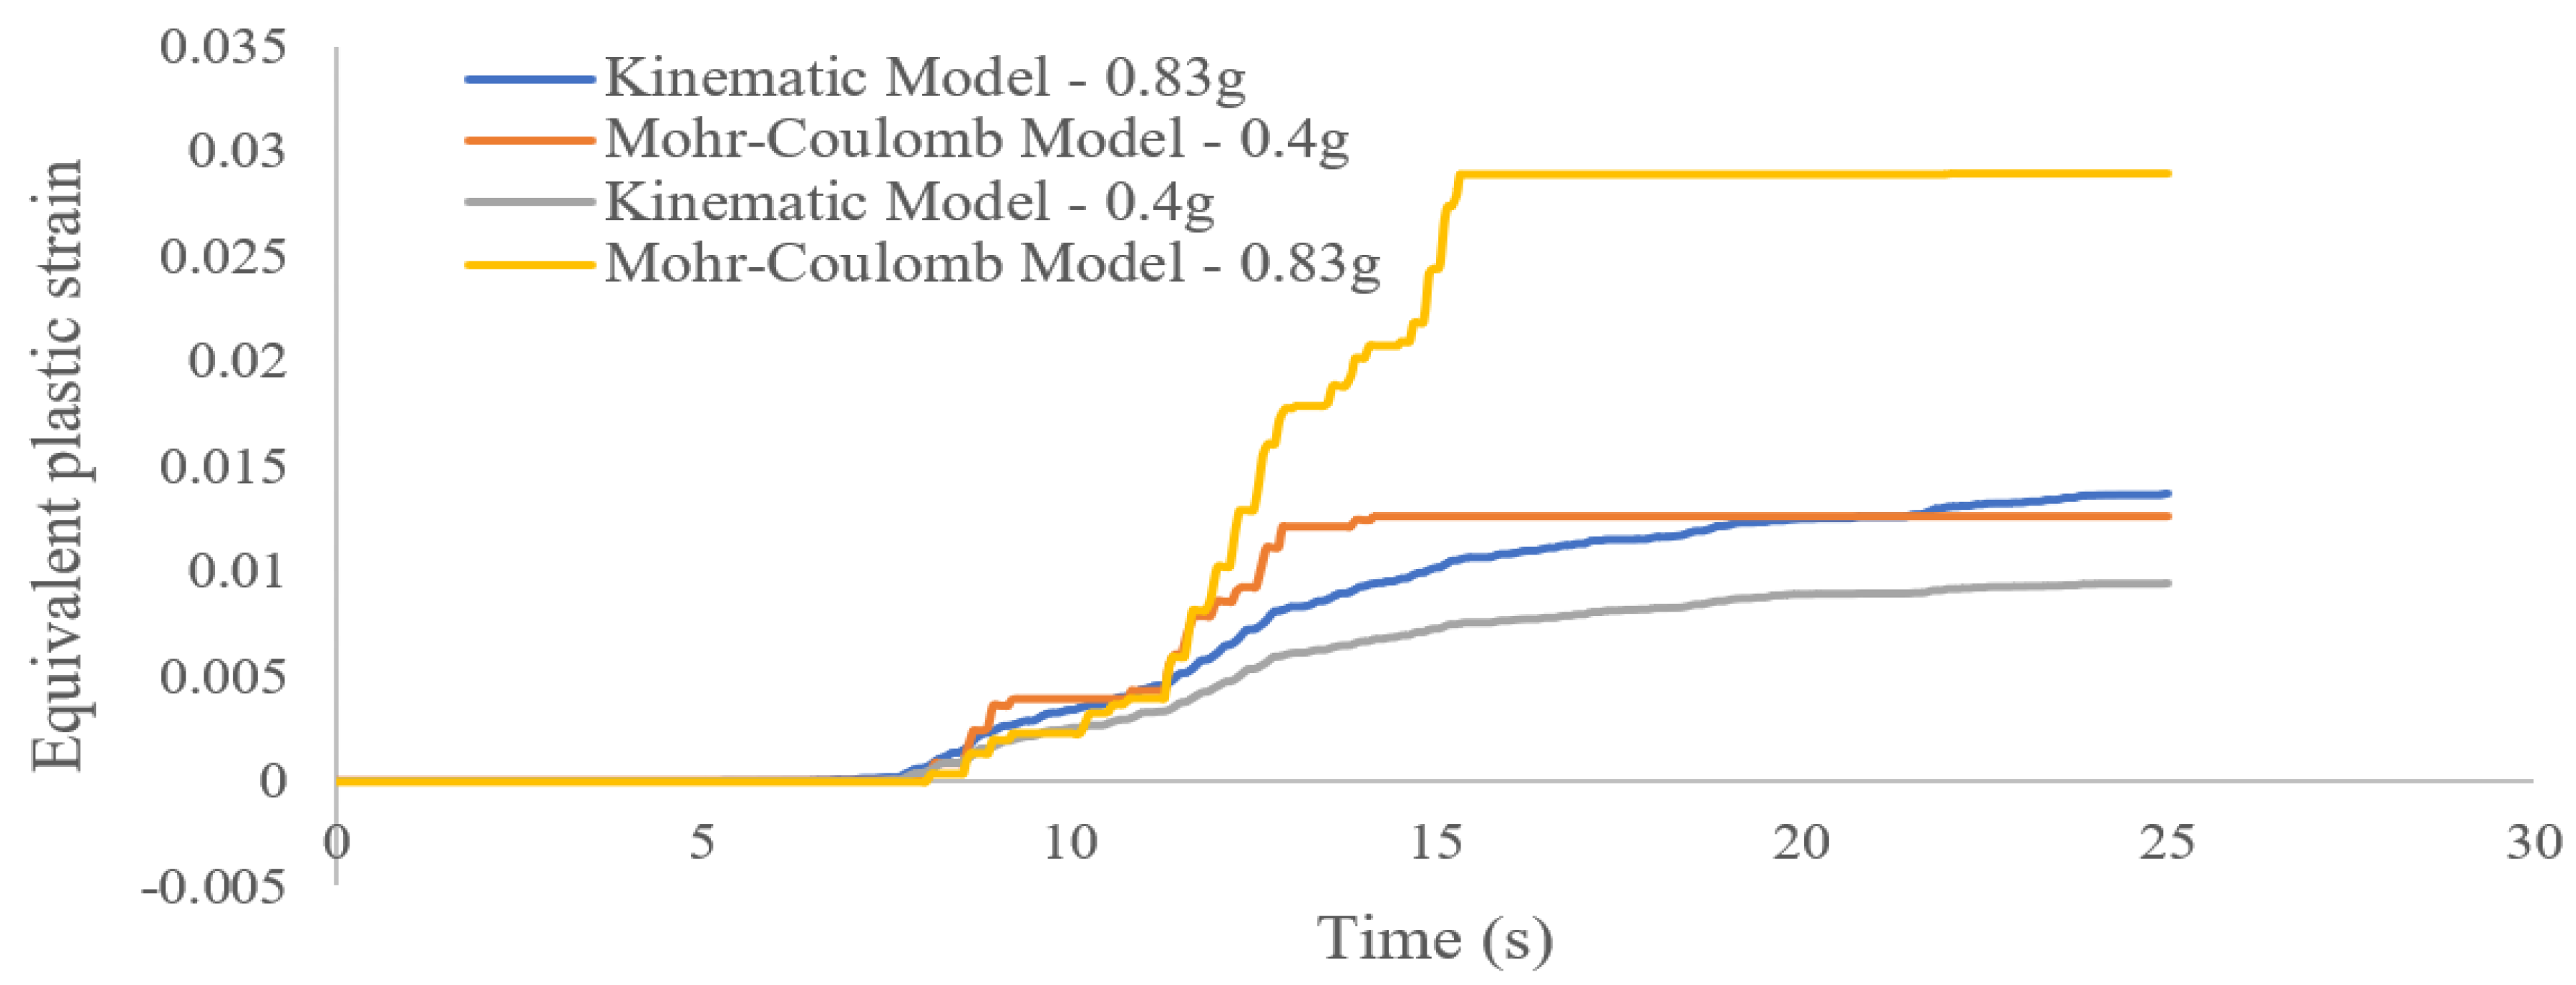
- The plastic strain of soil increases in both the kinematic hardening and Mohr–Coulomb models as the intensity of the earthquake increases from 0.4 to 0.83 g, but this increase is greater in the Mohr–Coulomb model due to its inability to create of hysteresis loops. Therefore, the Mohr–Coulomb model can’t be used to accurately predict the behavior of soil under earthquake loading.
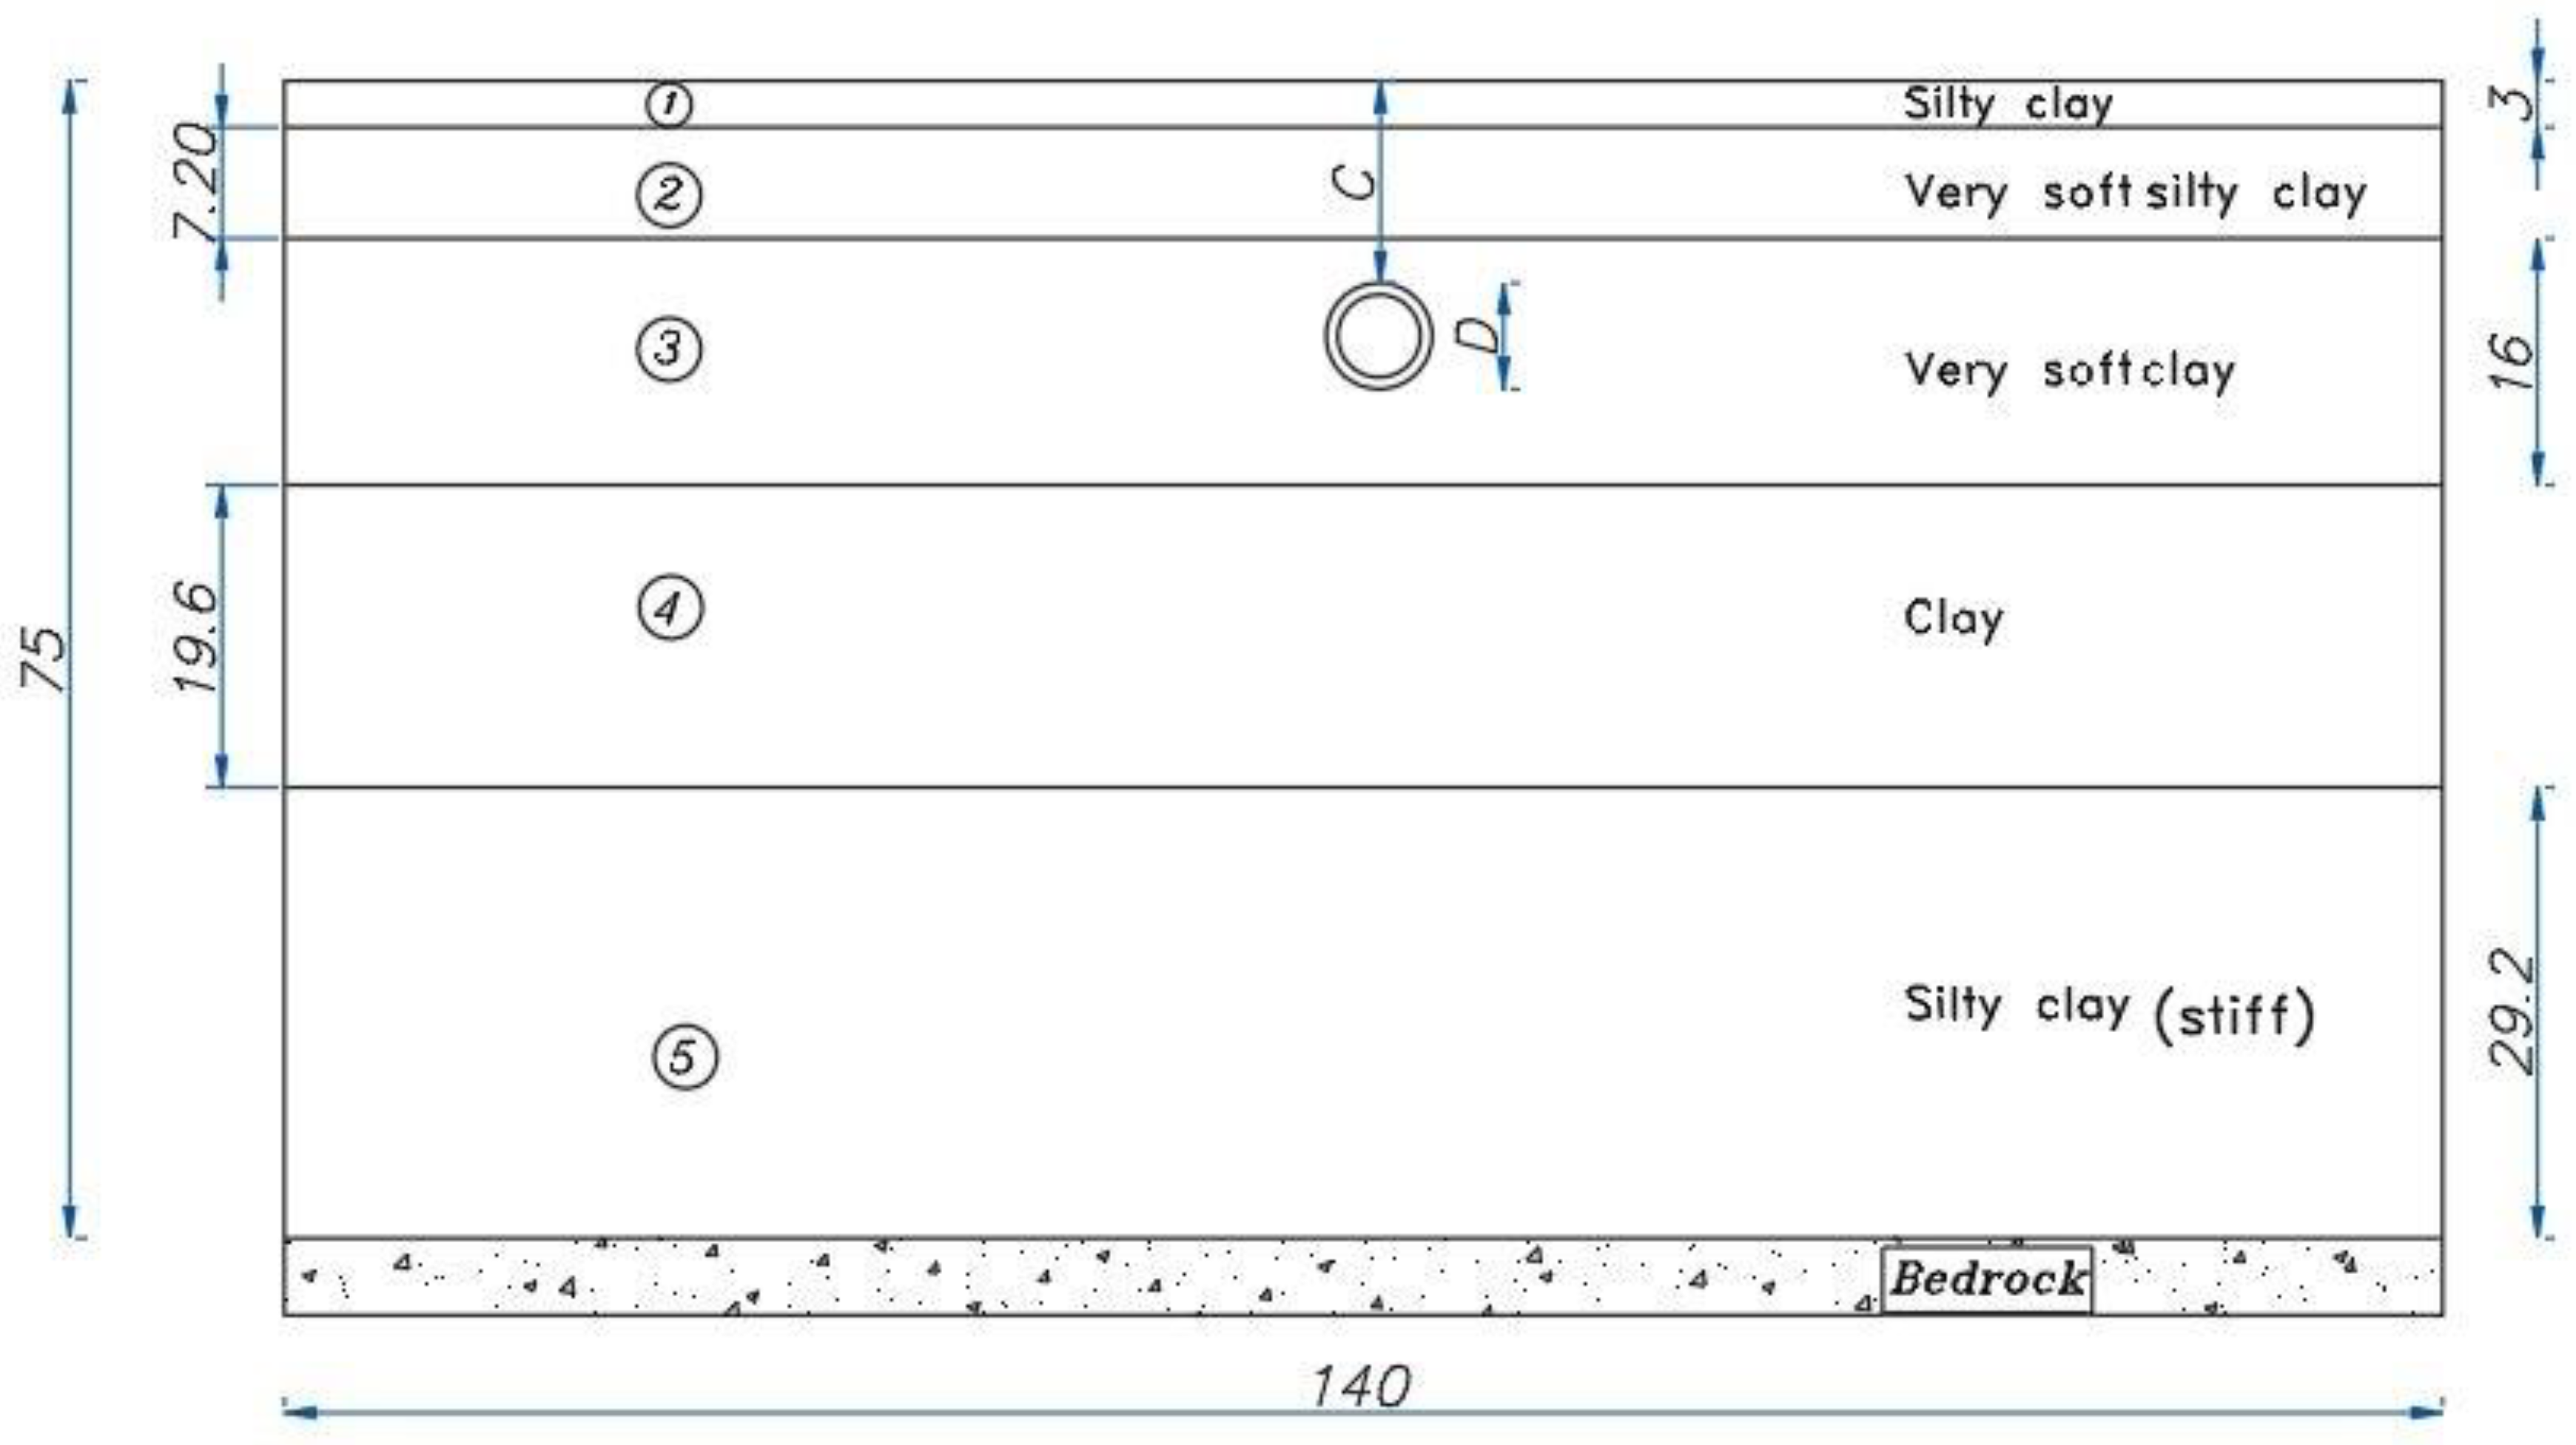
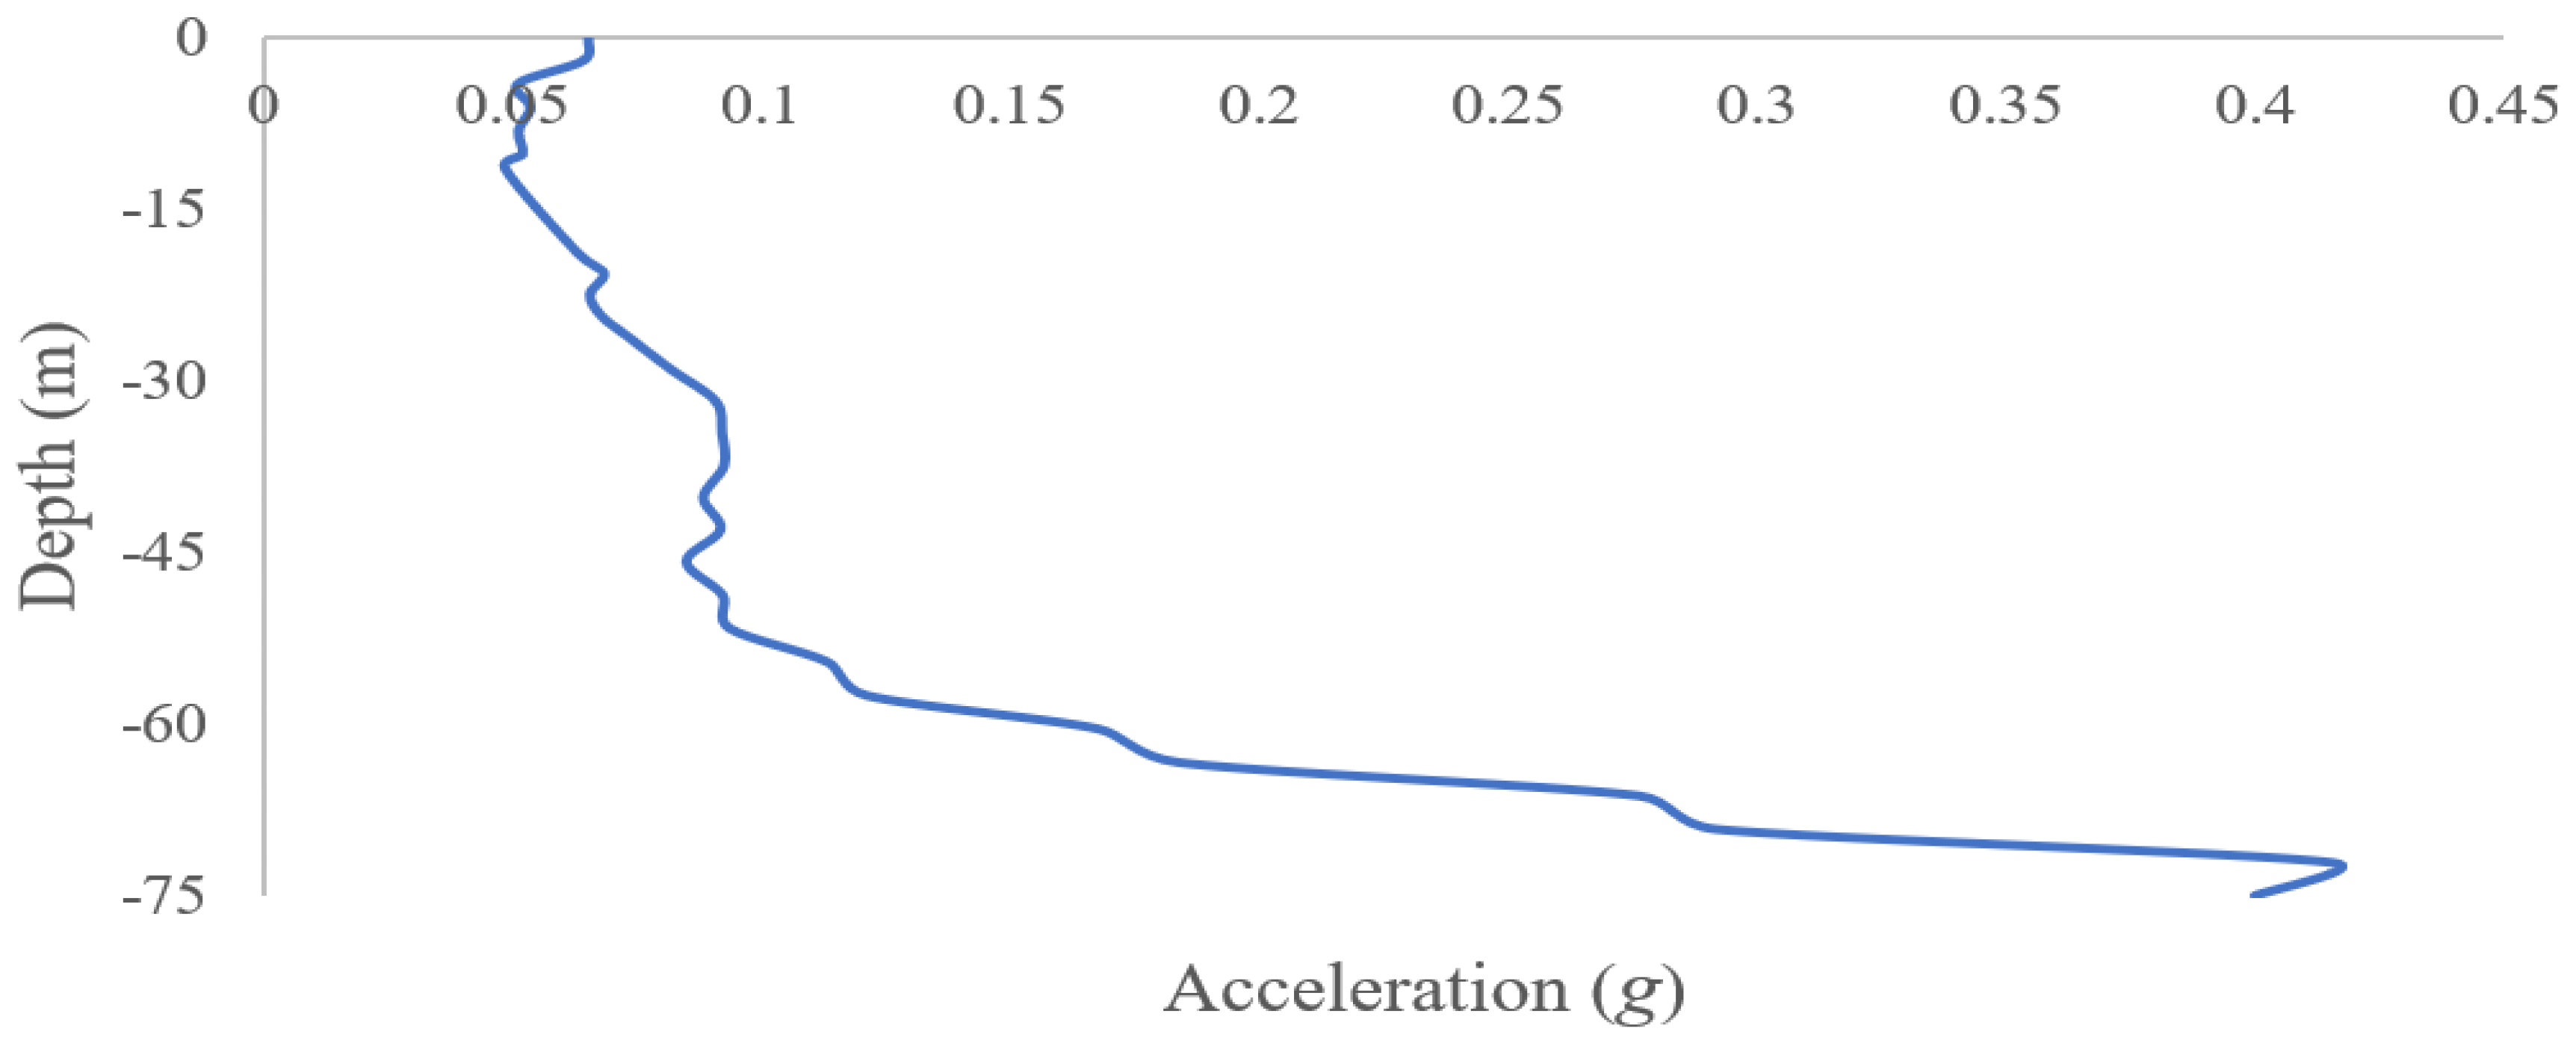
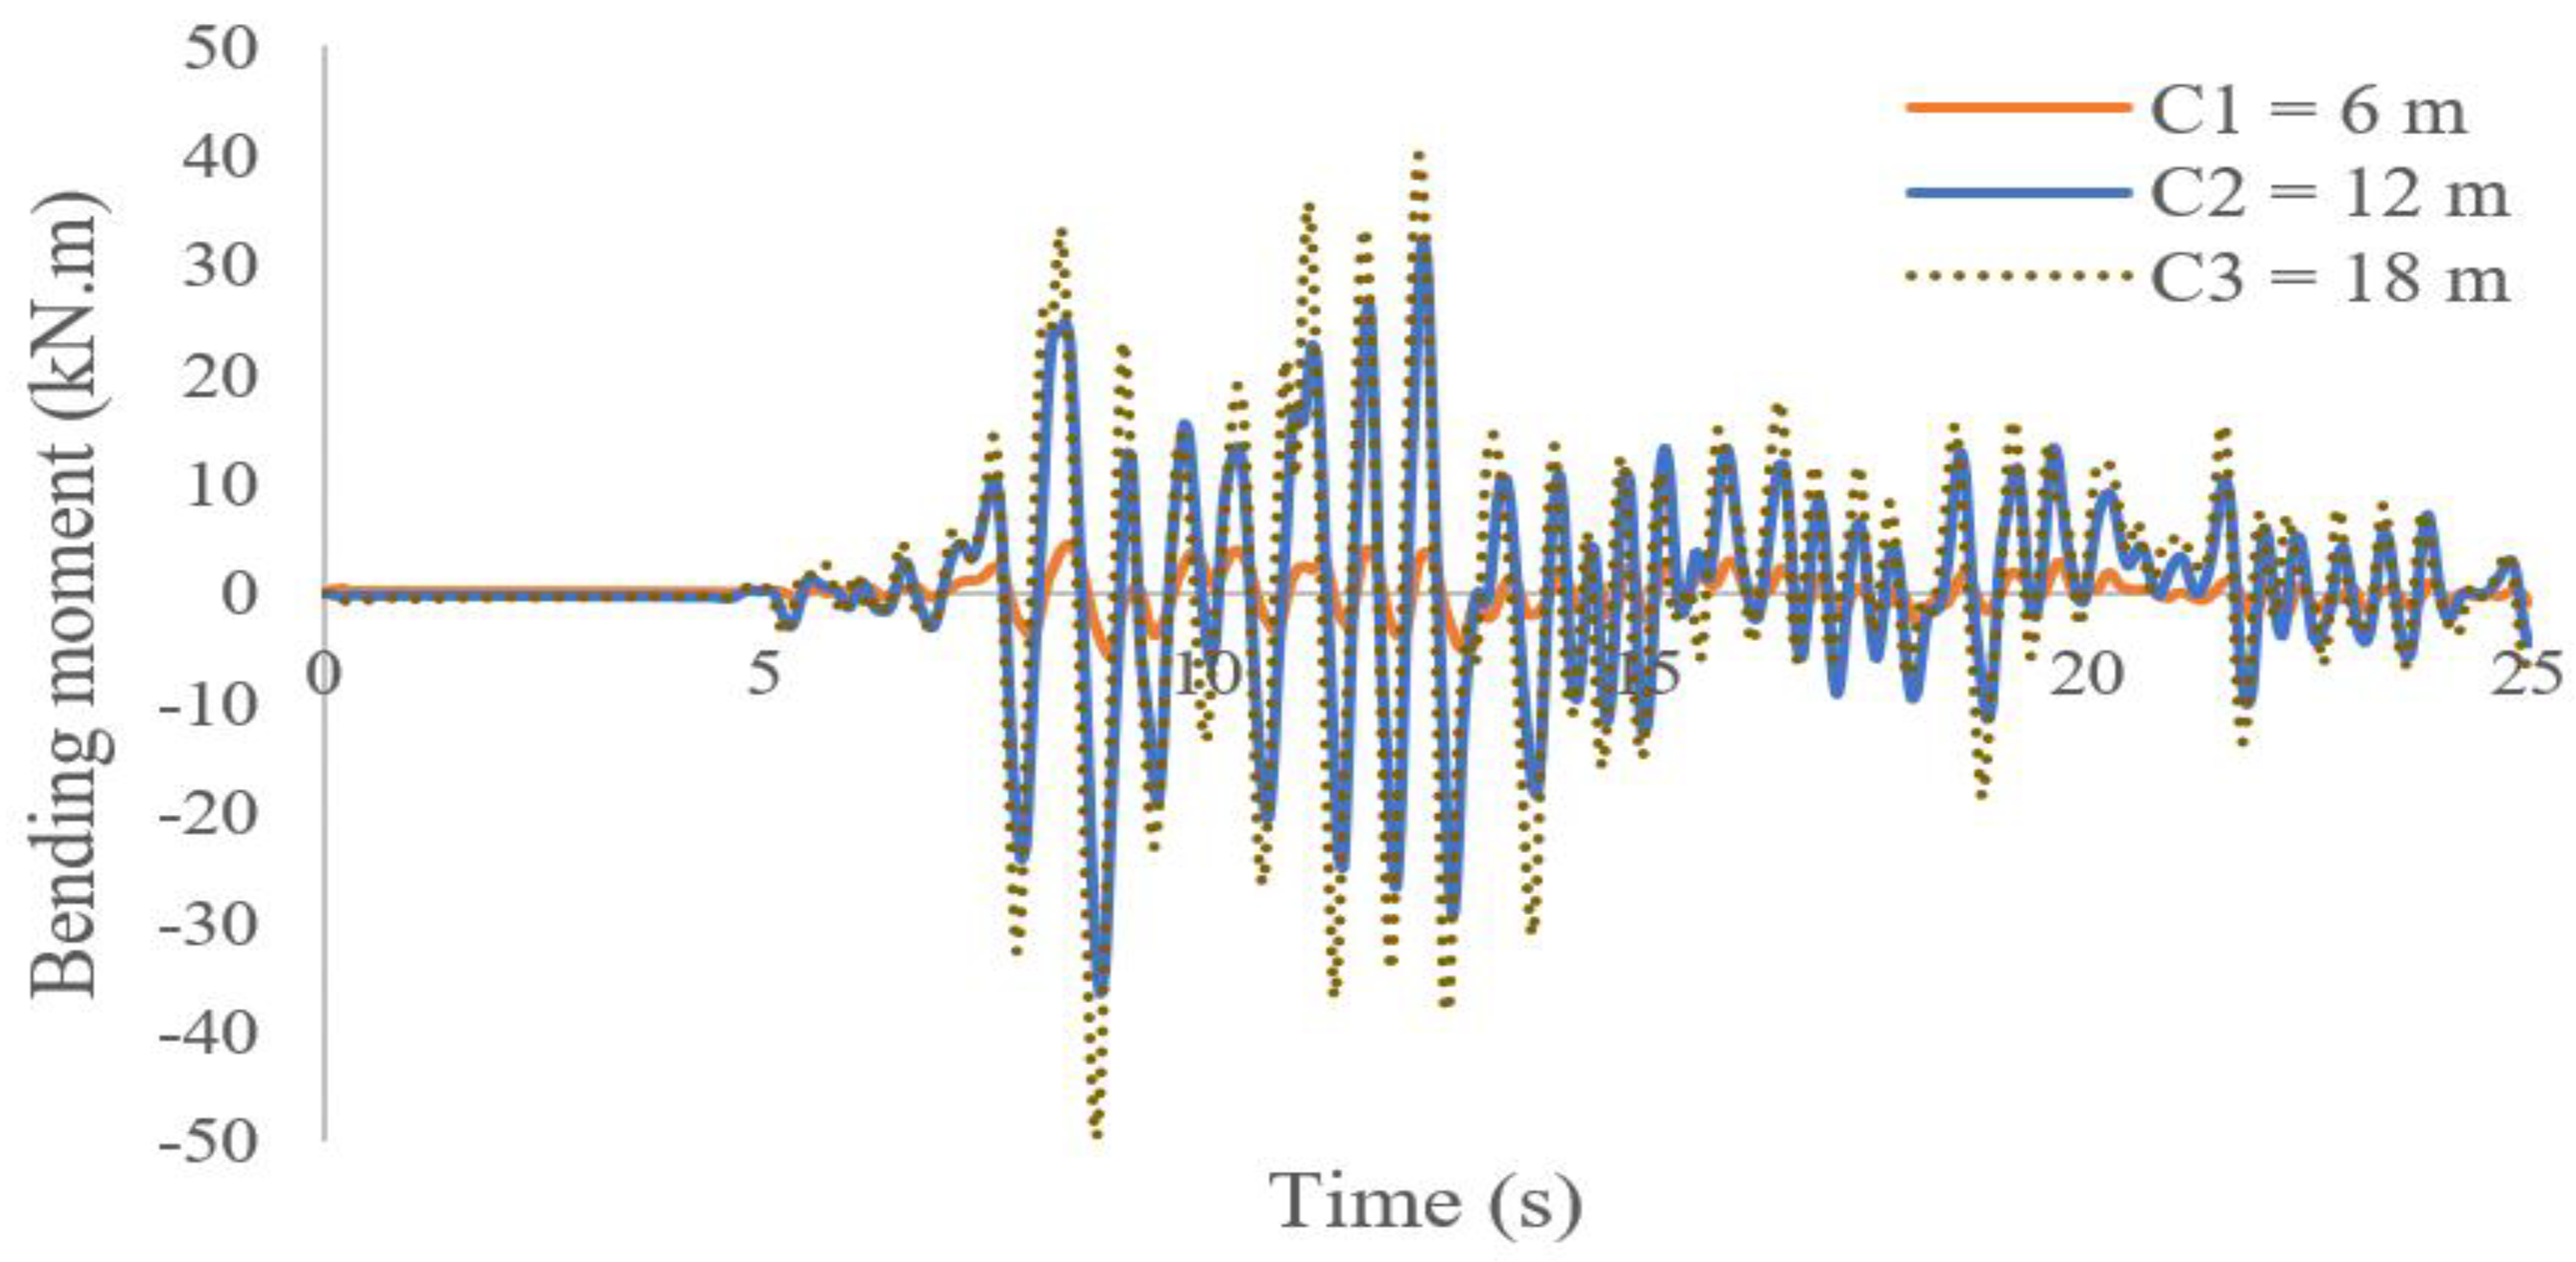
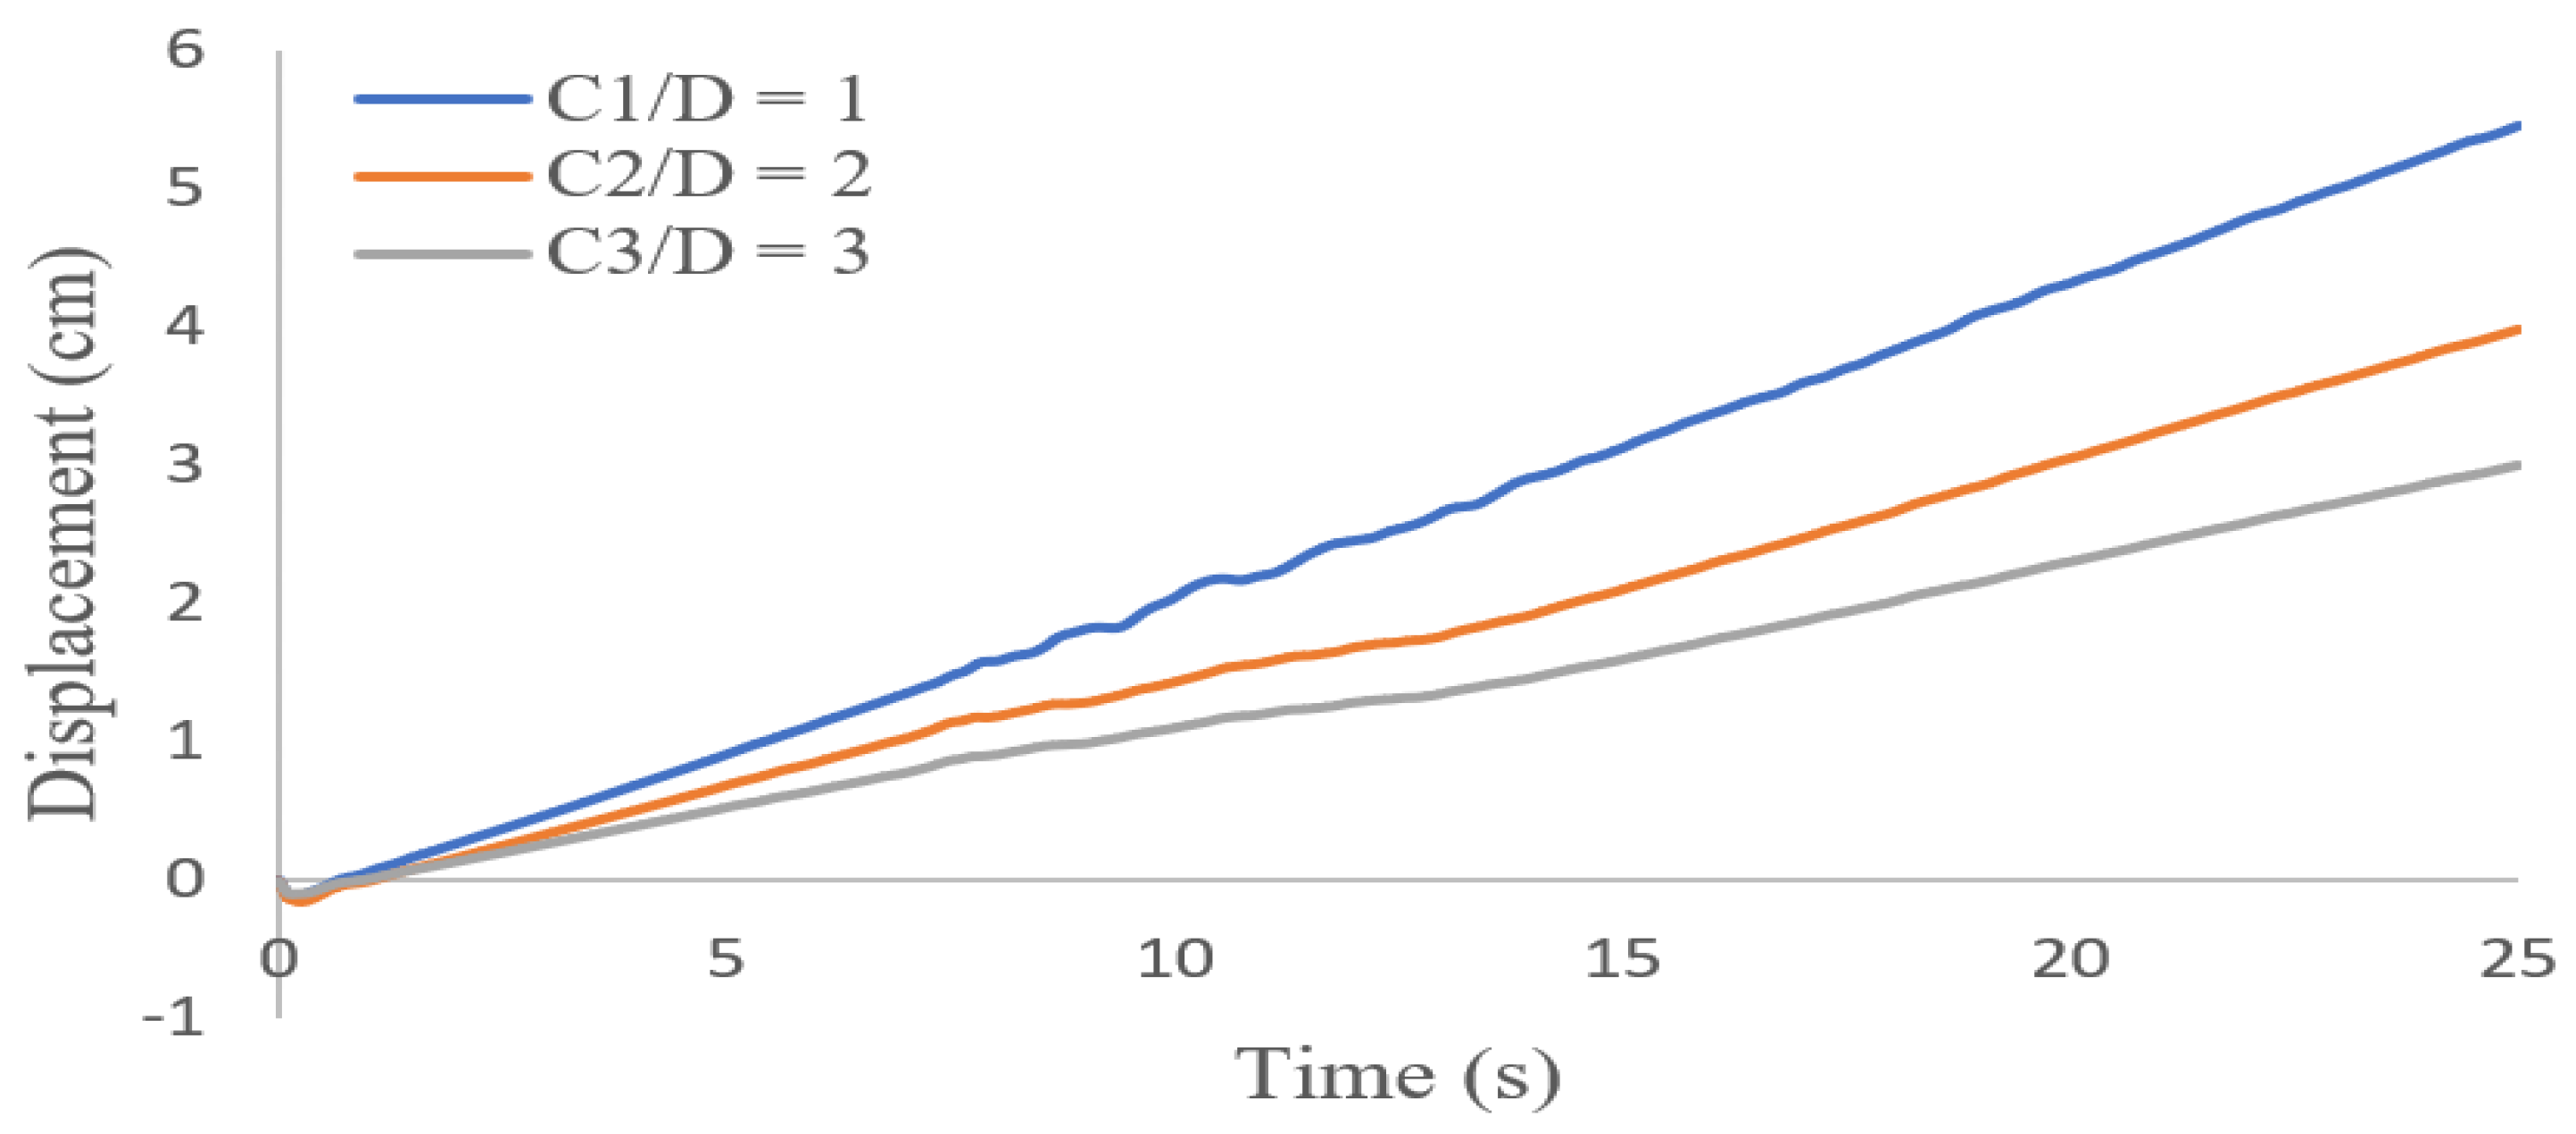
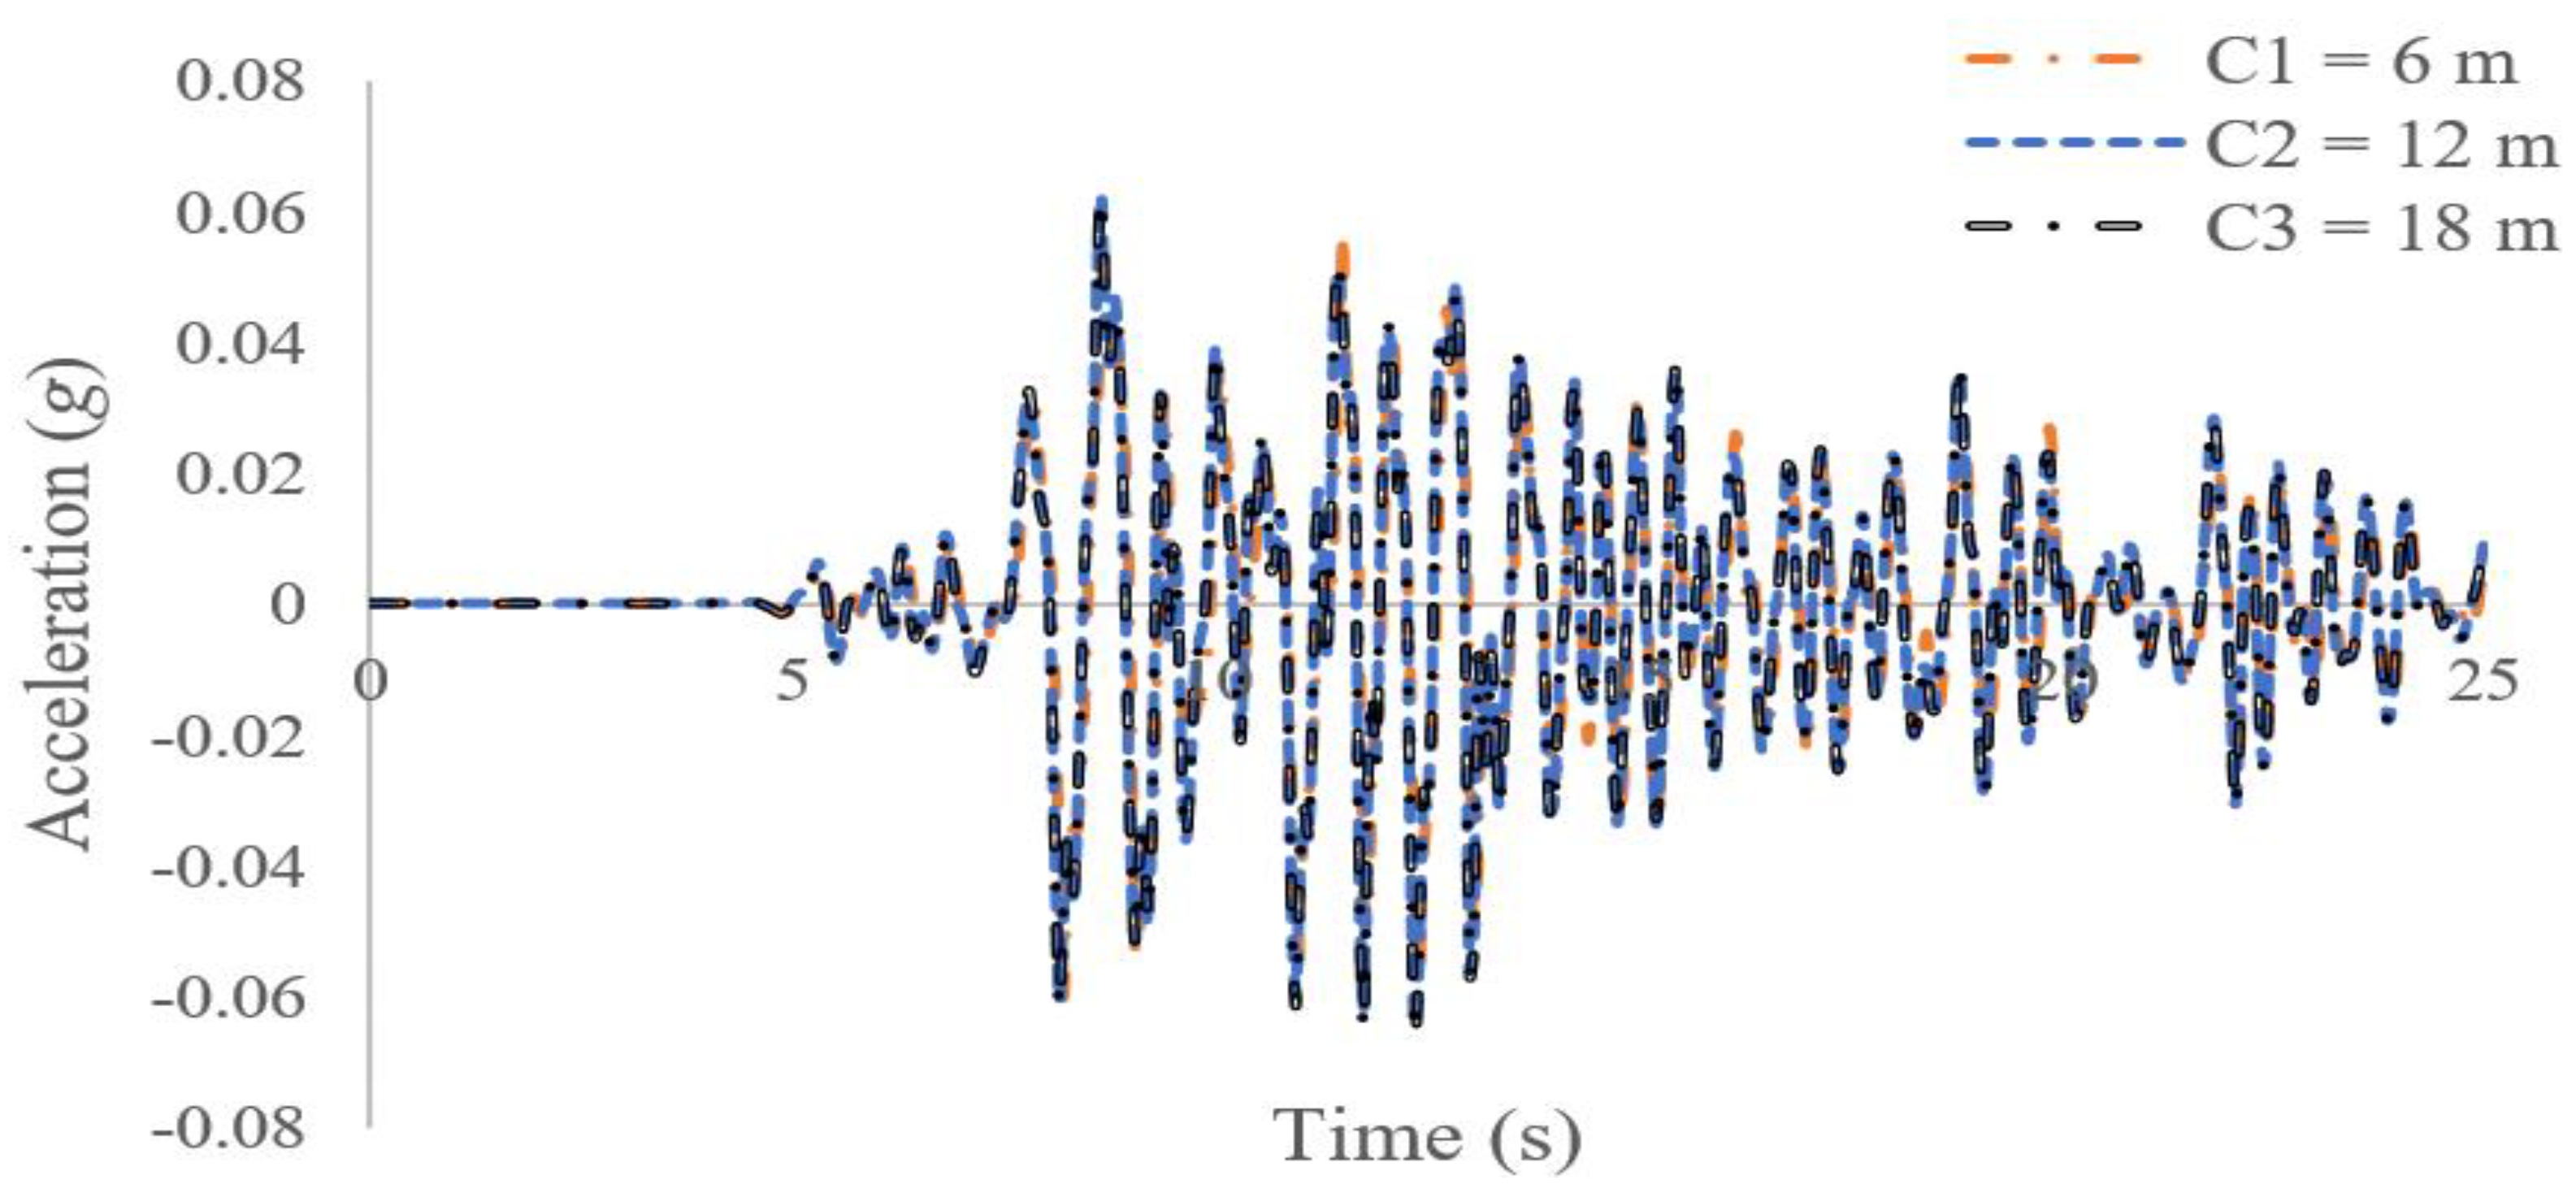
- Changing the depth of a tunnel has no effect on the maximum acceleration response on the soil surface, but as the depth increases, greater forces are applied to the lining, and the bending moment created on the tunnel lining also increases. The lining displacement also decreases with the increasing tunnel depth.
- Another parameter that affects the dynamic behavior of tunnels is the tunnel-lining thickness. The bending moment in the tunnel lining increases with its thickness so that as the dimensions of the tunnel increase, the EI increases and the structure becomes more stiff and able to withstand more forces. The resistance to deformation and the flexibility also increase under dynamic loads.
- The shape of the tunnel dictates the overall response of the soil–tunnel system under dynamic loads. Circular tunnels show better performance than square tunnels against seismic loads. Generally, rounding the corners in square tunnels causes the tunnels to perform better under the imposed loads.
Author Contributions
Funding
Conflicts of Interest
Appendix A
Appendix B
References
- Asheghabadi, M.S.; Ali, Z. Infinite element 1 boundary conditions for dynamic models under. Indian J. Phys. 2019. [Google Scholar]
- Castellanos, A.; Romero, M.; Guzman, N. Near shore seismic movements induced by seaquakes using the boundary element method. Earthq. Eng. Eng. Vib. 2017, 16, 571–585. [Google Scholar] [CrossRef]
- Xu, Q.; Chen, J.; Li, J.; Fan, S. New artificial boundary condition for saturated soil foundations. Earthq. Eng. Eng. Vib. 2012, 11, 139–147. [Google Scholar] [CrossRef]
- Asheghabadi, M.S.; Sahafnia, M.; Bahadori, A.; Bakhshayeshi, N. Seismic behavior of suction caisson for the offshore wind turbine to generate more renewable energy. Int. J. Environ. Sci. Technol. 2019, 16, 2961–2972. [Google Scholar] [CrossRef]
- Dawen, G.; Baipo, Y. A two-step explicit finite element method in time domain for 3D dynamic SSI analysis. Earthq. Eng. Eng. Vib. 2011, 31, 9–17. [Google Scholar]
- Nakamura, S.; Yoshida, N.; Iwatate, T. Damage to Daikai subway station during the 1995 Hyogoken–Nambu earthquake and its investigation. Doboku Gakkai Ronbunshu J-Stage 1996, 537, 287–295. [Google Scholar]
- Yoshida, N. Damage to subway station during the 1995 Hyogoken-Nambu (Kobe) earthquake. In Earthquake Geotechnical Case Histories for Performance-Based Design; Kokusho, T., Ed.; CRC Press: Tokyo, Japan, 2009; pp. 373–389. [Google Scholar]
- Ueng, T.S.; Lin, M.L.; Chen, M.H. Some geotechnical aspects of 1999 Chi-Chi, Taiwan earthquake. In Proceedings of the Fourth International Conference on Recent Advances in Geotechnical Earthquake Engineering and Soil Dynamics SPL-10. 1, San Diego, CA, USA, 26–31 March 2001; pp. 1–5. [Google Scholar]
- Wang, W.; Ren, Q. General introduction to the effect of active fault on deeply buried tunnel. Earthq. Eng. Eng. Vib. 2006, 26, 175–180. [Google Scholar]
- Kontoe, S.; Zdravkovic, L.; Potts, D.M.; Menkiti, C.O. On the relative merits of simple and advanced constitutive models in dynamic analysis of tunnels. Geotechnique 2011, 61, 815–829. [Google Scholar] [CrossRef]
- O’Rourke, T.D.; Goh, S.H.; Menkiti, C.O.; Mair, R.J. Highway tunnel performance during the 1999 Düzce earthquake. In Proceedings of the 15th International Conference on Soil Mechanics and Geotechnical Engineering, Istanbul, Turkey, 27–31 August 2001. [Google Scholar]
- Liu, Y.; Quek, E.J.; Lee, F.H. Translation random field with marginal beta distribution in modeling material properties. Struct. Saf. 2016, 61, 57–66. [Google Scholar] [CrossRef]
- Matinmanesh, H.; Saleh Asheghabadi, M. Seismic analysis on soil-structure interaction of buildings over sandy soil. In Proceedings of the The Twelfth East Asia-Pacific Conference on Structural Engineering and Construction (EASEC-12), Hong Kong, China, 26–28 January 2011; pp. 24–26. [Google Scholar]
- Banerjee, S.; Goh, S.H.; Lee, F.H. Earthquake-induced bending moment in fixed-head piles in soft clay. Ge´otechnique 2014, 64, 431–446. [Google Scholar] [CrossRef]
- Mayoral, J.M.; Alberto, Y.; Mendoza, M.J.; Romo, M.P. Seismic response of an urban bridge-support system in soft clay. Soil Dyn. Earthq. Eng. 2009, 29, 925–938. [Google Scholar] [CrossRef]
- Saleh Asheghabadi, M.; Rahgozar, M.A. Finite element seismic analysis of soil–tunnel interactions in clay soils. Iran J. Sci. Technol. Trans. Civ. Eng. 2019, 43, 835–849. [Google Scholar] [CrossRef]
- Asheghabadi, M.S.; Matinmanesh, H. Finite Element Seismic Analysis of Cylindrical Tunnel in Sandy Soils with Consideration of Soil-Tunnel Interaction. Procedia Eng. 2011, 14, 3162–3169. [Google Scholar] [CrossRef]
- Zhang, L.; Liu, Y. Numerical investigations on the seismic response of a subway tunnel embedded in spatially random clays. Undergr. Space 2020, 5, 43–52. [Google Scholar] [CrossRef]
- Power, M.; Rosidi, D.; Kaneshiro, J.; Gilstrap, S.; Chiou, S.J. Summary and Evaluation of Procedures for the Seismic Design of Tunnels; Final Report for Task 112-d-5. 3(c); National Center for Earthquake Engineering Research: Buffalo, NY, USA, 1998. [Google Scholar]
- Li, Y.; Zhao, M.; Xu, C.-S.; Du, X.L.; Li, Z. Earthquake input for finite element analysis of soil-structure interaction on rigid bedrock. Tunn. Undergr. Space Technol. 2018, 79, 250–262. [Google Scholar] [CrossRef]
- Lanzano, G.; Bilotta, E.; Russo, G.; Silvestri, F. Experimental and numerical study on circular tunnels under seismic loading. Eur. J. Environ. Civ. Eng. 2015, 19, 539–563. [Google Scholar] [CrossRef]
- Tsinidis, G.; Rovithis, E.; Pitilakis, K.; Chazelas, J.L. Seismic response of box-type tunnels in soft soil: Experimental and numerical investigation. Tunn. Undergr. Space Technol. 2016, 59, 199–214. [Google Scholar] [CrossRef]
- Ulgen, D.; Saglam, S.; Ozkan, M.Y. Dynamic response of a flexible rectangular underground structure in sand: Centrifuge modeling. Bull. Earthq. Eng. 2015, 13, 2547–2566. [Google Scholar] [CrossRef]
- Chen, G.; Wang, Z.; Zuo, X.; Du, X.; Gao, H. Shaking table test on the seismic failure characteristics of a subway station structure on liquefiable ground. Earthq. Eng. Struct. Dyn. 2013, 42, 1489–1507. [Google Scholar] [CrossRef]
- Debiasi, E.; Gajo, A.; Zonta, D. On the seismic response of shallow-buried rectangular structures. Tunn. Undergr. Space Technol. 2013, 38, 99–113. [Google Scholar] [CrossRef]
- Patil, M.; Choudhury, D.; Ranjith, P.G.; Zhao, J. A numerical study on effects of dynamic input motion on response of tunnel-soil system. In Proceedings of the 16th World Conference on Earthquake Engineering (16th WCEE 2017), Santiago, Chile, 9–13 January 2017; p. 3313. [Google Scholar]
- Bao, X.; Xia, Z.; Ye, G.; Fu, Y.; Su, D. Numerical analysis on the seismic behavior of a large metro subway tunnel in liquefiable ground. Tunn. Undergr. Space Technol. 2017, 66, 91–106. [Google Scholar] [CrossRef]
- Cremer, C.; Pecker, A.; Davenne, L. Cyclic macro-element for soil-structure interaction: Material and geometrical non-linearities. Int. J. Numer. Anal. Methods Geomech. 2001, 25, 1257–1284. [Google Scholar] [CrossRef]
- Frederick, C.O.; Armstrong, P.J. A Mathematical Representation of the Multi Axial Bauschinger Effect; CEGB Report RD/B/N 731; Central Electricity Generating Board, Materials at High Temperatures; Elsevier: Amsterdam, The Netherlands, 2007; Volume 24, pp. 1–23. [Google Scholar] [CrossRef]
- Chaboche, J.L. A review of some plasticity and viscoplasticity constitutive theories. Int. J. Plast. 2008, 24, 1642–1693. [Google Scholar] [CrossRef]
- Zakavi, S.J.; Zehsaz, M.; Eslami, M.R. The ratchetting behavior of pressurized plain pipework subjected to cyclic bending moment with the combined hardening model. Nucl. Eng. Des. 2010, 240, 726–737. [Google Scholar] [CrossRef]
- Chaboche, J.L.; Nouailhas, D. Constitutive modeling of ratcheting effects-part I: Experimental facts and properties of the classical models. J. Eng. Mater. Technol. Trans. Asme 1998, 111, 384. [Google Scholar] [CrossRef]
- Anastasopoulos, I.; Gelagoti, F.; Kourkoulis, R.; Gazetas, G. Simplified constitutive model for simulation of cyclic response of shallow foundations: Validation against laboratory tests. J. Geotech. Geoenviron. Eng. 2011, 137, 1154–1168. [Google Scholar] [CrossRef]
- Patil, M.; Choudhury, D.; Ranjith, P.G.; Zhao, J. Behavior of shallow tunnel in soft soil under seismic conditions. Tunn. Undergr. Space Technol. 2018, 82, 30–38. [Google Scholar] [CrossRef]
- Lemaitre, J.; Chaboche, J.L. Mechanics of Solid Materials; Cambridge University Press, 1994; 584p, ISBN 0521477581. [Google Scholar]
- Smith, C.; Kanvinde, A.; Deierlein, G. Calibration of Continuum Cyclic Constitutive Models for Structural Steel Using Particle Swarm Optimization. J. Eng. Mech. 2017, 143, 04017012. [Google Scholar] [CrossRef]
- Ishibashi, I.; Zhang, X. Unified dynamic shear moduli and damping ratios of sand and clay. Soils Found. 1993, 33, 182. [Google Scholar] [CrossRef]
- Wichtmann, T.; Triantafyllidis, T. Monotonic and cyclic tests on kaolin: A database for the development, calibration and verification of constitutive models for cohesive soils with focus to cyclic loading. Acta Geotech. 2018, 13, 1103–1128. [Google Scholar] [CrossRef]
- Stokoe, K.H.; Darendeli, M.B.; Andrus, R.D.; Brown, L.T. Dynamic soil properties: Laboratory, field and correlation studies. In Proceedings of the 2nd International Conference on Earthquake Geotechnical Engineering, Lisboa, Portugal, 21–25 June 1999; Volume 3, pp. 811–845. [Google Scholar]


| Layer No. | Soil Type | (MPa) | (MPa) | (kPa) | (kPa) | (MPa) | ||
|---|---|---|---|---|---|---|---|---|
| 1 (top) | Silty clay | 28.38 | 84.58 | 51.79 | 5.18 | 84.58 | 0.1 | 1814.63 |
| 2 | Very soft silty clay | 24.73 | 73.7 | 47.46 | 5.7 | 73.7 | 0.12 | 1764.85 |
| 3 | Very soft clay | 24.28 | 72.35 | 34.29 | 4.46 | 72.35 | 0.13 | 2425.41 |
| 4 | Clay | 37.76 | 112.52 | 45.55 | 5.47 | 112.52 | 0.12 | 2807.38 |
| 5 | Silty clay | 71.52 | 211.7 | 51.96 | 5.72 | 211.7 | 0.11 | 4578.29 |
| Layer No. | Layer Thickness (m) | Unit Weight γ (kN/m3) | Undrained Shear Strength Su (kPa) | Poisson’s Ratio ν | Damping Ratio α | Damping Ratio β |
|---|---|---|---|---|---|---|
| 1 (top) | 3.00 | 18.40 | 29.90 | 0.49 | 9.6600 | 0.7764 × 10⁻³ |
| 2 | 7.20 | 17.50 | 27.40 | 0.49 | 3.8930 | 1.9260 × 10⁻³ |
| 3 | 16.00 | 16.90 | 19.80 | 0.49 | 1.7710 | 4.2380 × 10⁻³ |
| 4 | 19.60 | 18.00 | 26.30 | 0.49 | 1.7440 | 4.3010 × 10⁻³ |
| 5 | 29.20 | 18.10 | 30.00 | 0.48 | 1.7060 | 4.3970 × 10⁻³ |
| Material | Density (kN/m3) | Elastic Modulus (GPa) | Poisson’s Ratio ν | Damping Ratio α | Damping Ratio β |
|---|---|---|---|---|---|
| Concrete | 25 | 30 | 0.20 | 2.2544 | 0.000908 |
© 2020 by the authors. Licensee MDPI, Basel, Switzerland. This article is an open access article distributed under the terms and conditions of the Creative Commons Attribution (CC BY) license (http://creativecommons.org/licenses/by/4.0/).
Share and Cite
Saleh Asheghabadi, M.; Cheng, X. Analysis of Undrained Seismic Behavior of Shallow Tunnels in Soft Clay Using Nonlinear Kinematic Hardening Model. Appl. Sci. 2020, 10, 2834. https://doi.org/10.3390/app10082834
Saleh Asheghabadi M, Cheng X. Analysis of Undrained Seismic Behavior of Shallow Tunnels in Soft Clay Using Nonlinear Kinematic Hardening Model. Applied Sciences. 2020; 10(8):2834. https://doi.org/10.3390/app10082834
Chicago/Turabian StyleSaleh Asheghabadi, Mohsen, and Xiaohui Cheng. 2020. "Analysis of Undrained Seismic Behavior of Shallow Tunnels in Soft Clay Using Nonlinear Kinematic Hardening Model" Applied Sciences 10, no. 8: 2834. https://doi.org/10.3390/app10082834
APA StyleSaleh Asheghabadi, M., & Cheng, X. (2020). Analysis of Undrained Seismic Behavior of Shallow Tunnels in Soft Clay Using Nonlinear Kinematic Hardening Model. Applied Sciences, 10(8), 2834. https://doi.org/10.3390/app10082834