Article

Mobile Robot Path Planning Using a Laser Range Finder for Environments with Transparent Obstacles

Department of Computer Science and Engineering, Dongguk University, Seoul 04620, Korea
*
Author to whom correspondence should be addressed.
Appl. Sci. 2020, 10(8), 2799; https://doi.org/10.3390/app10082799
Submission received: 10 March 2020 / Revised: 11 April 2020 / Accepted: 15 April 2020 / Published: 17 April 2020
(This article belongs to the Special Issue Recent Advances in Indoor Localization Systems and Technologies)

Abstract

:
Environment maps must first be generated to drive mobile robots automatically. Path planning is performed based on the information given in an environment map. Various types of sensors, such as ultrasonic and laser sensors, are used by mobile robots to acquire data on its surrounding environment. Among these, the laser sensor, which has the property of being able to go straight and high accuracy, is used most often. However, the beams from laser sensors are refracted and reflected when it meets a transparent obstacle, thus generating noise. Therefore, in this paper, a state-of-the-art algorithm was proposed to detect transparent obstacles by analyzing the pattern of the reflected noise generated when a laser meets a transparent obstacle. The experiment was carried out using the environment map generated by the aforementioned method and gave results demonstrating that the robot could avoid transparent obstacles while it was moving towards the destination.

1. Introduction

The goal of path planning is to provide a path that is safe from obstacle collisions and to guide any object through the most appropriate path that has the shortest distance [1,2,3,4,5]. To accomplish this goal, a robot must collect surrounding data to generate an environment map.
An environment map refers to a map that features data on the surroundings in which a mobile robot stands. Although a robot uses sensors to generate an environment map, the data acquired through these sensors are always affected by elements of the surrounding environment. For this reason, such data always contain inaccuracies. Therefore, these inaccuracies in the data must be considered when creating environment maps.
Sensors that are often used to detect distances from obstacles include ultrasound sensors [6], laser sensors [7,8], etc. Among these, ultrasound sensors use the elapsed time it takes for a sound wave to come back to the sensor after hitting the obstacle to detect distance. However, because ultrasound sensors use sound as a medium, the measurable distance is short, and detecting distance is difficult if the direction of the obstacle and the sound wave do not align vertically. Laser sensors measure an object’s distance away from obstacles using lasers [9,10]. The properties of laser sensors include their ability to direct straight beams, they are capable of measuring long distances, and they are more accurate compared to other sensors [11]. However, due to these properties, a drawback of laser sensors is that they cannot accurately detect transparent obstacles. Therefore, a mobile robot misoperates in an environment that includes transparent obstacles [6,12].
When a laser beam meets a transparent obstacle, as shown in Figure 1, reflection, refraction, and penetration occur, and they cause the inaccurate detection of transparent obstacles.
The reflection noise that occurs at the opposite side of the transparent obstacle could be found from the results of measuring an object’s distance away from the transparent obstacle using an actual laser range finder (LRF). Accordingly, in this paper, a state-of-the-art algorithm that can detect the boundaries of transparent obstacles from reflection data obtained solely by the LRF has been proposed.

2. Related Works

2.1. Environment Map

The first step to path planning for automatic mobile robots is to configure the environment map. Many different methods of generating environment maps according to different methods of expression exist [13,14]. For example, there are grid maps, feature-based maps, etc [15,16].
A grid map divides the map into cell units, and the occupancy state of each cell is denoted between 0 and 1 to represent probability with the inaccuracy of the cell being measured taken into consideration [17] (Figure 2). The benefit of a grid map is that it is easy to generate, applies quickly to the changing environment that surrounds an object, and provides good accessibility. However, the grids result in inaccuracies in the real environment, and the complexity of grid maps is high because all cells must hold an occupancy state [14,18]. Recently, there has been the paper on path planning using a grid-based potential field [19].
Feature-based maps (Figure 3) can better express the real environment compared to grid maps because they indicate obstacles with points and lines. However, when it comes to map generation, the accuracy of an environment map is increased only when sensors with high accuracy are used because feature-based maps are highly affected by the performance of the sensor [20].

2.2. Path Planning

Path planning is about creating the shortest path with safe guidance and obstacle avoidance to the destination from the starting point in which a mobile robot stands [21]. Previous studies on environment map generation and path planning have been carried out under the assumption that a mobile robot already knows of the surrounding environment information [1,3,4,13].
However, in real environments, obstacles that had not existed in the environment map previously happen to appear, and mobile robots operate in dynamic environments where obstacles are moving; it is hard to apply static environment maps to the real environment under the assumption that robots are already equipped with all the required information [22]. Therefore, as a solution to the aforementioned problem, there are algorithms, such as D* algorithm [23,24,25], Wavefront-propagation algorithm [1,4,26,27], etc., that can be applied to make path planning easier.
The D* algorithm allows robots to avoid obstacles by partially performing path planning in the vicinity of obstacles if these robots meet an obstacle while they are moving. The D* algorithm has the benefit of a fast reaction to obstacles compared to the A* algorithm that needs to recalculate the whole environment map to generate a new path whenever an object meets a new obstacle.
Also, the D* algorithm is applied as the D* Lite algorithm [13] and is used as a motion-planning algorithm to ensure collision-free movement with a transportation mobile robot [28].
In addition, the algorithms based on A* algorithm also have been widely studied recently. For example, the improved A* algorithm [29] has reduced the computing time by considering the parent nodes during path planning and the smoothed A* algorithm [30] is used for vessels path planning.
The Wavefront-propagation algorithm has the advantage of being able to quickly generate a path that is close to the optimized one within the occupancy grid map. In addition, it has the advantage of being able to quickly apply the newly detected obstacle information from a dynamic environment to the environment grid map [21].

2.3. Detection of Transparent Obstacles

The goal of this paper is to detect transparent obstacles using LRF. In recent previous studies, some efforts have been carried out to detect the presence of transparent obstacles, which use the red-green-blue (RGB) cameras and depth to recognize transparent obstacles [31], and using the difference between one image of a transparent object that is captured with lights and the other without lights [32].
However, these methods require the use of additional measurement equipment such as RGB-D camera for the RGB-D method [31] or lighting device for the capturing with lights method [32].

3. Mobile Robot System

3.1. Overall System Configuration
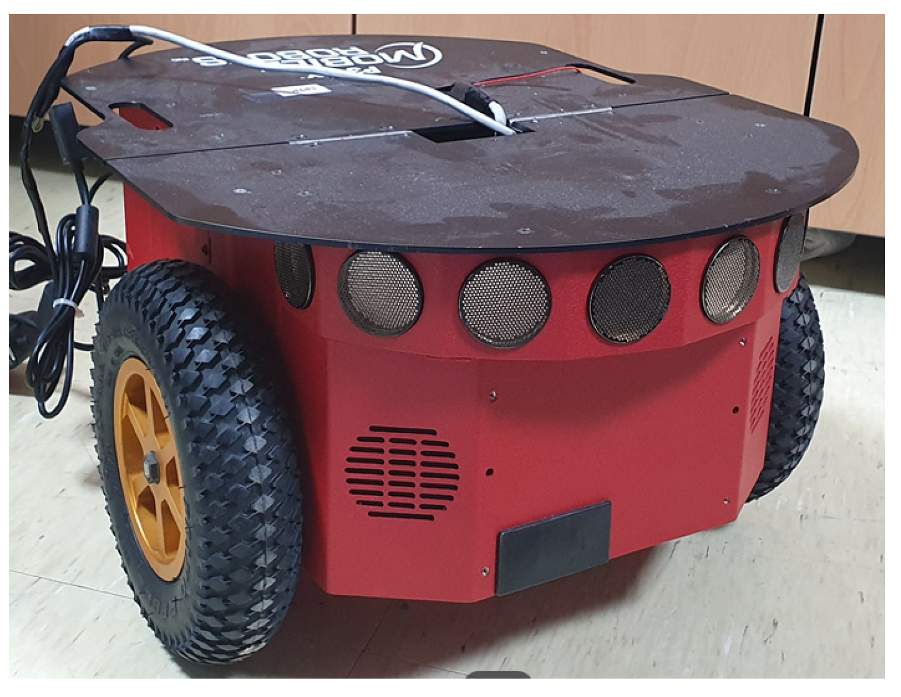
For a mobile robot to generate an environment map and perform path planning, the overall system configuration of the mobile robot should be conducted as shown in Figure 4. Regarding hardware, the mobile robot collects data through sensors, and based on these data, an environment map is generated through software. A mobile robot executes path planning based on environment map and move along the path using actuator.

3.2. Mobile Robot

Our experiment was carried out using the actual mobile robot. The Pioneer (Pioneer company, Japan) [33] P3DX (Figure 5) that is widely used for research purposes had been used in experiments related to mobile robots.

3.3. Laser Range Finder (LRF)

The goal of this paper was to create an environment map that allows mobile robots to conduct automatic driving using only LRF within an environment where transparent obstacles are included. As such, the LMS100-10000 laser range finder (Figure 6) from SICK (Sick AG company, Germany) [34] was used.
The maximum measurable angle of the corresponding LRF is 270 degrees, the measurable distance varies from a minimum of 50 cm to a maximum of 20 m, the systemic error is + −30mm, and the stochastic error rate is + −12 mm. Additionally, it has an angular resolution of 0.25 degrees or 0.5 degrees [17]. In this study, an angular resolution of 0.25 degrees was used, and 1081 units of information can be collected within the range when the robot stands between −135 and 135 degrees using the 0.25 degree of angular resolution.
After collecting data on the obstacles surrounding the robot, the coordinate system requires additional transformation to apply this data to the environment map [16,26,34,35]. The data collected using LRF corresponds to the polar coordinate system and contains information of the distance away from the sensor and direction. This data must also be converted to a rectangular coordinate system that the robot uses.
The following equation can be derived from Figure 7.
x o b s t a c l e = x r o b o t + d cos ( θ l r f + θ r o b o t ) ,   y o b s t a c l e = y r o b o t + d sin ( θ l r f + θ r o b o t )
x r o b o t and y r o b o t correspond to the current coordinates of the robot in the rectangular coordinate system. θ r o b o t is the direction of the robot, and θ l r f is the angle between the beam and the direction that the robot is moving towards. d indicates the distance to the obstacle from the robot’s position. Using these methods, the coordinates of x o b s t a c l e   and   y o b s t a c l e can be found on the rectangular coordinate system.

4. Environment Map Generation Algorithm in a Transparent Obstacle Environment

The environment map generation algorithm using LRF requires the three following assumptions.
[Assumptions]
  • Transparent obstacles are in the form of a straight line.
  • No opaque obstacle exists adjacent to the transparent obstacle that is on the opposite side of the LRF.
  • All obstacles are fixed in their positions, and they are not known.
The proposed environment map generation for a transparent obstacle environment processes the reflection noises that occur by using LRF. This method is used to extract reflection noise that is different from common noise, and the boundaries of the transparent obstacles are found based on the form and characteristics of the extracted reflection noises [27].
In this paper, the occupancy grid map is chosen in the creation of an environment map. Although feature-based maps better represent actual environments, they have the drawback of being weak to noises; however, occupancy grid maps are highly resistant to noise, and their measured data can be applied quickly to environment maps without additional operations [15]. Occupancy grid maps still require a lot of computing time [36]; however, this can be overcome through recent improvements in computing power [5,9,10].
The following table explains the terminology required for the algorithm.
Based on the terminology in Table 1, the algorithm used to generate an environment map within an environment that includes transparent obstacles is shown below.
Algorithm 1. Pseudo code of the algorithm used to create environment maps for environments with transparent obstacles.
Input:
d n (t) ← Distance towards the direction θ n (t) measured at time t
θ n (t) ← Angle value of nth sensor beam measured at time t
P R (t) ← Position (x, y) of the robot at time t
θ R (t) ← Direction that robot is heading towards at time t
Output:
SDCMap ← Global map representing the accumulated number of detected sensor beams in a certain cell to decide obstacle cell
Begin Algorithm Creating Environment maps with Transparent Obstacle
1 For d n (t) in all sensor beams n: {1 ~ 1081} do
2  If D m i n d n (t) ≤   D m a x then
3    c e l l n (t) ← f( d n (t),   θ n (t),   P R (t),   θ R (t))
4   Else
5    c e l l n (t) ← −1
6  If c e l l n (t) == c e l l n 1 (t) then
7   WDCMap( c e l l n 1 (t)) += 1
8   Else If P R (t−1) ≠ P R (t) then
9   If WDCMap( c e l l n 1 (t)) ≥ T H n o n g l a s s then
10    SDCMap( c e l l n 1 (t)) += g(WDCMap( c e l l n 1 (t)))
11   Else If WDCMap( c e l l n 1 (t)) ≥ T H g l a s s Or c e l l n 1 (t) ∈ C E L L n e i g h o r ( c e l l n 1 (t−1)) then
12    LRasterization( c e l l R (t),   c e l l n 1 (t))
// L: The list of cells included in the virtual line segment
// connecting L[0]: c e l l R (t) and L[NUM_CELLS]: c e l l n 1 (t)
13    c e l l L 1 Find_NearCell( c e l l R (t), L)  // Function finding the closest but not the
// same cell from c e l l R (t) in the list L
14 loop:
15   SDCMapDetectObstacleCandidate( c e l l L 1 , L, NUM_CELLS)
16   Goto loop
17   If there is no c e l l L 1 in L s.t. SDCMap ( c e l l L 1 ) > 0 then
18    SDCMap( c e l l n 1 (t)) += 1
19  Else
20   If c e l l n 1 (t) ∈ C E L L 0 (t) then
21    SDCMap( c e l l n 1 (t)) += 1
22    Else
23    Append c e l l n 1 (t) to C E L L 0 (t)
24  WDCMap( c e l l n (t)) ← 0
End Algorithm Creating Environment maps with Transparent Obstacle
In Algorithm 1, whether dn(t) belongs to the range of Dmindn(t) ≤ Dmax is checked first to delete all inaccurate distance information about dn(t) according to its θn(t) measured from LRF at time t. The distance is calculated using Equation (1) if it belongs to the range.
In this paper, LRF’s angular resolution is 0.25 degrees, and the size of the cell is 15 cm in the grid map; therefore, two beams detect the same celln(t) for a cell that has an opaque obstacle [28]. The angle between the n-1th beam and the nth beam is 0.25 degrees, more than 35 m distance is needed if two beams point to different cells (Figure 8). The value of Dmax is 20 m. Therefore, a cell that has an opaque obstacle is always detected by more than two beams.
Based on the above information, if celln(t) and celln − 1(t) point to the same cell, the probability of celln − 1(t) being an obstacle is increased by adding 1 to WDCMap(celln − 1(t)). If (cellnt) and celln − 1(t) are different, the SDCMap(celln − 1(t)) is updated according to the value of WDCMap(celln − 1(t)). The algorithm proposed in this paper uses the common feature of reflection noises generated from transparent obstacles while the robot is moving; if the SDCMap is updated while the robot is not moving, redundant detections are accumulated. Therefore, the SDCMap may not be updated while the robot is not moving.
Updates to the SDCMap are provided through different methods according to measurements of WDCMap(celln − 1(t)). If the WDCMap(celln − 1(t)) > THnon − glass, this denotes that many beams are indicating the same cell simultaneously. This denotes that the probability of (celln − 1t) being an opaque cell is high; therefore, the value of the SDCMap(celln − 1(t)) should be increased significantly.
Algorithm 2. Pseudo code of the algorithm used to DetectObstacleCandidate().
Input:
c e l l L 1 ← Result of function finding the closest but not the same cell from c e l l R (t) in the list L
L ← List of cells included in the virtual line segment
NUM_CELLS ← Last index number of list L
Output:
SDCMap ← The global map representing the accumulated number of detected sensor beams in a certain cell to decide obstacle cell
Begin Algorithm Detect Obstacle Candidate
1 If SDCMap( c e l l L 1 ) > 0 then
2  If WDCMap(L[NUM_CELLS]) ≥ T H g l a s s s u r f a c e then // L[NUM_CELLS]: c e l l n 1 (t)
3   SDCMap( c e l l L 1 ) += g(WDCMap(L[NUM_CELLS]))
4  Else
5   SDCMap( c e l l L 1 ) += 1
6  INIT_CELL ← 1
7   c e l l L Find_NearCell( c e l l L 1 , L[INIT_CELL:NUM_CELLS])
// Function finding the closest but not the same cell from L[0] == c e l l L 1 in the list L
8 loop:
9  If WDCMap( c e l l n 1 (t)) ≥ T H g l a s s s u r f a c e then
10   SDCMap( c e l l L ) -= g(WDCMap( c e l l n 1 (t)))
11  Else
12   SDCMap( c e l l L ) −= 1
13  INIT_CELL += 1 // INIT_CELL: 1, 2, … , NUM_CELLS
14   c e l l L Find_NearCell( c e l l L , L[INIT_CELL:NUM_CELLS])
15  Goto loop
16 LL–{ c e l l L 1 } // Update L With the reduced size
17  c e l l L 1 Find_NearCell( c e l l L 1 , L[INIT_CELL:NUM_CELLS-1])
End Algorithm Detect Obstacle Candidate
If the value of the WDCMap( c e l l n 1 (t)) is not high, whether c e l l n 1 (t) is detected by reflection noise or common noise should be distinguished. For this purpose, the following three conditions are provided.
[Conditions]
  • The cell containing transparent obstacles have higher WDCMap compared to a cell detected by irregular noise due to the regularity of the reflection noise generated by transparent obstacles. Although the value of the WDCMap( c e l l n 1 (t)) is not higher than T H n o n g l a s s , if it is higher than the value of T H g l a s s , it is marked as a candidate of transparent obstacle.
  • While the robot is moving, the reflection noise occurs continuously, but common noises occur intermittently by opaque obstacles and the surrounding environment. Using this property, it is considered as a candidate for a transparent obstacle if the c e l l n 1 (t) at time t correspond to any of C E L L n e i g h b o r ( c e l l n 1 (t−1)) at time t.
  • The reflection noise generated by transparent obstacles may contain a cell that has low WDCMap because it is not detected continuously; however, if it is detected regularly, it is considered to be a candidate for a transparent obstacle.
The following steps progress when conditions 1 and 2 from the above are met. At time t, a list L of cells is generated (Figure 9), consisting of the cells included in the virtual line segment connecting c e l l R (t) and c e l l n 1 (t).
The SDCMap is checked from c e l l L 1   , which is closest to the mobile robot, to all other elements in the list L if a cell identified as an obstacle candidate is found; (Algorithm 2) c e l l n 1 (t) is checked whether it is detected by reflection noise by the boundaries of the transparent obstacles (WDCMap( c e l l n 1 (t)) ≥ T H g l a s s s u r f a c e ). If c e l l n 1 (t) is detected by reflection noise, the SDCMap of c e l l L 1 is increased instead of c e l l n 1 (t) with a large amount.
If c e l l n 1 (t) is not detected by reflection noise, the SDCMap is increased with a small amount for later updates. Once the SDCMap of c e l l L 1 is increased by a large amount, the SDCMap of those elements that belong to the list L but c e l l L 1 are decreased by a large amount, and if SDCMap of c e l l L 1 is increased by a small amount, the SDCMap of those elements that belong to the list L but c e l l L 1 is decreased by a small amount.
If all the elements of the list L are not detected as candidates for obstacles, c e l l n 1 (t) has a low probability of being an obstacle but would be considered for its probability of being a candidate for an obstacle; SDCMap( c e l l n 1 (t)) is then increased by a small amount.
If condition 3 is met, if c e l l n 1 (t) belongs to C E L L 0 (t), then it is a case of not being detected continuously but regularly; therefore, considering the probability of being a later candidate of an obstacle, c e l l n 1 (t) is increased by a small amount, and if it does not belong to C E L L 0 (t), then c e l l n 1 (t) is added to C E L L 0 (t).

5. Path Planning in an Environment with Transparent Obstacles

The following conditions are required when making an environment map in an environment with transparent obstacles.
[Conditions]
  • A path planning method that can be applied to the occupancy grid map must be used.
  • A new path must be generated quickly within the environment map being updated by the sensor data being collected in real time.
  • The generated path should be close to the optimized one.
Other than the above conditions, an environment map uses the SDCMap, and by using it, three types of cells are generated as not obstacle cell, obstacle cell, and obstacle candidate cell. Therefore, path planning is run according to the Wavefront-propagation algorithm (Table 2, Algorithm 3) with all these conditions considered [24].
Once the grid map is completed using the Wavefront-propagation algorithm, the cost of all the cells to the destination is calculated as in Figure 10a. The spot with a cost of 0 is the destination, and path planning is run based on this. The next cell is chosen by looking at the eight adjacent cells from which the robot stands. The current position of the robot is colored blue in Figure 10b, and the eight adjacent cells are colored red. The box with slashes represents the path the robot travels.
As the robot travels towards the destination, the robot selects the box with the minimum cost. However, following all the boxes with minimum cost results in awkward movement. Therefore, boxes that are not needed to control the robot’s movement are removed. Not only does this contribute to more natural movement, but computing time can also be significantly reduced. The optimized map is shown in Figure 10c.
However, in this paper, both the map in Figure 10b,c are used; they represent the original and optimized paths, respectively, for path planning in environments with transparent obstacles. The original path is used to detect the newly found obstacles while the robot is travelling in a dynamic environment. The optimized path is used to direct the robot’s motion control.
Algorithm 3. Pseudo code for the Wavefront-propagation algorithm [24]. (Citation mark)
BeginAlgorithm Wavefront-propagation
1 Initialize W 0 X G , i ← 0
2 Initialize W i + 1
3 For every x ∈ W i , assign Φ (x) = i and insert All unexplored neighbors of x do
4  If W i + 1 == then
5   Terminate
6 Else
7  ii + 1
8  Goto step 2
EndAlgorithm Wavefront-propagation
The time complexity of Wavefront-propagation is O(n).

6. Experimental Results

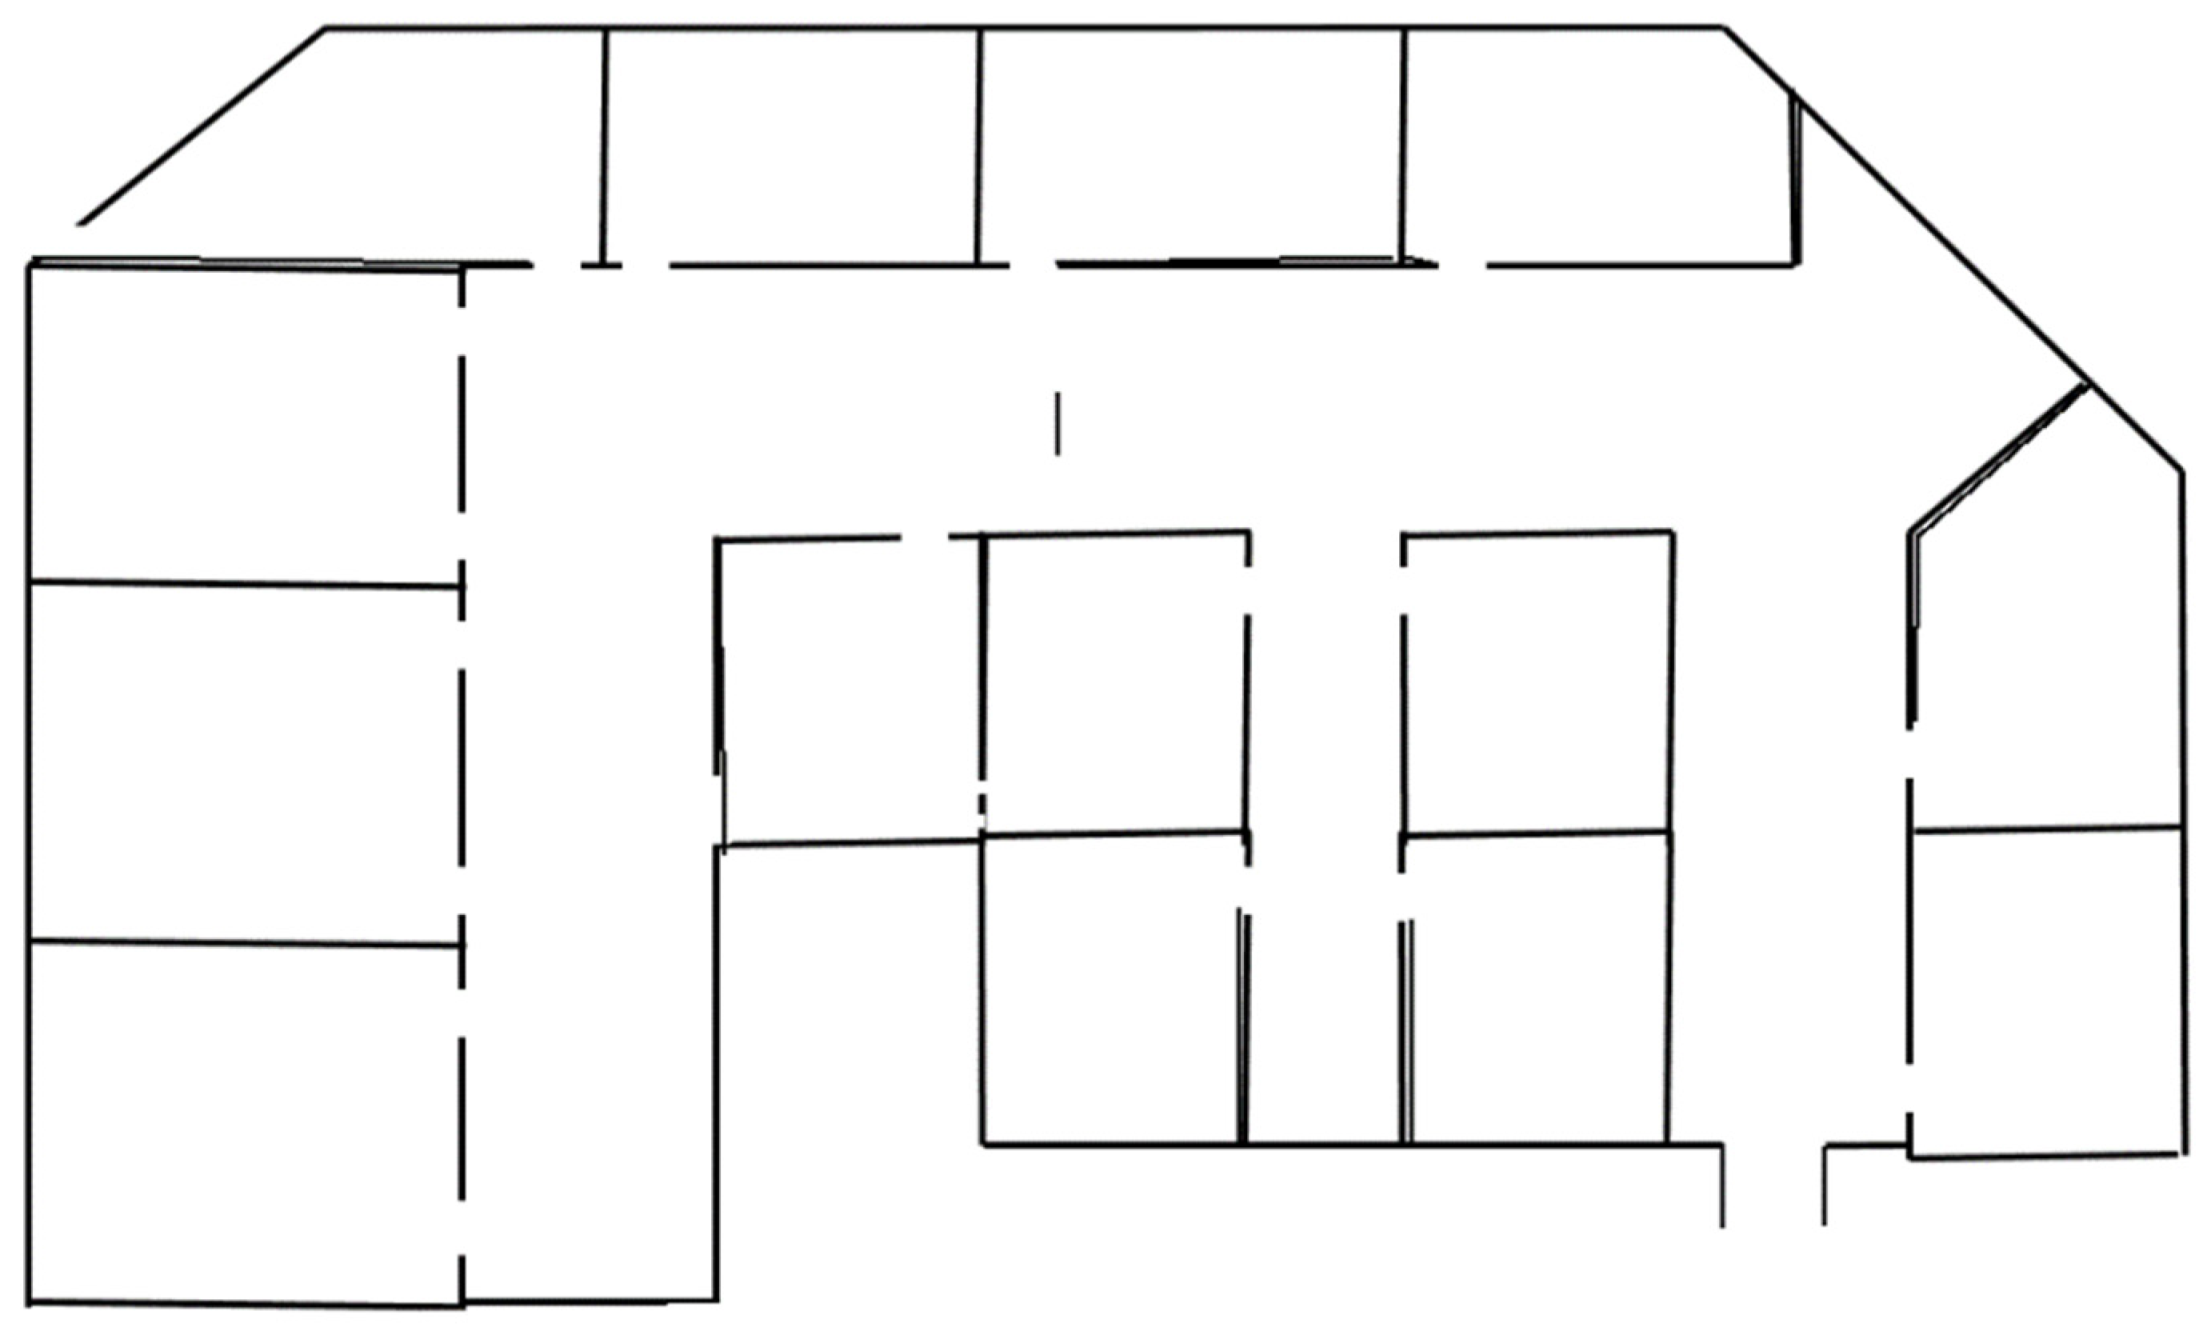
6.1. Experimental Environment

Three environments for the experiments were configured. All the experimental environments were 4 m × 3.53 m, and four sides were surrounded with opaque obstacles. Three transparent obstacles (objects 1–3) were used in all the experiment environments and as substitutes for window frames in a real building; an opaque rectangular obstacle (5 cm × 4 cm) was placed in the gap between each transparent obstacle.
The first experimental environment in Figure 11a and the obstacles (objects 1–3) were placed in line. In the second experiment represented by Figure 11b, object 3 was placed orthogonally to object 2 to configure a corner composed of transparent obstacles. Lastly, a diamond-shaped opaque obstacle was added to the first experimental environment, as shown by Figure 11c.
Figure 12 shows the actual experimental environment. As can be seen on Figure 12, the transparent materials used are thick sheets of glass with 0.5 cm thickness.

6.2. Environment Map Generation Experiment in an Environment with Transparent Obstacles

6.2.1. Experimental Method

The LRF was fixed to the robot to conduct experiments to create environments using data collected from the surrounding environment. Experiments were run in two different ways.
[Method]
  • The robot drove alongside the wall of transparent obstacles with a 30 cm distance away from it.
  • The robot drove towards the wall in a direction angled 45 degrees at a position far from the wall of the transparent obstacle, and the robot’s position moved parallel to the wall once it reached 30 cm distance away from the wall.
Based on the collected data, two occupied grid map results were generated for comparison. The first generated map was the result of using only data collected from LRF in an environment with transparent obstacles, and the second generated map was the result of using LRF and the proposed algorithm for transparent obstacle recognition in the same environment.

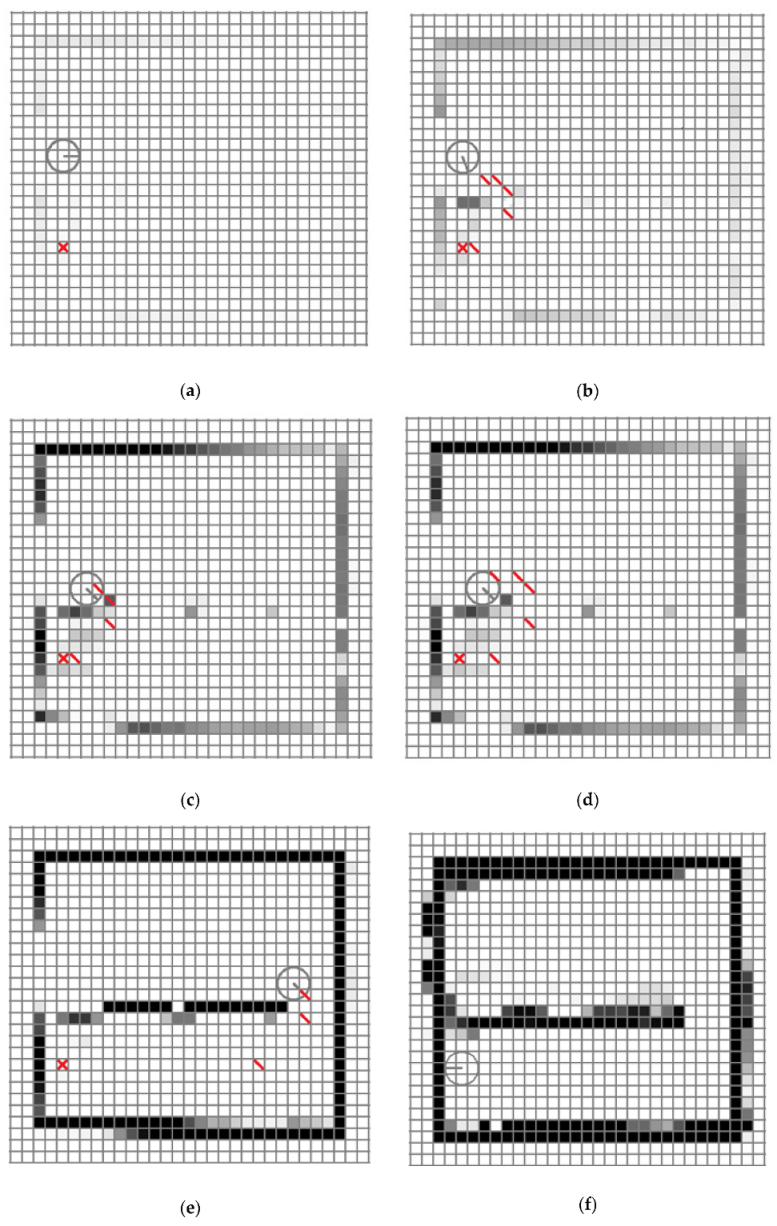
6.2.2. Analyses of the Experimental Results

The black represents cells with a high probability of having obstacles; the closer the cells are to white, the lower the probability of the grids having obstacles. The size of each cell was fixed to 15 cm.
The figures include environment maps for experimental environment 1. Figure 13a is the baseline for the other environment maps. This environment map is generated if the transparent obstacles (objects 1–3) are transferred to opaque maps. Figure 13b is a result generated by using only collected data from LRF. A lot of cells with obstacle candidates were detected because of the reflection noises caused by transparent obstacles on the opposite side of the transparent obstacle. Figure 13c is a result generated by applying the environment map generation algorithm in an environment with transparent obstacles. The results show that the robot detecting the transparent obstacles exclude the place at the start of the robot. However, some of the cells being left as obstacle candidates can be seen on the opposite side of the transparent obstacles due to the algorithm’s failure to remove all of the reflection noise.
Figure 14 corresponds to environment maps generated in response to experimental environment 2. Figure 14a is the baseline for experimental environment 2. Figure 14b is the result generated by using only collected data from LRF. As the results show, a lot of obstacle candidates are generated on the opposite side of transparent obstacles as the result of experimental environment 2. The transparent obstacles placed vertically look as though the transparent obstacles had been found, but this is a result of a lot of reflection noises distributed by the transparent obstacle. Figure 14c is the result generated using the environment map generation algorithm in an environment with transparent obstacles. The boundaries of the transparent obstacles placed horizontally show a low probability of being an obstacle candidate. This phenomenon results from the process of the rasterization of the reflection noise for transparent obstacles in the vertical line, which also decreases their probability of being an obstacle candidate for cells belonging to transparent obstacles on the horizontal line.
Figure 15 represents the three environment maps generated in accordance with experimental environment 3. Figure 15a is the baseline for the environment map. Figure 15b is the result of using only collected data from LRF. Although it detected the diamond-shaped opaque obstacle, it could not detect the boundaries of transparent obstacles, and many obstacle cells were represented on the opposite side. On the other hand, Figure 15c represented the diamond-shaped opaque obstacle well, and the surface of the transparent obstacles were detected as well.
As the figures above demonstrate, the robot drives towards the wall of the transparent obstacle at an angle of 45 degrees, stops near the transparent obstacle, rotates, and resumes the movement alongside the wall of the transparent obstacle. In Figure 16a,c, the cells corresponding to the obstacle candidates show a high probability because the reflection noise keeps occurring at the fixed place while driving towards the transparent obstacle. In Figure 16b,d a high probability for being obstacle candidates is shown for the same reasons as Figure 16a,c; however, most of the obstacle candidate cells could be deleted while driving alongside the transparent obstacle.

6.3. Mobile Robot Path Planning Experiment in an Environment with Transparent Obstacles

6.3.1. Experimental Method

As can be seen in Figure 17, the results can be checked by setting the starting point and destination at experimental environment 1 and by enabling the robot to do path planning and travel by itself with the environment map generated from the real algorithm. A transparent obstacle is placed between the start position and destination.

6.3.2. Experiment Result Analysis

Figure 18a shows the position in which the robot takes before it starts moving. As shown, the information from the sensors is not yet stored in the environment map that is held by the robot; it rotates to move towards the destination marked x. Figure 18b shows the intermediate destinations as it has acquired some of the information during its rotation. Figure 18c–e shows the process of modifying the paths based on the sensor data the robot acquires while it travels through the intermediate destinations. Additionally, the transparent obstacles looking clearer as the robot moves towards the wall can be seen. Figure 18f shows the robot arriving at the destination.

6.4. Error Rate Experiment

Experimental Method

In the experiment, a total three experiment environments were configured, and each one had its own baseline environment map. Therefore, in this experiment, the environment map generated by using only collected data from LRF and the environment map generated by using LRF and the algorithm proposed in this paper were compared to their baseline, respectively, and the error rates were measured.
The following equation was proposed for the sake of the above experiment:
errorate ( % ) = i = 1 n j = 1 m | c e l l r e s u l t [ i ] [ j ] c e l l b a s e [ i ] [ j ] | n m 100   (   i f   c e l l r e s u l t [ i ] [ j ] > thrshold   t h e n   c e l l r e s u l t [ i ] [ j ] = 1   e l s e   c e l l r e s u l t [ i ] [ j ] = 0 )
The environment map for the baseline can be indicated as either 1 or 0; 1 represents the cell with obstacles, and 0 represents the cell with no obstacles. However, the environment map generated by the algorithm contains cells with obstacle candidates; therefore, they are encoded into binary numbers as either 1 or 0 by the threshold.
In Equation (2), each of n and m represent the maximum number of rows and columns when they are expressed by a vector represented with rows and columns. Each of i and j represent the index of the array. The meaning of c e l l r e s u l t [ i ] [ j ] is the rate of how long the cell had been occupied at row i and column j in the environment map, which is the result of the algorithm. However, the value of c e l l r e s u l t [ i ] [ j ] is transferred to binary numbers compared to the threshold. c e l l b a s e [ i ] [ j ] represents the occupied rate of the cell on the baseline environment map. The baseline environment map is the most optimized one; therefore, the gap of cells that are obstacles and not obstacles are clearly distinguished.
Table 3 shows the proposed algorithm having a lower error rate in all experimental environments compared to using only data collected from LRF.
Also, the case of using only data collected from LRF shows the average error rate was 17.74%. On the other hand, the case of using LRF and the proposed algorithm shows the average error was 6.12%. On average, the error rate of using LRF and the proposed algorithm is 11.62% lower than error rate of using only data from LRF.

7. Conclusions

In this paper, a map-generation algorithm using LRF was proposed to help path planning in environments with transparent obstacles. In this algorithm, the reflection noises that may occur in the vicinity of transparent obstacles are used to detect transparent obstacles. Additionally, the possibility of the robot’s automatic driving was verified by checking whether the robot could detect the surface of the transparent obstacles and arrive at the destination while avoiding the obstacles by using the environment map generated by the algorithm. The performance for map building improved by 11.62% when comparing the environment map with only using data collected from LRF as the baseline. Therefore, the results show that the surface of transparent obstacles could be detected solely by LRF even in the environment with transparent obstacles.

Author Contributions

Idea and conceptualization: J.-W.J. and J.-S.P.; methodology: J.-W.J. and J.-S.P.; software: J.-S.P.; experiment: J.-S.P., T.-W.K. and J.-G.K.; validation: J.-W.J., J.-S.P. and J.-G.K.; investigation: J.-S.P. and T.-W.K.; resources: J.-W.J. and J.-S.P.; writing: J.-W.J., J.-S.P., T.-W.K., J.-G.K. and H.-W.K.; visualization: J.-S.P., T.-W.K. and J.-G.K.; project administration: J.-W.J. All authors have read and agreed to the published version of the manuscript.

Funding

This research was supported by the Ministry of Science and ICT, Republic of Korea, under the National Program for Excellence in Software supervised by the Institute for Information and Communications Technology Promotion (2016-0-00017), the KIAT (Korea Institute for Advancement of Technology) grant funded by the Korean government (MOTIE: Ministry of Trade Industry and Energy) (No. N0001884, HRD program for Embedded Software R&D), the Basic Science Research Program through the National Research Foundation of Korea (NRF) funded by the Ministry of Education, Science and Technology (2015R1D1A1A09061368), and the KIAT (Korea Institute for Advancement of Technology) grant funded by the Korea Government (MSS: Ministry of SMEs and Startups). (No. S2755615, HRD program for Enterprise linkages R&D).

Conflicts of Interest

The authors declare no conflicts of interest.

References

  1. Tsubouch, T. Nowadays trend in map generation for mobile robots. In Proceedings of the IEEE International Conference on Intelligent Robot and System, Osaka, Japan, 8 November 1996; Volume 2, pp. 828–833. [Google Scholar]
  2. Moravec, H.P.; Elfes, A.E. High resolution maps from wide angle sonar. In Proceedings of the IEEE International Conference on Robotics and Automation, St. Louis, MO, USA, 25–28 March 1985; Volume 2, pp. 116–121. [Google Scholar]
  3. Leonard, J.J.; Durant-Whyte, H.F. Dynamic Map Building for an Autonomous Mobile Robot. Int. J. Robot. Res. 1992, 11, 286–298. [Google Scholar] [CrossRef]
  4. Stateczny, A.; Kazimierski, W.; Gronaska-Siedz, D.; Motly, W. The Empirical Application of Automotive 3D Rader Sensor for Target Detection for an Autonomous Surface Vehicle’s Navigation. Remote Sens. 2019, 11, 1156. [Google Scholar] [CrossRef] [Green Version]
  5. Jung, J.-W.; So, B.-C.; Kang, J.-G.; Lim, D.-W.; Son, Y. Expanded Douglas–Peucker Polygonal Approximation and Opposite Angle-Based Exact Cell Decomposition for Path Planning with Curvilinear Obstacles. Appl. Sci. 2019, 9, 638. [Google Scholar] [CrossRef] [Green Version]
  6. Feder, H.J.S.; Leonard, J.J.; Smith, C.M. Adaptive mobile robot navigation and mapping. Int. J. Robot. Res. 1999, 18, 650–668. [Google Scholar] [CrossRef]
  7. Park, J.-S.; Jung, J.-W. Transparent Obstacle Detection Method based on Laser Range Finder. J. Korean Inst. Intell. Syst. 2014, 24, 111–116. [Google Scholar] [CrossRef] [Green Version]
  8. Jensgelt, P. Approaches to Mobile Robot Localization in Indoor Environments. Ph.D. Thesis, KTH Royal Institute of Technology, Stockholm, Sweden, 2001. [Google Scholar]
  9. Zhuang, Y.; Sun, Y.; Wang, W. Mobile Robot Hybrid Path Planning in an Obstacle-Cluttered Environment Based on Steering Control and Improved Distance Propagation. Int. J. Innov. Comput. Inf. Control 2012, 8, 4098–4109. [Google Scholar]
  10. Sohn, H.-J. Vector-Based Localization and Map Building for Mobile Robots Using Laser Range Finder in an indoor Environments. Ph.D. Thesis, Korea Advanced Institute of Science and Technology (KAIST), Daejeon, Korea, 2008. [Google Scholar]
  11. Jung, Y.-H. Development of a Navigation Control Algorithm for Mobile Robot Using D* Search Algorithm. Master’s Thesis, Chungnam University, Daejeon, Korea, 2008. [Google Scholar]
  12. Park, J.-S.; Jung, J.-W. A method to LRF noise Filtering for the transparent obstacle in mobile robot indoor navigation environment with straight glass wall. In Proceedings of the IEEE International conference on Ubiquitous Robots and Ambient Intelligence, Xi’an, China, 19–22 August 2016; pp. 194–197. [Google Scholar]
  13. Koenig, S. Fast Replanning for Navigation in Unknown Terrain. IEEE Trans. Robot. 2005, 21, 354–363. [Google Scholar] [CrossRef]
  14. Guo, J.; Liu, Q.; Qu, Y. An improvement of D* Algorithm for Mobile Robot Path Planning in Partial Unknown Environments. Intell. Comput. Technol. Automob. 2009, 3, 394–397. [Google Scholar]
  15. Kuipers, B.; Byum, Y.T. A robot exploration and mapping strategy based on a semantic hierarchy of spatial representations. Robot. Auton. Syst. 1991, 8, 47–63. [Google Scholar] [CrossRef]
  16. Choset, H.; Burdick, J. Sensor-Based exploration: The hierarchy generalized voronoi graph. Int. Robot. Res. 2000, 19, 96–125. [Google Scholar] [CrossRef]
  17. Young, D.K.; Jin, S.L. A Stochastic Map Building Method for Mobile Robot using 2D Laser Range Finder. Auton. Robot 1999, 7, 187–200. [Google Scholar]
  18. Rudanm, J.; Tuza, G.; Szederkenyi, G. Using LMS-100 Laser Range Finder for indoor Metric Map Building. In Proceedings of the 2010 IEEE International Symposium on Industrial Electronics, Bari, Italy, 4–7 July 2010; pp. 520–530. [Google Scholar]
  19. Jung, J.-H.; Kim, D.-H. Local Path Planning of a Mobile Robot Using a Novel Grid-Based Potential Method. Int. J. Fuzzy Log. Intell. Syst. 2020, 20, 26–34. [Google Scholar] [CrossRef]
  20. Siciliano, B.; Khatib, O. Handbook of Robotics; Springer: Berlin, Germany, 2008. [Google Scholar]
  21. Latombe, J. Robot Motion Planning; Kluwer Academic Publisher: Cambridge, MA, USA, 1991. [Google Scholar]
  22. Nohara, Y.; Hasegawa, T.; Murakami, K. Floor Sensing System using Laser Range Finder and Mirror for Localizing Daily Life Commodities. In Proceedings of the IEEE/RSJ International Conference on Intelligent Robots and Systems, Taipei, Taiwan, 18–22 October 2010; pp. 1030–1035. [Google Scholar]
  23. Choset, H.; Lynch, K.M.; Hutchinson, S.; Kantor, G.; Burgard, W.; Kavaraki, L.E.; Thrum, S. Principles of Robot Motion: Theory, Algorithm and Implementation; MIT Press: Cambridge, MA, USA, 2005. [Google Scholar]
  24. La Valle, S.M. Planning Algorithms; Cambridge University Press: Cambridge, MA, USA, 2006. [Google Scholar]
  25. Stentz, A. Optimal and Efficient Path Planning for Partially-Known Environments. In Proceedings of the IEEE International Conference on Robotics and Automation, San Diego, CA, USA, 8–13 May 1994; Volume 4, pp. 3310–3317. [Google Scholar]
  26. Siegwart, R.; Nourbakhsh, I.R. Introduction to Autonomous Mobile Robot; MIT Press: Cambridge, MA, USA, 2004. [Google Scholar]
  27. Willms, A.R.; Yang, S.X. An Efficient Dynamic System for Real-Time Robot—Path Planning. IEEE Trans. Syst. Cybern. Part B Cybern. 2006, 36, 755–766. [Google Scholar] [CrossRef] [PubMed] [Green Version]
  28. Nguyen Van, V.; Kim, Y.-T. An Advanced Motion Planning Algorithm for the Multi Transportation Mobile Robot. Int. J. Fuzzy Log. Intell. Syst. 2019, 19, 67–77. [Google Scholar]
  29. Mingxiu, L.; Kai, Y.; Chengzhi, S.; Yutong, W. Path Planning of Mobile Robot Based on Improved A* Algorithm. In Proceedings of the IEEE 29th Chinese Control and Decision Conference (CCDC), Chongqing, China, 28–30 May 2017. [Google Scholar]
  30. Rui, S.; Yuanchang, L.; Richard, B. Smoothed A* Algorithm for Practical Unmanned Surface Vehicle Path Planning. Appl. Ocean Res. 2019, 83, 9–20. [Google Scholar]
  31. Guo-Hua, C.; Jun-Yi, W.; Ai-Jun, Z. Transparent object detection and location based on RGB-D Camera. J. Phys. Conf. Ser. 2019, 1183, 012011. [Google Scholar] [CrossRef]
  32. Cui, C.; Graber, S.; Watson, J.J.; Wilcox, S.M. Detection of Transparent Elements Using Specular Reflection. U.S. Patent 10,281,916, 7 May 2019. [Google Scholar]
  33. Pioneer Corporation. Available online: https://www.pioneerelectronics.com/ (accessed on 16 April 2020).
  34. SICK Sensor Intelligence. Available online: https://www.sick.com/ (accessed on 16 April 2020).
  35. Lumelsky, V.; Skewis, T. Incorporation Range Sensing in The Robot. IEEE Trans. Syst. 1990, 20, 1058–1068. [Google Scholar]
  36. Moravec, H.P. Sensor fusion in certainty grids for mobiles robots. Ai Mag. 1988, 9, 61–74. [Google Scholar]
Figure 1. The phenomenon when measuring transparent object using a laser range finder (LRF).
Applsci 10 02799 g001
Figure 2. An example of an occupy grid map.
Applsci 10 02799 g002
Figure 3. An example of a feature-based map.
Applsci 10 02799 g003
Figure 4. System overview.
Applsci 10 02799 g004
Figure 5. Pioneer P3-Dx.
Applsci 10 02799 g005
Figure 6. SICK (Sick AG company, Germany) laser range finder (LMS100-10000).
Applsci 10 02799 g006
Figure 7. The relationship between the coordinates of detected obstacles and the coordinates of the robot.
Applsci 10 02799 g007
Figure 8. The relationship between the cell and the laser beam.
Applsci 10 02799 g008
Figure 9. Example of raster conversion.
Applsci 10 02799 g009
Figure 10. Path planning using the Wavefront-propagation algorithm: (a) environment map; (b) path planning results; and (c) optimization results.
Applsci 10 02799 g010
Figure 11. Experimental environment overview: (a) experimental environment with transparent obstacles arranged in a line; (b) experimental environment with transparent obstacles arranged vertically; (c) experimental environment with non-transparent obstacles added to (a).
Applsci 10 02799 g011
Figure 12. The figure of the actual experimental environment.
Applsci 10 02799 g012
Figure 13. Environment maps corresponding to experimental environment 1 (the starting point, destination point, and the travelled paths of the robot are represented by the blue circle, the red triangle and the arrow, respectively): (a) map using the baseline; (b) map using the only collected data from LRF; (c) map using LRF and the algorithm.
Applsci 10 02799 g013
Figure 14. Environment map corresponding to experimental environment 2 (the starting point, destination point, and the travelled paths of the robot are represented by the blue circle, the red triangle and the arrow, respectively): (a) map representing the baseline; (b) Map using only collected data from LRF; (c) map using LRF and proposed algorithm.
Applsci 10 02799 g014
Figure 15. Environment map corresponding to experiment environment 3 (the starting point, destination point, and the travelled paths of the robot are represented by the blue circle, the red triangle and the arrow, respectively): (a) map representing the baseline; (b) map using only collected data from LRF; (c) map using LRF and proposed algorithm.
Applsci 10 02799 g015
Figure 16. Environment map corresponding to experiment method 2: (a) environment map generated by using only collected data from LRF in experimental environment 1; (b) environment map generated using LRF and the proposed algorithm in experimental environment 1; (c) environment map generated by using only collected data from LRF in experimental environment 2; (d) environment map generated by using LRF and the proposed algorithm in experimental environment 2.
Applsci 10 02799 g016
Figure 17. Starting point and the destination in experimental environment 1.
Applsci 10 02799 g017
Figure 18. Results of path planning in an environment with transparent obstacles, the red diagonal line represent waypoint and the red cross line represent goal: (a) starting point; (be) steps in finding the transparent obstacle and modifying the planned path; (f) step in which the robot reaches the destination and stops.
Applsci 10 02799 g018
Table 1. Terminology essential to algorithm explanation.
TerminologyExplanation
θ n (t) The angle value of nth sensor beam measured at time t θ n (t) =   θ m i n +   θ s t e p *(n-1), n:1 ~ 1081, θ m i n = -45(deg), θ s t e p = 0.25(deg)
d n (t)The distance towards the direction θ n (t) measured at time t
D m i n The minimum distance that sensor can recognize: 50 cm
D m a x The maximum distance that sensor can recognize: 20 m
P R (t)The position (x, y) of the robot at time t
θ R (t)The direction that robot is heading towards at time t
f( d n (t),   θ n (t),   P R (t),   θ R (t))The position of the cell located from P R (t) with the distance d n (t) and the heading angle θ R (t) + θ n (t) (Represented as cell No.)
c e l l n (t)The position of the cell on the grid map calculated using f( d n (t),   θ n (t),   P R (t),   θ R (t)) at time t (Represented as cell No.)
c e l l R (t)The position of the robot center point on the grid map at time t (represented as cell No.)
WDCMap(cell)The temporary local map representing the number of detected sensor beams in a certain cell (weakly detected counter (WDC) map)
SDCMap(cell)The global map representing the accumulated number of detected sensor beams in a certain cell to decide obstacle cell (strongly detected counter (SDC) map)
C E L L 0 (t)The set of cells with WDCMap(cell) = 0 at time t
C E L L n e i g h o r ( c e l l n 1 (t−1))The set of cells pointed by n-1-rth, ∙∙∙ , n-1-1th, n-1th, n-1+1th, ∙∙∙ , n-1+rth beams at time t-1 (default value: r = 1)
g(x)A function emphasizing the extent of increase of the SDCMap(cell) (default function: g(x) = x)
T H n o n g l a s s The threshold number of WDC to determine opaque obstacle (default value = 5, WDC = weakly detected counter)
T H g l a s s The threshold number of WDC to determine the transparent obstacle candidate (default value = 1, T H g l a s s < T H n o n g l a s s )
T H g l a s s s u r f a c e The threshold number of WDC to determine the surface of transparent obstacle (default value = 3)
Table 2. Terminology essential to understanding the Wavefront-propagation algorithm.
TerminologyExplanation
i The cost required to propagate Wavefront
W i The set of cells for ith propagation
X G The set of cells in which the destination is stored (default: The number of destination cells is 1)
Φ (x)The function to store the optimized propagation cost of cells that belong to W i
All unexplored neighbors of xThe non-obstacle cells not yet propagated among adjacent cells with four different directions
Table 3. Error rate compared to the environment maps (%).
Environment 1Environment 2Environment 3
Using only data from LRF12.2619.5721.40
Using LRF and the algorithm6.457.204.73

