Article

Red Light Variation an Effective Alternative to Regulate Biomass and Lipid Profiles in Phaeodactylum tricornutum

1
Department of Chemistry, Biochemistry and Physics, Université du Québec à Trois-Rivières, 3351, boul. des Forges, C.P. 500, Trois-Rivières, QC G9A 5H7, Canada
2
Department of Process Engineering and Applied Science, Dalhousie University, P.O. Box 15000, Halifax, NS H1N 1C1, Canada
3
Groupe de Recherche en Biologie Végétale, Université du Québec à Trois-Rivières, 3351, boul. des Forges, C.P. 500, Trois-Rivières, QC G9A 5H7, Canada
*
Author to whom correspondence should be addressed.
Appl. Sci. 2020, 10(7), 2531; https://doi.org/10.3390/app10072531
Submission received: 5 March 2020 / Revised: 1 April 2020 / Accepted: 2 April 2020 / Published: 7 April 2020
(This article belongs to the Special Issue New Trends on Algal Biotechnology for a Circular Economy)

Abstract

:
Marine water diatom Phaeodactylum tricornutum is a photosynthetic organism that is known to respond to the changing light environment and adapt to different temperatures to prevent photoinhibition and maintain its metabolic functions. The objective of the present study was to test whether light shift variations in different growth phases impact the growth and lipid metabolism of P. tricornutum. Thus, we investigated R exposure in different growth phases to find the most effective light shift condition. The results showed that substituting white light (W) by red light (R) under autotrophic conditions, a condition called red shift (RS), increased biomass and lipid content compared to levels found under continuous W or R exposure alone. We observed an increase by 2-fold biomass and 2.3-fold lipid content in RS as compared to W. No significant change was observed in the morphology of lipid droplets, but the fatty acid (FA) composition was altered. Specifically, polyunsaturated FAs were increased, whereas monounsaturated FAs decreased in P. tricornutum grown in RS compared to W control. Therefore, we propose that a light shift during the beginning of the stationary phase is a low-cost cultivation strategy to boost the total biomass and lipids in P. tricornutum.

Graphical Abstract

1. Introduction

Diatoms Phaeodactylum tricornutum have an important industrial potential for the production of biofuels, nutraceuticals, cosmetics, valuable lipids, and bioactive molecules. However, the commercial use of diatom biomass is dependent on input energy and nutrient cost. The large-scale cultivation for a single cell organism at the industrial scale is a challenge considering the variables involved (e.g., energy, nutrients, and contamination issues). Diatoms are known to grow in both benthic and planktonic environments, making them capable of adapting in wide range of light spectra [1,2,3].
Light is the regulating parameter that controls the photosynthetic machinery of diatoms and regulates the range of light-induced physiological responses [3]. The systematic use of light energy affects the cellular metabolism, which is crucial to enhance the quantity and quality of diatom biomass for the high production of desired bioactive molecules. Therefore, light should be provided with specific spectral components, intensity, and duration. Multiple ecophysiological studies have been published reporting on the distinct behaviors of different diatoms and algae in response to variations in light [4,5]. It has been shown that light quality has an impact on chloroplast migration and on the light acclimation reactions of photosynthesis [6,7]. Red light has been linked to stimulating growth, ethylene production [8], lipid accumulation [7], and increasing thylakoid stacking [6]. López-Figueroa et al. [9] have suggested the involvement of phytochromes in increasing the intracellular nitrate content on exposure to red light for short periods altering the overall cellular nitrate content. Recent discoveries in genomics have revealed exciting information on phytochromes, blue-light sensing cryptochromes, and aureochromes [10]. In a study by Jungandreas et al. [11], it has been reported that P. tricornutum cells acclimated to both red and blue light have comparable metabolite profiles, but drastic changes in metabolites and carbon partitioning was observed under red to blue light shift. In addition, various interdisciplinary studies have shown that light perceived by the red-light receptor (phytochromes) can regulate nutrient metabolism, cellular events, and signaling cascades [12]. These discoveries are still in progress and much remains unknown, but these studies can be explored for application-based diatom experiments such as developing low-cost cultivation technology or efficient bioreactors.
In both culture medium and natural water bodies, light (intensity, distribution, photoperiod) may vary and will not behave similar to the dissolved salts or nutrients in culture medium. Therefore, the light intensity and color will have different impacts based on the volume of culture, geometrical shape of the reactor, shaker speed, aeration, composition of the culture media, etc. [13]. Considering all these factors and the available literature on the photosensory abilities of P. tricornutum, it is of paramount importance to create an effective light distribution system that can be used for commercial applications while reducing cost of input energy. Some studies have investigated the production of mutants of different antenna size to create an effective strain for efficient light utilization, but this process resulted in a reduced fitness of strains [14,15].
In this study, we aimed to assess if specific shifts in light color enhance the biomass and total lipid content. Thus, we tested the impact of different light colors on P. tricornutum in different growing conditions. Furthermore, we expanded our investigation on timing of red-light exposure and light shift impact on wild-type P. tricornutum growth by analyzing its biomass, lipid, and fatty acid composition. Our research has shown the importance of light color, light availability, and timing of different red light (R) exposures, which can be explored as a strategy to enhance the industrial production of wild-type P. tricornutum biomass and lipid content. This study provides a unique strategy that can be useful for lab and large-scale cultivation.

2. Materials and Methods

2.1. Microalgae Strain and Culture Conditions

The inoculum culture for all experiments was prepared the same: all the experiments were conducted into 250 mL Erlenmeyer flasks containing 50 mL of liquid media with and an initial inoculum size of 0.2 OD. Axenic cultures of P. tricornutum (Culture Collection of Algae and Protozoa CCAP 1055/1) were obtained from Western University, Canada. P. tricornutum cells were grown and maintained in L1 media without silica pH 8 (Artificial Sea Water) as described in [16] in 250 mL Erlenmeyer flasks (50 mL of culture) at 18 ± 1 °C. The experiments were conducted in the growth Chamber CMP6050 with light intensity 75 μE m−2 s−1 and a photoperiod of 16:8 h light/dark cycles. The light source was cool white light F54T5/841, which was kept 60 cm above the bottom of the culture flask. The light conditions were variable by ±1–2 μE m−2 s−1 in different corners of the rotational shaker. The humidity of the chamber was 50% with no additional air supply, and the rotary shaker speed was fixed at 130 rpm.
For experiments, the color spectrum for red (680–700 nm) and yellow (570–590 nm) light was obtained by wrapping the Erlenmeyer flasks using colored cellophane sheets. The light intensity was decreased by 10 μE m−2 s−1 using the red sheet. The growth of microalgae was measured by optical density at 680 nm every 48 h in control white light. The growth curve represented the number of cells plotted as a function of time and could be divided into four phases according to the slope representing the four stages lag, exponential, stationary, and death.

2.2. Experimental Setup for Autotrophic and Mixotrophic Culture under Different Light Colors

The study was divided into two series of experiments. The first set of preliminary experiments studied the impact of three light colors: Red (R), Yellow (Y), and White (W) in both mixotrophic and autotrophic conditions under the growth conditions explained above. All the experiments were conducted into 250 mL Erlenmeyer flasks containing 50 mL of liquid media with and an initial inoculum size of 0.2 OD. For mixotrophic cultivation, glucose or glycine was added to the L1 media at a concentration of 1%, which were labeled as 1 and 2, respectively. The experiment identifications are shown in Table 1. In this experiment, all the cultures were exposed to the conditions for the complete culture duration (i.e., from day 1 to day 10). We harvested the cultures at day 10 during the stationary phase.
In the second series of experiments, the microalgae culture in autotrophic growth conditions was exposed to a light shift from red light to white light in different growth phases (Table 2). For this, P. tricornutum culture was submitted to red light treatment during the specific growth phase i.e., lag, exponential, stationary, and then cultures were exposed to white light labeled as RT1, RT2, RT3, and RS (Table 2). All experiments were done in triplicate. All the inoculum for these experiments were grown in control white light.

2.3. Cell Growth and Biomass Analysis

Wild-type P. tricornutum was cultured in 5 mL of L1 medium in a flat-bottomed sterile 6-well culture plate with a lid (Costar®, Cat no. 3516). The cultures were maintained with consistent shaking on an orbital shaker at 130 rpm. Cell growth was monitored by measuring the optical density at 680 nm using a Synergy H1 Microplate Reader, BioTek. All the conditions were studied in triplicate.
The biomass was estimated by dry weight from the centrifuging of P. tricornutum cultures at 7000× g for 10 min on the 10th day. The supernatant was discarded, and the pellet was dried at 60 °C for biomass analysis until the constant mass was achieved.

2.4. Visualization of Lipid Bodies

Intracellular lipid bodies (LBs) were visualized using a modified Nile Red (9-diethylamino-5H-benzo[a]-phenoxazine-5-one) staining method [17,18]. Briefly, 1 mL of the algal culture was centrifuged at 10,625× g for 10 min. Then, the cell pellet was resuspended in 500 µL of 20% dimethyl sulfoxide (DMSO) and vortexed for 1 min at room temperature. Cells were centrifuged at 10,625× g for 5 min, and the cell pellet was resuspended in 500 µL of water and vortexed before adding Nile red solution (0.5 mg mL−1 dissolved in acetone) and incubated for 5 min in dark at room temperature. Stained LBs imaging was performed under a confocal laser scanning microscope (Leica SP8) using 40× magnification. The Nile red fluorescence was detected using a UV light source at excitation/emission wavelengths of 488 and (490–550) nm.

2.5. Quantification of Total Lipids

Total lipids were extracted using Bligh and Dyer method [19] with the following modifications. To a 5 mL Eppendorf tube containing a known amount of dry algal biomass, mixtures of methanol and chloroform were added in 2:1 ratio. The mixture was vortexed for 2 min and incubated at room temperature for 24 h, after which 1 mL of chloroform and 0.9 mL of water were added. The mixture was vortexed for 2 min, and the different layers were separated by centrifugation for 10 min at 300× g. The lower layer was evaporated, and the residue was dried at 80 °C for 30 min. The weight was calculated using a precision scale.

2.6. Nile Red Screening

In order to detect neutral lipids, Nile red assay [20,21] was done in 96-well plate. Briefly, 250 µL of culture was added with 15 µL of Nile red dissolved in acetone from the stock solution of 0.5 mg mL−1. The plate was incubated in the dark at room temperature for 30 min. The fluorescence intensity was measured at an excitation of 530 nm and emission of 590 nm using a Synergy H1 Microplate Reader, BioTek.

2.7. Fatty Acid Profiling

Fatty acid methyl esters were prepared directly from the wet algal biomass. NaOH in methanol (1 mL of 0.5 N) was added to test tubes containing the biomass; then, the tubes were placed in a sonicating bath for 3 min, followed by heating at 90 °C for 10 min. The samples were allowed to cool, and 1 mL of 1.5% H2SO4 in methanol was added. Then, samples were heated again at 90 °C for 10 min. After cooling, 1 mL of water and 1 mL of hexane were added. Test tubes were vortexed for 2 min and then centrifuged at 1200× g for 5 min. The hexane layer containing Fatty acid methyl esters analysis (FAME) was recovered and dried over anhydrous sodium sulfate. FAME were quantified using temperature-programmed gas liquid chromatography on a Scion 436 gas chromatograph fitted with a 30 m × 0.25 mm column coated with 50% cyanopropyl-methylpolysiloxane (DB-23) and linked to a computerized integration system [22]. The fatty acid data were expressed as the mass percent of total fatty acid identified. Furthermore, the fatty acid profile was used to analyze the physical properties of biodiesel using biodiesel analyzer [21,23,24].

2.8. Statistical Analysis

All experiments were conducted in triplicate. Statistically significant differences were identified by one-way ANOVA performed on data with a 5% level of probability (p < 0.05) using GraphPad Prism software 8.1.2. followed by a pairwise mean comparison Tukey’s test conducted where differences were detected.

3. Results and Discussion

3.1. Effect of Light Colors on Biomass and Lipid Yield in Mixotrophic and Autotrophic Conditions

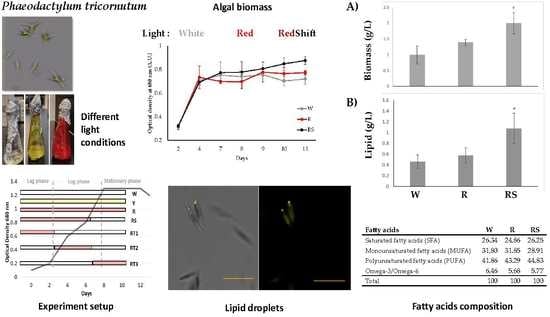
For the mixotrophic conditions, two different carbon sources were used by supplementing the standard L1 media with 1% glucose (W1, Y1, and R1) or 1% glycine (W2, Y2, and R2). The highest biomass was achieved under the red light condition compared to white or yellow light (Figure 1A). Specifically, the level of biomass productivity obtained in autotrophic growth (R) was significantly higher by 1.16 and 1.05-fold compared to W and Y autotrophic conditions, respectively. Our results are in agreement with multiple studies that have reported an increased higher production rate of Scenedesmus sp. under red and blue light [25] and Nannochloropsis sp. under red and yellow light [26]. No additional biomass was obtained in R1 or R2 conditions compared to R, suggesting that mixotrophic conditions are less interesting for an industrial application.
The lipid production of P. tricornutum was only different, and significantly higher, in red light autotrophic (R) or mixotrophic supplemented with glycine (R2) conditions (Figure 1B). The latter was expected, as studies have reported an increase in biomass and lipids by multi-fold under mixotrophic conditions in different species [27,28]. Furthermore, many studies have shown a positive trend of red light with an increase in the specific growth rate and lipid production in Chlorella, Botryococcus, and Nannochloropsis [7,26,29]. Another study showed a positive trend of the combined impact of red and blue light on biomass productivity and fucoxanthin production in P. tricornutum [30]. However, contrasting results have been reported where they observed high productivity under yellow light as compared to red and blue light for Chlamydomonas reinhardtii [13]. However, these experiments were conducted in turbidostat controlled lab-scale panel photobioreactors and reported that in mass culture, productivity and biomass specific light absorption are inversely correlated [13]. Furthermore, in the same study, they have reported that the supplementation of blue light to yellow light is better for stable cultivation.
The growth of microalgae in mixotrophic conditions is an interesting choice for enhancing the productivity of particular metabolites, which will vary according to the product of interest wanted [31]. However, there are cost-effective and economic advantages to growth in mixotrophy if the carbon source is derived from cheap waste resources such as agricultural and municipal wastewater that are rich in micronutrients and carbon sources [32]. There has been in-depth research conducted on the impact of varied carbon source such as glucose, fructose, and glycerol on enhancing the biomass of P. tricornutum [31,33]. A relevant point to consider when comparing results from red light with those of red light combined with blue, or other wavelengths is that the monochromatic red light corresponds to the absence of the others. However, our results, combined with findings from several published studies, have shown the importance of monochromatic light or the mixing of wavelengths on the biomass and lipid production in different microalgae species as discussed above [7,13,25,26]. This motivated us to further optimize the photoautotrophic conditions.

3.2. Growth Curve Analysis of P. tricornutum during Red Light Shift

Studies have reported that light color and intensity bring changes in the photon flux density, which have a strong impact on growth and metabolic pathways [32,33]. Photoautotrophic conditions create certain limitations when grown in bioreactors because self-shading by microalgal cells in high-density cultures limits the light available for growth, which can be confirmed in lab-scale experiments by observing the growth curve. Therefore, to reduce the impact of either loss of light as heat or self-shading, the strategy of light shifting from one spectrum to another can trigger different photoreceptors to activate different light-signaling pathways, allowing a better conversion of light energy [34,35,36]. Therefore, we investigated the effect of red light shifts on P. tricornutum growth during different growth phases under batch cultivation for 11 days.
P. tricornutum grown in red light until the end of exponential phase (from day 1 to 7) and then shifted to white light (RS) showed the greatest growth compared to all other conditions tested (Figure 2, Appendix AFigure A1). In addition, RS is significantly better to promote growth compared to continuous white (W) or red light (R) (Figure 2).
P. tricornutum cultured cells were adapting to each condition in a similar manner during the adaptation and exponential phases (Figure 2). It should be noted that there seems to be a crucial lag between day 4 and day 7 (exponential to stationary), where it is not clear whether cell growth continued before slowing down (Figure 2). Additionally, the slight difference between R and RS at day 7 is unexpected, since they were under the same conditions. It is possible that these small differences are due to replicate variation and growth chamber light variations. Indeed, when we checked the light intensity using the flux meter, we observed a variation in light intensity of 1–2 μE m−2 s−1 between the different corners of the growth chamber, which could explain the variation between R and RS at day 7 and the width of the error bars. However, major differences in growth were observed at the end of the exponential phase and during the stationary phase, where RS clearly promoted growth compared to other treatments (Figure 2; Appendix AFigure A1). Indeed, at day 11, the RS growth was significantly higher with 22% and 14% more cells than continuous W and R light, respectively (Figure 2). The cell growth observed under R and RS treatment can be explained, in part, by the presence of a wide range of photoreceptors with the ability to sense red/far-red wavelengths and their potential to prevent photoinhibition [30,32]. A similar study has reported the increasing growth of P. tricornutum under defined and efficient combinations of red and blue lights [30]. Another study has shown the positive impact of supplementing different light colors on Chlamydomonas reinhardtii culture [13]. Through various studies, it was suggested that different classes of photoreceptors have specific responses to specific light mediated by different light-signaling pathways that are yet to be completely elucidated [2,37,38]. The other physiological phenomenon that can change the culture conditions is the rate of photoinhibition, which seems to be higher in W as compared to R. The energy of each photon is inversely proportional to the wavelength. For example, R (λ = 700 nm) is 1.8 eV, whereas blue light (λ = 450 nm) is 2.8 eV. The W or full spectrum (λ = 400–700 nm) tends to cause photoinhibition, inducing cell damage and reducing the overall time of stationary phase as compared to R (Figure 2). Since the cumulative wavelength of red in R is lower than that in W, it may prevent photoinhibition and consequently lead to higher growth and overall biomass [39]. Similar results have been reported for Chlorella sp. [39] and Scenedesmus sp. [25]. In all, the RS further increased growth, which can be attributed to the use of different photoreceptors and the reduction of photoinhibition.
Interestingly, the timing of light shift was important. Indeed, red light shifts during other growth phases (lag, exponential, and stationary phase (RT1, RT2, and RT3) were not efficient to increase biomass compared to RS (Appendix AFigure A1). Future work should investigate other experimental strategies to study circadian rhythms and photosynthesis during light shift conditions.

3.3. Analysis of Total Biomass and Lipid Content under Red Light Shift Treatment

The biomass of P. tricornutum was significantly greater with RS treatment by 2-fold and 1.4-fold compared to W and R conditions, respectively (Figure 3A). This correlates with increased cell density (Figure 2). In addition, our results confirm observations from another study on the impact of red light where biomass increased by 40% under enriched red light [40]. Similarly, another study reported better growth and higher fucoxanthin content in P. tricornutum under red and blue light [30]. That study is similar to our treatment RS, where we have supplied a red wavelength for the first 7 days and then exposed the culture to the white light during the stationary phase. Furthermore, it has been reported that cultured P. tricornutum under R contains a greater number of thylakoids, where light-dependent reactions occur, compared to P. tricornutum cultured in W [41]. On a wider scale, the impact of red light on the ultrastructure of chloroplasts and creating superstacks of thylakoid membrane in diatoms suggest that R will affect photosynthesis, cell division, and consequently promote biomass accumulation [41]. Altogether, the data suggest that the use of red light and variations thereof improves the overall biomass of P. tricornutum at the laboratory scale, offering a promising first stage, which should be pursued at a larger scale to be considered a useful strategy for industrial applications.
Total lipids were also analyzed in the same conditions, using dry weight estimation. Nile red assay was used for rapid screening of lipid and confocal microscopy for visual analysis, as described previously [20]. P. tricornutum produces lipids that are potentially significant for several industrial applications. It has been reported that the crude lipids extracted from P. tricornutum are around 321.89 mg/g dry weight [42] or 34% of dry weight [43] and are comparable to the lipid extracted in W in our study, which is 0.4 g/g dry weight in control white light. Furthermore, the lipid dry weight in RS was significantly increased to 2.3-fold and 1.8-fold as compared to W and R, respectively (Figure 3B). It is interesting to note the 1.8 fold increase in lipid from R to RS, which suggests that shifting from red light to full spectrum during the stationary phase has an impact on lipid accumulation. It is known that the usual change in the lipid composition is influenced by the cellular C/N ratio, light intensity, nutrient depletion, and other possible inducible biotic/abiotic stress conditions [28,29,30]. An increase in C/N ratio, lipid, and carbohydrate in red light acclimated P. tricornutum culture has been reported [11]. The same study reported an increase in the lipid content from red light to blue light shift, whereas the reverse shift, from blue to red light, promoted an increase in carbohydrates. In addition, lipid accumulation under red light has been observed in Botryococcus sp. [7] and Chlorella sp. [29], which can be linked with effective nitrogen consumption rate and a doubling of cell numbers in red light, which aids in increasing the total lipid content. In addition, high light intensity has been shown to affect lipid biosynthesis in Nannocloropsis gaditana, which has been correlated with the regulation of cytosolic fatty acid synthase of type 1 (FAS1) [44] and polyketide synthase (PKS) and the down-regulation of the chloroplast fatty acid synthase of type 2 (FAS2) [45]. One of the studies has reported a significant increase in lipids in P. tricornutum at low light, which is in the range of (30 μmol photons m−2 s−1) and medium light (300 μmol photons m−2 s−1) [46]. Therefore, lower intensities or light shift treatment may also affect the expression levels of the cytosolic and chloroplastic fatty acid synthases, which in turn would regulate lipid content. Various studies have shown the relation between wavelength, specific wavelength, and wavelength shift on the accumulation of lipids, which can be attributed to enzymes involved in carbon cycle and lipid synthesis [11,40,47]. Therefore, it appears that the combined effect of red-light acclimation and lower light intensity, observed by the red sheet, which reduces light intensity by 10 μE m−2 s −1, may be acting together to increase the total lipids in RS (Figure 3B).

3.4. Visual Analysis of P. tricornutum Cell Morphology and Lipid Droplets

We next examined P. tricornutum lipid droplets using confocal microscopy (Figure 4). Our initial expectation based on a gravimetric analysis of lipids was to observe a change in the lipid droplet size. The results showed that the selected light conditions were not responsible for any changes in the morphology, size, or number of lipid droplets of P. tricornutum cultures grown in the studied light conditions (Figure 4a,b). The morphological changes in cells are important for microbes to respond to various environmental conditions such as the state of media, the temperature, or the salinity. Previous studies have reported the presence of three morphotypes in P. tricornutum culture: oval, fusiform, and triradiate [48]. It is also known that light absorption is the function of the cell shape, size, and pigments [49]. Microscopic analyses (Figure 4c,d) revealed a high occurrence of fusiform cells, a limited number of triradiate shapes, and no appearance of the oval form in all of our growth conditions. It has been reported that the fusiform type is dominant in suspension culture over the other forms [43,50], which is in agreement with our tested conditions. It has also been reported that the triradiate P. tricornutum cells are rarely found in laboratory growth conditions [1,43]. However, our study detected the presence of a limited number of triradiate cells (Appendix AFigure A2). P. tricornutum can be grown in both silicon or silicon-free medium; we studied silicon-free media, as it showed better growth for our strain, and it has been reported that fusiform cells have a greater lipid percentage as compared to other forms [43,51].

3.5. Fatty Acid Methyl Esters Analysis (FAMEs)

Polyunsaturated fatty acids (PUFA) were present in greatest abundance, followed by monounsaturated fatty acids (MUFA) and lower amounts of saturated fatty acids (SFA), which constituted 41.86%, 31.80%, and 26.34%, respectively (Table 3). MUFA levels were lower in RS (28.91%) compared to W (31.80%) or R (31.85%) (Table 3). In addition, the P. tricornutum PUFA ratio of omega-3/omega-6 was lower in R and RS compared to control W (Table 3). The evidence suggests that a high ratio of dietary omega-3/omega-6 PUFAs reduces the risk of several diseases [52]. Therefore, P. tricornutum cultured in W is a potentially more valuable source of functional food and animal feed components than P. tricornutum cultivated under R or RS conditions. These results suggest that the RS condition regulated the fatty acid content in P. tricornutum, specifically lowering MUFAs and increasing PUFAs. It has been reported that stress conditions such as nitrogen depletion, high and low temperature, and continuous high light intensity impacts fatty acid composition, specifically PUFA in P. tricornutum [53,54,55].
The distribution of fatty acids was characterized (Appendix A; Table A1), and various lipid classes of P. tricornutum are summarized in Table 4. The main lipid components were mid-chain FAs, 14:0, 16:0, 16:1n-7, and 20:5n-3, which together represented 76.46% of total fatty acids (Table 4). Our results are similar to those reported by [42]. Palmitoleic acid (16:1n-7), which constituted 28.20% of the total FAs, was predominant in P. tricornutum control (W) but was reduced to 24.29% in RS condition (Appendix A; Table A1). Interestingly, hexadecatrienoic acid (16:3n-4) was increased in R and RS compared to W (Appendix A; Table A1). There was a comparable amount of the omega-3 fatty acid, eicosapentaenoic acid (20:5 n-3), in all light conditions and it constituted almost 22% of total acids, which was the second most predominant FA (Table 4). In other studies, it was the PUFA that was present in highest mass proportions [53,54,55]. Humans do not produce sufficient long-chain omega-3 fatty acids to meet their physiological needs; therefore, it is essential to obtain them from external sources. Omega-3 fatty acids have been associated with proper fetal development, including neuronal, retinal, and immune function [56]. They have also shown positive effects on coronary disease and inflammation, and they have been approved for the treatment of patients with severe hypertriglyceridemia [33]. These fatty acids are predominantly found in cold water fish, such as salmon. However, our work suggests that microalgae and diatoms can be considered as a sustainable and vegetarian source of omega-3 fatty acids.
The structural features (chain length, unsaturation, and branching) of fatty acids determine the properties of algae-derived biodiesel, including ignition quality, heat of combustion, cold flow, oxidative stability, exhaust emissions, viscosity, and lubricity [57]. Thus, the major fractions of fatty acid composition, which was accepted as input in the Biodiesel Analyzer, were studied for properties of biodiesel [23] (Table 5). For biofuel of an industrial quality, it needs to have similar physical properties as diesel, which can be used efficiently in combustion engines. According to a study, fatty acids with chain lengths ranging from C16 to C18 should be high in potential feedstock for suitable biodiesel production [58]. It is suggested that FAME with a high percentage of monounsaturation (C16–C18) is the most desirable compromise between cold flow and oxidative stability [59]. The W and R induced the production of monounsaturated fatty acids as compared to RS. The total percent of saturation and unsaturation—especially the amount of long-chain polyunsaturated fatty acids such as eicosapentaenoic acid (EPA) and docosahexaenoic acid (DHA)—will have an impact on the biodiesel fuel properties [60]. The results showed that the cetane number (CN), which determines the ignition quality of the fuel, is higher in P. tricornutum cultured in R and RS as compared to W (Table 5). It is known that the higher the CN, the better the ignition of the fuel and vice versa [57]. Literature studies have also mentioned that increases in the degree of unsaturation lead to decreases in CN viscosity, which is a useful measure for monitoring oxidation progression. As reported, fuels with high viscosity meeting the international standards have better lubricating quality, which increases the life of the engine [61]. In the same study, there is a relationship between hydrocarbon (HC) emission and viscosity. The HC emissions increase with decreasing viscosity [61]. In our study, the viscosity is lower in all the conditions comparing the standard requirement of EN 14214:2008, but it meets the requirement of ASTM D6751.
Since this study presents the importance of light as a crucial factor for affecting biomass and lipid content in P. tricornutum, it supports its importance in metabolic processes of microalgae in the biotechnology field. However, the specific behavior of each species may be unique with respect to the varied light conditions, as supported by the following evidence studied in an interdisciplinary approach. For example, Orefice et al. [62] showed that the fluctuation of red light on blue light spectral distribution affected the metabolic state of cells via increase in non-photochemical quenching and ultimately promoting an increase in carbohydrates, glycolipids, and saturated fatty acids in Skeletonema marinoi [62]. In another study, it was observed that different doses of blue wavelengths cause significant alternations in the growth cycle of Skeletonema marinoi [63]. The change in the growth pattern and biochemical composition can be referred to the ability of diatoms and microalgae to finely balance the light-harvesting and photoprotective capacity [64,65,66,67]. The ability of diatoms to respond favorably to red light is given to the presence of various photoreceptors such as phytochromes and exclusive aureochromes that are involved in the RL signaling process in P. tricornutum [68,69,70]. In a different approach using spectroscopy, the occurrence of red-shifted fucoxanthin-chlorophyll protein (FCP) showing the fluorescence peak at 714 nm was observed [71]. It is considered that Phaeodactylum red-shifted FCP is involved in enhancing the light-harvesting ability of cells by the prolonged excited state lifetimes and the absorption spectrum extended to wavelengths longer than 700 nm [71]. In general, the clarity in the relationship between diatoms and light is still an open topic for researchers to study both fundamental as well as industrial applications.
For the conclusion of this study, an effect of the specific RS light shift condition in the fatty acid composition was observed that can be important in applications in both human nutrition and renewable energy. Overall, it is interesting to note that changes in the specific wavelength during the stationary phase can impact the total accumulation of lipid and fatty acid composition.

4. Conclusions

In summary, the present study investigated the impact of red light (R) and a red light shift to full spectrum (RS) on P. tricornutum cell growth, biomass, and lipid production. The introduction of the RS during the beginning of the stationary phase in the cultures of P. tricornutum had a positive impact on both biomass and lipid production. This is due to the favorable light pattern, as red light-acclimated cells during the lag and exponential phases provide better conditions for cellular and development processes and white light during the stationary phase helps in the accumulation of more lipids as compared to a single spectrum of light. It was also discovered that the specific light wavelength R and RS had an impact on regulating the level of polyunsaturated fatty acids (PUFAs), specifically the omega-3 fatty acid eicosapentaenoic acid (20:5 n-3). Moreover, a light shift can be an effective system to reduce the negative effects of self-shading and the proper distribution of light in large-scale photobioreactors. However, more detailed studies on photosystems and metabolite distribution in time-scale patterns are necessary to bring more clarity about wavelength shifts and lipid accumulation. In addition, the experiment is easily replicable and scalable in developing countries with fewer resources. This system has the potential to be used to enhance the productivity while reducing the loss of biomass because of potentially excessive heat generation and self-shading due to high-density cultures. The acclimation and light shift studies for different species of microalgae such as diatoms, in both autotrophic and mixotrophic conditions, will open new avenues for algal biotechnology to help produce a wide range of special metabolites.

Author Contributions

Conceptualization, N.S.; F.M.-M.; H.G., and I.D.-P.; methodology, N.S.; F.A.; F.M.-M.; H.G. and I.D.-P.; validation, N.S.; G.F.; F.A.; M.C.; S.M.B.; F.M.-M.; H.G., and I.D.-P.; formal analysis, N.S.; F.A.; F.M.-M. and I.D.-P. investigation, N.S.; G.F.; and F.A.; writing—original draft preparation, N.S.; F.A.; F.M.-M. and I.D.-P.; writing—review and editing, N.S.; G.F.; F.A.; M.C.; F.M.-M.; S.M.B.; H.G. and I.D.-P.; supervision, H.G. and I.D.-P.; project administration, I.D.-P.; funding acquisition, I.D.-P. All authors have read and agreed to the published version of the manuscript.

Funding

This research was funded by the Natural Sciences and Engineering Research Council of Canada—Engage grant reference no CRDPJ/530085-18 to IDP. All students (N.S., G.F., and M.C.) and postdoctoral fellows (F.A.) are supported by Mitacs—Acceleration program grant no IT12310 to IDP.

Acknowledgments

The authors wish to thank the industrial collaborator Mather Carscallen, PhD and Algae-C for sample and support. Bogumil Karas from Western University is acknowledged for providing the diatom culture. Additionally, a very special thanks to Mélodie B. Plourde and Guy Samson from UQTR for their precious discussion and information on confocal microscopy and photosynthesis respectively.

Conflicts of Interest

The authors declare no conflict of interest.

Abbreviations

LBLipid bodies
WWhite light
RRed light
YYellow light
RSRed light shift
RT1-RTRed light treatment
SFASaturated fatty acid
PUFAPolyunsaturated fatty acids
MUFAMonounsaturated fatty acids
FAMEsFatty acid methyl ester

Appendix A. Supplementary Information

Our study showed that red light in autotrophic condition proved to be an affordable and effective option to increase P. tricornutum biomass and lipid accumulation. Thus, in the second series of experiments, we further explored the effect of red light on P. tricornutum biomass and lipid accumulation in autotrophic conditions. Several studies had reported that light color and intensity bring changes in the photon flux density, which have a strong impact on the growth and metabolic pathways [31,56].
Light shift from one spectrum to another will change the light ambience and culture environment, which can trigger different photoreceptors to activate signaling pathways allowing a better conversion of light energy. However, the exact growth phase on which to exert a light shift is unknown. Thus, we investigated the effect of red light shift on P. tricornutum growth during different growth phases under batch cultivation for 10 days (Appendix AFigure A1). Specifically, the effect on growth was studied using optical density for six conditions. The impact of red light shift to a full spectrum during different growth phases i.e., lag, exponential, and stationary are labeled as RT1, RT2, RT3; RS (Table 2), along with continuous red light (R), was investigated. RT2 and RT3 were found to be less effective at promoting growth, whereas RS was significantly better to promote P. tricornutum growth (Appendix AFigure A1).
Figure A1. Analysis of P. tricornutum growth determined using optical density at 680 nm in different light conditions: red light during the exponential phase and then shifting in the stationary phase (RS), red light exposure during the lag phase (RT1), red light during the exponential phase (RT2), and red light during the stationary phase (RT3).
Applsci 10 02531 g0a1
The red light shift treatment during the specific growth phases—lag, exponential, and stationary phase (RT1, RT2, and RT3)—was not an efficient method to increase growth (Figure A1). Thus, these treatments are not interesting for our investigation, since we aimed to enhance the overall biomass and total lipid count. Similarly as observed in Figure 2, a lag is observed between day 4 and day 7 (exponential to stationary) where it is not clear whether cell growth continued before slowing down (Figure A1). However, RT1, RT2, and RT3 could be interesting parameters to consider for studying bonafide metabolic pathways in diatoms once there is more information on the characterization of these photoreceptors such as phytochromes.
Cell morphology is sometimes indicative of changes in response to stress. Three morphotypes in P. tricornutum culture have been reported: oval, fusiform and triradiate [48]. Microscopic analyses (Figure 4c,d) revealed a high occurrence of fusiform cells, a limited number of triradiate-shaped cells, and no appearance of the oval form in all of our growth conditions. However, our study showed the presence of a limited number of triradiate cells (Appendix AFigure A2).
Figure A2. Light microscope images of Phaeodactylum tricornutum in different light conditions (A) in white light and (B) in red light.
Applsci 10 02531 g0a2
Table A1. GC analysis of fatty acid compositions in each culture condition (W, R, and RS). Results (mass% of identified fatty acids) are expressed as mean ± SD of three replicates for each culture conditions. Highlighted means ± SD are most abundant FAs.
Common NameC:D n-xWRRSCommon NameC:D n-xWRRS
Myristic acid14:08.64 ± 0.177.54 ± 0.028.39 ± 0.55Linoleic acid18:2n-61.41 ± 0.251.51 ± 0.131.62 ± 0.21
14:1n-90.01 ± 0.010.00 ± 0.000.00 ± 0.00 18:2n-40.00 ± 0.000.00 ± 0.000.00 ± 0.00
14:1n-70.00 ± 0.000.00 ± 0.000.00 ± 0.00γ-Linolenic acid18:3n-60.18 ± 0.110.23 ± 0.00.21 ± 0.08
Myristoleic acid14:1n-50.08 ± 0.020.09 ± 0.010.08 ± 0.01 18:3n-40.01 ± 0.010.05 ± 0.020.06 ± 0.03
i-15:00.01 ± 0.010.00 ± 0.000.00 ± 0.00α-Linoleic acid18:3n-30.44 ± 0.060.36 ± 0.040.41 ± 0.04
ai-15:00.01 ± 0.010.00± 0.000.00 ± 0.00 18:3n-10.21 ± 0.060.60 ± 0.070.64 ± 0.14
15:00.28 ± 0.070.26 ± 0.010.25 ± 0.03Stearidonic acid18:4n-30.21 ± 0.060.21 ± 0.030.23 ± 0.05
i-16:00.12 ± 0.050.13 ± 0.020.12 ± 0.02 18:4n-10.01 ± 0.010.02 ± 0.010.02 ± 0.01
Palmitic acid16:015.18 ± 2.6414.80 ± 1.8015.24 ± 3.67Arachidic acid20:00.00 ± 0.000.08 ± 0.010.08 ± 0.02
16:1n-110.00 ± 0.000.00 ± 0.000.00 ± 0.00 20:1n-110.00 ± 0.000.00 ± 0.000.00 ± 0.00
Hypogeic acid16:1n-91.79 ± 0.422.99 ± 0.072.78 ± 0.51Gondoic acid20:1n-90.03 ± 0.010.04 ± 0.010.00 ± 0.00
Palmitoleic acid16:1n-728.20 ± 0.9527.17 ± 1.5924.39 ± 1.07Paullinic acid20:1n-70.01 ± 0.010.02 ± 0.010.04 ± 0.02
16:1n-50.12 ± 0.010.09 ± 0.080.10 ± 0.07 20:2n-90.00 ± 0.000.00 ± 0.000.00 ± 0.00
17:1(a)0.00 ± 0.000.01 ± 0.010.01 ± 0.01Eicosadienoic acid20:2n-60.09 ± 0.030.10 ± 0.010.08 ± 0.03
i-17:00.00 ± 0.000.00 ± 0.000.00 ± 0.00Dihomo-γ-linolenic acid20:3n-60.05 ± 0.020.08 ± 0.020.07 ± 0.01
16:2n-60.94 ± 0.201.13 ± 0.111.16 ± 0.19Arachidonic acid20:4n-60.33 ± 0.050.62 ± 0.050.46 ± 0.08
ai-17:00.06 ± 0.000.09 ± 0.010.07 ± 0.04Eicosatrienoic acid20:3n-30.06 ± 0.030.05 ± 0.020.06 ± 0.02
17:1(b)0.00 ± 0.000.00 ± 0.000.00 ± 0.00Eicosatetraenoic acid20:4n-30.18 ± 0.010.21 ± 0.020.24 ± 0.04
Hexadecadienoic acid16:2n-43.53 ± 0.623.63 ± 0.273.85 ± 0.30Eicosapentaenoic acid20:5n-322.53 ± 1.2321.59 ± 1.9822.15 ± 3.24
Hexadecatrienoic acid16:3n-60.96 ± 0.220.60 ± 0.150.76 ± 0.25Behenic acid22:00.16 ± 0.010.19 ± 0.010.20 ± 0.02
17:00.03 ± 0.010.04 ± 0.010.04 ± 0.01 22:1n-110.08 ± 0.020.06 ± 0.010.07 ± 0.02
Hexadecatrienoic acid16:3n-46.64 ± 1.309.47 ± 0.839.67 ± 1.64Erucic acid22:1n-90.09 ± 0.020.06 ± 0.010.07 ± 0.01
17:10.08 ± 0.030.11 ± 0.010.09 ± 0.03 22:1n-70.02 ± 0.020.01 ± 0.010.01 ± 0.01
16:4n-30.03 ± 0.010.03 ± 0.010.03 ± 0.01Docosadienoic acid22:2n-60.11 ± 0.040.08 ± 0.010.09 ± 0.03
16:4n-11.35 ± 0.290.71 ± 0.040.73 ± 0.07 21:5n-30.01 ± 0.010.00 ± 0.000.01 ± 0.01
Stearic acid18:00.40 ± 0.100.39 ± 0.060.42 ± 0.13 23:00.05 ± 0.020.02 ± 0.010.05 ± 0.01
18:1n-130.02 ± 0.010.01 ± 0.010.02 ± 0.01Adrenic acid22:4n-60.03 ± 0.020.02 ± 0.010.02 ± 0.01
18:1n-110.00 ± 0.000.00 ± 0.000.00 ± 0.00Osbond acid22:5n-60.02 ± 0.010.01 ± 0.010.02 ± 0.01
Oleic acid18:1n-90.75 ± 0.420.71 ± 0.130.66 ± 0.34 22:4n-30.00 ± 0.000.01 ± 0.010.03 ± 0.02
Vaccenic acid18:1n-70.21 ± 0.010.23 ± 0.030.23 ± 0.03Docosapentaenoic acid22:5n-30.19 ± 0.040.00 ± 0.000.18 ± 0.06
18:1n-50.12 ± 0.030.13 ± 0.010.16 ± 0.02Lignoceric acid24:01.32 ± 0.111.30 ± 0.021.41 ± 0.03
18:2d5.110.04± 0.020.06 ± 0.010.09 ± 0.02Docosahexanoic acid22:6n-32.23 ± 0.271.72 ± 0.081.96 ± 0.27
Rumenic acid18:2n-70.01 ± 0.010.02 ± 0.010.02 ± 0.01Nervonic acid24:1n-90.17 ± 0.010.11 ± 0.030.16 ± 0.04

References

  1. Martino, A.D.; Meichenin, A.; Shi, J.; Pan, K.; Bowler, C. Genetic and phenotypic characterization of Phaeodactylum tricornutum (Bacillariophyceae) accessions1. J. Phycol. 2007, 43, 992–1009. [Google Scholar] [CrossRef]
  2. Depauw, F.A.; Rogato, A.; Ribera d’Alcalá, M.; Falciatore, A. Exploring the molecular basis of responses to light in marine diatoms. J. Exp. Bot. 2012, 63, 1575–1591. [Google Scholar] [CrossRef] [Green Version]
  3. Vejrazka, C.; Janssen, M.; Benvenuti, G.; Streefland, M.; Wijffels, R.H. Photosynthetic efficiency and oxygen evolution of Chlamydomonas reinhardtii under continuous and flashing light. Appl. Microbiol. Biotechnol. 2013, 97, 1523–1532. [Google Scholar] [CrossRef]
  4. Dring, M.J. Photocontrol of Development in Algae. Annu. Rev. Plant Physiol. Plant Mol. Biol. 1988, 39, 157–174. [Google Scholar] [CrossRef]
  5. Furukawa, T.; Watanabe., M.; Shihira-Ishikawa., I. Green- and blue-light-mediated chloroplast migration in the centric diatom Pleurosira laevis. Protoplasm 1998, 203, 214–220. [Google Scholar] [CrossRef]
  6. Holdsworth, E.S. Effect of growth factors and light quality on the growth, pigmentation and photosynthesis of two diatoms, Thalassiosira gravida and Phaeodactylum tricornutum. Mar. Biol. 1985, 86, 253–262. [Google Scholar] [CrossRef]
  7. Acuapan-Hern, J.; Canizares-Villanueva, R.O.; Cristani-Urbina, E. Red Light and Nitrogen Depletion Stimulate the Synthesis of Lipids and N-Alkadienes Susceptible to be Used as Biofuels in Botryococcus braunii UTEX 2441 (Race A). Biotechnol. Indian J. 2017, 13, 155. [Google Scholar]
  8. Kreslavsky, V.D.; Kobzar, E.F.; Muzafarov, E.N. Effect of red radiation, kinetin and linuron on growth and ethylene production in Chlorella. Biol. Plant. 1997, 39, 427–430. [Google Scholar] [CrossRef]
  9. López-Figueroa, F.; Rüdiger, W. Stimulation of Nitrate Net Uptake and Reduction by Red and Blue Light and Reversion by Far-Red Light in the Green Alga Ulva Rigidal. J. Phycol. 1991, 27, 389–394. [Google Scholar] [CrossRef]
  10. Armbrust, E.V.; Berges, J.A.; Bowler, C.; Green, B.R.; Martinez, D.; Putnam, N.H.; Zhou, S.; Allen, A.E.; Apt, K.E.; Bechner, M.; et al. The Genome of the Diatom Thalassiosira Pseudonana: Ecology, Evolution, and Metabolism. Science 2004, 306, 79–86. [Google Scholar] [CrossRef] [Green Version]
  11. Jungandreas, A.; Costa, B.S.; Jakob, T.; von Bergen, M.; Baumann, S.; Wilhelm, C. The Acclimation of Phaeodactylum tricornutum to Blue and Red Light Does Not Influence the Photosynthetic Light Reaction but Strongly Disturbs the Carbon Allocation Pattern. PLoS ONE 2014, 9, e99727. [Google Scholar] [CrossRef] [PubMed] [Green Version]
  12. Wang, H.; Wang, H. Phytochrome Signaling: Time to Tighten up the Loose Ends. Mol. Plant 2015, 8, 540–551. [Google Scholar] [CrossRef] [PubMed] [Green Version]
  13. de Mooij, T.; de Vries, G.; Latsos, C.; Wijffels, R.H.; Janssen, M. Impact of light color on photobioreactor productivity. Algal Res. 2016, 15, 32–42. [Google Scholar] [CrossRef] [Green Version]
  14. Bonente, G.; Formighieri, C.; Mantelli, M.; Catalanotti, C.; Giuliano, G.; Morosinotto, T.; Bassi, R. Mutagenesis and phenotypic selection as a strategy toward domestication of Chlamydomonas reinhardtii strains for improved performance in photobioreactors. Photosynth. Res. 2011, 108, 107. [Google Scholar] [CrossRef]
  15. Kirst, H.; García-Cerdán, J.G.; Zurbriggen, A.; Melis, A. Assembly of the Light-Harvesting Chlorophyll Antenna in the Green Alga Chlamydomonas reinhardtii Requires Expression of the TLA2-CpFTSY Gene. Plant Physiol. 2012, 158, 930–945. [Google Scholar] [CrossRef] [PubMed] [Green Version]
  16. Slattery, S.S.; Diamond, A.; Wang, H.; Therrien, J.A.; Lant, J.T.; Jazey, T.; Lee, K.; Klassen, Z.; Desgagné-Penix, I.; Karas, B.J.; et al. An Expanded Plasmid-Based Genetic Toolbox Enables Cas9 Genome Editing and Stable Maintenance of Synthetic Pathways in Phaeodactylum tricornutum. ACS Synth. Biol. 2018, 7, 328–338. [Google Scholar] [CrossRef] [PubMed]
  17. Chen, W.; Zhang, C.; Song, L.; Sommerfeld, M.; Hu, Q. A high throughput Nile red method for quantitative measurement of neutral lipids in microalgae. J. Microbiol. Methods 2009, 77, 41–47. [Google Scholar] [CrossRef] [PubMed]
  18. Kimura, K.; Yamaoka, M.; Kamisaka, Y. Rapid estimation of lipids in oleaginous fungi and yeasts using Nile red fluorescence. J. Microbiol. Methods 2004, 56, 331–338. [Google Scholar] [CrossRef]
  19. Bligh, E.G.; Dyer, W.J. A rapid method of total lipid extraction and purification. Can. J. Biochem. Physiol. 1959, 37, 911–917. [Google Scholar] [CrossRef] [Green Version]
  20. Yu, E.T.; Zendejas, F.J.; Lane, P.D.; Gaucher, S.; Simmons, B.A.; Lane, T.W. Triacylglycerol accumulation and profiling in the model diatoms Thalassiosira pseudonana and Phaeodactylum tricornutum (Baccilariophyceae) during starvation. J. Appl. Phycol. 2009, 21, 669. [Google Scholar] [CrossRef]
  21. Talebi, A.F.; Mohtashami, S.K.; Tabatabaei, M.; Tohidfar, M.; Bagheri, A.; Zeinalabedini, M.; Hadavand Mirzaei, H.; Mirzajanzadeh, M.; Malekzadeh Shafaroudi, S.; Bakhtiari, S. Fatty acids profiling: A selective criterion for screening microalgae strains for biodiesel production. Algal Res. 2013, 2, 258–267. [Google Scholar] [CrossRef]
  22. Budge, S.M.; Iverson, S.J.; Koopman, H.N. Studying Trophic Ecology in Marine Ecosystems Using Fatty Acids: A Primer on Analysis and Interpretation. Mar. Mammal Sci. 2006, 22, 759–801. [Google Scholar] [CrossRef]
  23. Talebi, A.F.; Tabatabaei, M.; Chisti, Y. Biodiesel Analyzer: A user-friendly software for predicting the properties of prospective biodiesel. Biofuel Res. J. 2014, 2, 55–57. [Google Scholar] [CrossRef]
  24. Ramírez-Verduzco, L.F.; Rodríguez-Rodríguez, J.E.; Jaramillo-Jacob, A. del R. Predicting cetane number, kinematic viscosity, density and higher heating value of biodiesel from its fatty acid methyl ester composition. Fuel 2012, 91, 102–111. [Google Scholar] [CrossRef]
  25. Kim, T.-H.; Lee, Y.; Han, S.-H.; Hwang, S.-J. The effects of wavelength and wavelength mixing ratios on microalgae growth and nitrogen, phosphorus removal using Scenedesmus sp. for wastewater treatment. Bioresour. Technol. 2013, 130, 75–80. [Google Scholar] [CrossRef]
  26. Shin, W.-S.; Jung, S.M.; Cho, C.-H.; Woo, D.-W.; Kim, W.; Kwon, J.-H.; Shin, W.-S.; Jung, S.M.; Cho, C.-H.; Woo, D.-W.; et al. Use of tar color additives as a light filter to enhance growth and lipid production by the microalga Nannochloropsis gaditana. Environ. Eng. Res. 2018, 23, 205–209. [Google Scholar] [CrossRef] [Green Version]
  27. Smith, R.T.; Bangert, K.; Wilkinson, S.J.; Gilmour, D.J. Synergistic carbon metabolism in a fast growing mixotrophic freshwater microalgal species Micractinium inermum. Biomass Bioenergy 2015, 82, 73–86. [Google Scholar] [CrossRef] [Green Version]
  28. Li, T.; Zheng, Y.; Yu, L.; Chen, S. Mixotrophic cultivation of a Chlorella sorokiniana strain for enhanced biomass and lipid production. Biomass Bioenergy 2014, 66, 204–213. [Google Scholar] [CrossRef]
  29. Severes, A.; Hegde, S.; D’Souza, L.; Hegde, S. Use of light emitting diodes (LEDs) for enhanced lipid production in micro-algae based biofuels. J. Photochem. Photobiol. B Biol. 2017, 170, 235–240. [Google Scholar] [CrossRef]
  30. Yi, Z.; Su, Y.; Cherek, P.; Nelson, D.R.; Lin, J.; Rolfsson, O.; Wu, H.; Salehi-Ashtiani, K.; Brynjolfsson, S.; Fu, W. Combined artificial high-silicate medium and LED illumination promote carotenoid accumulation in the marine diatom Phaeodactylum tricornutum. Microb. Cell Factories 2019, 18, 209. [Google Scholar] [CrossRef]
  31. Cerón-García, M.C.; Fernández-Sevilla, J.M.; Sánchez-Mirón, A.; García-Camacho, F.; Contreras-Gómez, A.; Molina-Grima, E. Mixotrophic growth of Phaeodactylum tricornutum on fructose and glycerol in fed-batch and semi-continuous modes. Bioresour. Technol. 2013, 147, 569–576. [Google Scholar] [CrossRef] [PubMed]
  32. Pittman, J.K.; Dean, A.P.; Osundeko, O. The potential of sustainable algal biofuel production using wastewater resources. Bioresour. Technol. 2011, 102, 17–25. [Google Scholar] [CrossRef] [PubMed]
  33. Cerón García, M.C.; Sánchez Mirón, A.; Fernández Sevilla, J.M.; Molina Grima, E.; García Camacho, F. Mixotrophic growth of the microalga Phaeodactylum tricornutum: Influence of different nitrogen and organic carbon sources on productivity and biomass composition. Process Biochem. 2005, 40, 297–305. [Google Scholar] [CrossRef]
  34. Ooms, M.D.; Dinh, C.T.; Sargent, E.H.; Sinton, D. Photon management for augmented photosynthesis. Nat. Commun. 2016, 7, 1–13. [Google Scholar] [CrossRef] [PubMed]
  35. Singh, A.K.; Bhattacharyya-Pakrasi, M.; Elvitigala, T.; Ghosh, B.; Aurora, R.; Pakrasi, H.B. A Systems-Level Analysis of the Effects of Light Quality on the Metabolism of a Cyanobacterium. Plant Physiol. 2009, 151, 1596–1608. [Google Scholar] [CrossRef] [Green Version]
  36. Fortunato, A.E.; Jaubert, M.; Enomoto, G.; Bouly, J.-P.; Raniello, R.; Thaler, M.; Malviya, S.; Bernardes, J.S.; Rappaport, F.; Gentili, B.; et al. Diatom Phytochromes Reveal the Existence of Far-Red-Light-Based Sensing in the Ocean. Plant Cell 2016, 28, 616–628. [Google Scholar] [CrossRef] [PubMed]
  37. Möglich, A.; Yang, X.; Ayers, R.A.; Moffat, K. Structure and Function of Plant Photoreceptors. Annu. Rev. Plant Biol. 2010, 61, 21–47. [Google Scholar] [CrossRef] [Green Version]
  38. Mann, M.; Serif, M.; Jakob, T.; Kroth, P.G.; Wilhelm, C. PtAUREO1a and PtAUREO1b knockout mutants of the diatom Phaeodactylum tricornutum are blocked in photoacclimation to blue light. J. Plant Physiol. 2017, 217, 44–48. [Google Scholar] [CrossRef] [Green Version]
  39. Xu, B.; Cheng, P.; Yan, C.; Pei, H.; Hu, W. The effect of varying LED light sources and influent carbon/nitrogen ratios on treatment of synthetic sanitary sewage using Chlorella vulgaris. World J. Microbiol. Biotechnol. 2013, 29, 1289–1300. [Google Scholar] [CrossRef]
  40. Sung, M.-G.; Han, J.-I.; Lee, B.; Chang, Y.K. Wavelength shift strategy to enhance lipid productivity of Nannochloropsis gaditana. Biotechnol. Biofuels 2018, 11, 70. [Google Scholar] [CrossRef] [Green Version]
  41. Bína, D.; Herbstová, M.; Gardian, Z.; Vácha, F.; Litvín, R. Novel structural aspect of the diatom thylakoid membrane: Lateral segregation of photosystem I under red-enhanced illumination. Sci. Rep. 2016, 6, 1–10. [Google Scholar] [CrossRef] [PubMed] [Green Version]
  42. Yang, Y.-H.; Du, L.; Hosokawa, M.; Miyashita, K.; Kokubun, Y.; Arai, H.; Taroda, H. Fatty Acid and Lipid Class Composition of the Microalga Phaeodactylum tricornutum. J. Oleo Sci. 2017, 66, 363–368. [Google Scholar] [CrossRef] [PubMed] [Green Version]
  43. Lewin, J.C.; Lewin, R.A.; Philpott, D.E. Observations on Phaeodactylum tricornutum. J. Gen. Microbiol. 1958, 18, 418–426. [Google Scholar] [CrossRef] [Green Version]
  44. Liefer, J.D.; Garg, A.; Fyfe, M.H.; Irwin, A.J.; Benner, I.; Brown, C.M.; Follows, M.J.; Omta, A.W.; Finkel, Z.V. The Macromolecular Basis of Phytoplankton C:N:P under Nitrogen Starvation. Front. Microbiol. 2019, 10, 763. [Google Scholar] [CrossRef] [PubMed] [Green Version]
  45. Alboresi, A.; Perin, G.; Vitulo, N.; Diretto, G.; Block, M.; Jouhet, J.; Meneghesso, A.; Valle, G.; Giuliano, G.; Maréchal, E.; et al. Light Remodels Lipid Biosynthesis in Nannochloropsis gaditana by Modulating Carbon Partitioning between Organelles. Plant Physiol. 2016, 171, 2468–2482. [Google Scholar] [CrossRef] [PubMed] [Green Version]
  46. Heydarizadeh, P.; Veidl, B.; Huang, B.; Lukomska, E.; Wielgosz-Collin, G.; Couzinet-Mossion, A.; Bougaran, G.; Marchand, J.; Schoefs, B. Carbon Orientation in the Diatom Phaeodactylum tricornutum: The Effects of Carbon Limitation and Photon Flux Density. Front. Plant Sci. 2019, 10, 471. [Google Scholar] [CrossRef]
  47. Teo, C.L.; Atta, M.; Bukhari, A.; Taisir, M.; Yusuf, A.M.; Idris, A. Enhancing growth and lipid production of marine microalgae for biodiesel production via the use of different LED wavelengths. Bioresour. Technol. 2014, 162, 38–44. [Google Scholar] [CrossRef]
  48. He, L.; Han, X.; Yu, Z. A Rare Phaeodactylum tricornutum Cruciform Morphotype: Culture Conditions, Transformation and Unique Fatty Acid Characteristics. PLoS ONE 2014, 9, e93922. [Google Scholar] [CrossRef]
  49. Mock, T.; Kroon, B.M.A. Photosynthetic energy conversion under extreme conditions—II: The significance of lipids under light limited growth in Antarctic sea ice diatoms. Phytochemistry 2002, 61, 53–60. [Google Scholar] [CrossRef]
  50. Zhao, P.; Gu, W.; Wu, S.; Huang, A.; He, L.; Xie, X.; Gao, S.; Zhang, B.; Niu, J.; Peng Lin, A.; et al. Silicon enhances the growth of Phaeodactylum tricornutum Bohlin under green light and low temperature. Sci. Rep. 2014, 4, 1–10. [Google Scholar] [CrossRef] [Green Version]
  51. Desbois, A.P.; Walton, M.; Smith, V.J. Differential antibacterial activities of fusiform and oval morphotypes of Phaeodactylum tricornutum (Bacillariophyceae). J. Mar. Biol. Assoc. UK 2010, 90, 769–774. [Google Scholar] [CrossRef] [Green Version]
  52. Simopoulos, A.P. The importance of the ratio of omega-6/omega-3 essential fatty acids. Biomed. Pharmacother. 2002, 56, 365–379. [Google Scholar] [CrossRef]
  53. Ramesh Kumar, B.; Deviram, G.; Mathimani, T.; Duc, P.A.; Pugazhendhi, A. Microalgae as rich source of polyunsaturated fatty acids. Biocatal. Agric. Biotechnol. 2019, 17, 583–588. [Google Scholar] [CrossRef]
  54. Jiang, H.; Gao, K. Effects of Lowering Temperature During Culture on the Production of Polyunsaturated Fatty Acids in the Marine Diatom Phaeodactylum Tricornutum (Bacillariophyceae)1. J. Phycol. 2004, 40, 651–654. [Google Scholar] [CrossRef]
  55. Liang, Y.; Beardall, J.; Heraud, P. Effects of nitrogen source and UV radiation on the growth, chlorophyll fluorescence and fatty acid composition of Phaeodactylum tricornutum and Chaetoceros muelleri (Bacillariophyceae). J. Photochem. Photobiol. B Biol. 2006, 82, 161–172. [Google Scholar] [CrossRef] [PubMed]
  56. Swanson, D.; Block, R.; Mousa, S.A. Omega-3 Fatty Acids EPA and DHA: Health Benefits throughout Life1. Adv. Nutr. 2012, 3, 1–7. [Google Scholar] [CrossRef] [PubMed]
  57. Hoekman, S.K.; Broch, A.; Robbins, C.; Ceniceros, E.; Natarajan, M. Review of biodiesel composition, properties, and specifications. Renew. Sustain. Energy Rev. 2012, 16, 143–169. [Google Scholar] [CrossRef]
  58. Knothe, G. Improving biodiesel fuel properties by modifying fatty ester composition. Energy Environ. Sci. 2009, 2, 759–766. [Google Scholar] [CrossRef]
  59. Hu, Q.; Xiang, W.; Dai, S.; Li, T.; Yang, F.; Jia, Q.; Wang, G.; Wu, H. The influence of cultivation period on growth and biodiesel properties of microalga Nannochloropsis gaditana 1049. Bioresour. Technol. 2015, 192, 157–164. [Google Scholar] [CrossRef] [Green Version]
  60. Ramos, M.J.; Fernández, C.M.; Casas, A.; Rodríguez, L.; Pérez, A. Influence of fatty acid composition of raw materials on biodiesel properties. Bioresour. Technol. 2009, 100, 261–268. [Google Scholar] [CrossRef]
  61. Nwafor, O.M.I. The effect of elevated fuel inlet temperature on performance of diesel engine running on neat vegetable oil at constant speed conditions. Renew. Energy 2003, 28, 171–181. [Google Scholar] [CrossRef]
  62. Orefice, I.; Chandrasekaran, R.; Smerilli, A.; Corato, F.; Caruso, T.; Casillo, A.; Corsaro, M.M.; Piaz, F.D.; Ruban, A.V.; Brunet, C. Light-induced changes in the photosynthetic physiology and biochemistry in the diatom Skeletonema marinoi. Algal Res. 2016, 17, 1–13. [Google Scholar] [CrossRef]
  63. Chandrasekaran, R.; Barra, L.; Carillo, S.; Caruso, T.; Corsaro, M.M.; Dal Piaz, F.; Graziani, G.; Corato, F.; Pepe, D.; Manfredonio, A.; et al. Light modulation of biomass and macromolecular composition of the diatom Skeletonema marinoi. J. Biotechnol. 2014, 192 Pt A, 114–122. [Google Scholar] [CrossRef]
  64. Brunet, C.; Chandrasekaran, R.; Barra, L.; Giovagnetti, V.; Corato, F.; Ruban, A.V. Spectral Radiation Dependent Photoprotective Mechanism in the Diatom Pseudo-nitzschia multistriata. PLoS ONE 2014, 9, e87015. [Google Scholar] [CrossRef] [PubMed]
  65. Rivkin, R. Influence of irradiance and spectral quality on the carbon metabolism of phytoplankton I. Photosynthesis, chemical composition and growth. Mar. Ecol. Prog. Ser. 1989, 55, 291–304. [Google Scholar] [CrossRef]
  66. Simionato, D.; Sforza, E.; Corteggiani Carpinelli, E.; Bertucco, A.; Giacometti, G.M.; Morosinotto, T. Acclimation of Nannochloropsis gaditana to different illumination regimes: Effects on lipids accumulation. Bioresour. Technol. 2011, 102, 6026–6032. [Google Scholar] [CrossRef] [PubMed]
  67. Aidar, E.; Gianesella-Galvão, S.M.F.; Sigaud, T.C.S.; Asano, C.S.; Liang, T.H.; Rezende, K.R.V.; Oishi, M.K.; Aranha, F.J.; Milani, G.M.; Sandes, M.A.L. Effects of light quality on growth, biochemical composition and photo synthetic production in Cyclotella caspia Grunow and Tetraselmis gracilis (Kylin) Butcher. J. Exp. Marine Biol. Ecol. 1994, 180, 175–187. [Google Scholar] [CrossRef]
  68. Costa, B.S.; Sachse, M.; Jungandreas, A.; Bartulos, C.R.; Gruber, A.; Jakob, T.; Kroth, P.G.; Wilhelm, C. Aureochrome 1a Is Involved in the Photoacclimation of the Diatom Phaeodactylum tricornutum. PLoS ONE 2013, 8, e74451. [Google Scholar]
  69. Costa, B.S.; Jungandreas, A.; Jakob, T.; Weisheit, W.; Mittag, M.; Wilhelm, C. Blue light is essential for high light acclimation and photoprotection in the diatom Phaeodactylum tricornutum. J. Exp. Bot. 2013, 64, 483–493. [Google Scholar] [CrossRef] [Green Version]
  70. Huysman, M.J.J.; Fortunato, A.E.; Matthijs, M.; Costa, B.S.; Vanderhaeghen, R.; den Daele, H.V.; Sachse, M.; Inzé, D.; Bowler, C.; Kroth, P.G.; et al. AUREOCHROME 1a-Mediated Induction of the Diatom-Specific Cyclin dsCYC2 Controls the Onset of Cell Division in Diatoms (Phaeodactylum tricornutum). Plant Cell 2013, 25, 215–228. [Google Scholar] [CrossRef] [Green Version]
  71. Oka, K.; Ueno, Y.; Yokono, M.; Shen, J.-R.; Nagao, R.; Akimoto, S. Adaptation of light-harvesting and energy-transfer processes of a diatom Phaeodactylum tricornutum to different light qualities. Photosynth. Res. 2020. [Google Scholar] [CrossRef] [PubMed]
Figure 1. Analysis of P. tricornutum biomass (A) and lipid yield (B) in mixotrophic and autotrophic conditions under different colors of light. Abbreviations for the conditions are W: white, R: red, and Y: yellow, W1, R1 and Y1 refer to L1 media supplemented with 1% glucose, whereas W2, R2, and Y2 refer to the L1 media supplemented with 1% glycine. Each bar represents the average of three replicates, and error bars represent standard deviation. Means with different letters above the bars correspond to significant differences calculated using the multiple t-test. The columns identified with different letters (a–c) are significantly different using one-way analysis of variance (ANOVA) followed by a pairwise mean comparison Tukey’s test where differences were detected (n = 3, p < 0.05).
Applsci 10 02531 g001
Figure 2. Growth curve of P. tricornutum in continuous white light (W), red light (R), and in red light shift (RS) (i.e., red light during the exponential phase and then white light during the stationary phase). Cells were grown on continuous shaking mode in 5 mL culture; each point represents the mean optical density at 680 nm of three independent experiments (±SD).
Applsci 10 02531 g002
Figure 3. Analysis of P. tricornutum biomass (A) and lipid accumulation (B) in autotrophic conditions under continuous white (W) light, red (R) light, and red with light shift (RS), which is red light during the exponential phase and then a shift to white light. Experiments were done in triplicate in 50 mL liquid culture, and cells were collected at day 10. Results are expressed as mean value ± standard deviation. An asterisk (*) indicates significant differences compared to the white light (W) used as control. Statistical analysis was done using one-way ANOVA.
Applsci 10 02531 g003
Figure 4. Microscopic fluorescent images (top) and transmitted with fluorescent overlay (bottom). Visualization of lipid droplets in Phaeodactylum tricornutum using Nile red staining. Each panel represents Nile red staining of lipid droplets in white light conditions (a,c) and in red light (b,d). Scale represents 100 nm.
Applsci 10 02531 g004
Table 1. Summary of P. tricornutum culture conditions and experiment identifications. P. tricornutum was cultured in L1 media, and all experiments were done in triplicate.
LightAutotrophicMixotrophic
1% Glucose1% Glycine
White (Control)WW1W2
RedRR1R2
YellowYY1Y2
Table 2. Overall experimental plan of four culture conditions (red light treatment 1 to 3 and RS). After the R exposure using cellophane sheets during the treatment time period as mentioned for (RT1–RT3, RS), the sheets were removed, and P. tricornutum culture was exposed to the full spectrum of white light. In RT1, the culture was exposed to red light for first 4 days and then exposed to white light. In RT2, the culture was exposed to white light during first 3 days; then, it was exposed to red light by wrapping the flask from the fourth to seventh day and then again exposing the flask to white light. In RT3, the culture was exposed to white light until the seventh day and after was given red light treatment. Similarly, in RS, the red light was given from the first to seventh day and then exposed to white light for 72 h before harvesting. Below, the graphical representation of the setup aligned with the growth curve.
TreatmentDescription
RT1Red light exposure only during the lag phase (1st–4th day)
RT2Red light exposure only during the exponential phase (4th–7th day)
RT3Red light exposure only during the stationary phase (7th–10th day)
RSRed light until the end of the exponential phase (1st–7th day)
Applsci 10 02531 i001
Table 3. Fatty acid (FA) composition (mass% of total FA identified) analyzed by GC with Flame-Ionization Detection (GC-FID) of P. tricornutum culture under different conditions (white light (W), red light (R), or red light shift (RS)). Data are expressed as the mean of three independent experiments.
Fatty AcidsWRRS
Saturated fatty acids (SFA)26.3424.8626.25
Monounsaturated fatty acids (MUFA)31.8031.8528.91
Polyunsaturated fatty acids (PUFA)41.8643.2944.83
Omega-3/Omega-66.465.685.77
Total100100100
Table 4. Fatty acid composition of total lipid in P. tricornutum cultured in different conditions such as full spectrum of white light (W), red light (R), or red light shift (RS). Major fatty acids are identified as the mass percent of total fatty acids. Monounsaturated fatty acids are expressed as the sum of all fatty acids with that chain length. Data are the mean ± standard deviation (SD) of three independent experiments.
C:DRelative Fatty Acids (%)
WRRS
Saturated fatty acids (SFAs)
14:08.64 ± 0.177.54 ± 0.028.39 ± 0.55
16:015.18 ± 2.6414.80 ± 1.8015.24 ± 3.67
18:00.40 ± 0.100.39 ± 0.060.42 ± 0.13
20:00.07 ± 0.010.08 ± 0.010.08 ± 0.02
22:00.16 ± 0.010.19 ± 0.010.20 ± 0.02
24:01.32 ± 0.111.30 ± 0.021.41 ± 0.03
Monounsaturated fatty acids (MUFAs)
14:10.08 ± 0.020.09 ± 0.010.08 ± 0.01
16:130.11 ± 1.3830.25 ± 1.7427.27 ± 1.65
18:11.08 ± 0.461.07 ± 0.171.05 ± 0.39
20:10.04 ± 0.020.06 ± 0.020.08 ± 0.03
22:10.17 ± 0.040.12 ± 0.030.14 ± 0.04
24:10.17 ± 0.020.11 ± 0.030.16 ± 0.04
Polyunsaturated fatty acids (PUFAs)
Omega-3
18:3n-30.44 ± 0.060.36 ± 0.040.41 ± 0.04
18:4n-30.21 ± 0.060.21 ± 0.030.23 ± 0.05
20:3n-30.06 ± 0.030.05 ± 0.020.06 ± 0.02
20:4n-30.18 ± 0.010.21 ± 0.020.24 ± 0.04
20:5n-322.53 ± 1.2321.59 ± 1.9822.15 ± 3.24
22:5n-30.19 ± 0.180.16 ± 0.040.18 ± 0.06
22:6n-32.23 ± 1.961.72 ± 0.081.96 ± 0.27
Omega-6
16:2n-60.94 ± 0.201.13 ± 0.111.16 ± 0.19
16:3n-60.96 ± 0.220.60 ± 0.150.76 ± 0.25
18:2n-61.41 ± 0.251.51 ± 0.131.62 ± 0.021
18:3n-60.18 ± 0.110.23 ± 0.030.21 ± 0.08
20:2n-60.09 ± 0.030.10 ± 0.010.08 ± 0.03
20:3n-60.05 ± 0.020.08 ± 0.020.07 ± 0.01
20:4n-60.33 ± 0.80.62 ± 0.050.46 ± 0.08
22:4n-60.03 ± 0.010.02 ± 0.010.02 ± 0.01
22:5n-60.02 ± 0.010.01 ± 0.010.02 ± 0.01
Table 5. Values of physical properties of biodiesel related to the fatty acid compositions in each culture conditions (W, R, and RS) compared to the International Standard ASTM and EN14214.
Physical PropertiesWRRSEN 14214:2008ASTM D6751
density0.7490.7280.7190.860–0.9000.875–0.900
iodine value122.5118.4121.6<120-
cetane number49.651.451.2≥51≥47
viscosity2.72.62.63.5–5.01.9–6.0

