Exploring the Impact of Multitemporal DEM Data on the Susceptibility Mapping of Landslides


Abstract
Featured Application
Abstract
1. Introduction
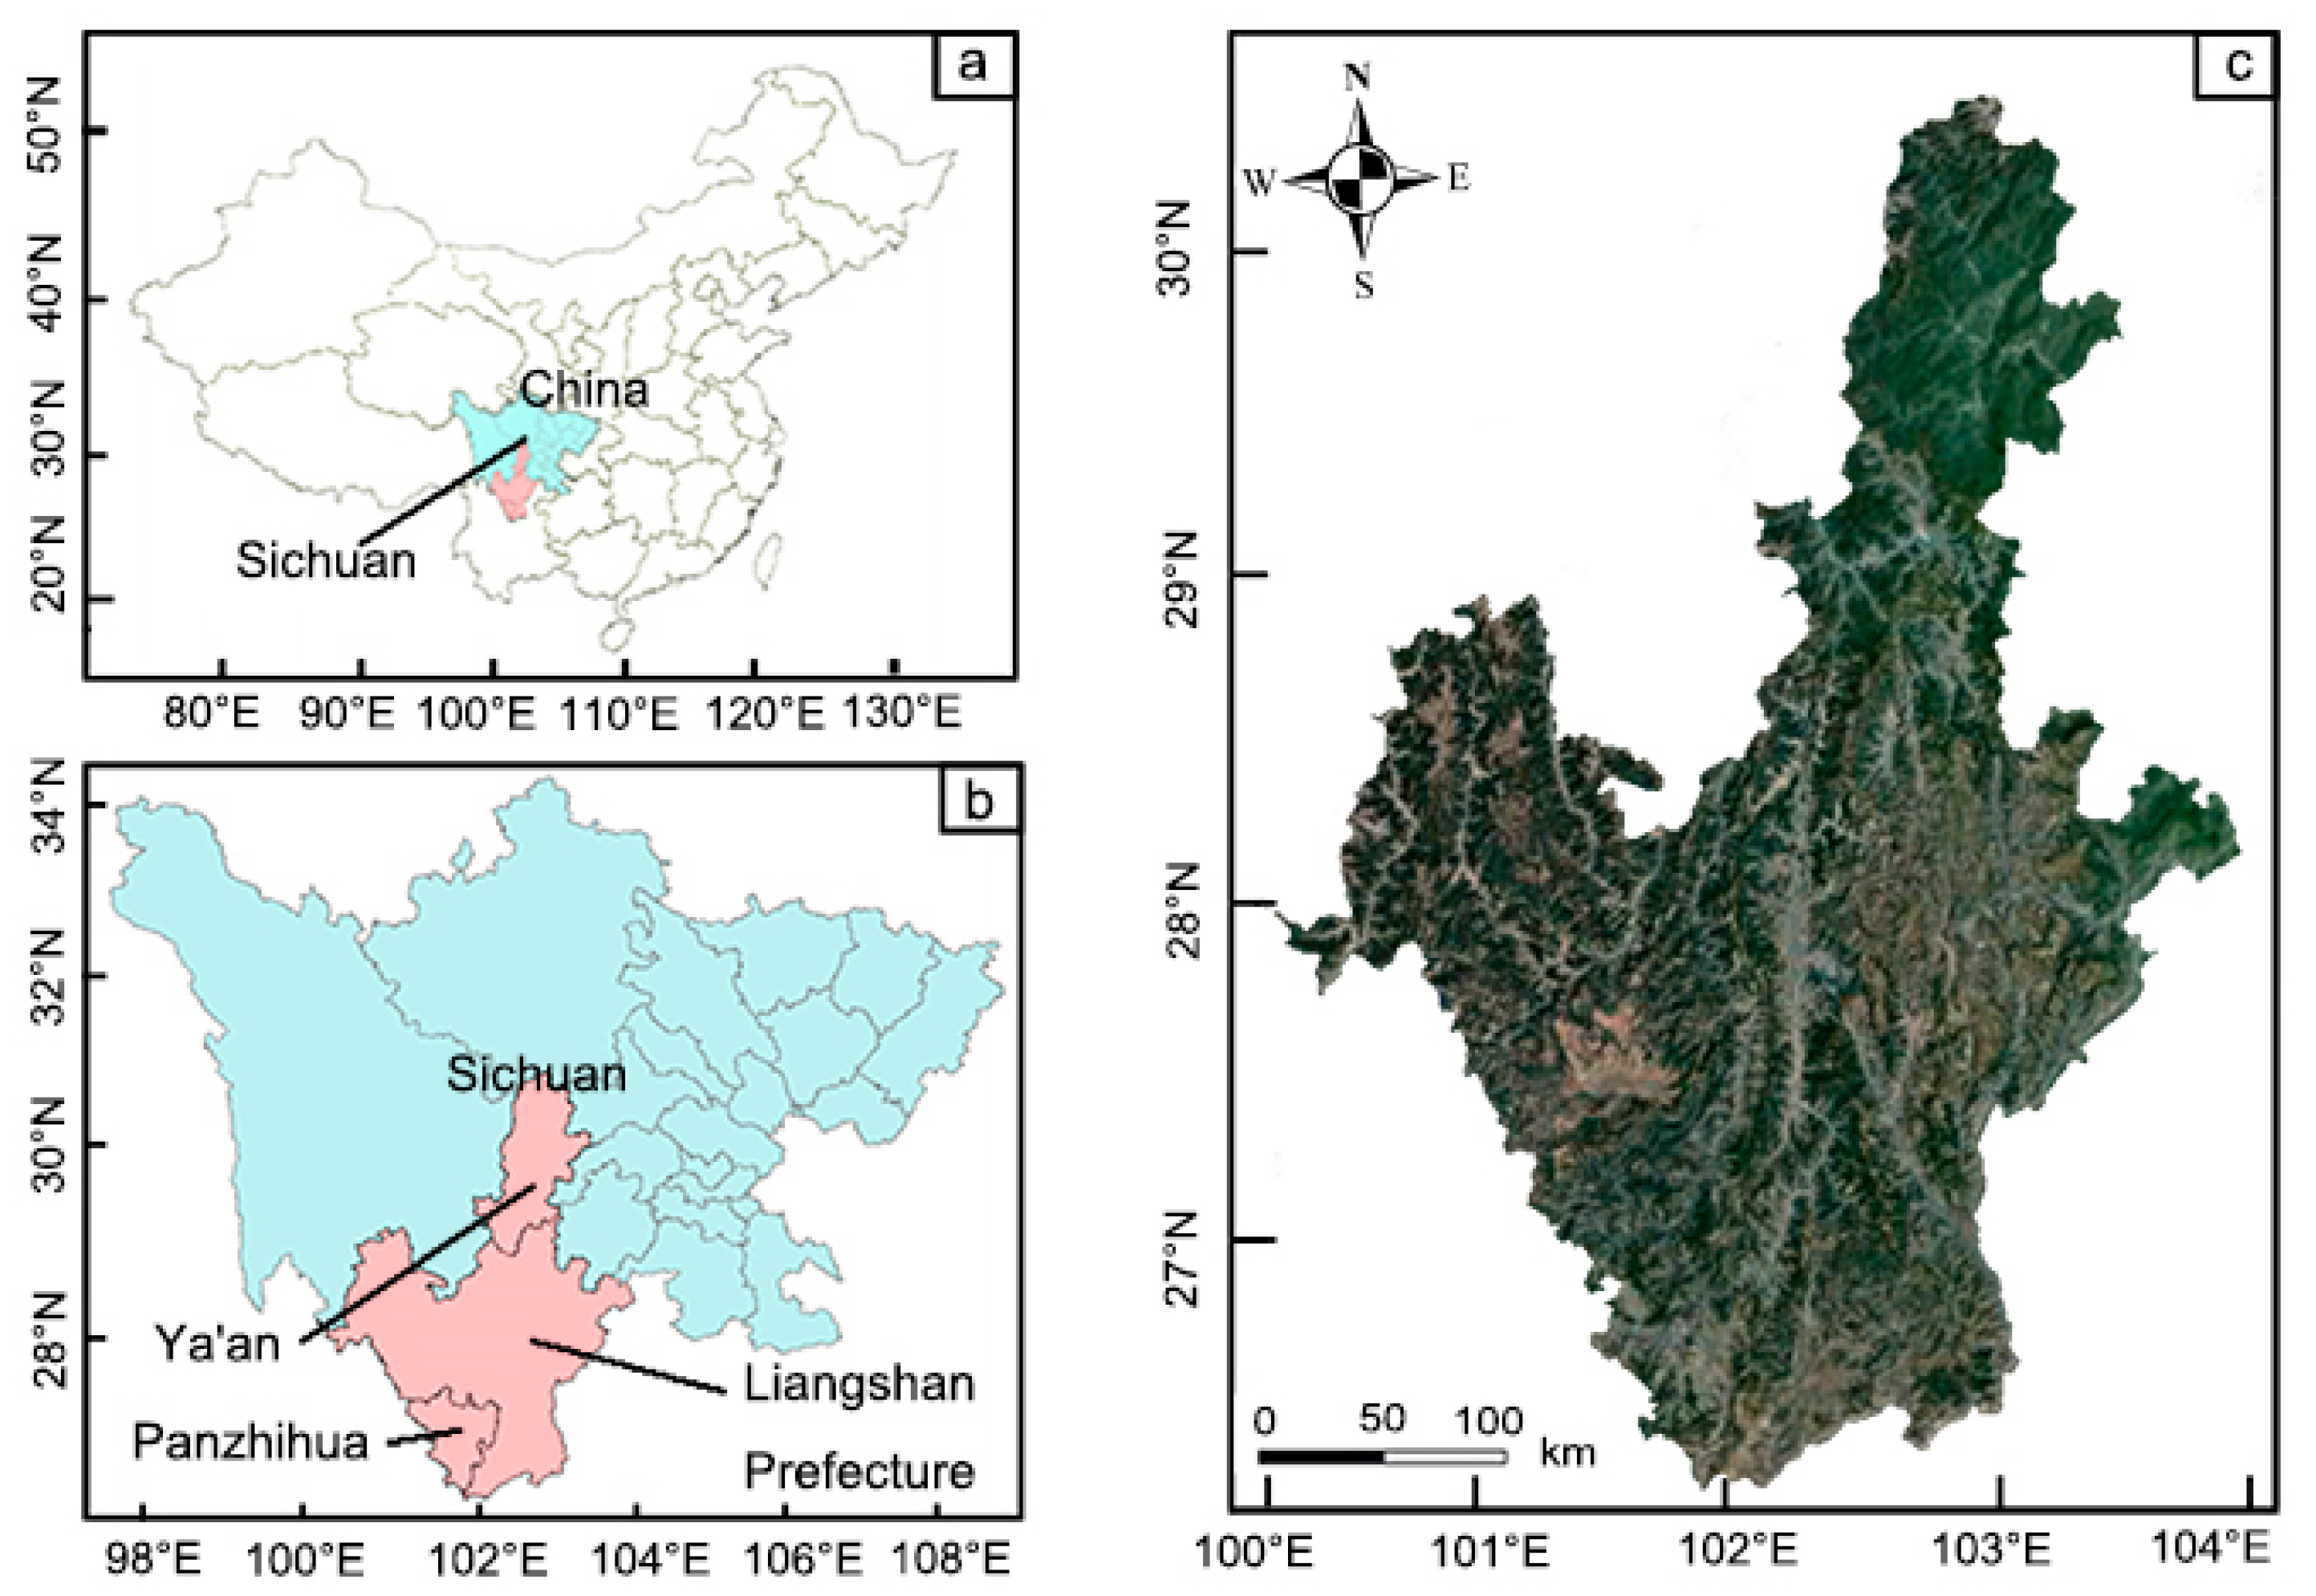
2. Study Area
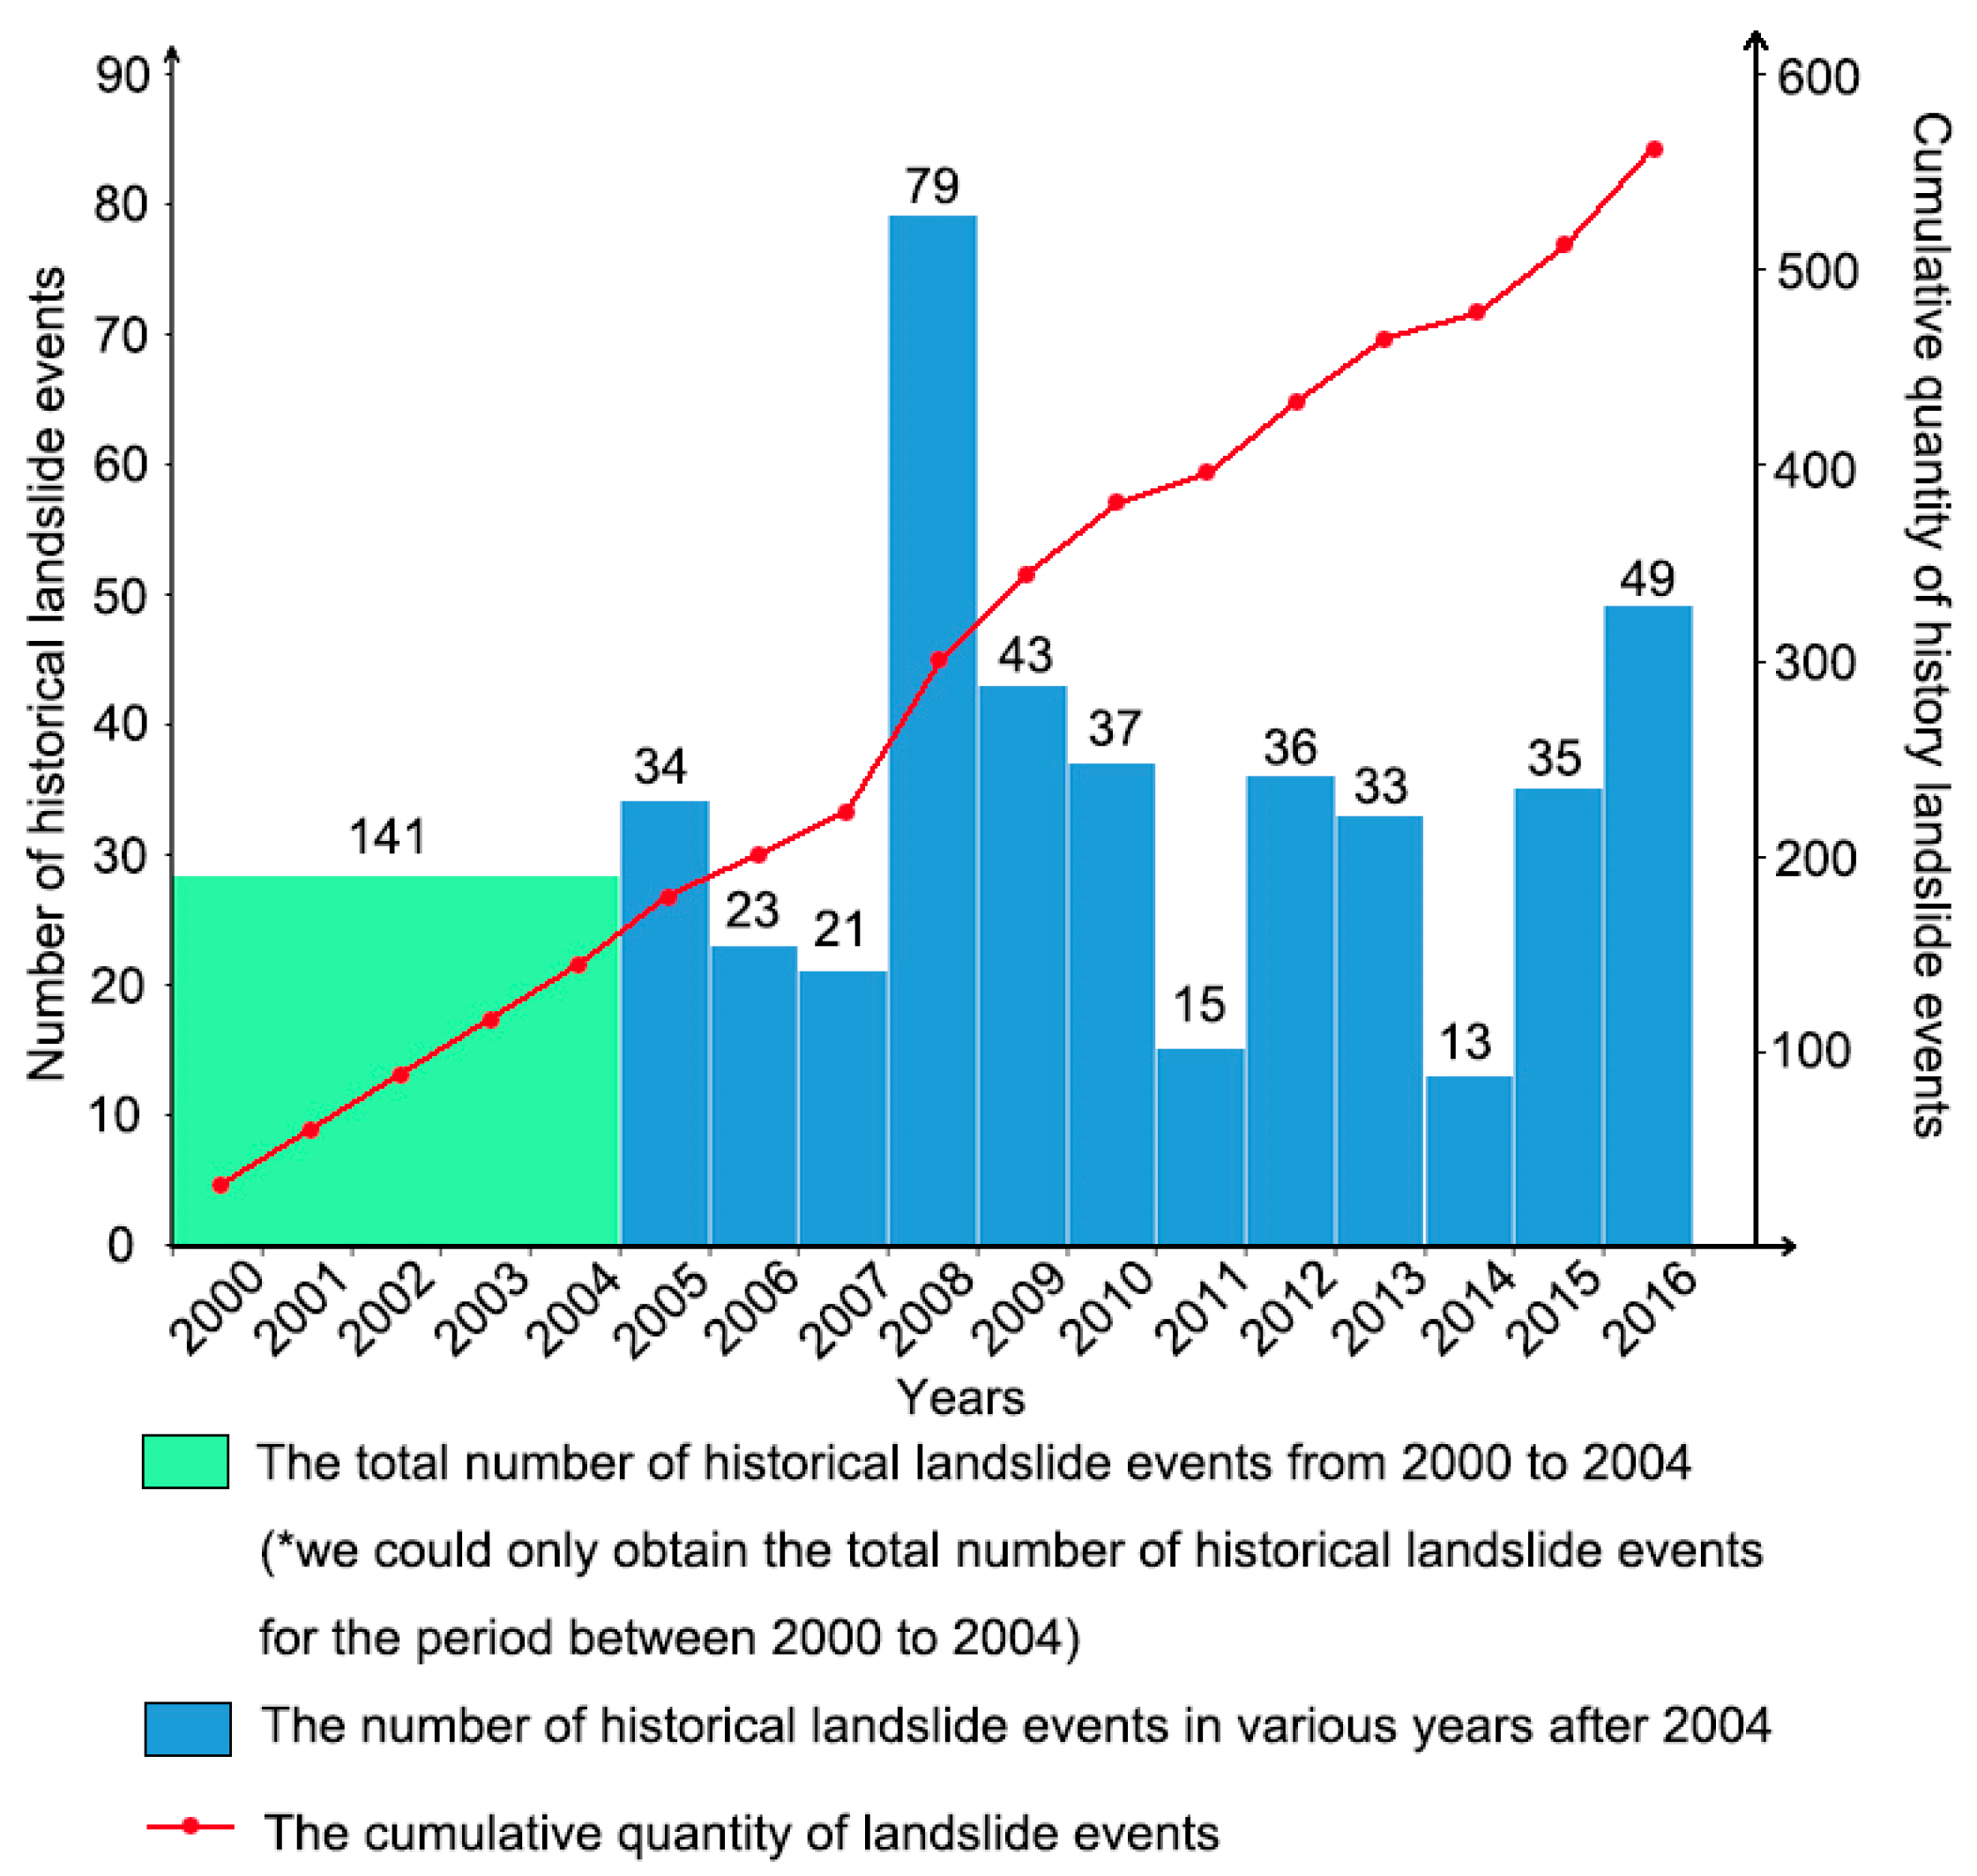
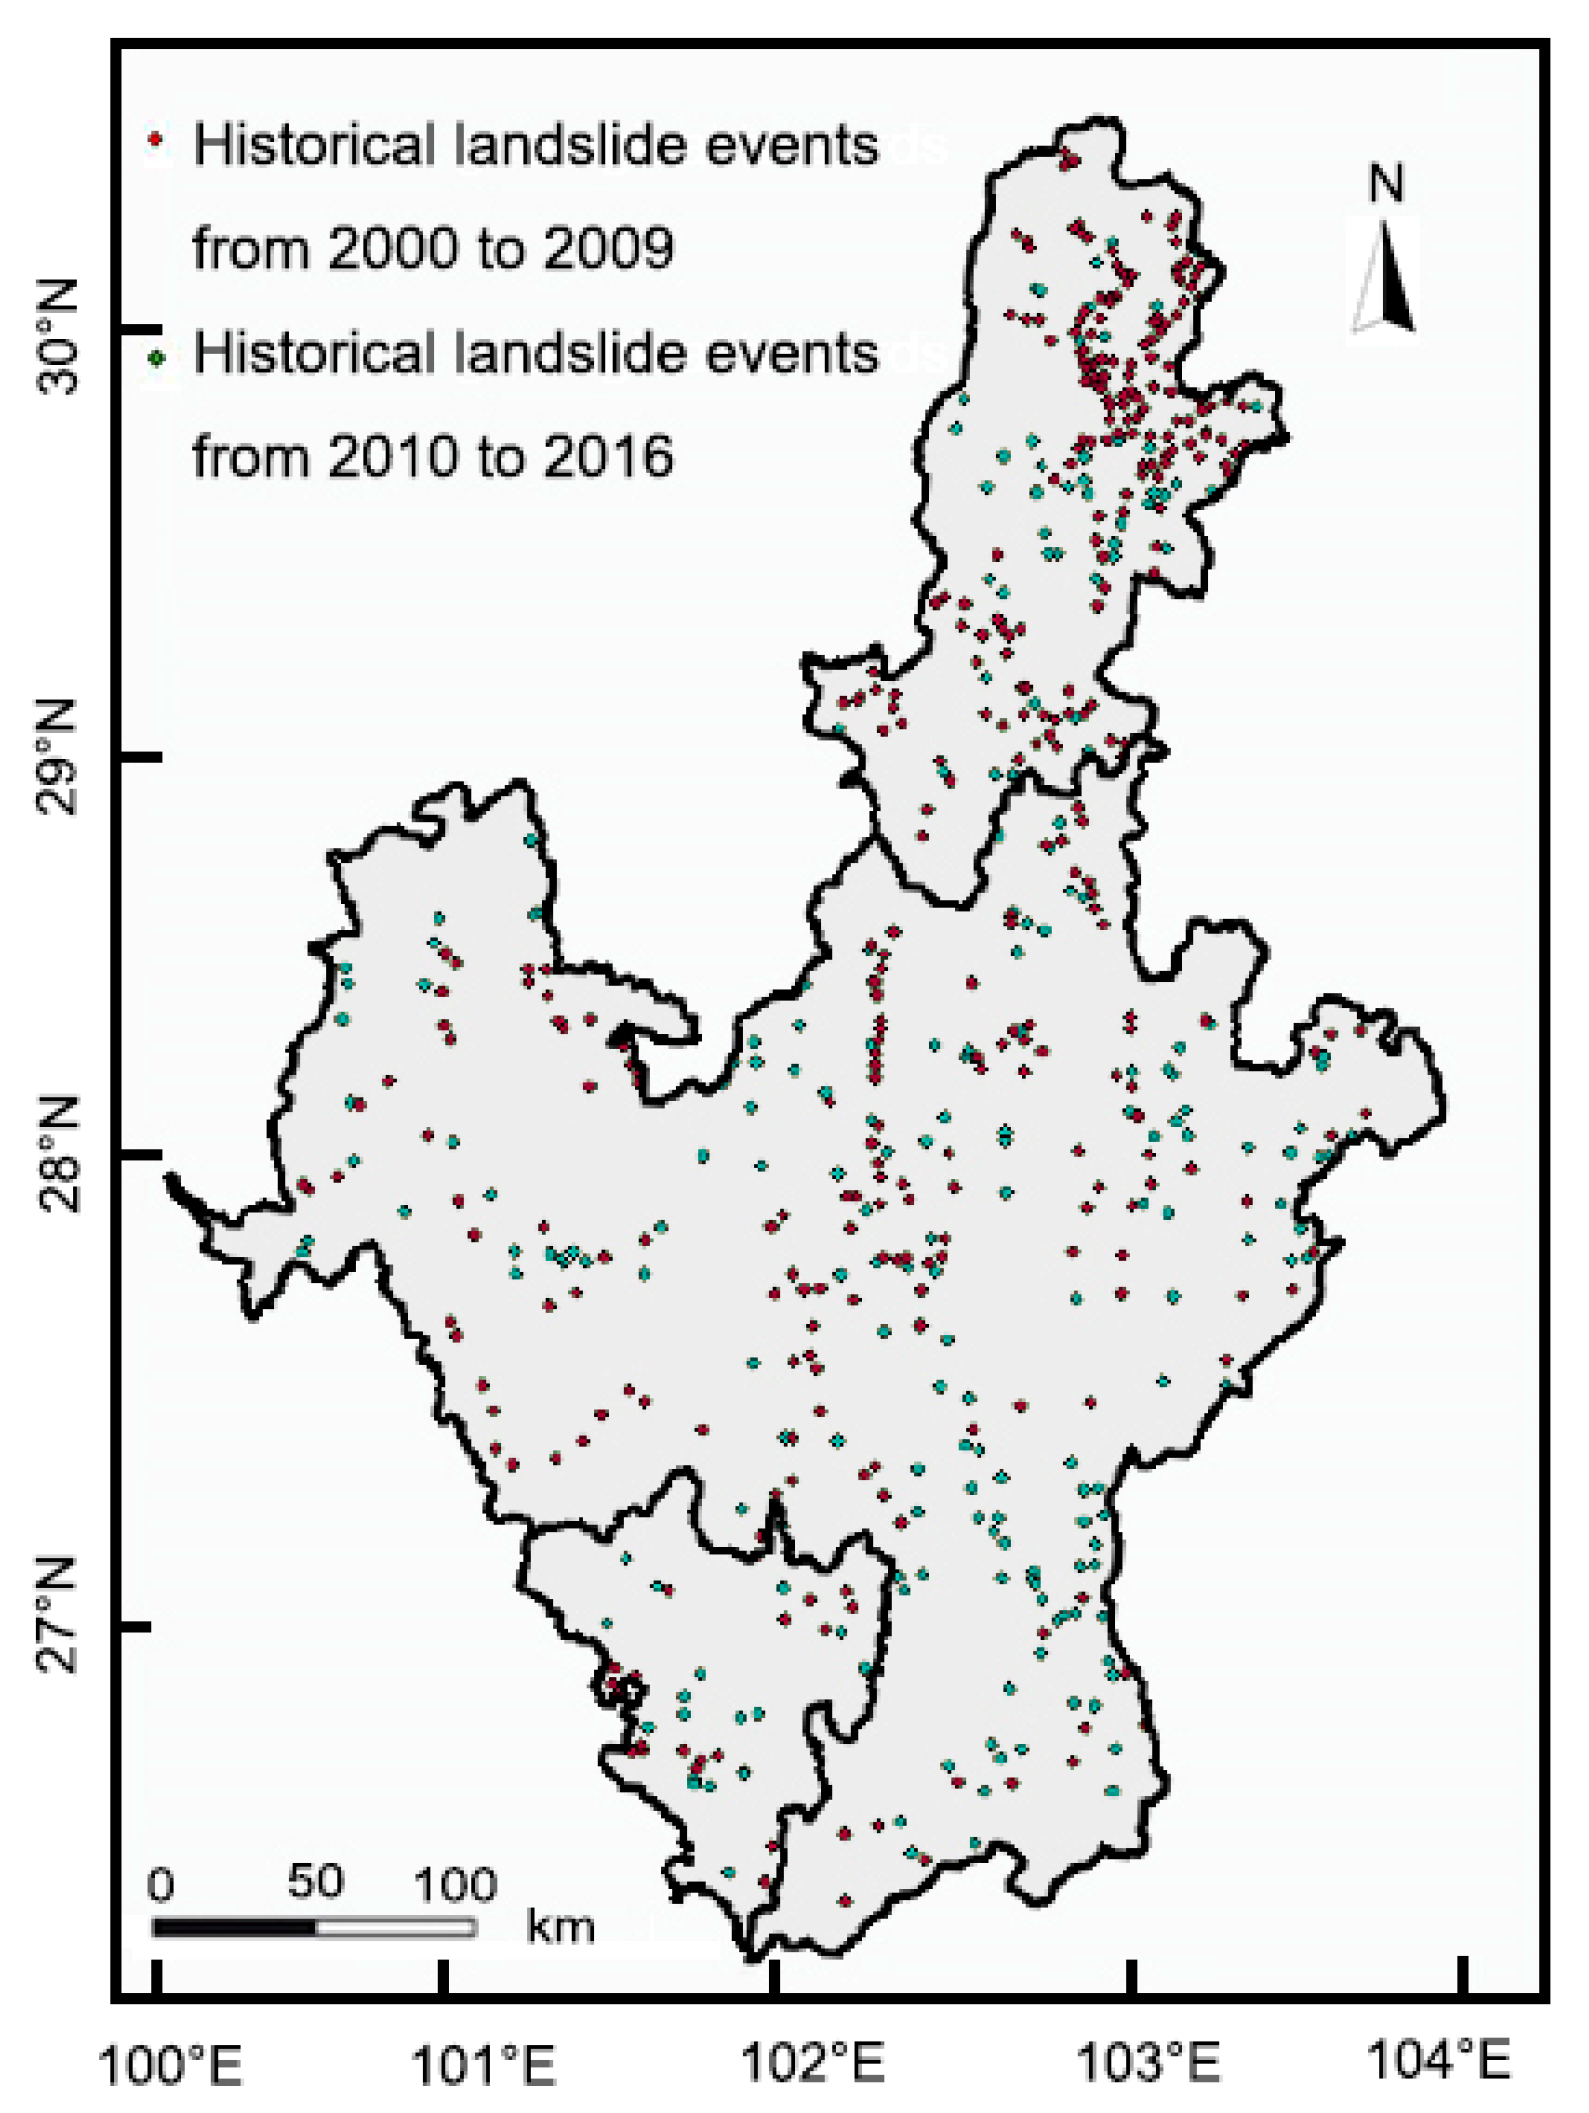
2.1. Study Area and Landslide Data
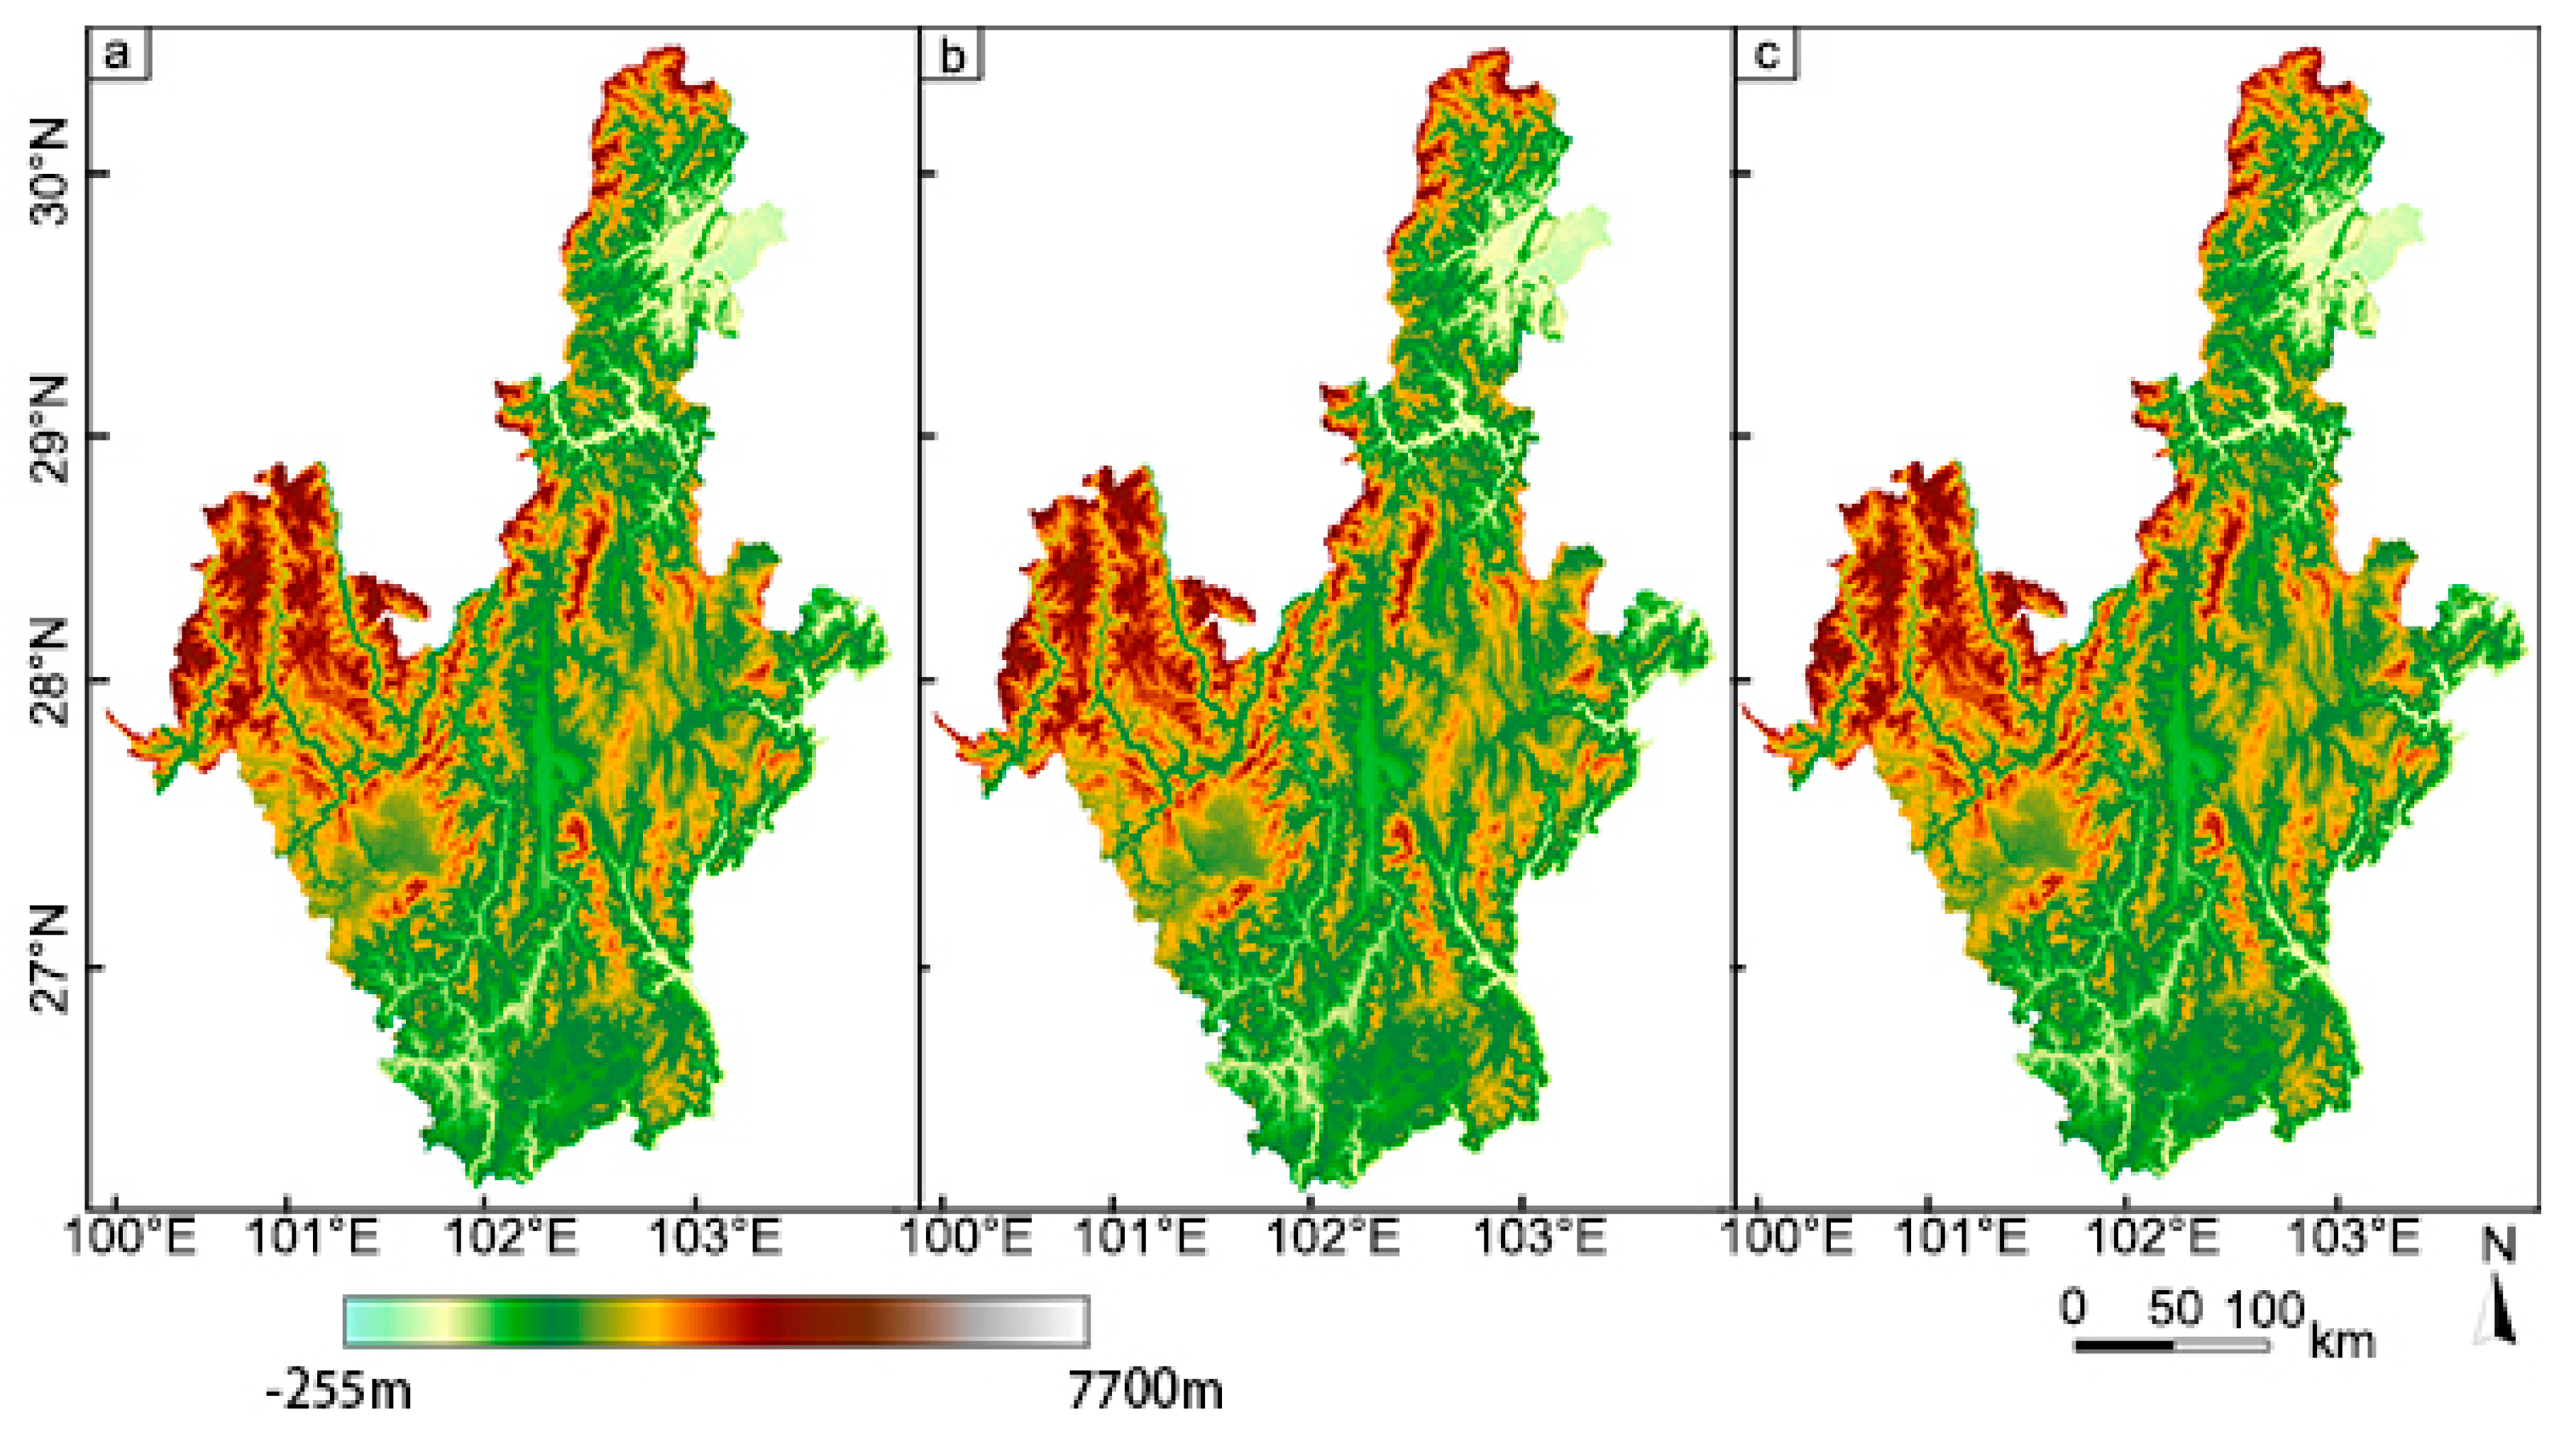
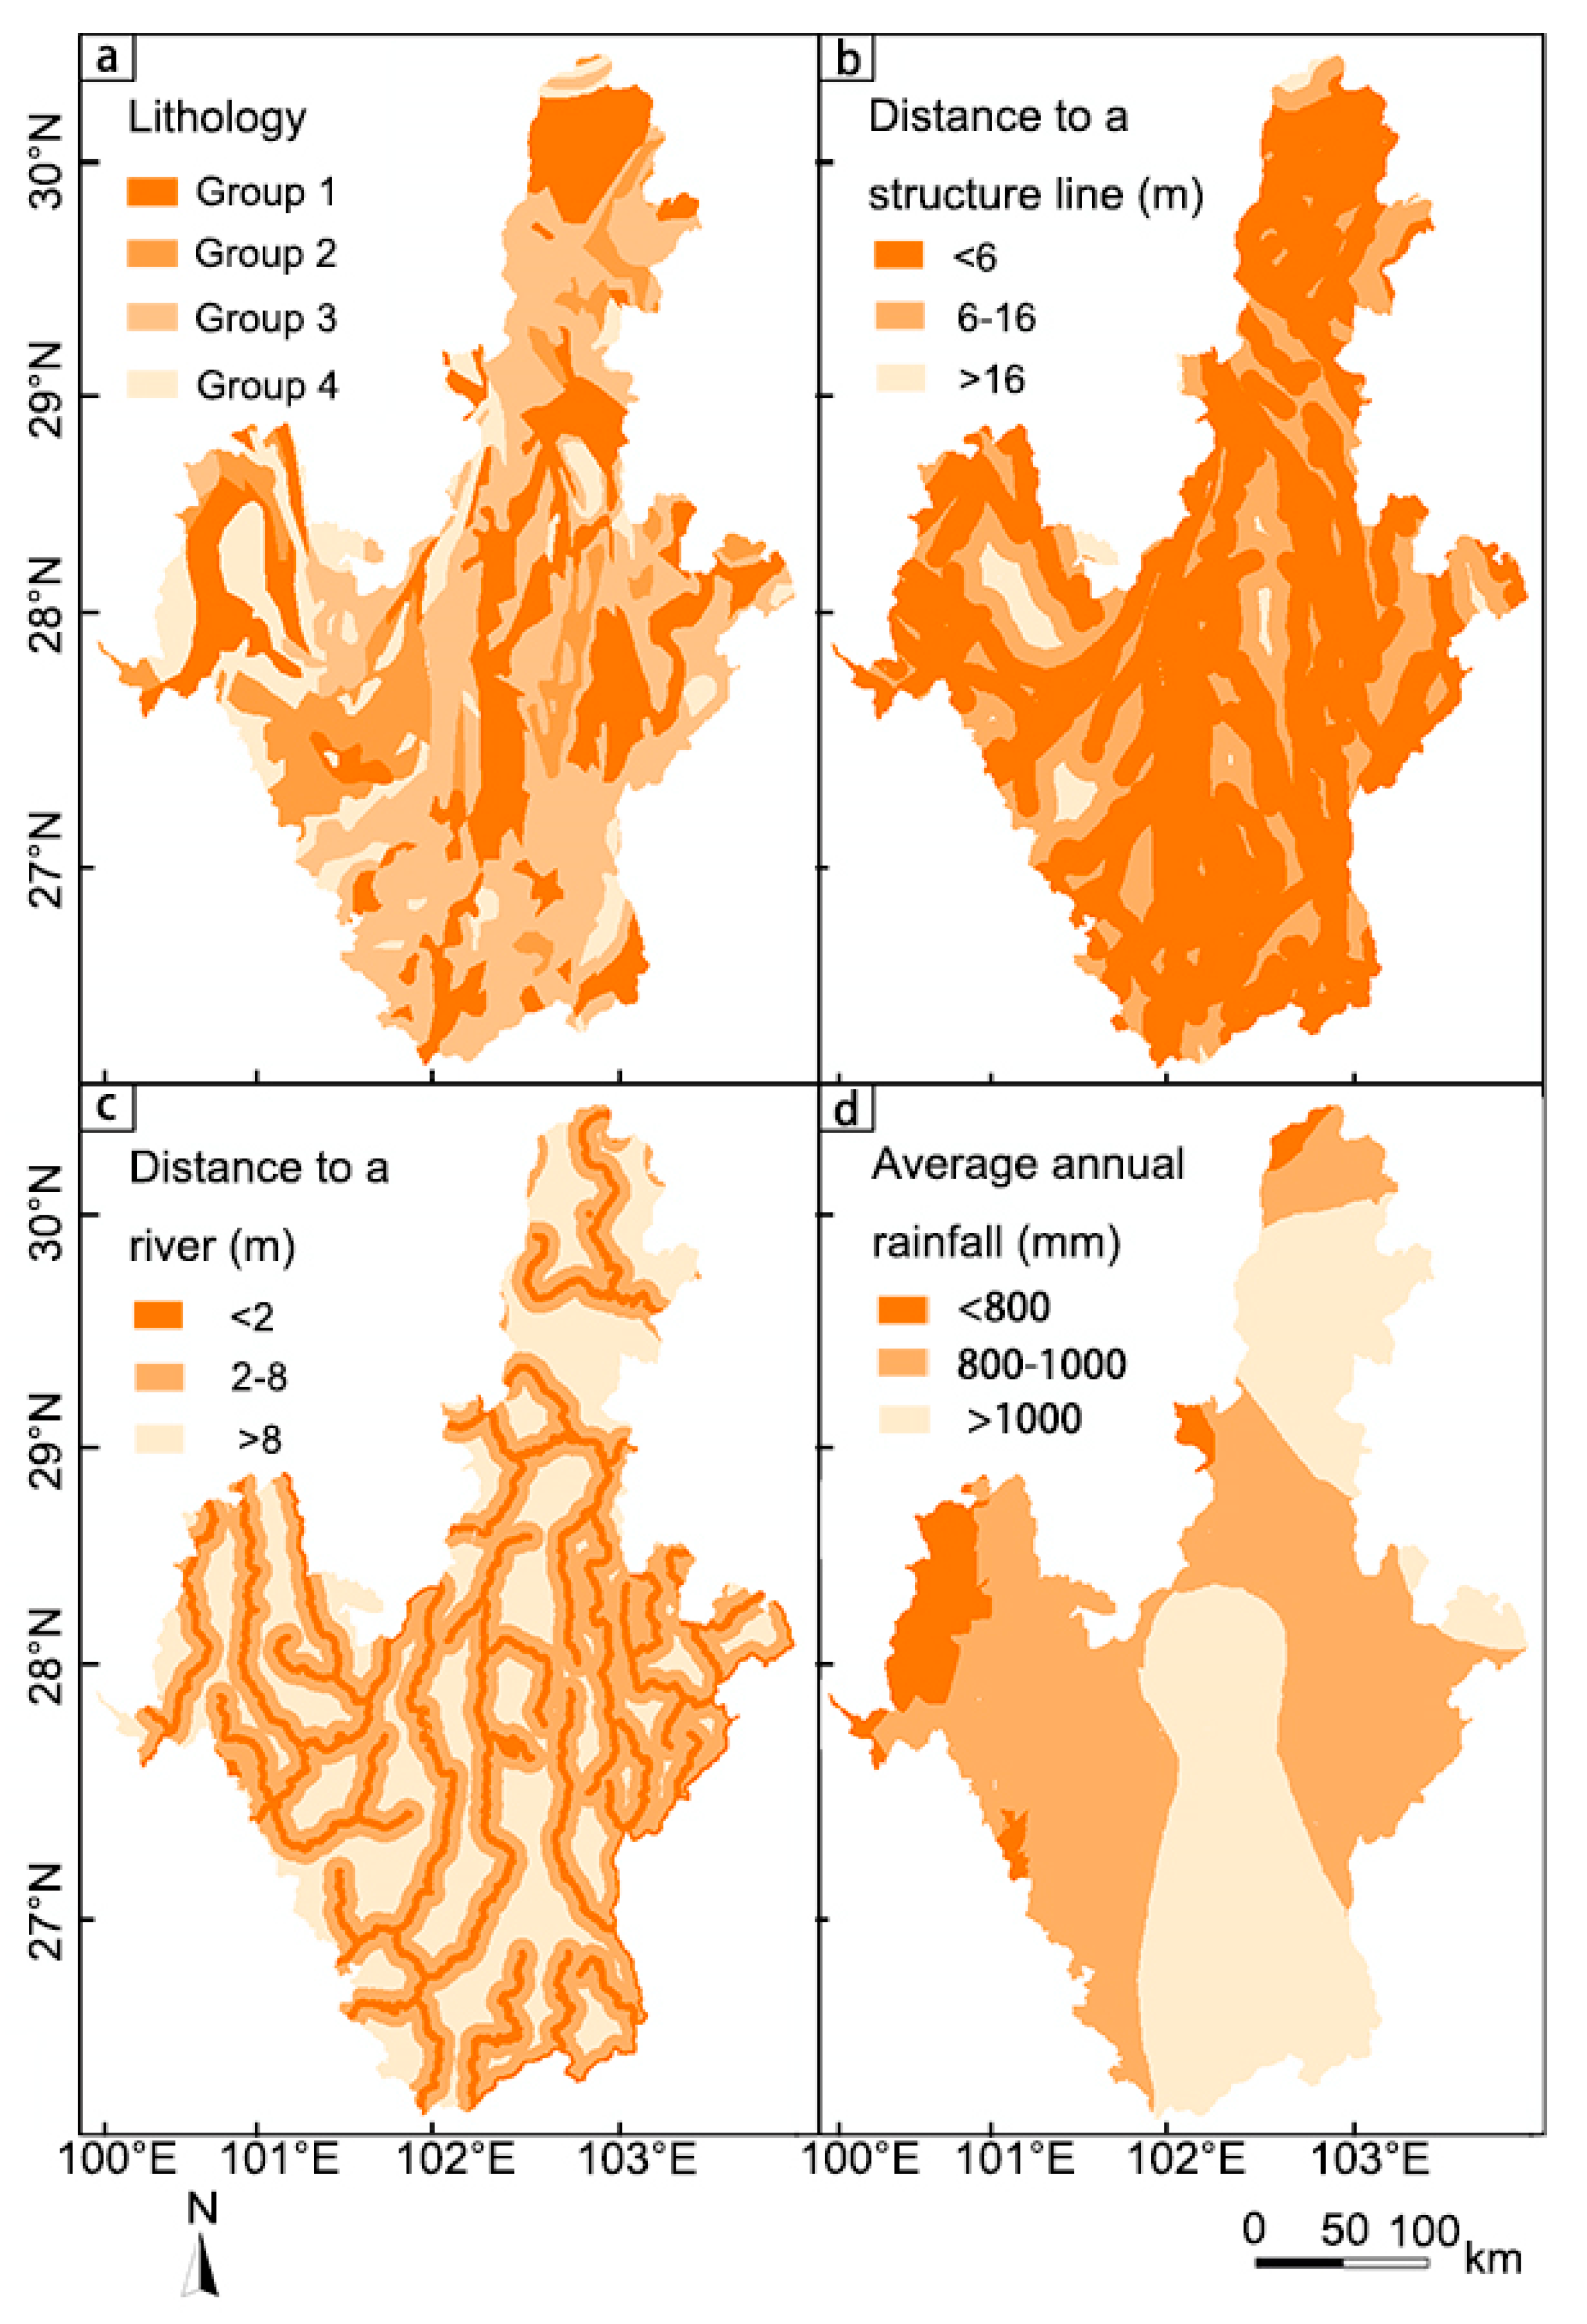
2.2. Influencing Factors
3. Methodology
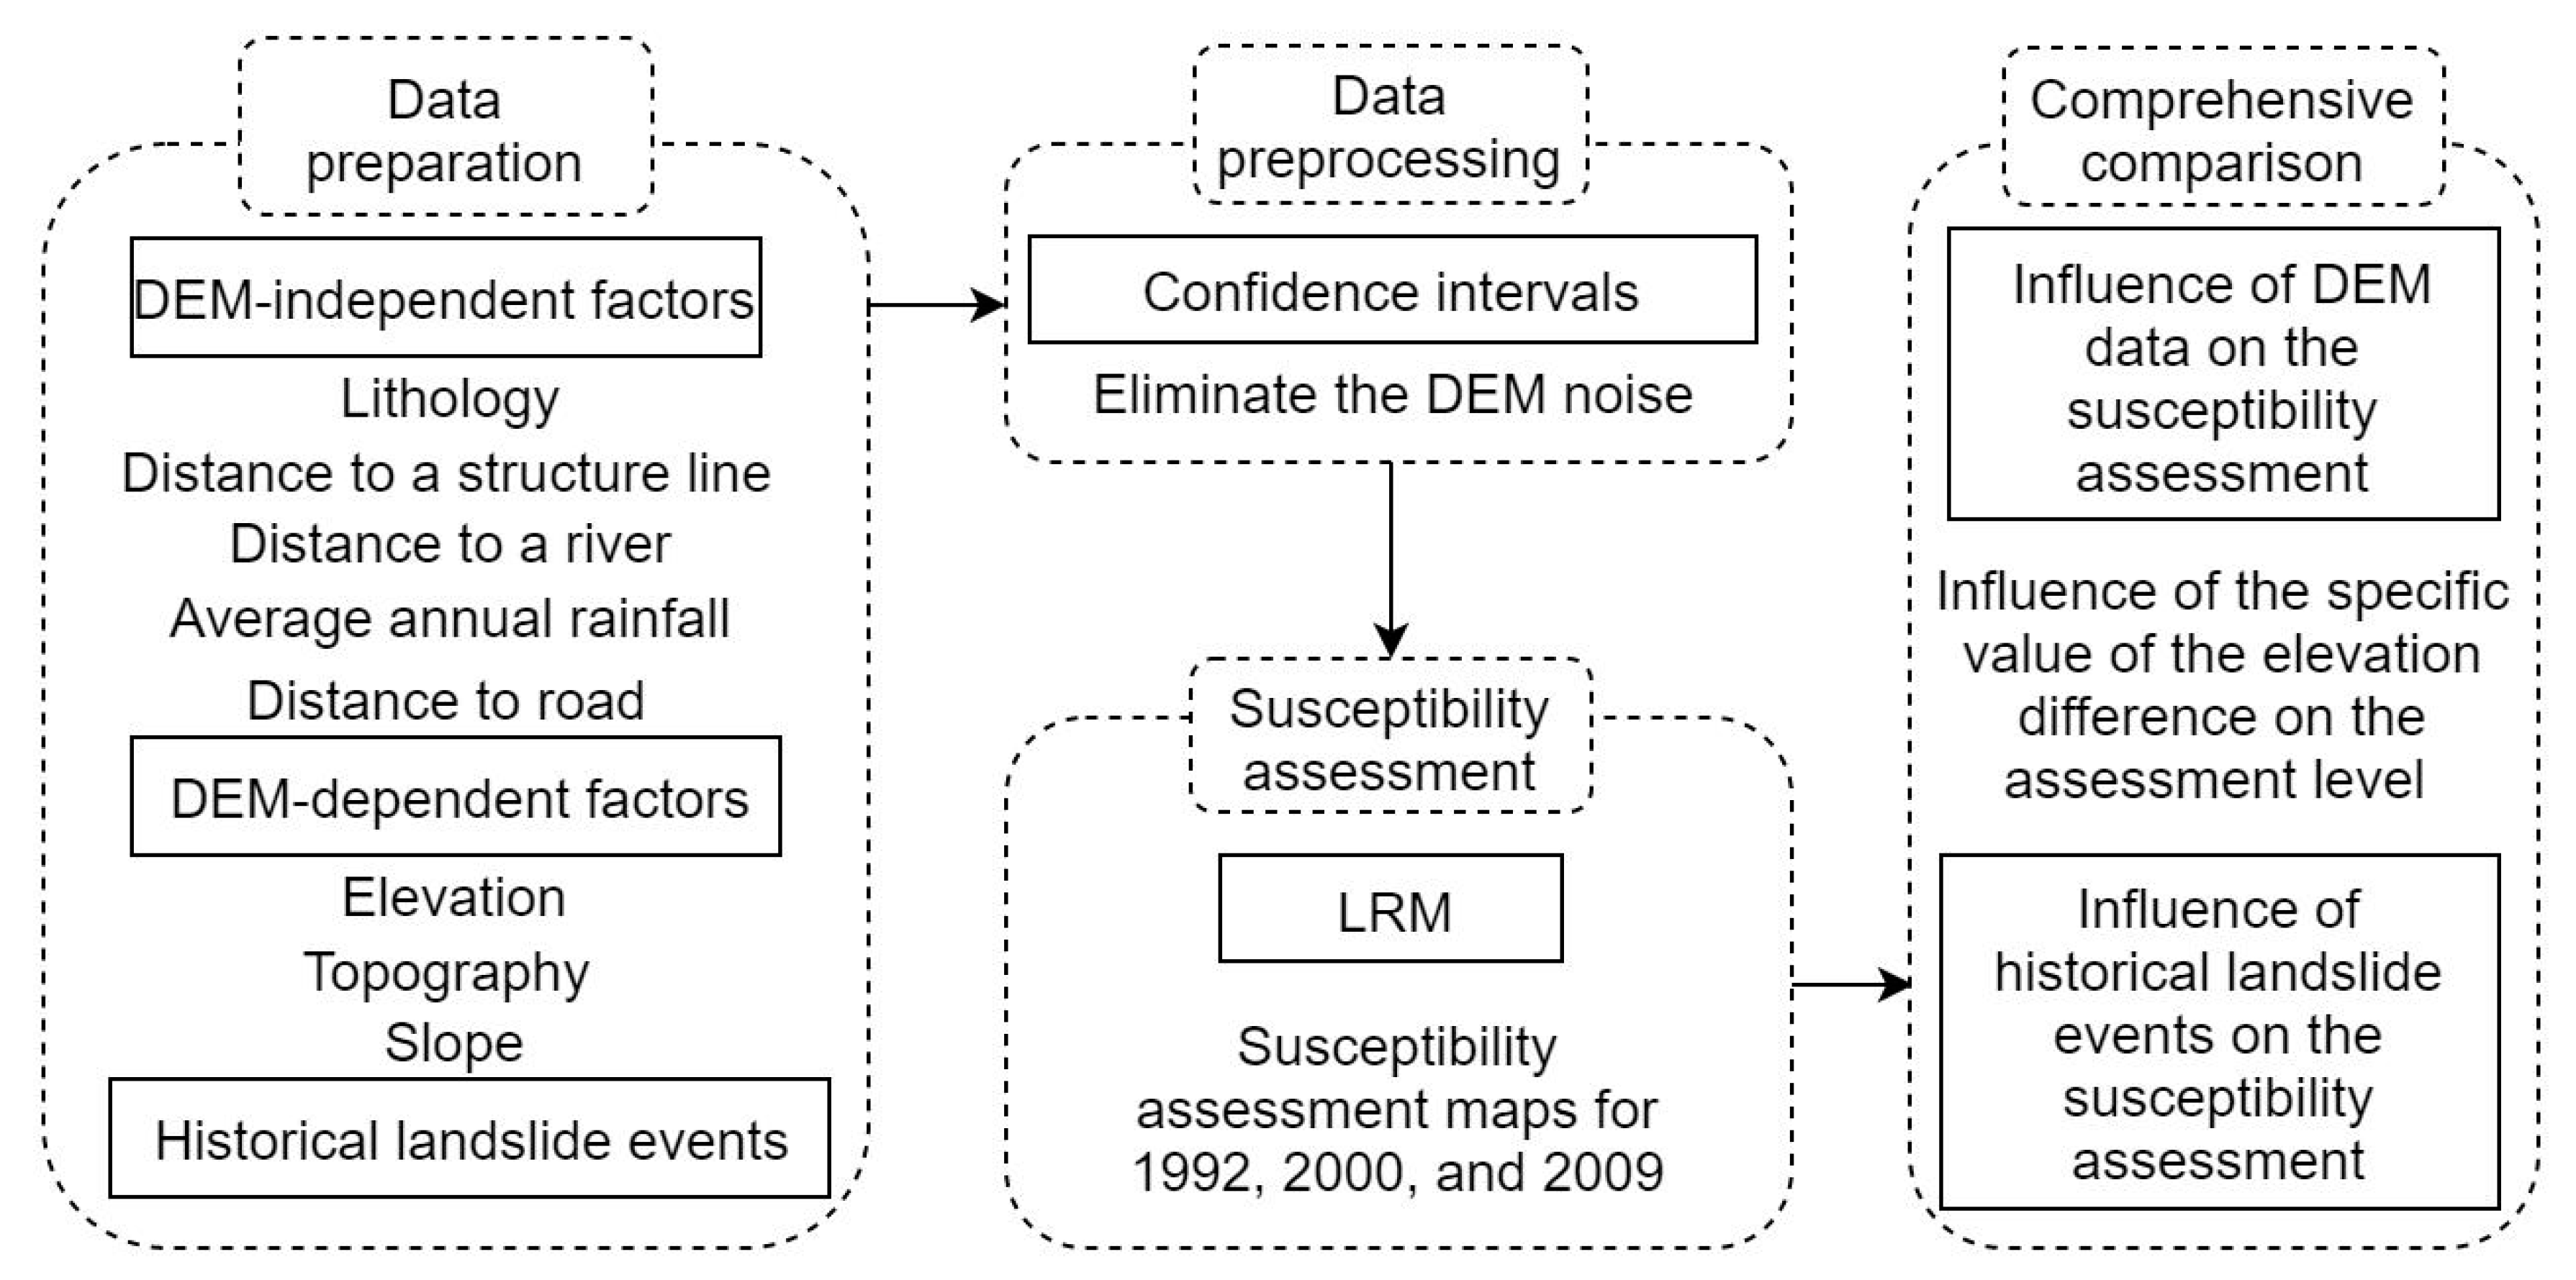
3.1. Flowchart
- (a)
- Data preparation. The multitemporal DEM data, influencing factors, and historical landslide events are prepared;
- (b)
- Data preprocessing. The multitemporal DEM data is compared to eliminate the noise based on coverage probabilities for confidence intervals;
- (c)
- Susceptibility assessment of landslides. The assessment results for 1992, 2000, and 2009 are obtained using a LRM;
- (d)
- Comparison and analysis. The assessment results for 1992, 2000, and 2009 are compared to obtain the impacts of the elevation difference and the historical landslide events on the susceptibility assessment.
3.2. Confidence Interval
3.3. LRM
3.4. Ratio of Number of Landslides to Area (RNA)
4. Results
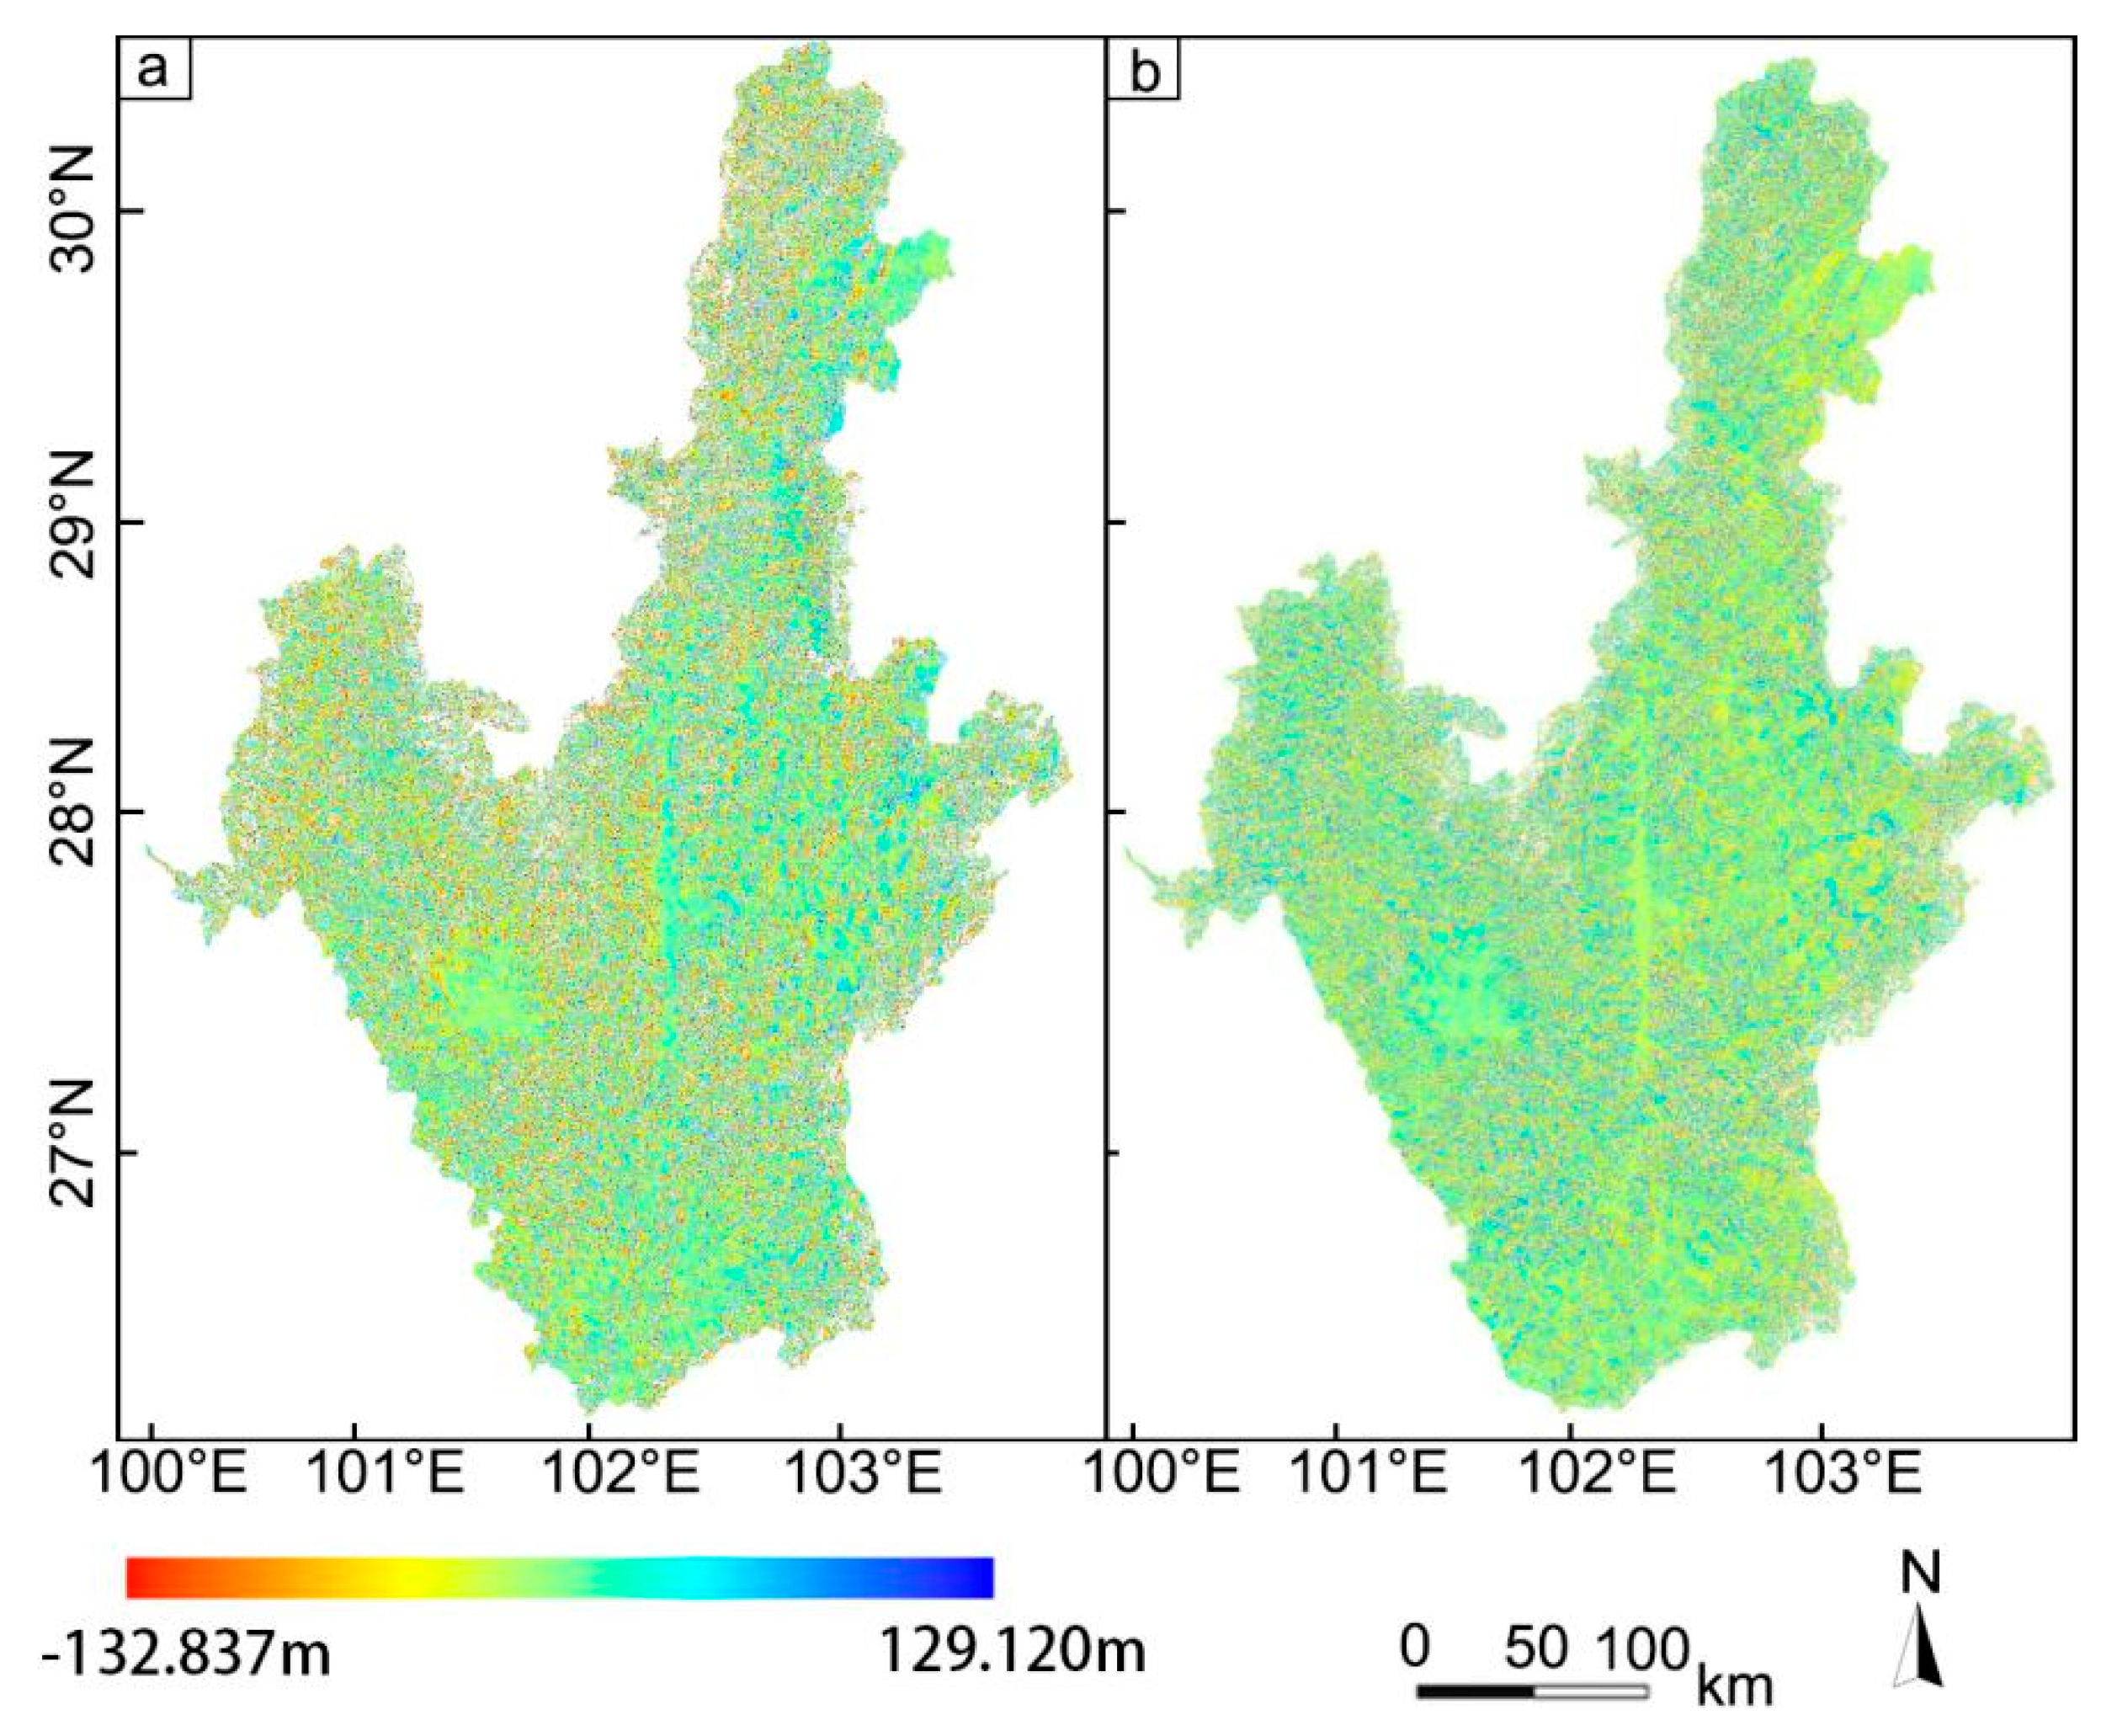
4.1. Elimination of Noise
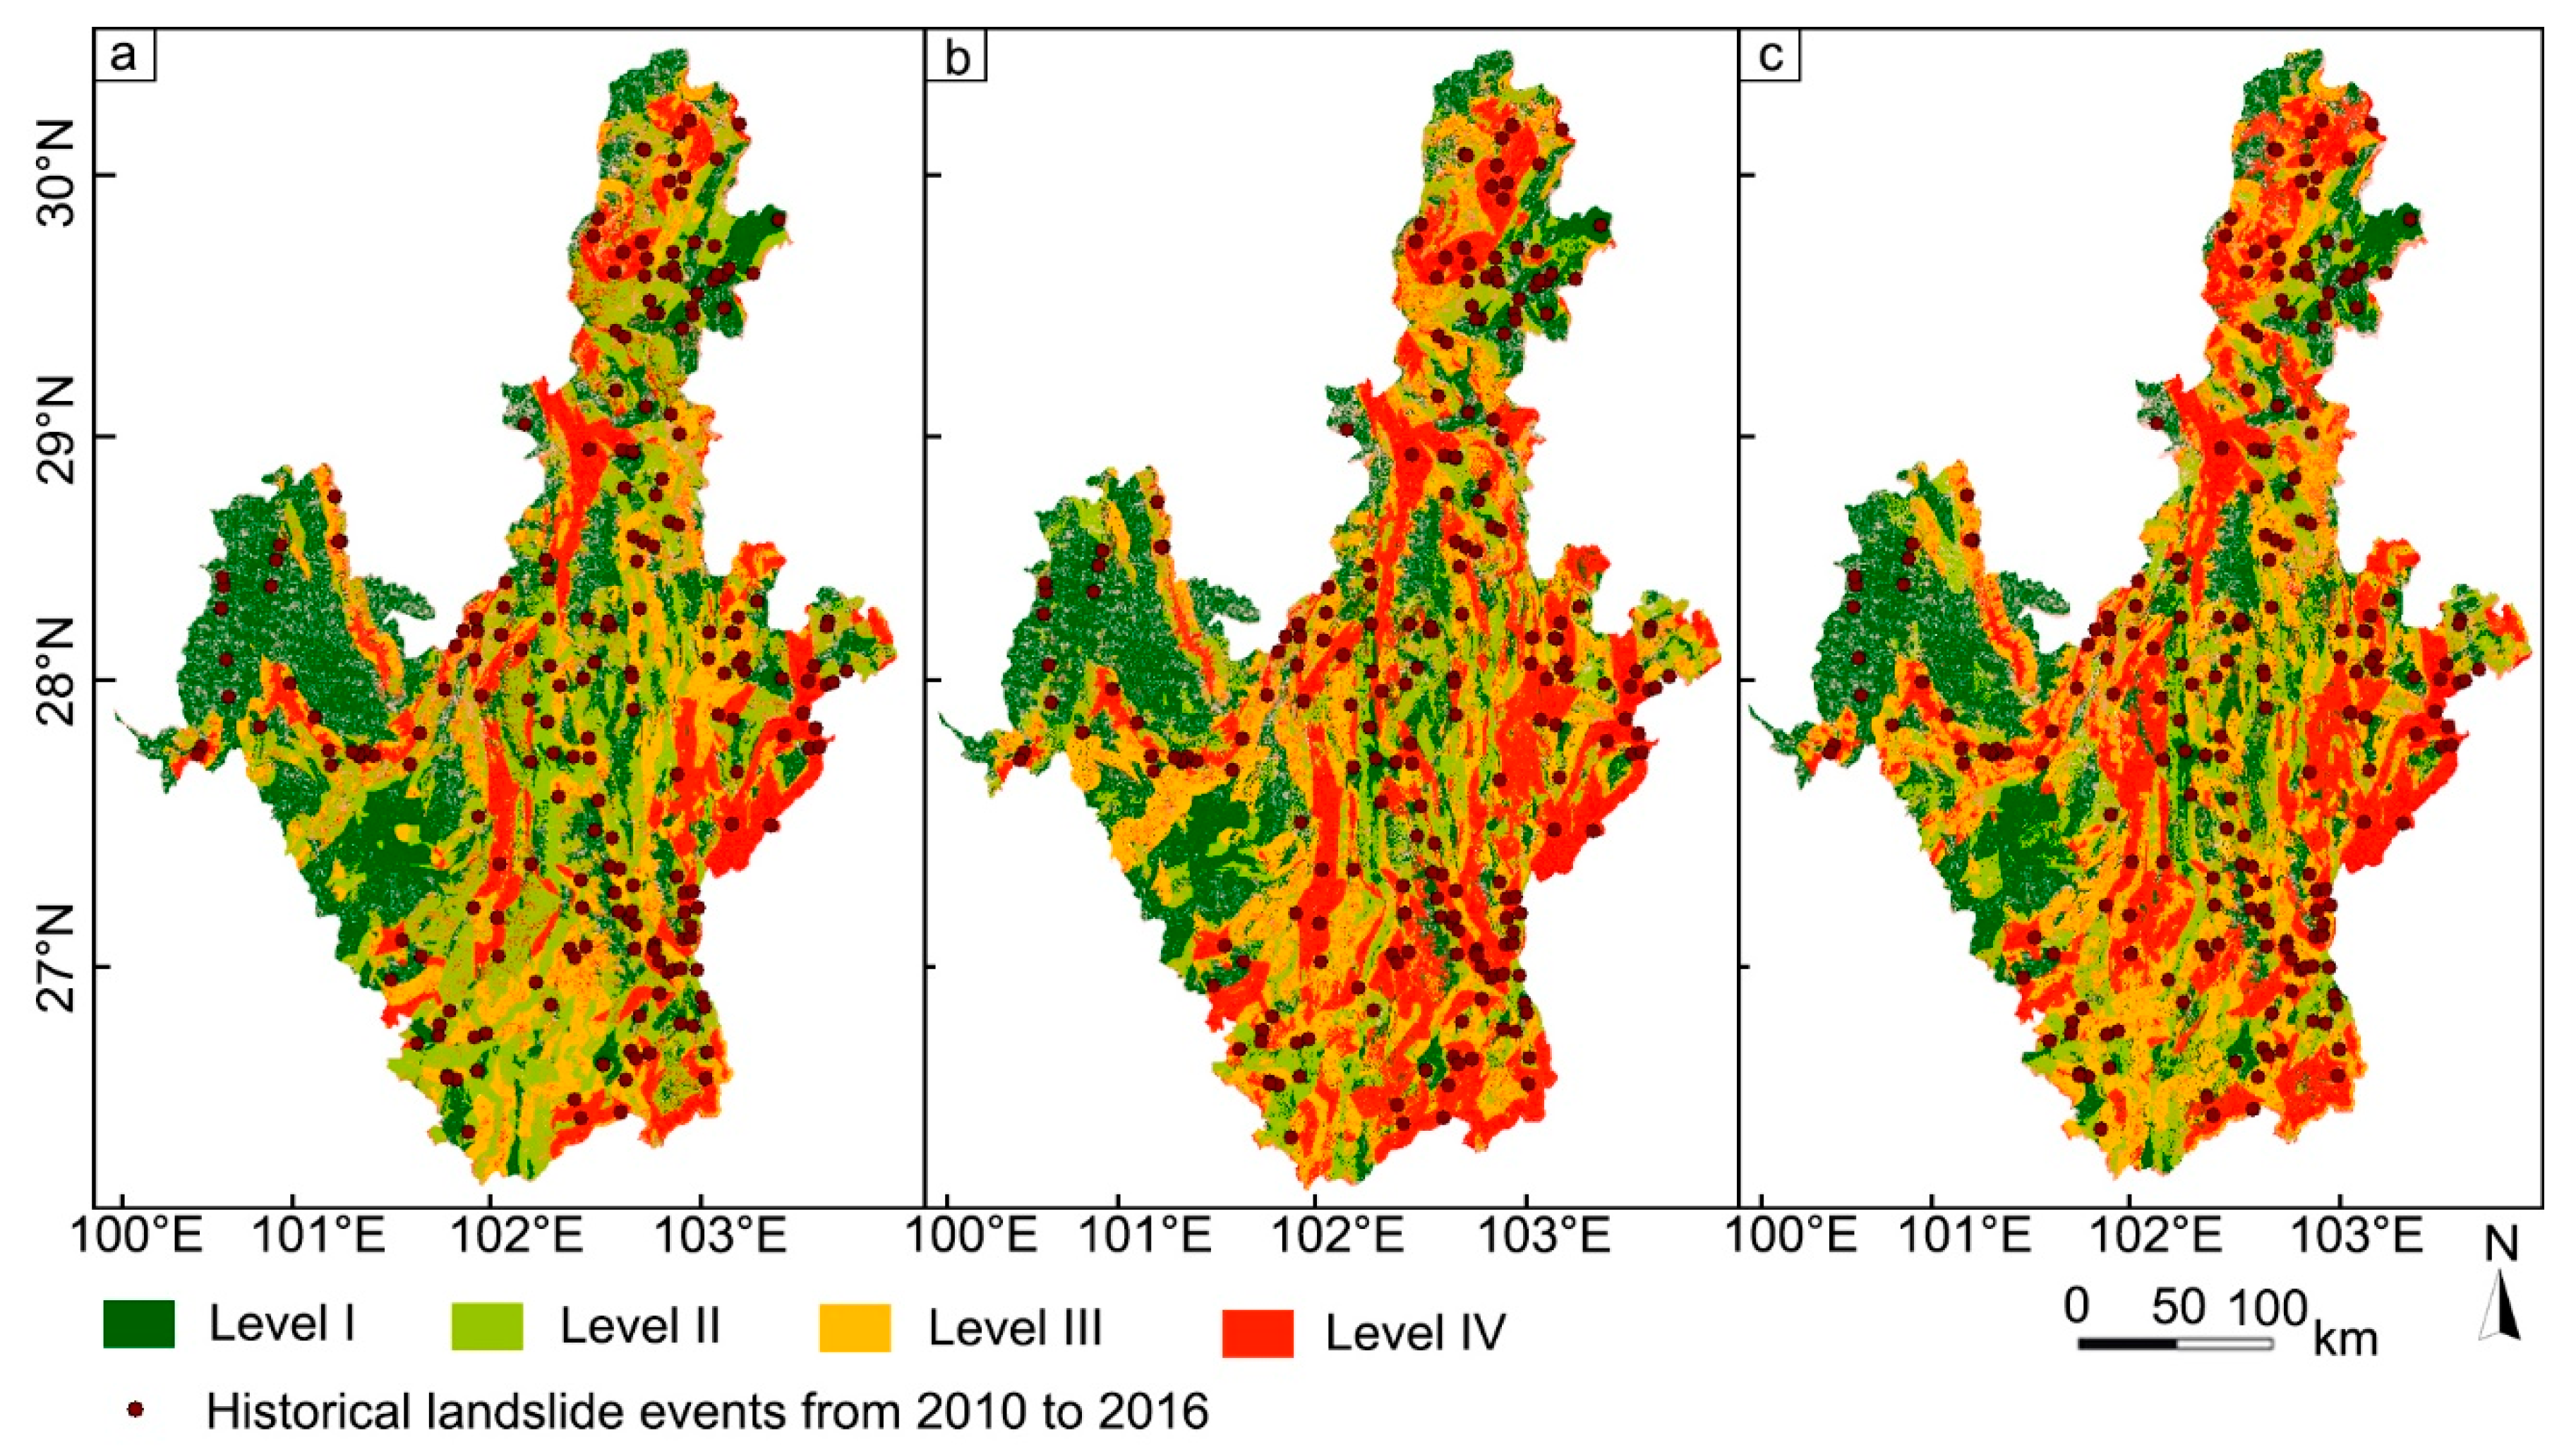
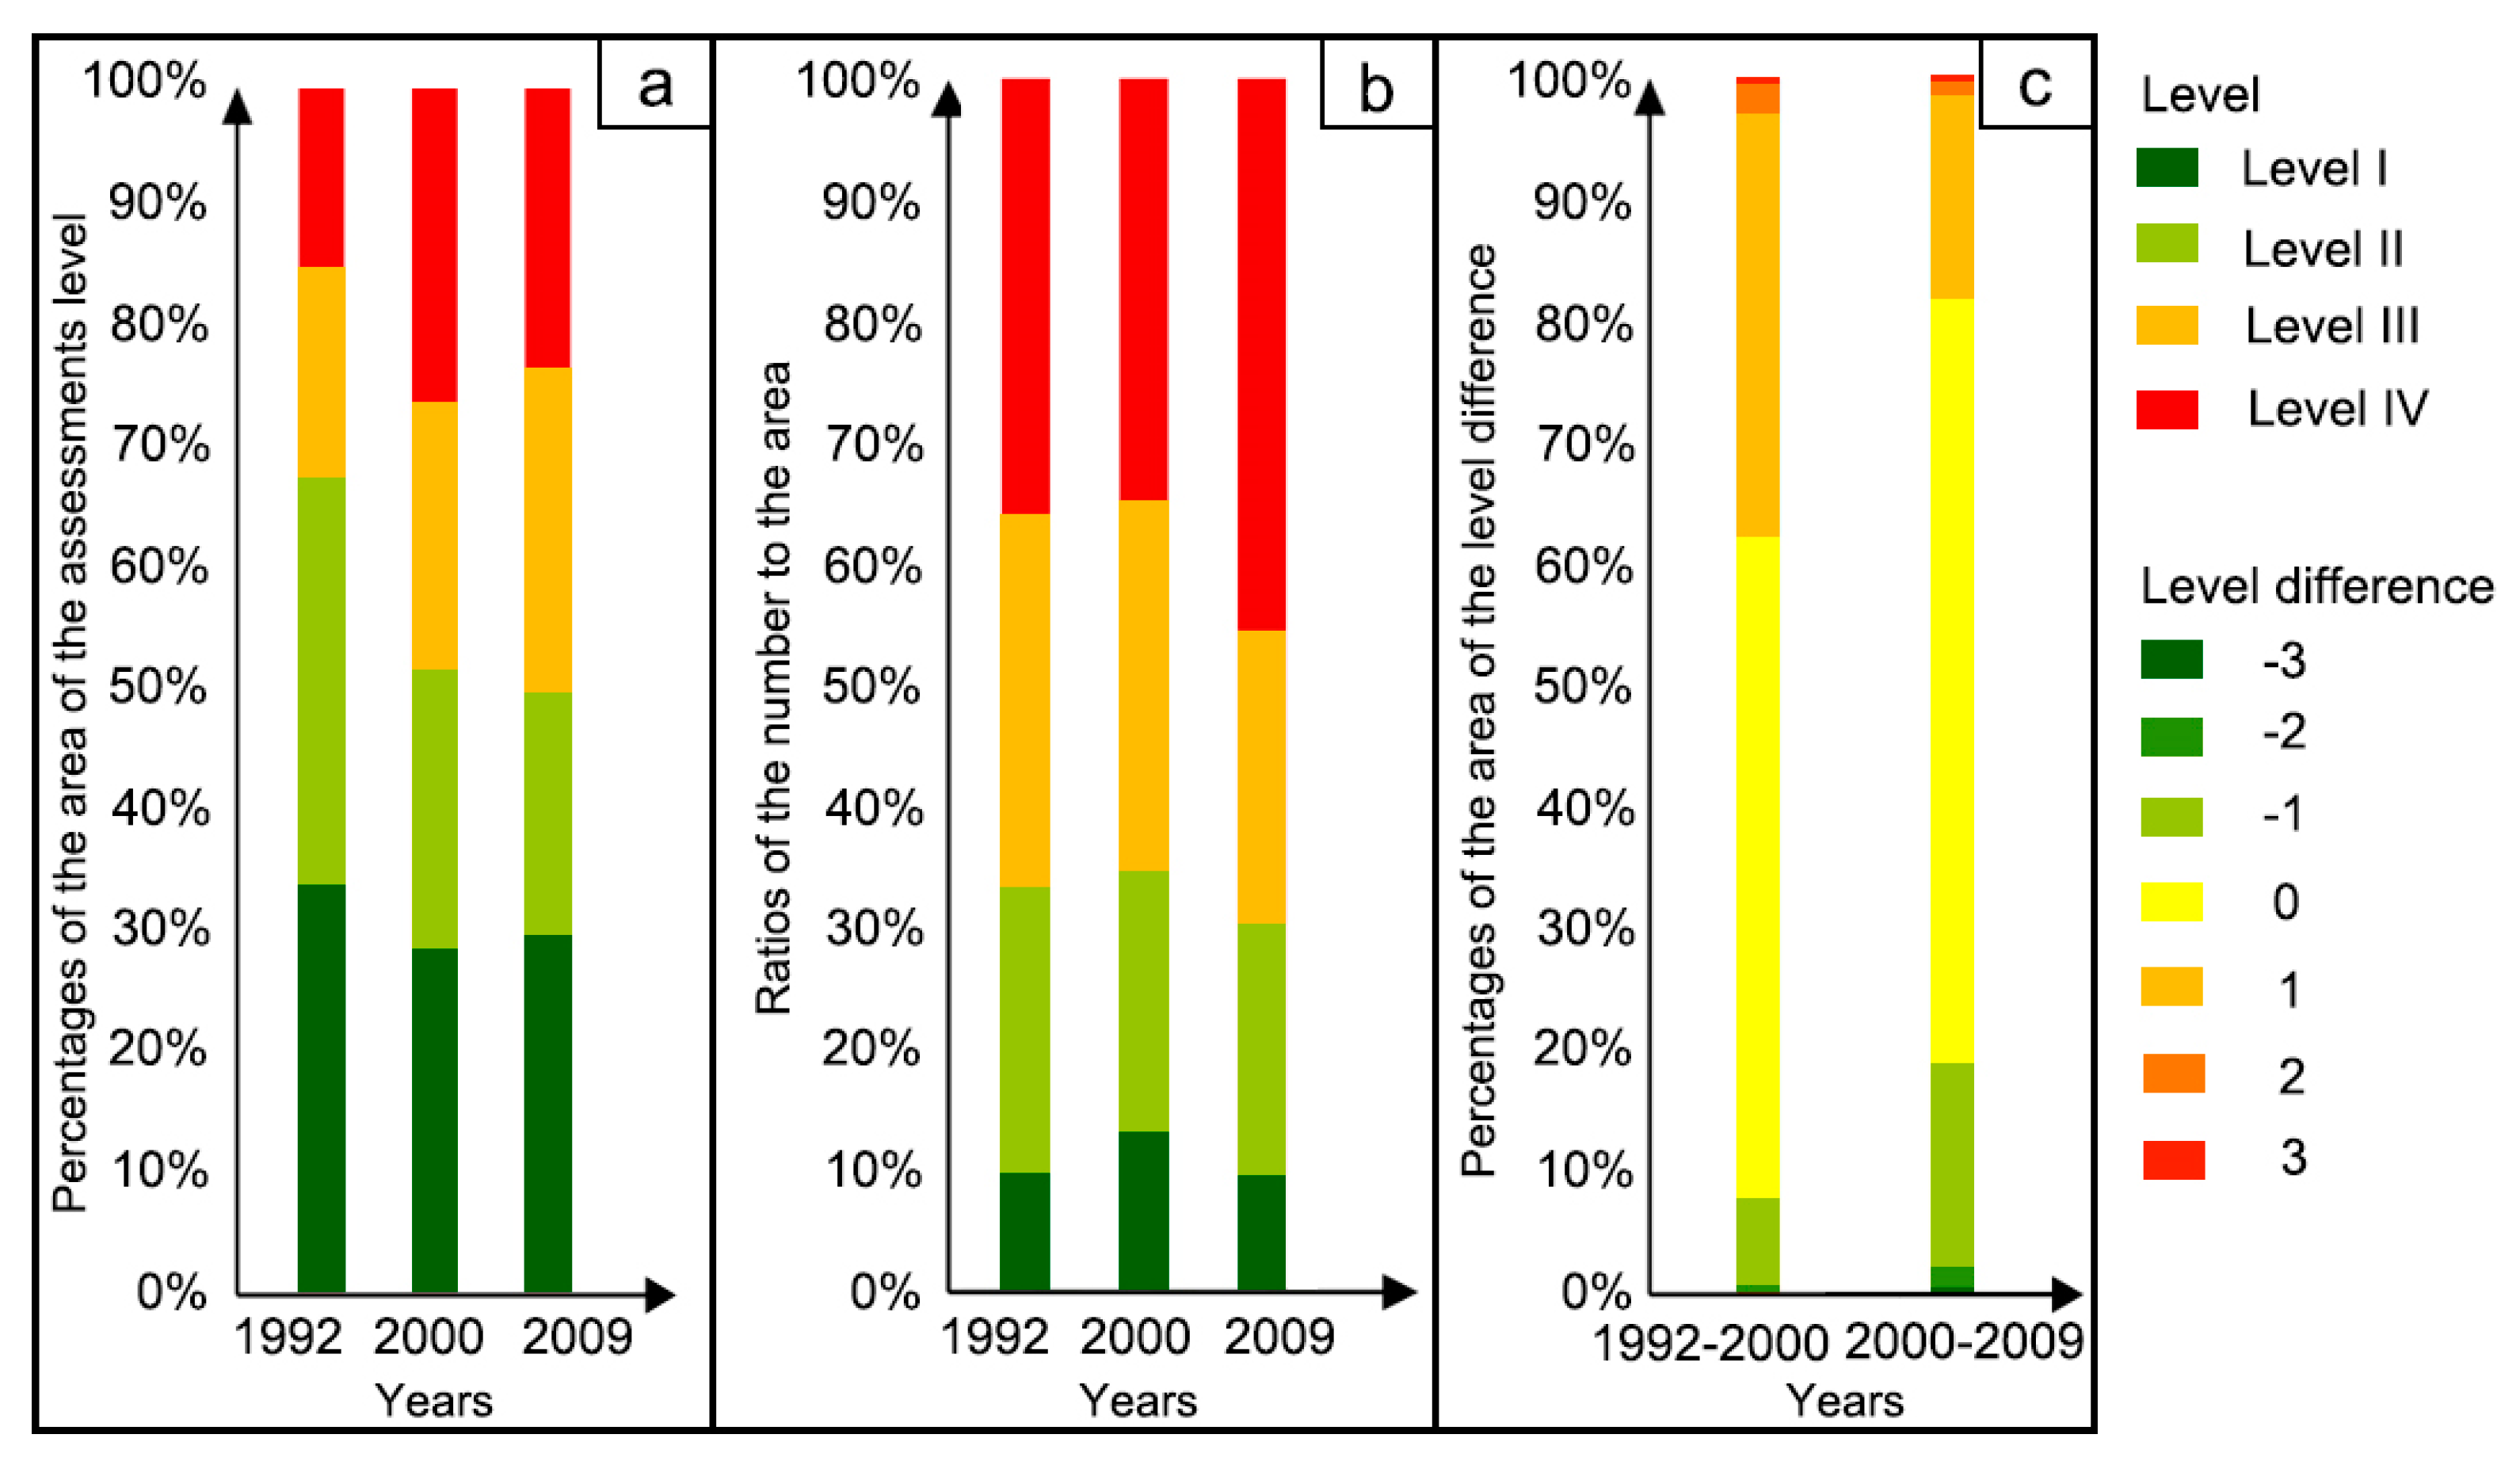
4.2. Susceptibility Assessments of Landslides
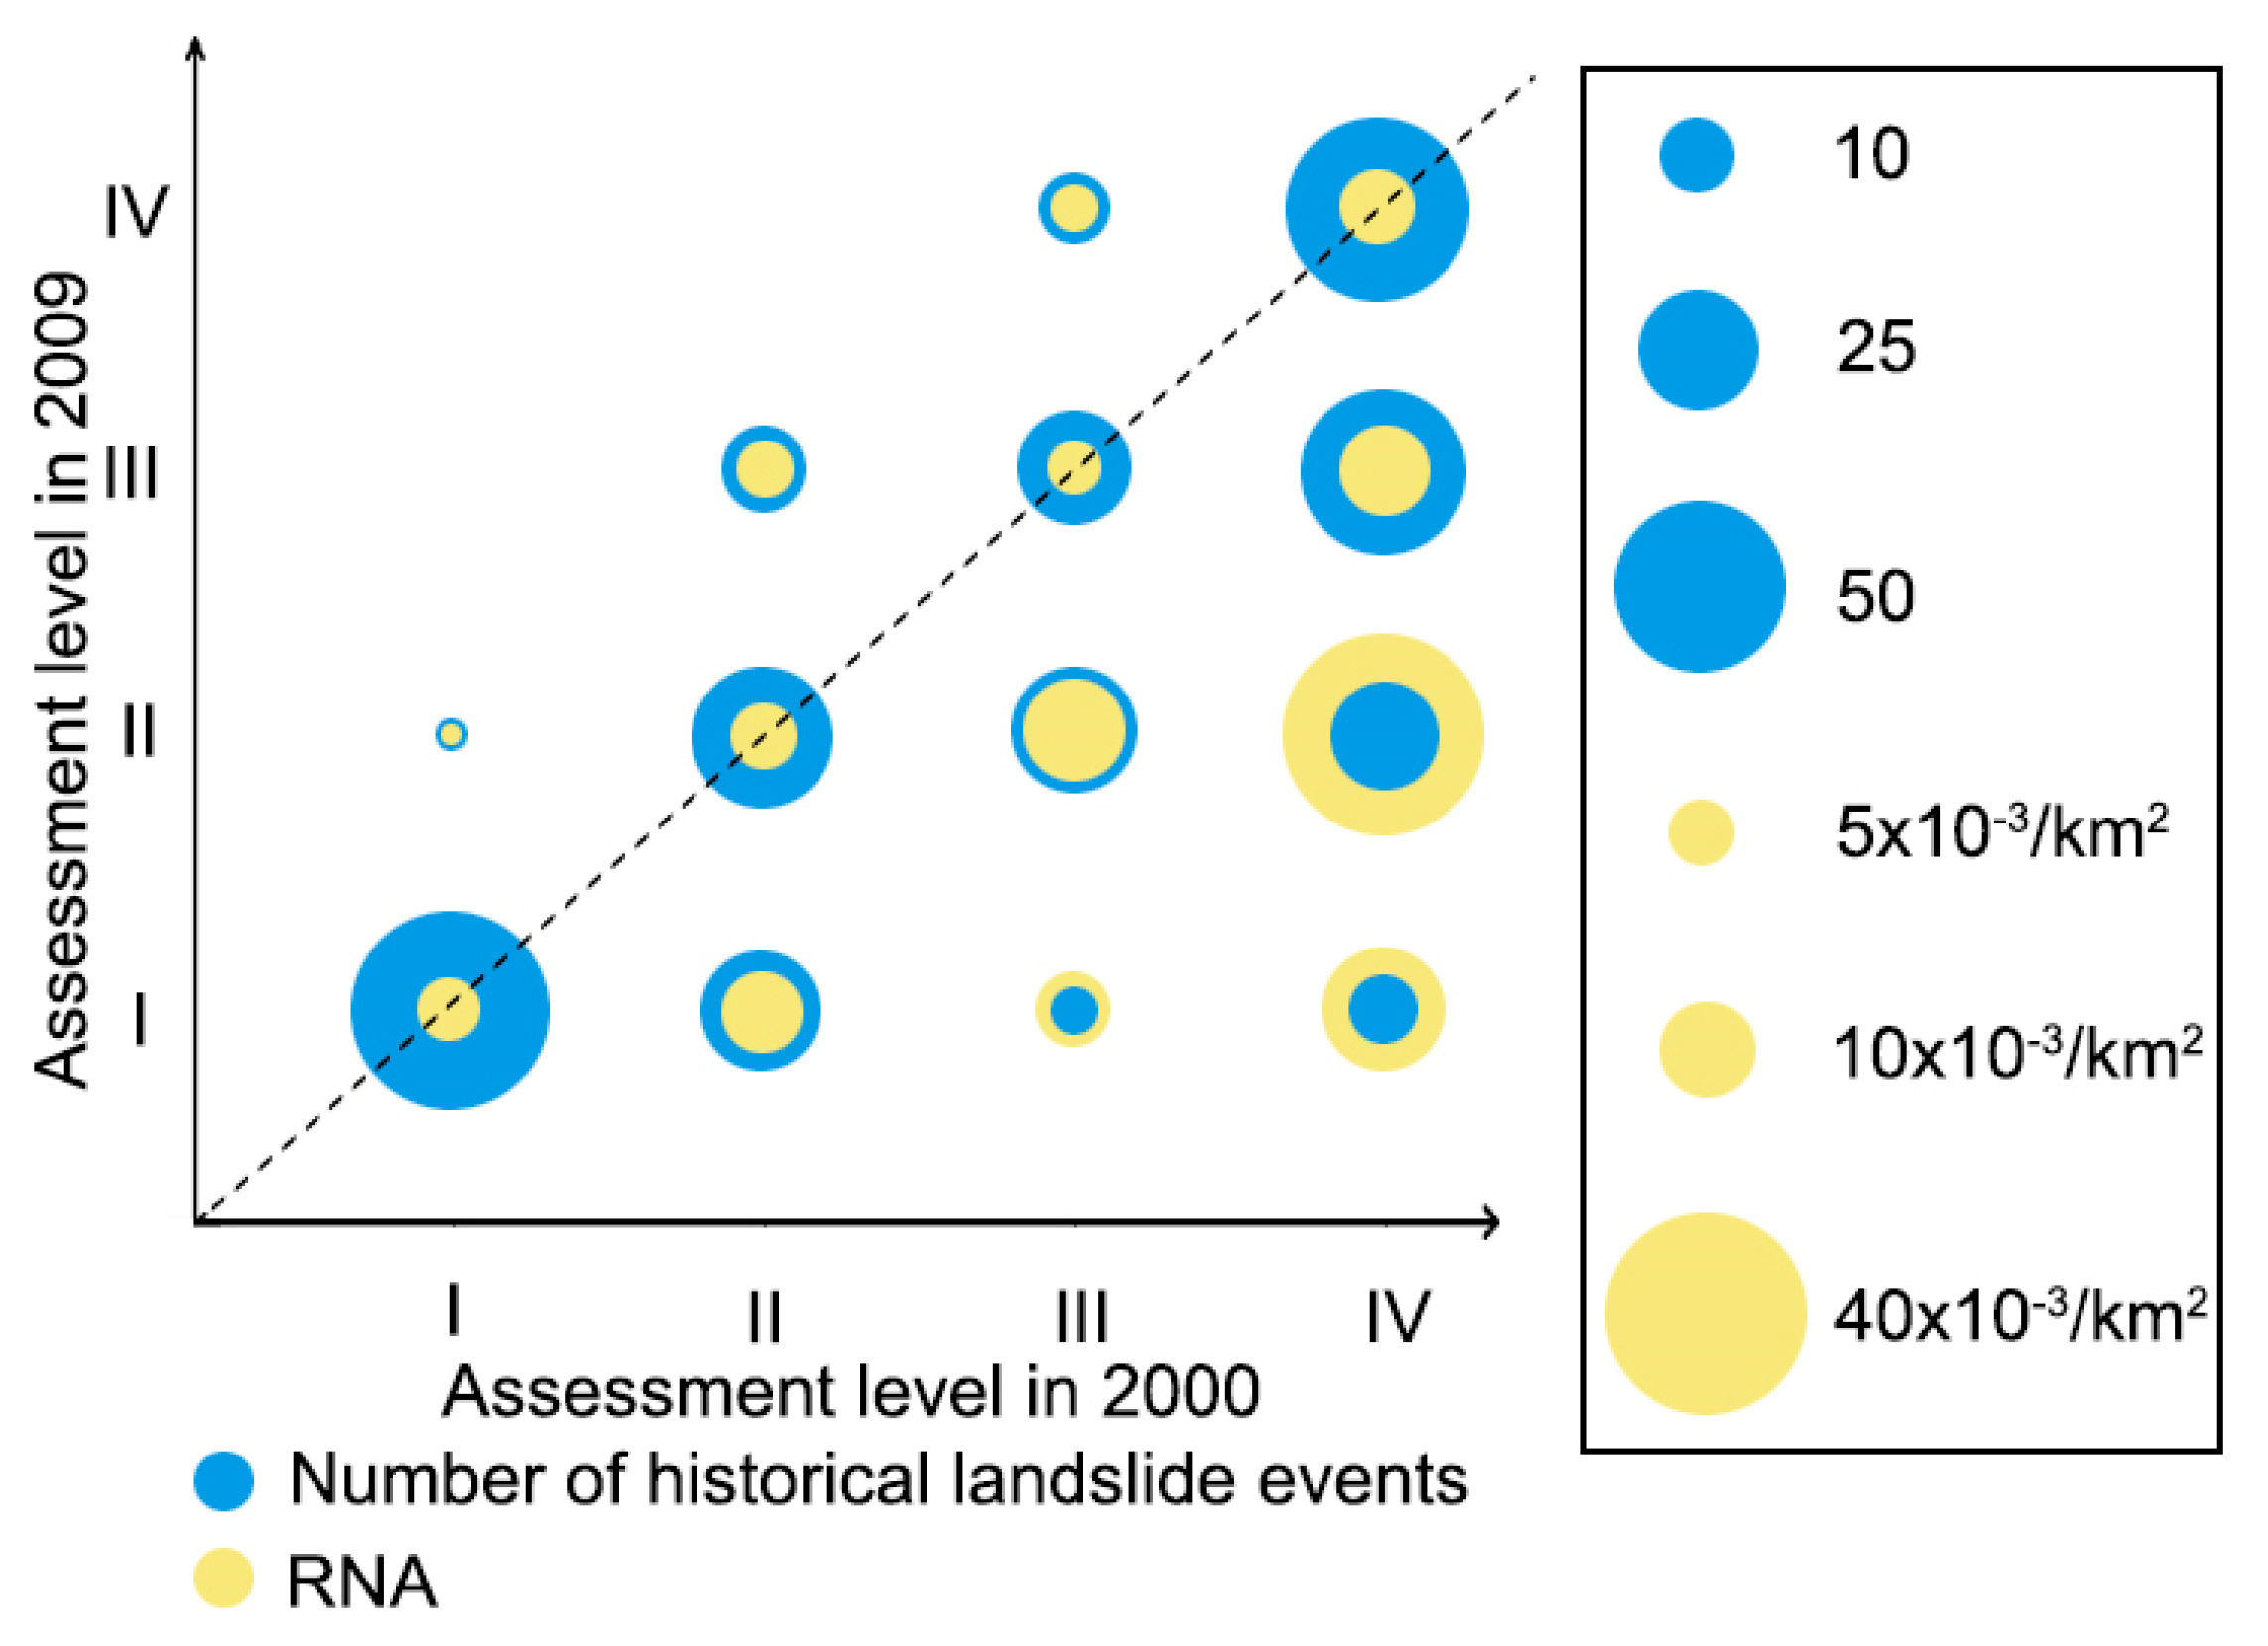
4.3. Assessment Levels of Historical Landslide Events
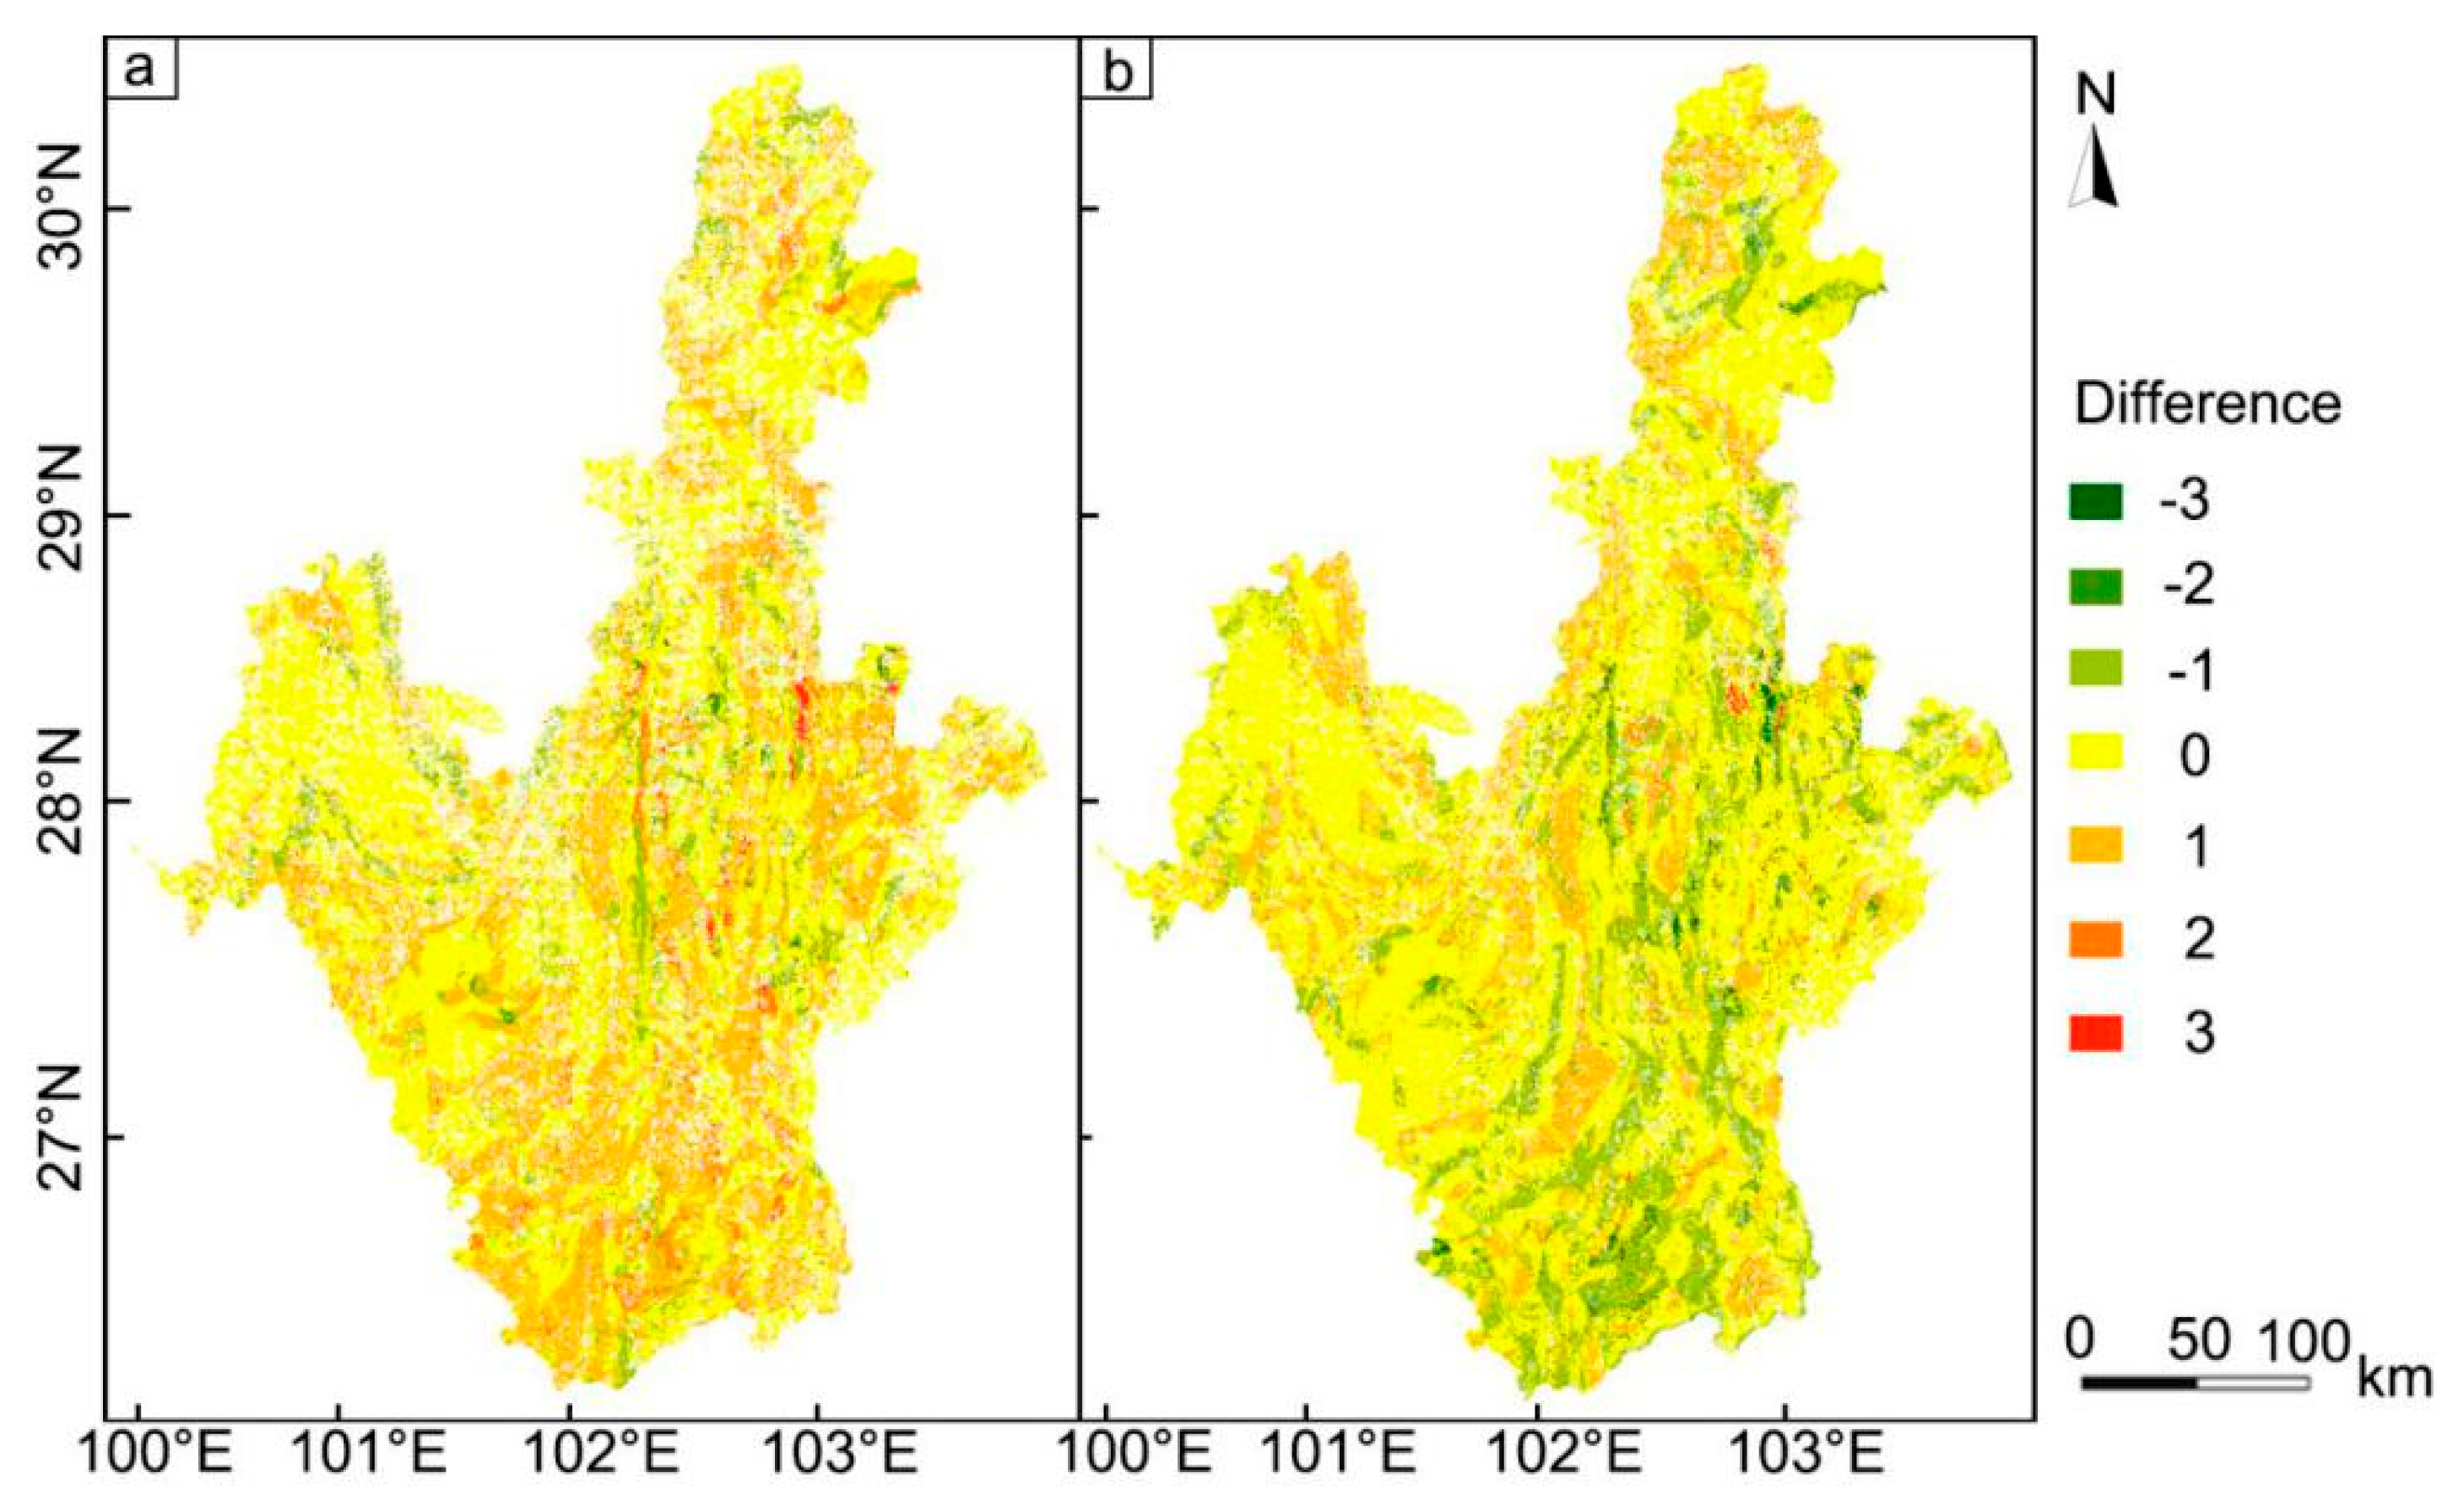
4.4. Differences between the Assessment Levels
5. Discussion
5.1. Comprehensive Comparison of Assessment Results for 1992, 2000, and 2009
5.2. Impact of Elevation Difference on the Susceptibility Assessment
5.3. Impact of Historical Landslide Events on Susceptibility Assessment
5.4. Advantages and Limitations
6. Conclusion
Author Contributions
Funding
Conflicts of Interest
References
- Wang, W.D.; Li, J.Y.; Qu, X.; Han, Z.; Liu, P. Prediction on landslide displacement using a new combinationmodel: A case study of Qinglong landslide in China. Nat. Hazards 2019, 96, 1121–1139. [Google Scholar] [CrossRef]
- Han, Z.; Chen, G.Q.; Li, Y.G.; Zhang, H.; He, Y. Elementary analysis on the bed-sediment entrainment by debris flow and its application using the TopFlowDF model. Geomat. Nat. Hazards Risk 2016, 7, 764–785. [Google Scholar] [CrossRef]
- Hong, H.; Pourghasemi, H.R.; Pourtaghi, Z.S. Landslide susceptibility assessment in Lianhua County (China): A comparison between a random forest data mining technique and bivariate and multivariate statistical models. Geomorphology 2016, 259, 105–118. [Google Scholar] [CrossRef]
- Patriche, C.V.; Pirnau, R.; Grozavu, A.; Rosca, B. A Comparative Analysis of Binary Logistic Regression and Analytical Hierarchy Process for Landslide Susceptibility Assessment in the Dobrov River Basin, Romania. Pedosphere 2016, 26, 335–350. [Google Scholar] [CrossRef]
- Cao, J.; Zhang, Z.; Wang, C.; Liu, J.; Zhang, L. Susceptibility assessment of landslides triggered by earthquakes in the Western Sichuan Plateau. Catena 2019, 175, 63–76. [Google Scholar] [CrossRef]
- Huang, Y.; Zhao, L. Review on landslide susceptibility mapping using support vector machines. Catena 2018, 165, 520–529. [Google Scholar] [CrossRef]
- Pham, B.T.; Pradhan, B.; Tien Bui, D.; Prakash, I.; Dholakia, M.B. A comparative study of different machine learning methods for landslide susceptibility assessment: A case study of Uttarakhand area (India). Environ. Model. Softw. 2016, 84, 240–250. [Google Scholar] [CrossRef]
- Han, Z.; Chen, G.; Li, Y.; Tang, C.; Xu, L.; He, Y.; Huang, X.; Wang, W. Numerical simulation of debris-flow behavior based on the SPH method incorporating the Herschel-Bulkley-Papanastasiou rheology model. Eng. Geol. 2019, 255, 26–36. [Google Scholar] [CrossRef]
- Han, Z.; Chen, G.Q.; Li, Y.G.; Wang, W.; Zhang, H. Exploring the velocity distribution of debris flows: An iterationalgorithm based approach for complex cross-sections. Geomorphology 2015, 241, 72–82. [Google Scholar] [CrossRef]
- Li, F.; Wang, W.; Xu, J.; Yi, J.; Wang, Q. Comparative study on vulnerability assessment for urban buried gas pipeline network based on SVM and ANN methods. Process Saf. Environ. Prot. 2019, 122, 23–32. [Google Scholar] [CrossRef]
- Pradhan, B.; Lee, S. Delineation of landslide hazard areas on Penang Island, Malaysia, by using frequency ratio, logistic regression, and artificial neural network models. Environ. Earth Sci. 2010, 60, 1037–1054. [Google Scholar] [CrossRef]
- Chiri, H.; Abascal, A.J.; Castanedo, S.; Medina, R. Mid-long term oil spill forecast based on logistic regression modelling of met-ocean forcings. Mar. Pollut. Bull. 2019, 146, 962–976. [Google Scholar] [CrossRef] [PubMed]
- Zhou, F.; Zhang, Q.; Sornette, D.; Jiang, L. Cascading logistic regression onto gradient boosted decision trees for forecasting and trading stock indices. Appl. Soft Comput. 2019, 84, 105747. [Google Scholar] [CrossRef]
- Tsangaratos, P.; Ilia, I. Comparison of a logistic regression and Naïve Bayes classifier in landslide susceptibility assessments: The influence of models complexity and training dataset size. Catena 2016, 145, 164–179. [Google Scholar] [CrossRef]
- Lin, G.-F.; Chang, M.-J.; Huang, Y.-C.; Ho, J.-Y. Assessment of susceptibility to rainfall-induced landslides using improved self-organizing linear output map, support vector machine, and logistic regression. Eng. Geol. 2017, 224, 62–74. [Google Scholar] [CrossRef]
- Jacobs, L.; Kervyn, M.; Reichenbach, P.; Rossi, M.; Marchesini, I.; Alvioli, M.; Dewitte, O. Regional susceptibility assessments with heterogeneous landslide information: Slope unit- vs. pixel-based approach. Geomorphology 2020, 356, 107084. [Google Scholar] [CrossRef]
- Bui, D.T.; Tsangaratos, P.; Nguyen, V.-T.; Liem, N.V.; Trinh, P.T. Comparing the prediction performance of a Deep Learning Neural Network model with conventional machine learning models in landslide susceptibility assessment. Catena 2020, 188, 104426. [Google Scholar] [CrossRef]
- Li, Y.; Liu, X.; Han, Z.; Dou, J. Spatial Proximity-Based Geographically Weighted Regression Model for Landslide Susceptibility Assessment: A Case Study of Qingchuan Area, China. Appl. Sci. 2020, 10, 1107. [Google Scholar] [CrossRef]
- Mokadem, N.; Boughariou, E.; Mudarra, M.; Ben Brahim, F.; Andreo, B.; Hamed, Y.; Bouri, S. Mapping potential zones for groundwater recharge and its evaluation in arid environments using a GIS approach: Case study of North Gafsa Basin (Central Tunisia). J. Afr. Earth Sci. 2018, 141, 107–117. [Google Scholar] [CrossRef]
- Pham, B.T.; Tien Bui, D.; Pham, H.V.; Le, H.Q.; Prakash, I.; Dholakia, M.B. Landslide Hazard Assessment Using Random SubSpace Fuzzy Rules Based Classifier Ensemble and Probability Analysis of Rainfall Data: A Case Study at Mu Cang Chai District, Yen Bai Province (Viet Nam). J. Indian Soc. Remote Sens. 2017, 45, 673–683. [Google Scholar] [CrossRef]
- Pourghasemi, H.R.; Teimoori Yansari, Z.; Panagos, P.; Pradhan, B. Analysis and evaluation of landslide susceptibility: A review on articles published during 2005–2016 (periods of 2005–2012 and 2013–2016). Arab. J. Geosci. 2018, 11, 193. [Google Scholar] [CrossRef]
- Liu, K.; Song, C.; Ke, L.; Jiang, L.; Ma, R. Automatic watershed delineation in the Tibetan endorheic basin: A lake-oriented approach based on digital elevation models. Geomorphology 2020, 358, 107127. [Google Scholar] [CrossRef]
- Deng, F.; Rodgers, M.; Xie, S.; Dixon, T.H.; Charbonnier, S.; Gallant, E.A.; López Vélez, C.M.; Ordoñez, M.; Malservisi, R.; Voss, N.K.; et al. High-resolution DEM generation from spaceborne and terrestrial remote sensing data for improved volcano hazard assessment—A case study at Nevado del Ruiz, Colombia. Remote Sens. Environ. 2019, 233, 111348. [Google Scholar] [CrossRef]
- Lee, C.-F.; Huang, W.-K.; Chang, Y.-L.; Chi, S.-Y.; Liao, W.-C. Regional landslide susceptibility assessment using multi-stage remote sensing data along the coastal range highway in northeastern Taiwan. Geomorphology 2018, 300, 113–127. [Google Scholar] [CrossRef]
- Schlögel, R.; Marchesini, I.; Alvioli, M.; Reichenbach, P.; Rossi, M.; Malet, J.P. Optimizing landslide susceptibility zonation: Effects of DEM spatial resolution and slope unit delineation on logistic regression models. Geomorphology 2018, 301, 10–20. [Google Scholar] [CrossRef]
- Juliev, M.; Mergili, M.; Mondal, I.; Nurtaev, B.; Pulatov, A.; Hübl, J. Comparative analysis of statistical methods for landslide susceptibility mapping in the Bostanlik District, Uzbekistan. Sci. Total Environ. 2019, 653, 801–814. [Google Scholar] [CrossRef]
- Hong, H.; Miao, Y.; Liu, J.; Zhu, A.X. Exploring the effects of the design and quantity of absence data on the performance of random forest-based landslide susceptibility mapping. Catena 2019, 176, 45–64. [Google Scholar] [CrossRef]
- He, Q.; Shahabi, H.; Shirzadi, A.; Li, S.; Chen, W.; Wang, N.; Chai, H.; Bian, H.; Ma, J.; Chen, Y.; et al. Landslide spatial modelling using novel bivariate statistical based Naïve Bayes, RBF Classifier, and RBF Network machine learning algorithms. Sci. Total Environ. 2019, 663, 1–15. [Google Scholar] [CrossRef]
- Khan, H.; Shafique, M.; Khan, M.A.; Bacha, M.A.; Shah, S.U.; Calligaris, C. Landslide susceptibility assessment using Frequency Ratio, a case study of northern Pakistan. Egypt. J. Remote Sens. Space Sci. 2019, 22, 11–24. [Google Scholar] [CrossRef]
- Cucchiaro, S.; Cavalli, M.; Vericat, D.; Crema, S.; Llena, M.; Beinat, A.; Marchi, L.; Cazorzi, F. Geomorphic effectiveness of check dams in a debris-flow catchment using multi-temporal topographic surveys. Catena 2019, 174, 73–83. [Google Scholar] [CrossRef]
- Pineux, N.; Lisein, J.; Swerts, G.; Bielders, C.L.; Lejeune, P.; Colinet, G.; Degré, A. Can DEM time series produced by UAV be used to quantify diffuse erosion in an agricultural watershed? Geomorphology 2017, 280, 122–136. [Google Scholar] [CrossRef]
- Dou, J.; Yunus, A.P.; Bui, D.T.; Merghad, A.; Sahana, M.; Zhu, Z.F.; Chen, C.W.; Han, Z.; Pham, B.T. Improved landslide assessment using support vector machine with bagging, boosting, and stacking ensemble machine learning framework in a mountainous watershed, Japan. Landslides 2020, 17, 641–658. [Google Scholar] [CrossRef]
- Gu, X.D.; Liu, X.H. Rock Formations in Sichuan; China University of Geosciences Press: Wuhan, China, 1997. [Google Scholar]
- Xu, W.C. Research on Hydrogeological and Environmental Geological Survey Strategy in Sichuan Province. Earth 2015, 10, 229. [Google Scholar]
- CGEIS. China Geological Environment Information Site. Bulletin of National Geological Hazards 2004–2016. Available online: http://www.cigem.gov.cn (accessed on 22 February 2017).
- Trigila, A.; Iadanza, C.; Esposito, C.; Scarascia-Mugnozza, G. Comparison of Logistic Regression and Random Forests techniques for shallow landslide susceptibility assessment in Giampilieri (NE Sicily, Italy). Geomorphology 2015, 249, 119–136. [Google Scholar] [CrossRef]
- Li, L.; Liu, R.; Pirasteh, S.; Chen, X.; He, L.; Li, J. A novel genetic algorithm for optimization of conditioning factors in shallow translational landslides and susceptibility mapping. Arab. J. Geosci. 2017, 10, 209. [Google Scholar] [CrossRef]
- Reichenbach, P.; Rossi, M.; Malamud, B.D.; Mihir, M.; Guzzetti, F. A review of statistically-based landslide susceptibility models. Earth-Sci. Rev. 2018, 180, 60–91. [Google Scholar] [CrossRef]
- Dai, F.C.; Lee, C.F.; Li, J.; Xu, Z.W. Assessment of landslide susceptibility on the natural terrain of Lantau Island, Hong Kong. Environ. Geol. 2001, 40, 381–391. [Google Scholar] [CrossRef]
- Wang, Y.; Fang, Z.; Hong, H. Comparison of convolutional neural networks for landslide susceptibility mapping in Yanshan County, China. Sci. Total Environ. 2019, 666, 975–993. [Google Scholar] [CrossRef]
- Zhu, A.X.; Miao, Y.; Yang, L.; Bai, S.; Liu, J.; Hong, H. Comparison of the presence-only method and presence-absence method in landslide susceptibility mapping. Catena 2018, 171, 222–233. [Google Scholar] [CrossRef]
- Freire, A.P.C.F.; Elkins, M.R.; Ramos, E.M.C.; Moseley, A.M. Use of 95% confidence intervals in the reporting of between-group differences in randomized controlled trials: Analysis of a representative sample of 200 physical therapy trials. Braz. J. Phys. Ther. 2019, 23, 302–310. [Google Scholar] [CrossRef]
- Fu, Q.X. Landslide Spatiotemporal Susceptibility Analysis of Chengdu-Yaan’ Section in Sichuan-Tibet Railway. Master’s Thesis, Central South University, Changsha, China, 2017. [Google Scholar]
- Wang, Y.; Wang, J.; Balakrishnan, S.; Singh, A. Rate optimal estimation and confidence intervals for high-dimensional regression with missing covariates. J. Multivar. Anal. 2019, 174, 104526. [Google Scholar] [CrossRef]
- Hespanhol, L.; Vallio, C.S.; Costa, L.M.; Saragiotto, B.T. Understanding and interpreting confidence and credible intervals around effect estimates. Braz. J. Phys. Ther. 2019, 23, 290–301. [Google Scholar] [CrossRef] [PubMed]
- Noce, L.; Gwaza, L.; Mangas-Sanjuan, V.; Garcia-Arieta, A. Comparison of free software platforms for the calculation of the 90% confidence interval of f2 similarity factor by bootstrap analysis. Eur. J. Pharm. Sci. 2020, 146, 105259. [Google Scholar] [CrossRef] [PubMed]
- Wang, W.D.; Li, J.; Han, Z. Comprehensive assessment of geological hazard safety along railway engineering using a novel method: A case study of the Sichuan-Tibet railway, China. Geomat. Nat. Hazards Risk 2020, 11, 1–21. [Google Scholar] [CrossRef]
- Liu, M.; He, Y.; Wang, J.; Lee, H.P.; Liang, Y. Hybrid intelligent algorithm and its application in geological hazard risk assessment. Neurocomputing 2015, 149, 847–853. [Google Scholar] [CrossRef]
- Nedumpallile Vasu, N.; Lee, S.-R.; Pradhan, A.M.S.; Kim, Y.-T.; Kang, S.-H.; Lee, D.-H. A new approach to temporal modelling for landslide hazard assessment using an extreme rainfall induced-landslide index. Eng. Geol. 2016, 215, 36–49. [Google Scholar] [CrossRef]
- Stancanelli, L.M.; Peres, D.J.; Cancelliere, A.; Foti, E. A combined triggering-propagation modeling approach for the assessment of rainfall induced debris flow susceptibility. J. Hydrol. 2017, 550, 130–143. [Google Scholar] [CrossRef]
- Sandric, I.; Ionita, C.; Chitu, Z.; Dardala, M.; Irimia, R.; Furtuna, F.T. Using CUDA to accelerate uncertainty propagation modelling for landslide susceptibility assessment. Environ. Model. Softw. 2019, 115, 176–186. [Google Scholar] [CrossRef]
- Gayen, A.; Pourghasemi, H.R.; Saha, S.; Keesstra, S.; Bai, S. Gully erosion susceptibility assessment and management of hazard-prone areas in India using different machine learning algorithms. Sci. Total Environ. 2019, 668, 124–138. [Google Scholar] [CrossRef]
- Park, H.J.; Jang, J.Y.; Lee, J.H. Assessment of rainfall-induced landslide susceptibility at the regional scale using a physically based model and fuzzy-based Monte Carlo simulation. Landslides 2019, 16, 695–713. [Google Scholar] [CrossRef]
- Segoni, S.; Tofani, V.; Rosi, A.; Catani, F.; Casagli, N. Combination of Rainfall Thresholds and Susceptibility Maps for Dynamic Landslide HazardAssessment at Regional Scale. Front. Earth Sci. 2018, 6, 1–11. [Google Scholar] [CrossRef]
- Xia, X.L.; Liang, Q.H. A new depth-averaged model for flow-like landslides over complex terrains with curvatures and steepslopes. Eng. Geol. 2018, 234, 174–191. [Google Scholar] [CrossRef]
- Li, L.; Nearing, M.A.; Nichols, M.H.; Polyakov, V.O.; Guertin, D.P.; Cavanaugh, M.L. The effects of DEM interpolation on quantifying soil surface roughness using terrestrial LiDAR. Soil Tillage Res. 2020, 198, 104520. [Google Scholar] [CrossRef]
- Shahri, A.A.; Spross, J.; Johansson, F.; Larsson, S. Landslide susceptibility hazard map in southwest Sweden using artificial neural network. Catena 2019, 183, 1–14. [Google Scholar] [CrossRef]
- Lin, C.H.; Lin, M.L.; Peng, H.R.; Lin, H.H. Framework for susceptibility analysis of layered rock slopes considering the dimensions of themapping units and geological data resolution at various map scales. Eng. Geol. 2018, 246, 310–325. [Google Scholar] [CrossRef]
- Scheltinga, R.T.; Coco, G.; Kleinhans, M.G.; Friedrich, H. Observations of dune interactions from DEMs using through-water Structure from Motion. Geomorphology 2020, 359, 107126. [Google Scholar] [CrossRef]
- Tang, X.; Li, J.; Liu, M.; Liu, W.; Hong, H. Flood susceptibility assessment based on a novel random Naïve Bayes method: A comparison between different factor discretization methods. Catena 2020, 190, 104536. [Google Scholar] [CrossRef]
- Nian, T.K.; Guo, X.S.; Zheng, D.F.; Xiu, Z.X.; Jiang, Z.B. Susceptibility assessment of regional submarine landslides triggered by seismic actions. Appl. Ocean Res. 2019, 93, 101964. [Google Scholar] [CrossRef]


| DEM Data | Survey Date | Data Type | Resolution | Coordinates | Source |
|---|---|---|---|---|---|
| GMRT * Data Synthesis | 1992 | KML | 90 m | WGS84 | Open Topography |
| SRTM ** DEM | 2000 | IMG | 90 m | UTM/WGS84 | Geospatial Data Cloud site |
| GDEM *** DEM | 2009 | IMG | 30 m | UTM/WGS84 | Geospatial Data Cloud site |
| Groups | Structure | Lithology |
|---|---|---|
| Group 1 | Loose structure | Clay, gravelly soil, clay rock, thin layer siltstone |
| Group 2 | Cataclastic structure | Siltstone, shale, phyllite, thin layer slate |
| Group 3 | Stratified structure | Thick layer sandstone, conglomerate with argillaceous rocks, siliceous rock with argillaceous shale |
| Group 4 | Block structure | Limestone, siliceous rock, thick layer conglomerate, dolomite, phosphate rock |
| Data | Average Value (m) | Standard Deviation (m) | Standard Score | Confidence Interval (m) |
|---|---|---|---|---|
| From 1992 to 2000 | −1.859 | 66.826 | 1.960 | (−132.837, 129.120) |
| From 2000 to 2009 | 0.965 | 59.204 | 1.960 | (−115.075, 117.005) |
| Susceptibility Level | 1992 | 2000 | 2009 | |||
|---|---|---|---|---|---|---|
| Area (103 km2) | Percentage (%) | Area (103 km2) | Percentage (%) | Area (103 km2) | Percentage (%) | |
| Level I | 26.445 | 34.23 | 22.342 | 28.91 | 23.378 | 30.21 |
| Level II | 26.127 | 33.82 | 17.969 | 23.25 | 15.781 | 20.39 |
| Level III | 13.573 | 17.57 | 17.128 | 22.16 | 20.747 | 26.81 |
| Level IV | 11.116 | 14.39 | 19.842 | 25.68 | 17.473 | 22.58 |
| Susceptibility Level | 1992 | 2000 | 2009 | |||
|---|---|---|---|---|---|---|
| Number | RNA * (103/km2) | Number | RNA (103/km2) | Number | RNA (103/km2) | |
| Level I | 33 | 1.25 | 34 | 1.52 | 26 | 1.11 |
| Level II | 79 | 3.02 | 44 | 2.45 | 38 | 2.41 |
| Level III | 53 | 3.90 | 60 | 3.50 | 59 | 2.84 |
| Level IV | 53 | 4.77 | 80 | 4.03 | 95 | 5.44 |
| Level Difference | 1992 and 2000 | 2000 and 2009 | ||
|---|---|---|---|---|
| Area (103 km2) | Percentage (%) | Area (103 km2) | Percentage (%) | |
| −3 | 0.041 | 0.053 | 0.516 | 0.667 |
| −2 | 0.633 | 0.819 | 1.232 | 1.592 |
| −1 | 5.433 | 7.030 | 13.308 | 17.193 |
| 0 | 41.923 | 54.244 | 48.466 | 62.614 |
| 1 | 26.954 | 34.876 | 12.799 | 16.535 |
| 2 | 1.928 | 2.495 | 0.893 | 1.154 |
| 3 | 0.373 | 0.483 | 0.190 | 0.245 |
| Area (km2) | Level Difference | ||||||||
|---|---|---|---|---|---|---|---|---|---|
| −3 | −2 | −1 | 0 | 1 | 2 | 3 | |||
| Elevation differences (m) | From 1992 to 2000 | −140 to −100 | 1.30 | 9.26 | 104.72 | 774.13 | 392.15 | 17.64 | 2.48 |
| −100 to −60 | 3.26 | 37.75 | 357.01 | 2921.89 | 1763.27 | 101.98 | 15.73 | ||
| −60 to −20 | 7.41 | 123.31 | 938.88 | 8591.50 | 5593.55 | 380.83 | 74.53 | ||
| −20 to 20 | 23.08 | 351.42 | 2576.43 | 17,433.58 | 11,260.52 | 882.75 | 170.13 | ||
| 20–60 | 4.74 | 85.47 | 1016.90 | 8718.41 | 5753.17 | 417.77 | 85.52 | ||
| 60–100 | 1.19 | 20.40 | 352.12 | 2867.55 | 1774.61 | 105.39 | 21.12 | ||
| 100–1400 | 0.38 | 5.49 | 92.77 | 667.04 | 444.31 | 22.78 | 4.15 | ||
| From 2000 to 2009 | −140 to −100 | 3.36 | 12.28 | 147.25 | 470.17 | 149.40 | 14.39 | 1.74 | |
| −100 to −60 | 20.63 | 66.89 | 834.75 | 3121.54 | 955.57 | 58.83 | 13.3 | ||
| −60 to −20 | 90.56 | 246.75 | 2709.11 | 10,030.34 | 2757.22 | 155.02 | 37.61 | ||
| −20 to 20 | 299.11 | 629.70 | 5964.38 | 20,745.68 | 4914.82 | 370.04 | 74.94 | ||
| 20–60 | 88.4 | 228.38 | 2748.58 | 9998.40 | 2771.69 | 202.98 | 40.93 | ||
| 60–100 | 12.2 | 43.28 | 790.68 | 3456.15 | 1050.63 | 79.12 | 18.63 | ||
| 100–1400 | 1.8 | 4.89 | 113.25 | 644.07 | 199.38 | 13.01 | 2.90 | ||
| Values | 2000 | |||||
|---|---|---|---|---|---|---|
| Level I | Level II | Level III | Level IV | |||
| 2009 | Number | Level I | 68 | 25 | 4 | 8 |
| Level II | 2 | 35 | 28 | 20 | ||
| Level III | 0 | 13 | 23 | 47 | ||
| Level IV | 0 | 0 | 9 | 59 | ||
| Percentage | Level I | 19.94% | 7.33% | 1.17% | 2.35% | |
| Level II | 0.59% | 10.26% | 8.21% | 5.87% | ||
| Level III | 0 | 3.81% | 6.74% | 13.78% | ||
| Level IV | 0 | 0 | 2.64% | 17.3% | ||
| RNA (10−3/km2) | Level I | 3.73 | 6.36 | 5.80 | 15.50 | |
| Level II | 0.59 | 3.93 | 9.50 | 36.83 | ||
| Level III | 0.00 | 2.69 | 2.57 | 7.31 | ||
| Level IV | 0.00 | 0.00 | 1.97 | 4.77 | ||
© 2020 by the authors. Licensee MDPI, Basel, Switzerland. This article is an open access article distributed under the terms and conditions of the Creative Commons Attribution (CC BY) license (http://creativecommons.org/licenses/by/4.0/).
Share and Cite
Li, J.; Wang, W.; Han, Z.; Li, Y.; Chen, G. Exploring the Impact of Multitemporal DEM Data on the Susceptibility Mapping of Landslides. Appl. Sci. 2020, 10, 2518. https://doi.org/10.3390/app10072518
Li J, Wang W, Han Z, Li Y, Chen G. Exploring the Impact of Multitemporal DEM Data on the Susceptibility Mapping of Landslides. Applied Sciences. 2020; 10(7):2518. https://doi.org/10.3390/app10072518
Chicago/Turabian StyleLi, Jiaying, Weidong Wang, Zheng Han, Yange Li, and Guangqi Chen. 2020. "Exploring the Impact of Multitemporal DEM Data on the Susceptibility Mapping of Landslides" Applied Sciences 10, no. 7: 2518. https://doi.org/10.3390/app10072518
APA StyleLi, J., Wang, W., Han, Z., Li, Y., & Chen, G. (2020). Exploring the Impact of Multitemporal DEM Data on the Susceptibility Mapping of Landslides. Applied Sciences, 10(7), 2518. https://doi.org/10.3390/app10072518