Article

Seismic Behavior of a Novel Blind Bolted Flush End-Plate Connection to Strengthened Concrete-Filled Steel Tube Columns

1
School of Civil Engineering and Transportation, South China University of Technology, Guangzhou 510641, China
2
State Key Laboratory of Subtropical Building Science, South China University of Technology, Guangzhou 510641, China
*
Author to whom correspondence should be addressed.
Appl. Sci. 2020, 10(7), 2517; https://doi.org/10.3390/app10072517
Submission received: 2 March 2020 / Revised: 2 April 2020 / Accepted: 3 April 2020 / Published: 6 April 2020

Abstract

:
Modified blind bolts (Hollo-Bolt) and a locally strengthened steel tube column in the panel zone were created to overcome the moment-resisting problem for the bolted connections between concrete-filled hollow section columns and open section beams and to enhance the performance of connections. The cyclic loading was conducted on a total of six modified anchored blind bolted flush end-plate connections to concrete-filled steel tube (CFST) columns. The key parameters investigated were the tube wall thickness, end-plate thickness, blind bolt anchorage method, and beam section. The failure mode, hysteretic behavior, strength, stiffness, ductility, and energy dissipation capacity of the connections were analyzed and evaluated with all details. The results indicated that connections with modified anchored blind bolts and locally strengthened steel tubes could avoid the premature failure of CFST column and exhibit an improved behavior with a favorable strength, stiffness, and stiffness degradation. The test observations reveal two representative failure modes, and the tube wall thickness and blind bolt anchorage method have a significant effect on the resultant failure mode. Moreover, the use of thin endplate and weak beam can effectively enhance the hysteretic behavior of joints, ductility, and energy dissipation capacity; and the change in anchoring method has little effect on the stiffness. Finite element (FE) analysis models were established for the aforementioned connections. The numerical models were validated against the experimental results and exhibited good agreement. Finally, based on the component method, an initial stiffness calculation method was established for the connections.

1. Introduction

Frames with concrete-filled steel tube (CFST) columns have been widely used in modern construction, primarily because of the high structural efficiency of this type of column and the substantial savings with respect to cost and building time of such a construction [1]. For fully welded connections, the construction progress is slow and extensive erection and welding work is required, resulting in high labor costs; additionally, the on-site welding quality is difficult to guarantee. Moreover, according to the post-earthquake surveys conducted after the 1994 Northridge and 1995 Kobe earthquakes, severe damage and brittle fractures in welded steel moment-resisting structures were observed due to the poor performance of welding in beam-to-column connections [2]. Moreover, the fracture of steel structures under earthquake action is a low-cycle fatigue problem, and the fatigue strength of steel is greatly affected by fine cracks in the welding seam and its heat-affected zones. The bolted connections can meet the seismic performance requirements, but it is hard to access inside the steel tube when connecting beams to CFST columns, as openings in the steel tube are costly. To overcome the complexities associated with utilizing open section beams connected to hollow section columns, a new blind-bolting technique has been developed within the past few decades. This technique allows a fastener to be tightened from one side only, without the demand for access into the hollow section column.
Although the blind bolts have solved the bolted connection problem of CFST column joints, the tensile area in a square steel tube often tends to be susceptible to failure when the joint is resisting moment. For moment-resisting blind bolted CFST column joints, the infill concrete functions as a local stiffener for the column walls in the compressive region, while severe outward plastic deformation develops much more easily in the tensile region, which is owing to the weak outward flexural rigidity for the tube face. Wang ZB et al. [3] and Wang JF et al. [4] performed monotonic and cyclic loading tests on bolted end-plate connections to square CFST columns. For most tested joints with square CFST columns, failure occurred when the corner of the steel tube cracked and the tube face bulged severely. Especially for the specimen with the thinner steel tube, only slight flexural deformation of the end-plate was observed at failure due to the excessive outward deformation of the tube face. Thus, it is concluded that premature local failure of the square steel tube induces a flexural resistance below the design requirement, accelerating the destruction of the overall structure and preventing other parts of the connection from working at full capacity.
Several measures have been suggested by contemporary researchers for enhancing the tensile performance of CFST columns to prevent local tube failure. In some studies, this enhancement is realized by modifying the steel tubes. Lee et al. [5,6] extended an experimental and analytical study of a new bolted moment-resisting connection with T-stubs connecting open section beams to unfilled hollow section columns. The load from the beam end can be transmitted to the sidewall or back of the column to reduce the outward deformation of the tube face directly subjected to moment. Wang et al. [3] proposed several strengthening methods, including using binding bars to tie the opposite surfaces of the tube, adding internal rings, externally welding two C-shaped channels, and internally embedding a short segment of I-section. The tensile force applied to the blind bolts was not effectively transferred, therefore the first two methods had only limited influence to restrain the bulging of the tube face; however, the last two methods effectively improved the performance of blind bolted joints to square CFST columns.
Some work has focused on modifying the blind bolt to reduce the likelihood of local bucking of the steel tube by setting a device anchorage for the blind bolt to improve the anchorage characteristics of the fastener. First, Gardner and Goldsworthy [7] proposed to weld a piece of straight or hooked reinforcing bar to the end of the bolt shank for the blind bolt. Then, they focused on modifying an Ajax Oneside to investigate the tensile behavior of blind bolted T-stub connections to circular CFST columns with a straight or hooked reinforcing bar welded to the blind bolts [8,9]. The test results showed that the anchorage provided by the extensions can limit the localized bulging of the tube face and dramatically improve the strength and stiffness of the connections in tension. However, weld fractures easily occurred between the reinforcing bars and the bolt ends would easily form if precautions were not taken, and short extensions would result in anchorage failure. Furthermore, the final direction of the hooked reinforcing bars after tightening could not be guaranteed to be consistent. Wang et al. [10,11,12,13] investigated the behavior of blind bolted end-plate (flush and extended) connections to square and circular CFST columns; in this work, 50-mm-long straight extensions were used for the blind bolts, and similar conclusions were drawn. Then, Tizani and Dan [14] proposed the Extended Hollo-Bolt (EHB), which extended the bolt shank of the Hollo-Bolt and attached an anchor nut at the end. Pitrakkos et al. [15] conducted a comprehensive experiment on a novel anchored blind bolt in tension, indicating that the anchored blind bolt can finally achieve the ultimate strength of its internal bolt to enhance the tensile strength and stiffness of the blind bolt. This research was continued by Tizani et al. [16,17], who carried out a series of monotonic and cyclic loading tests on blind bolted end-plate connections to CFST columns using EHBs, which exhibited a high ductility and energy dissipation capacity suitable for use in seismic design. These conclusions were further confirmed by the research reported by Agheshlui et al. [18], who studied the tensile performance of the modified Ajax Oneside with an anchor nut at the end.
For the current literature review, little attention has been paid to the anchored blind-bolted joints between CFST columns and steel beams. For those joints, cyclic loading tests are limited, and the test parameters are incomplete. It is also short of theoretical research, especially for the connection stiffness, and no specific design method was available for those connections. Moreover, in order to relieve the steel tube deformation, previous studies prone to increase the tube wall thickness along the length of the column, and consistently increased the thickness of locally strengthened steel tube.
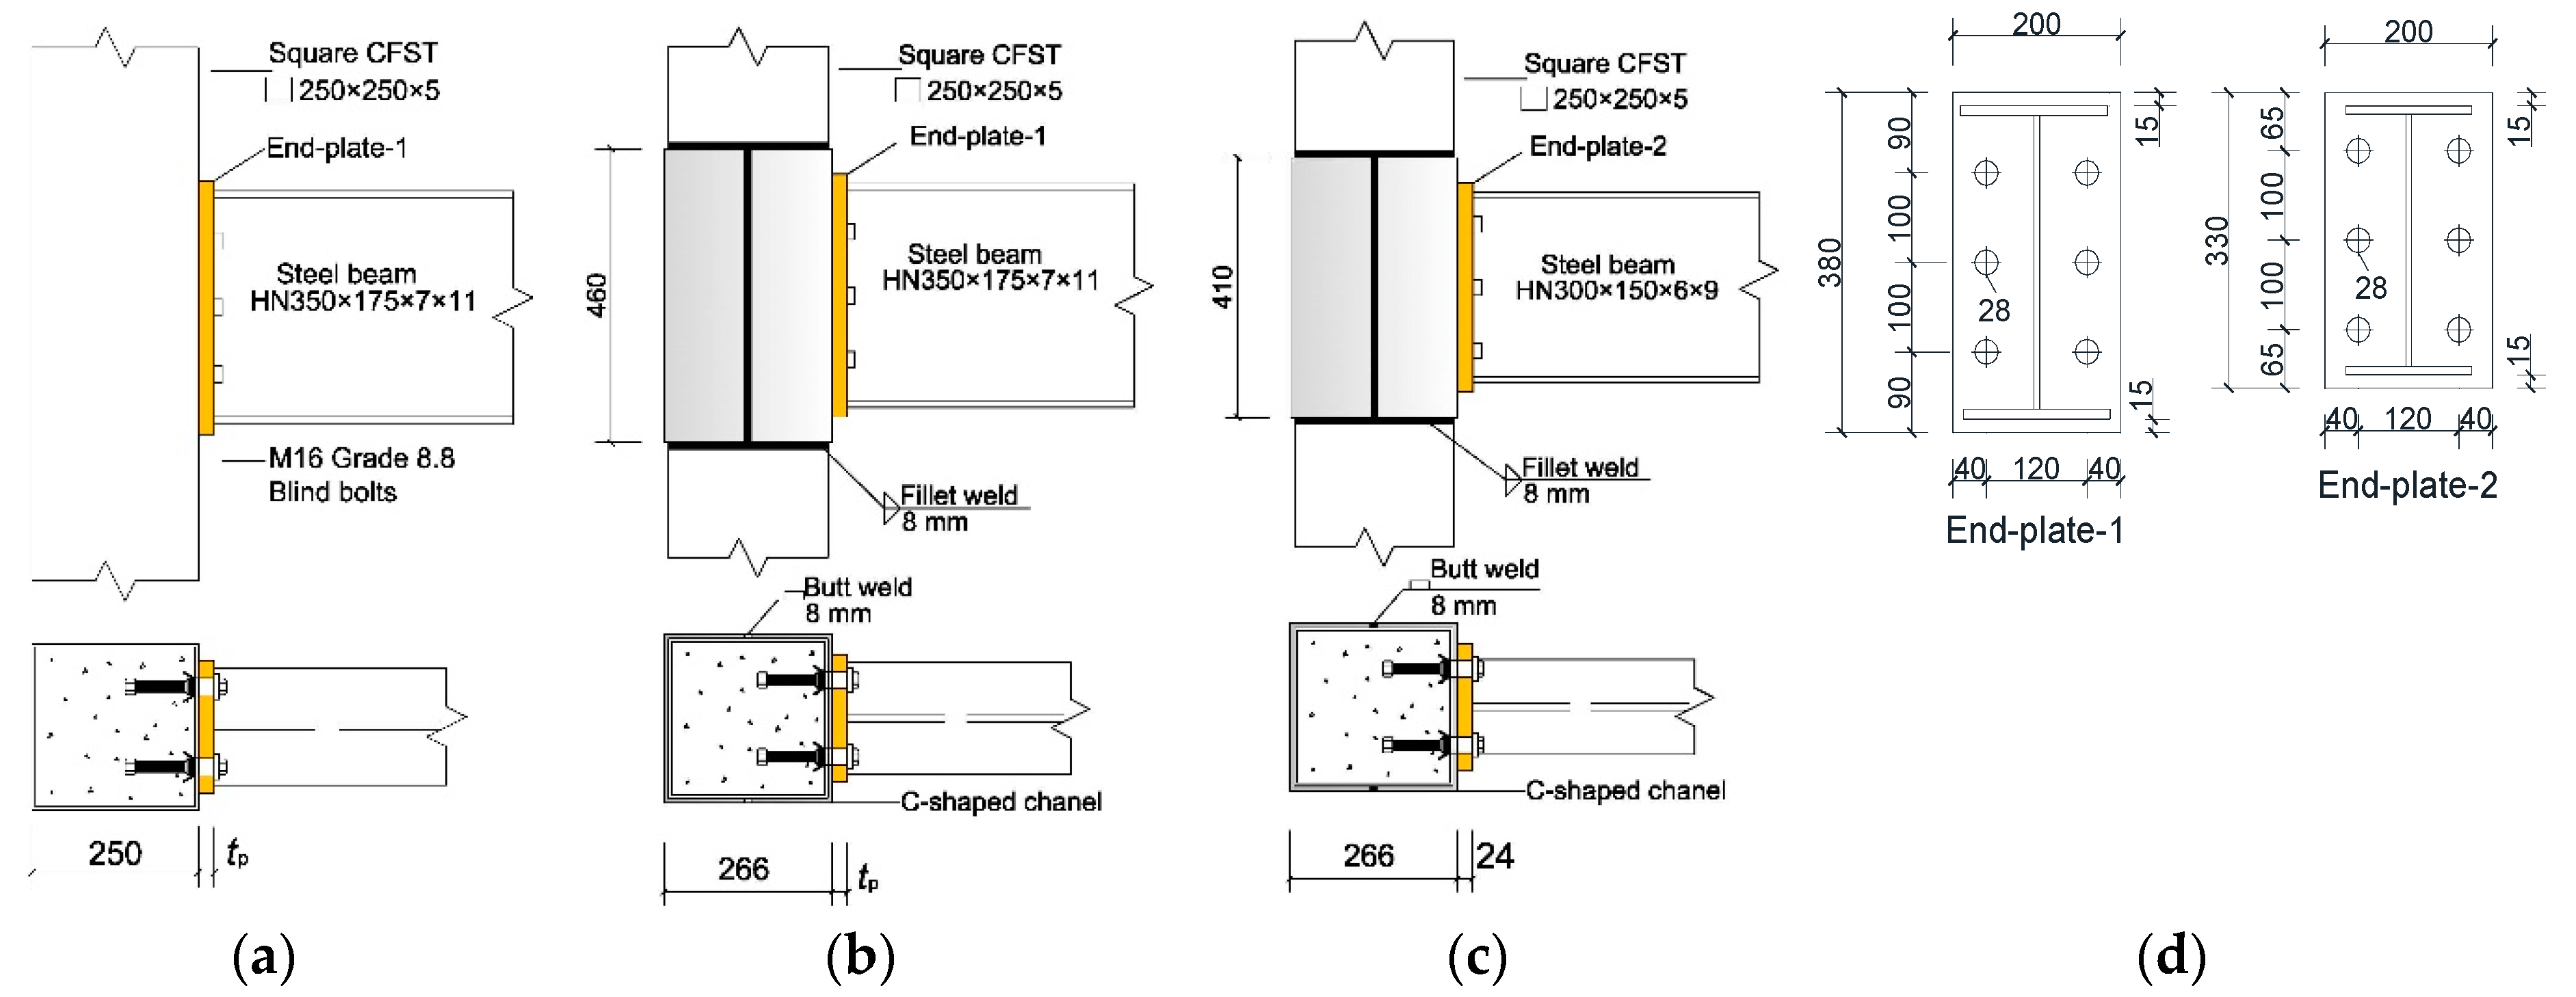
Therefore, the proposed moment-resisting bolted connection to CFST columns adopts the modified blind bolts and a locally strengthened steel tube in the panel zone. It is expected that the capability of each component can be fully utilized and a greater economic benefit can be achieved. Two simple improvement method mentioned above combined to modify the bolted connections between CFST columns and steel beams, which can provide a more effective, economical, and construction-friendly solution to the flexibility of the tube face in the tensile zone. The new proposed connection can allow for the application of those commonly used bolted connections in moment-resisting frame. The following parametric experimental analysis and theoretical analysis of the connection stiffness will provide a comprehensive investigation to help the development of this system.
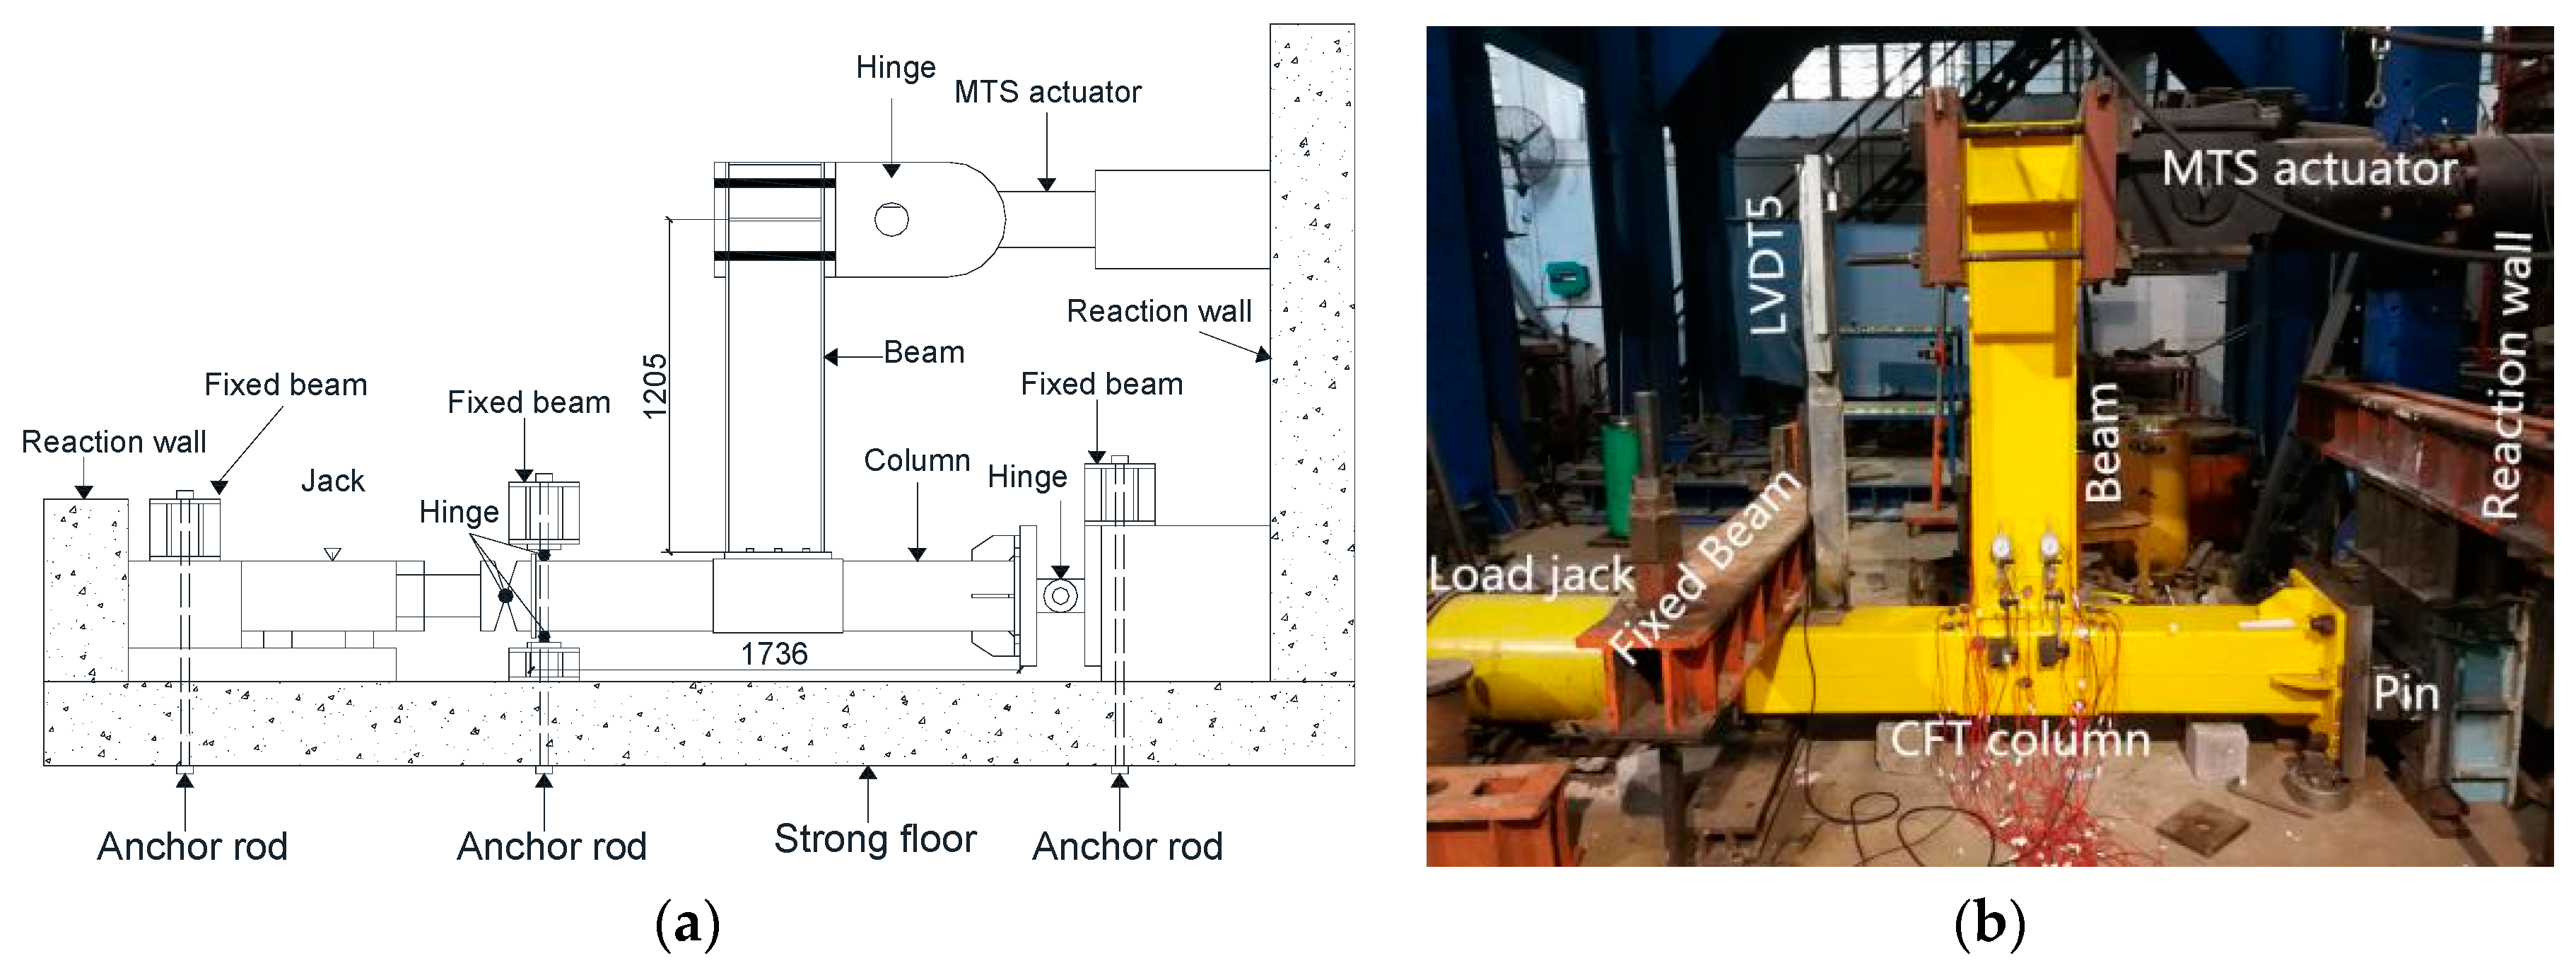
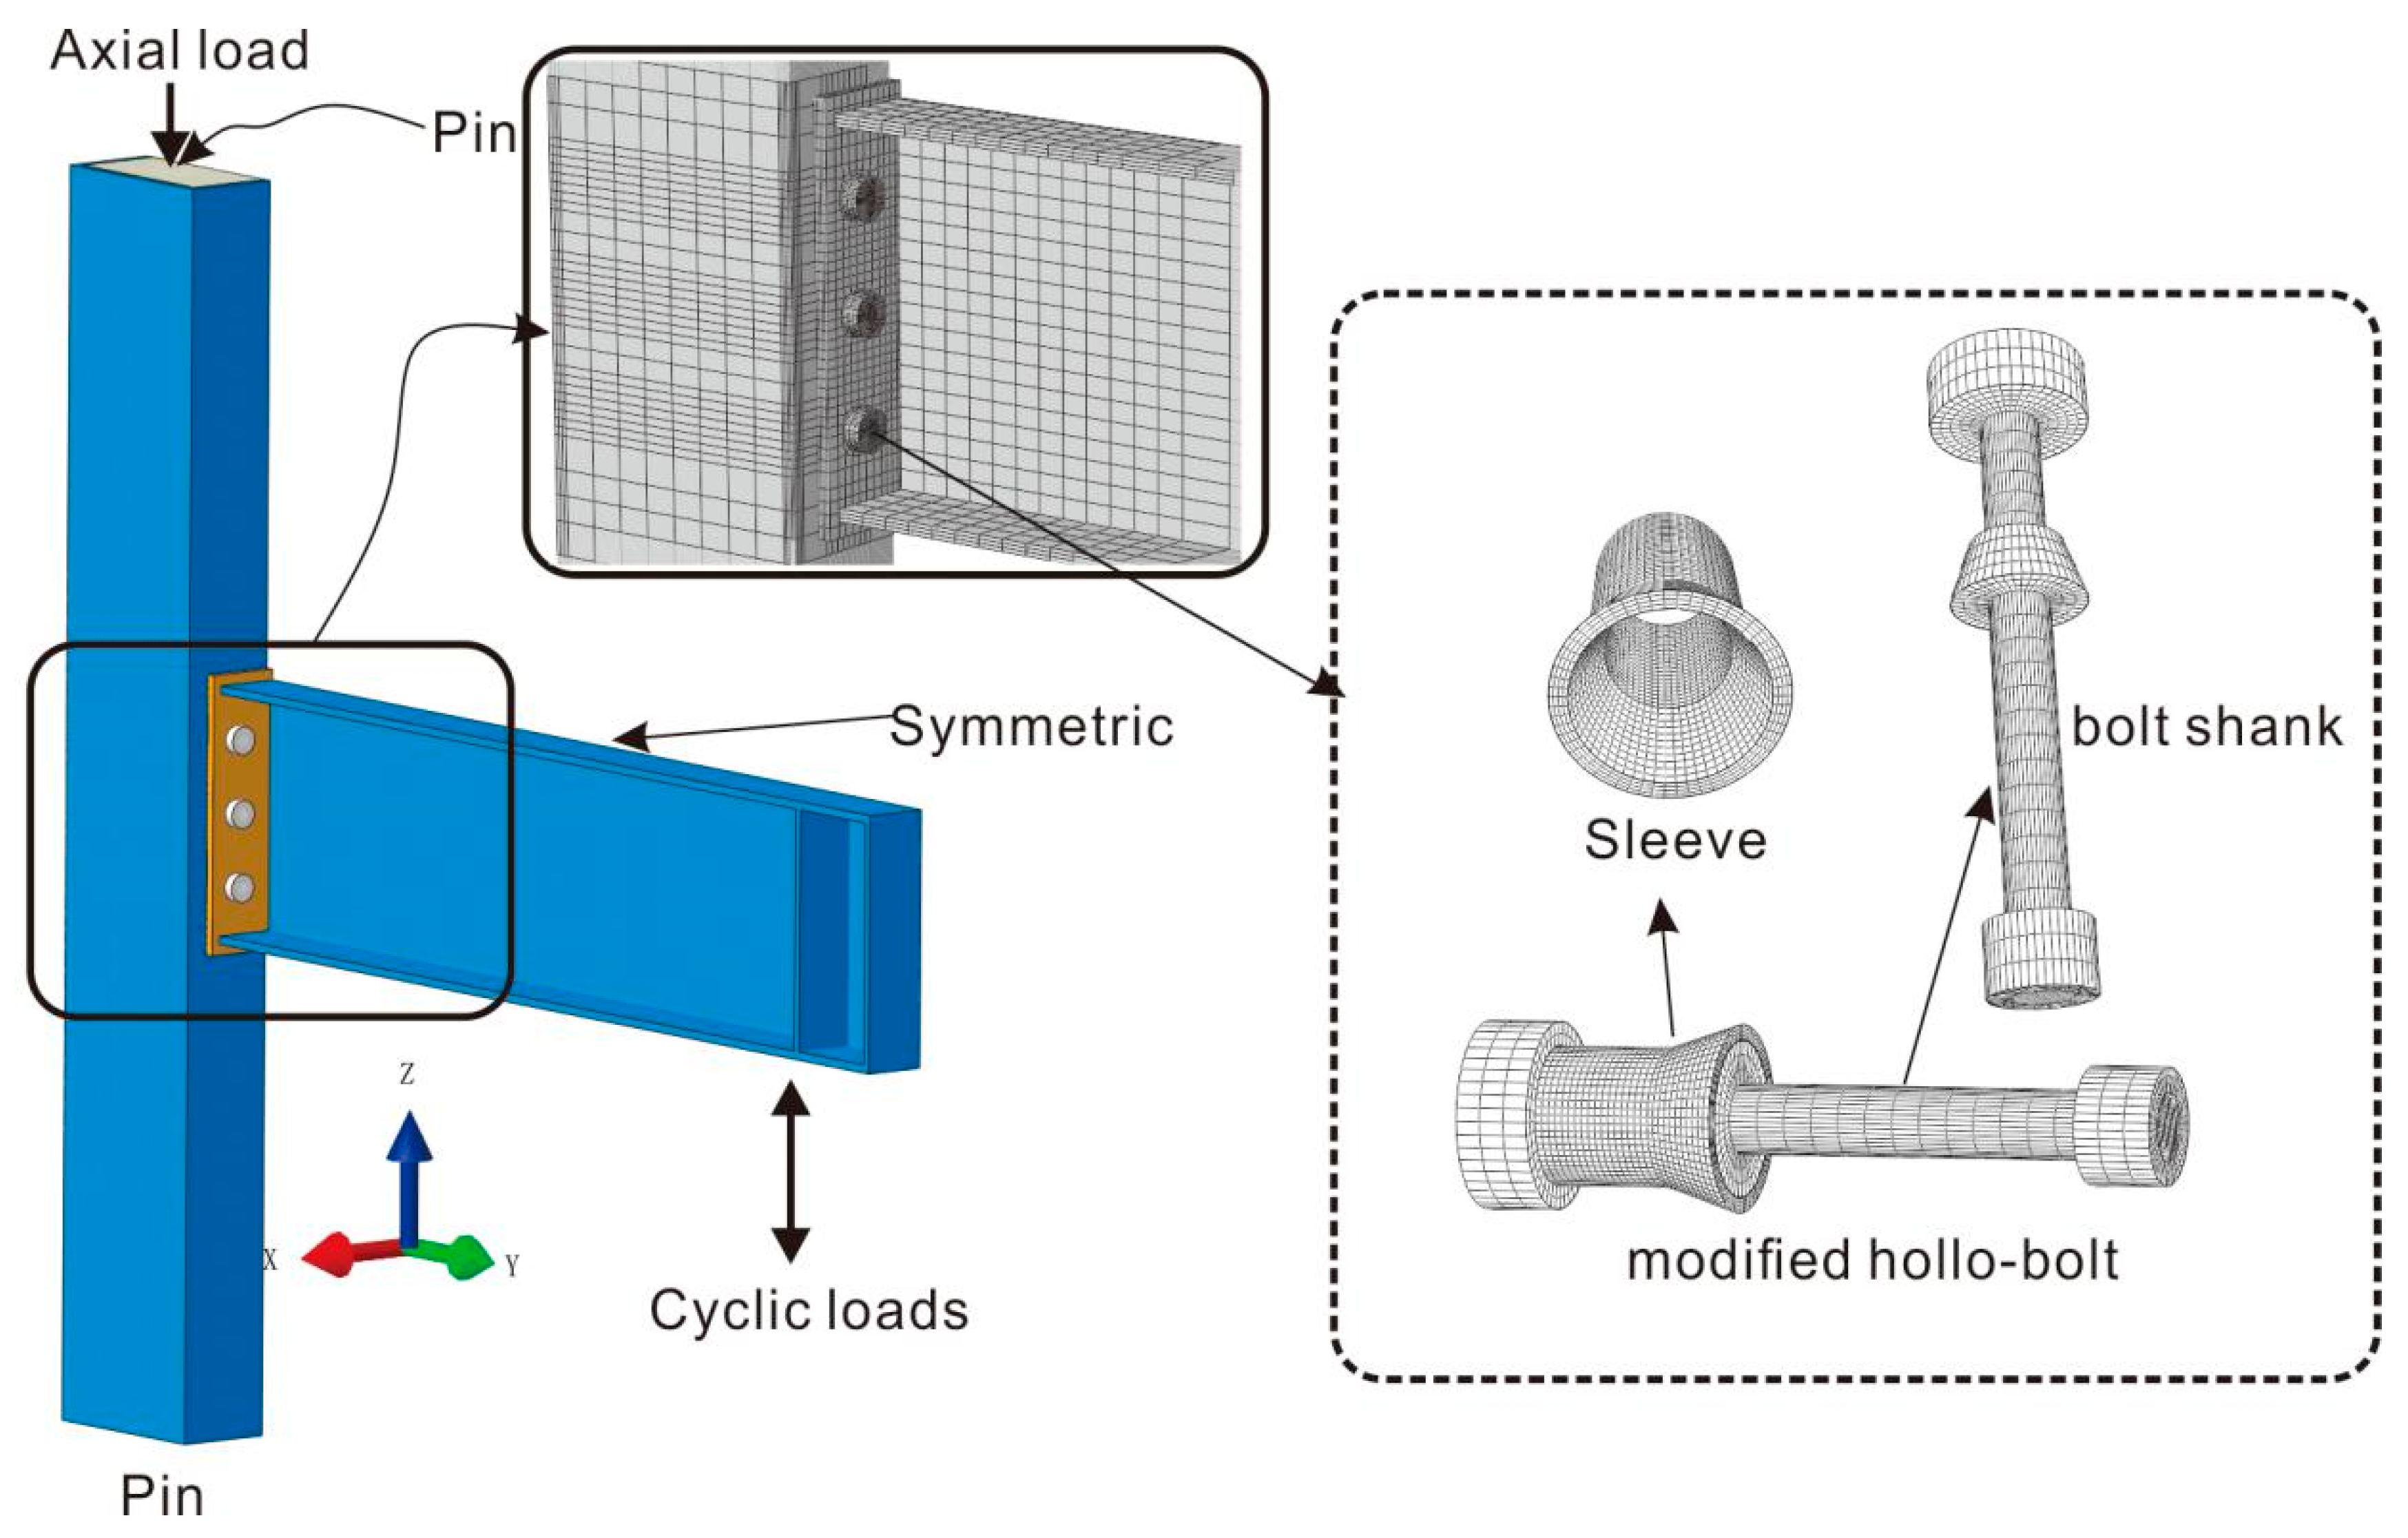
A total of six proposed anchored blind bolted flush end-plate joints were tested under cyclic loading to investigate their cyclic characteristics. Finite element (FE) analysis models using software ABAQUS were developed for the connections, and the results obtained from the FE models were validated against the test results. Finally, based on the component method, a mechanical model is proposed, and the initial stiffness expression is established.

2. Experimental Investigation

2.1. Test Specimen

Six anchored blind bolted flush end-plate joints were designed to connect CFST columns to the steel beam. Figure 1 illustrates the details of the specimens, and Table 1 summarizes the details of the specimens. The end-plate thickness, tube wall thickness, blind bolt anchorage method, and beam section were the test parameters that were investigated. All the specimens used the blind bolts (Hollo-Bolts) to connect the steel beam to the square hollow section column. The blind bolts adopted in the tests were Grade 8.8 M16 Hollo-Bolts, which extended the bolt shanks and attached grade 8.8 anchor nuts at the end, as shown in Figure 2. The bearing surface of the anchor nut was 90 mm away from the inner surface of the steel tube. The columns in all the specimens were concrete-filled square hollow section columns with a cross-sectional dimension of 200 × 200 × 5 mm. The steel tube wall in the panel zone was externally welded with two 7 mm C-shaped channels to change its thickness. Plug welding was adopted to ensure that the C-shaped channel and steel tube wall could fit closely together during the test. The Hollo-Bolt used in specimen ST-5 extended only the bolt shank, without an anchor nut at the end. The beams used for the majority of the specimens in this study were commercially available H-shaped steel beams with a cross-sectional dimension of HN350 × 175 × 7 × 11 mm; an H-shaped steel beam with a cross-sectional dimension of HN300 × 150 × 6 × 9 mm was adopted for specimen ST-6.
The blind bolts were snugly tightened with an impact wrench and subsequently tightened with a torque wrench according to the specified torque values. All the blind bolts were tightened to a torque of 190 N m, as recommended by the instruction given by Lindapter International, and the corresponding applied pre-load was 70 kN. Notably, prior to the tightening of the blind bolts, the anchor nuts were fastened to the screw by gluing or welding to prevent the nuts from falling off due to vibration when installing the blind bolts or casting concrete.
Note: tp is the end-plate thickness; for specimens ST-1 and ST-3, tp = 12 mm; for specimens ST-2 and ST-4, tp = 24 mm; specimens ST-4 and ST-5 have the same dimension, except ST-4 with nut and ST-5 without nut.

2.2. Material Properties

Except for that the beam of specimen ST-6 adopted the steel with a nominal yield strength of 235 MPa, the other steel components adopted the steel with a nominal yield strength of 345 MPa. Testing of the steel tensile coupons was carried out for the determination of the primary properties of various steel components, i.e., the elastic modulus (Es), the yield stress (fy), the ultimate stress (fu), and the elongation at fracture (δ). A summary of the results of the material tests has been presented in Table 2. Moreover, for the grade 8.8 blind bolts, the nominal values of fy and fu are respectively 640 MPa and 800 MPa, and the elastic modulus is 2.1 × 10⁵ MPa. Commercially available SCC was employed to fill all the test specimen columns, and standard compressive concrete cubes were cast simultaneously as test samples. The compressive strength and elasticity modulus of the concrete cubes were tested on the testing day. The concrete cube compressive strength was 39.92 N/mm2, and the elastic modulus was 3.27 × 10⁴ N/mm2.

2.3. Experimental Test Setup and Loading Procedure

The experiment setup was illustrated in Figure 3. The CFST column was horizontally connected to the reaction wall through two hinge supports. For simulating seismic loading, one MTS hydraulic actuator with a 500 KN capacity was adopted to apply the cyclic load to the beam end. For reflecting the axial pressure of the CFST column in actual engineering, the axial load was applied at the top of the column by a hydraulic jack. The axial load level (n) is 0.3 for the CFST column, which is defined as n = N/Nu, where N is the axial load applied to the column and Nu is the nominal ultimate axial compressive load of the CFST column predicted by the specification [19]. The distance from the loading point on the beam to the column flange was 1.2 m. The cyclic load is controlled through the layer angular displacement, which is the ratio of the horizontal displacement of the beam end to the loading point distance, which was 1.2 m, as mentioned above. The loading procedure suggested by the SAC Joint Venture (1997) [20] for cyclic testing was adopted and is summarized in Figure 4.

2.4. Instrumentation

Strain gauges were placed at different positions for measuring the strains in the end-plate, steel tube and steel beam. All the readings were recorded by a DH-3816N static strain test and analysis system. The load applied to the beam end was recorded by the MTS loading system. The arrangement of the displacement transducers (LVDTs) used in the test is presented in Figure 5. LVDT1 and LVDT2 were adopted for monitoring the rotation of the column (θc). LVDT3 and LVDT4 were adopted for monitoring the rotation of the beam (θb), which were 30 mm away from column flange in the specimens with a strong beam and 180 mm away from column flange in the specimen with a weak beam, considering local beam buckling. LVDT5 was adopted for monitoring the displacement of the loading point at the beam end. The relative rotation between the column flange and beam can be derived from Equations (1)–(3).
θ c = u 1 u 2 1300
θ b = u 3 u 4 H
θ = θ b θ c
where u1, u2, u3, and u4 are the corresponding displacements measured by LVDT1-LVDT4; and H is 350 mm for specimens ST-1~ST-5 and 180 mm for specimen ST-6, which is the horizontal distance between LVDT3 and LVDT4.

3. Results

The failure modes in the specimens may affect the performance of the connections to a large extent. Moreover, the influence of connection parameters on the performance of the connections may be related to the failure modes. Therefore, it is necessary to observe different failure modes in the specimens. During the initial stage of the test, the six test specimens showed similar experimental behaviors. During loading of the first three drifts, very small gaps were observed between the end-plate and column face, and no obvious deformation appeared in various components; during loading of the later stage, there were mainly two typical failure modes. The comparison of two typical failure modes for different component is presented in Table 3.
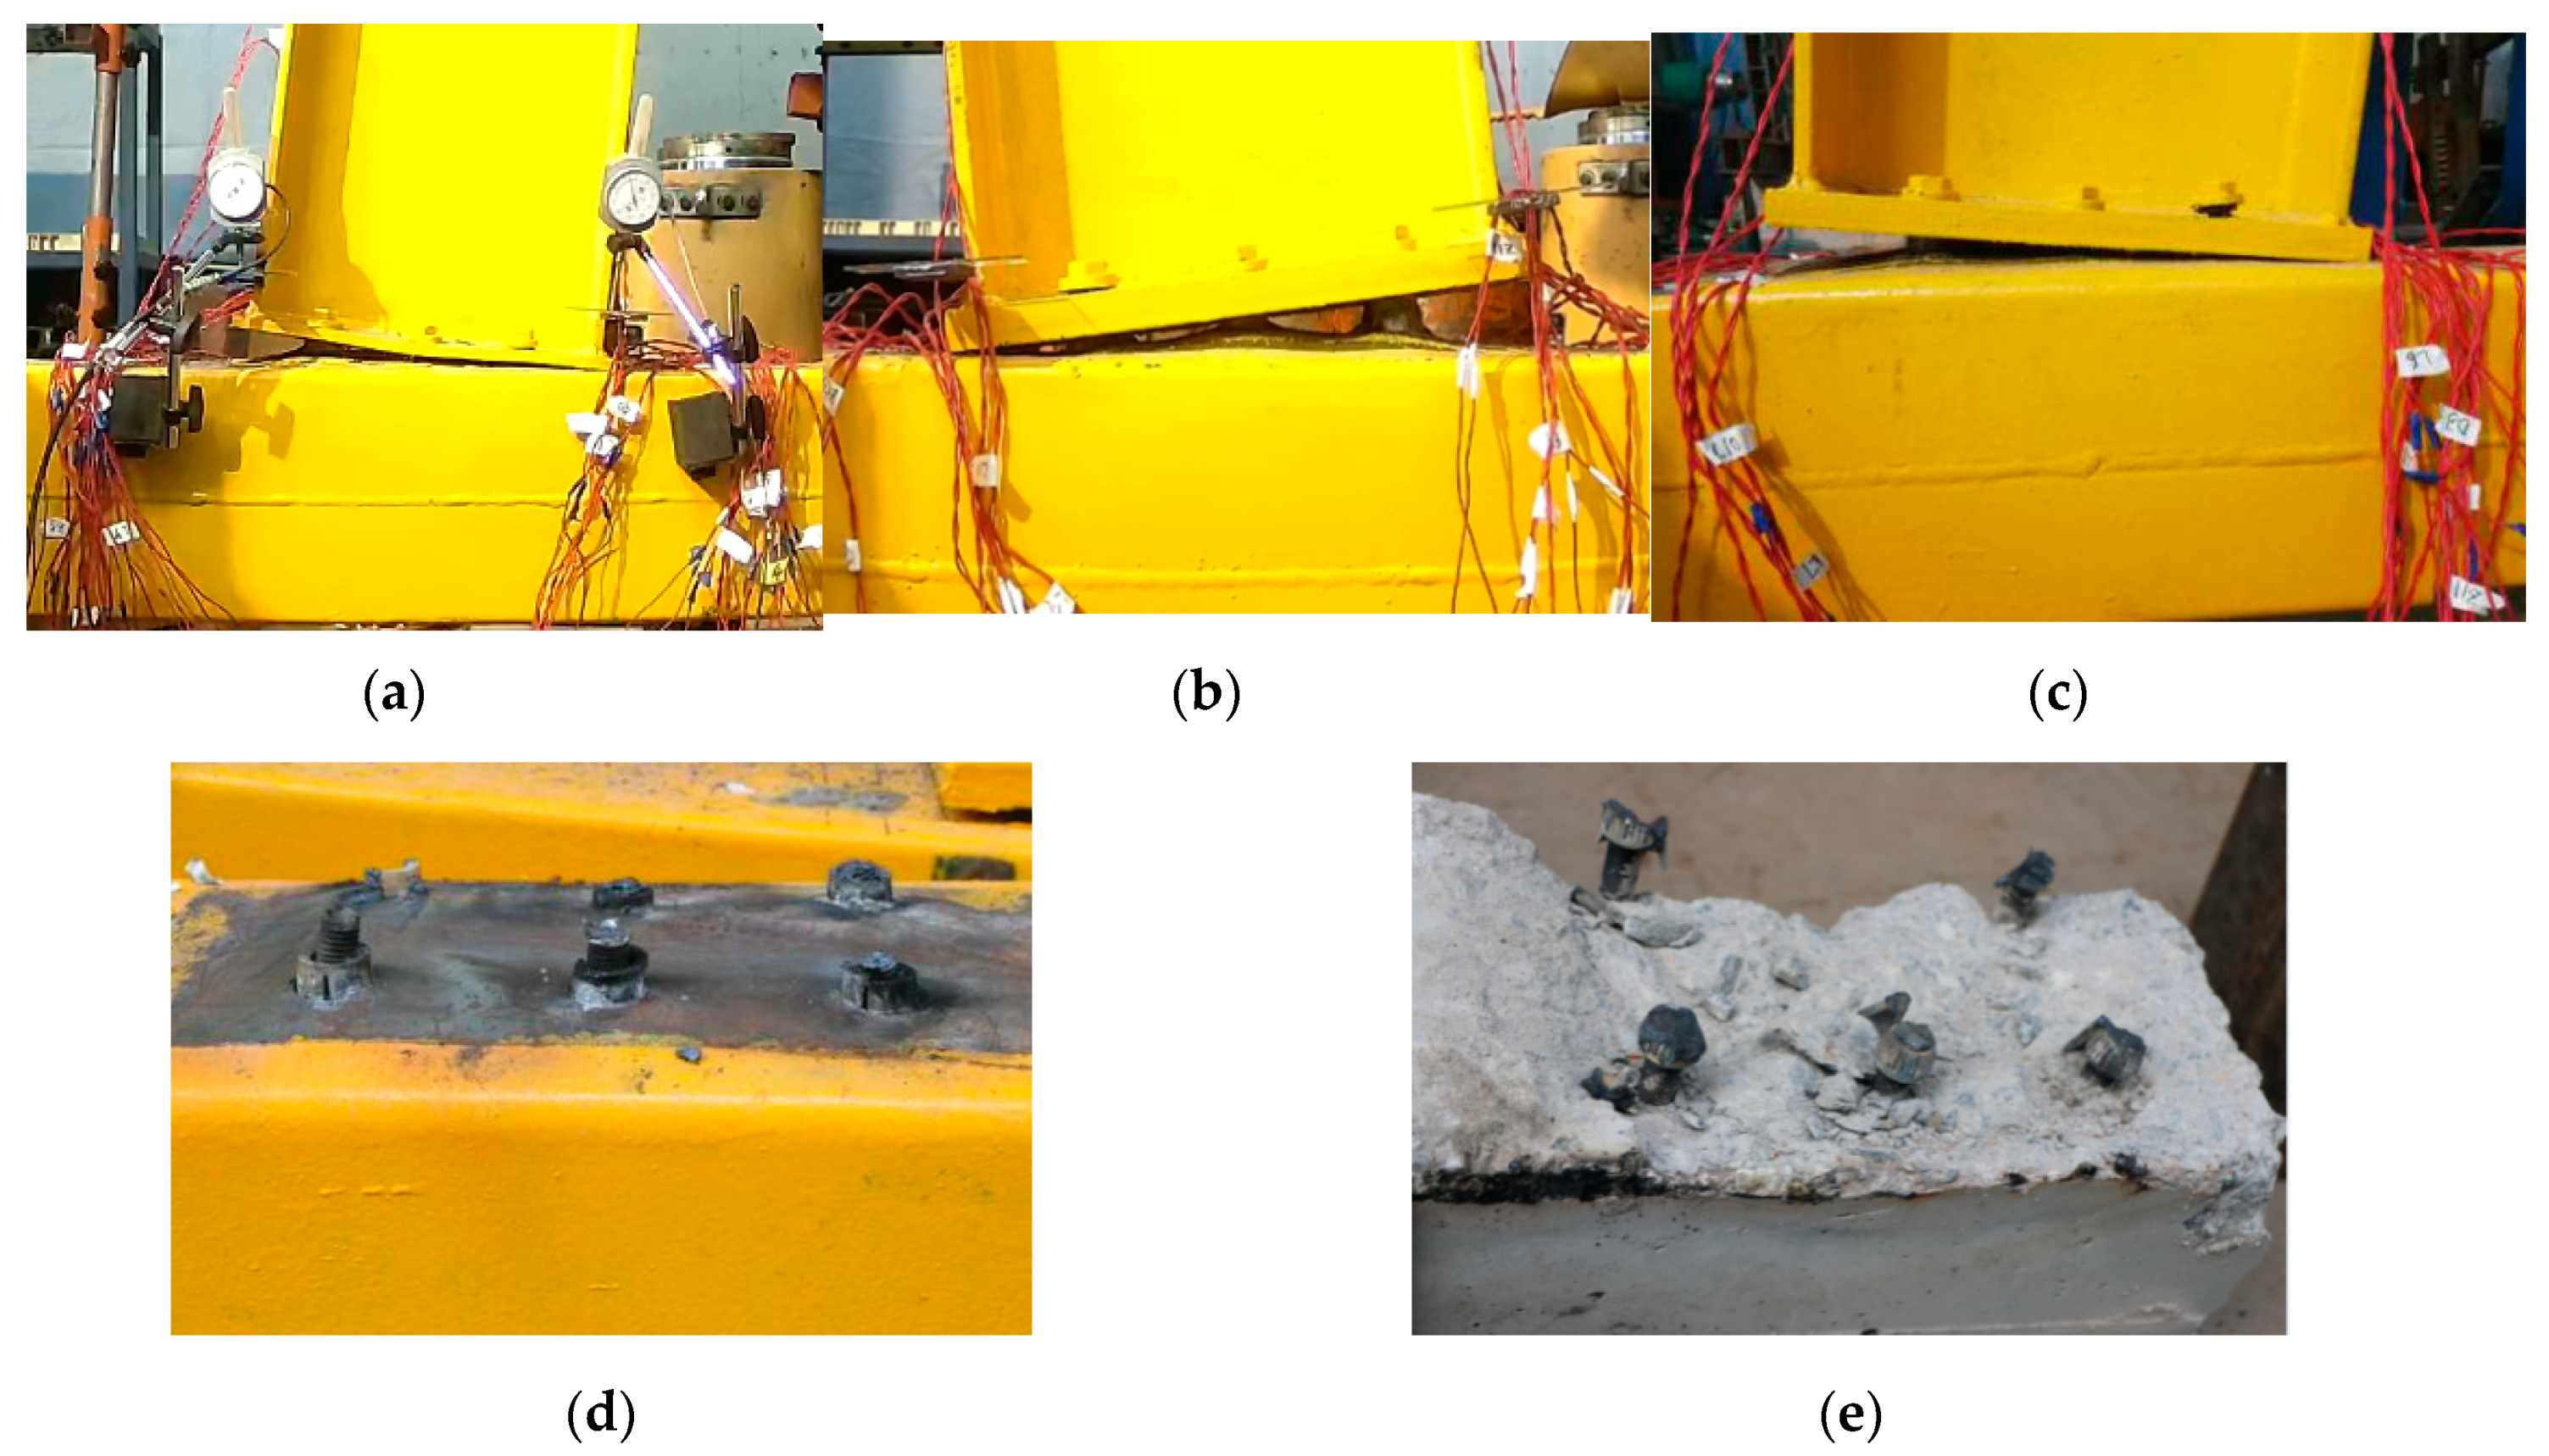
The first failure mode exhibited the following typical phenomena: the anchored blind bolts were partially pulled out; an obvious outward deformation of the tube face was clearly observed, especially around the bolt holes; and severe cracking and fracturing of the core concrete occurred, causing the CFST columns to be the weakest component. Specimens ST-1, ST-2, and ST-5 failed by this failure mode, as shown in Figure 6. With increasing drift ratio, the gap between the column face and the end-plate became increasingly obvious, indicating that the concrete in the panel zone of the column was gradually cracking. During this process, loss of anchorage and bonding from the blind bolts occurred, causing the bolts of the three specimens to pull up and the steel tube around the bolt holes to bulge under the action of the bolt pull-out force. Finally, when the drift ratio reached 10%, the load was stopped due to significant pull-out of the bolt and severe bulging of the tube face. Owing to the thinner end-plate of specimen ST-1, obvious flexural deformation of the end-plate was observed; after the test, the entire end-plate showed plastic deformation, and obvious warpage was observed at both ends. The thick end-plates of specimens ST-2 and ST-5 showed little flexural deformation during loading, rotating as a rigid body. As the steel beams for the three specimens had sufficient flexural resistance and stiffness, there was no obvious deformation in the steel beam. The steel tube was sectioned to explore the failure mechanism of the CFST column, and the exposed core concrete infill was observed. There were extensive concrete cracks and severe local concrete crushing in the panel zone, as presented in Figure 6e. This result implies that anchorage failure occurred in the blind bolts at larger rotations, causing the blind bolts to pull out and the load to decrease rapidly.
The second failure mode exhibited the following typical phenomena: the blind bolts failed in shank rupture; no obvious outward deformation of the tube face was observed, and only slight bulging was observed around the bolt holes; and the core concrete in the panel zone basically remained intact. Therefore, the blind bolts became the weakest component. Specimens ST-3, ST-4, and ST-6 failed by this failure mode, as shown in 
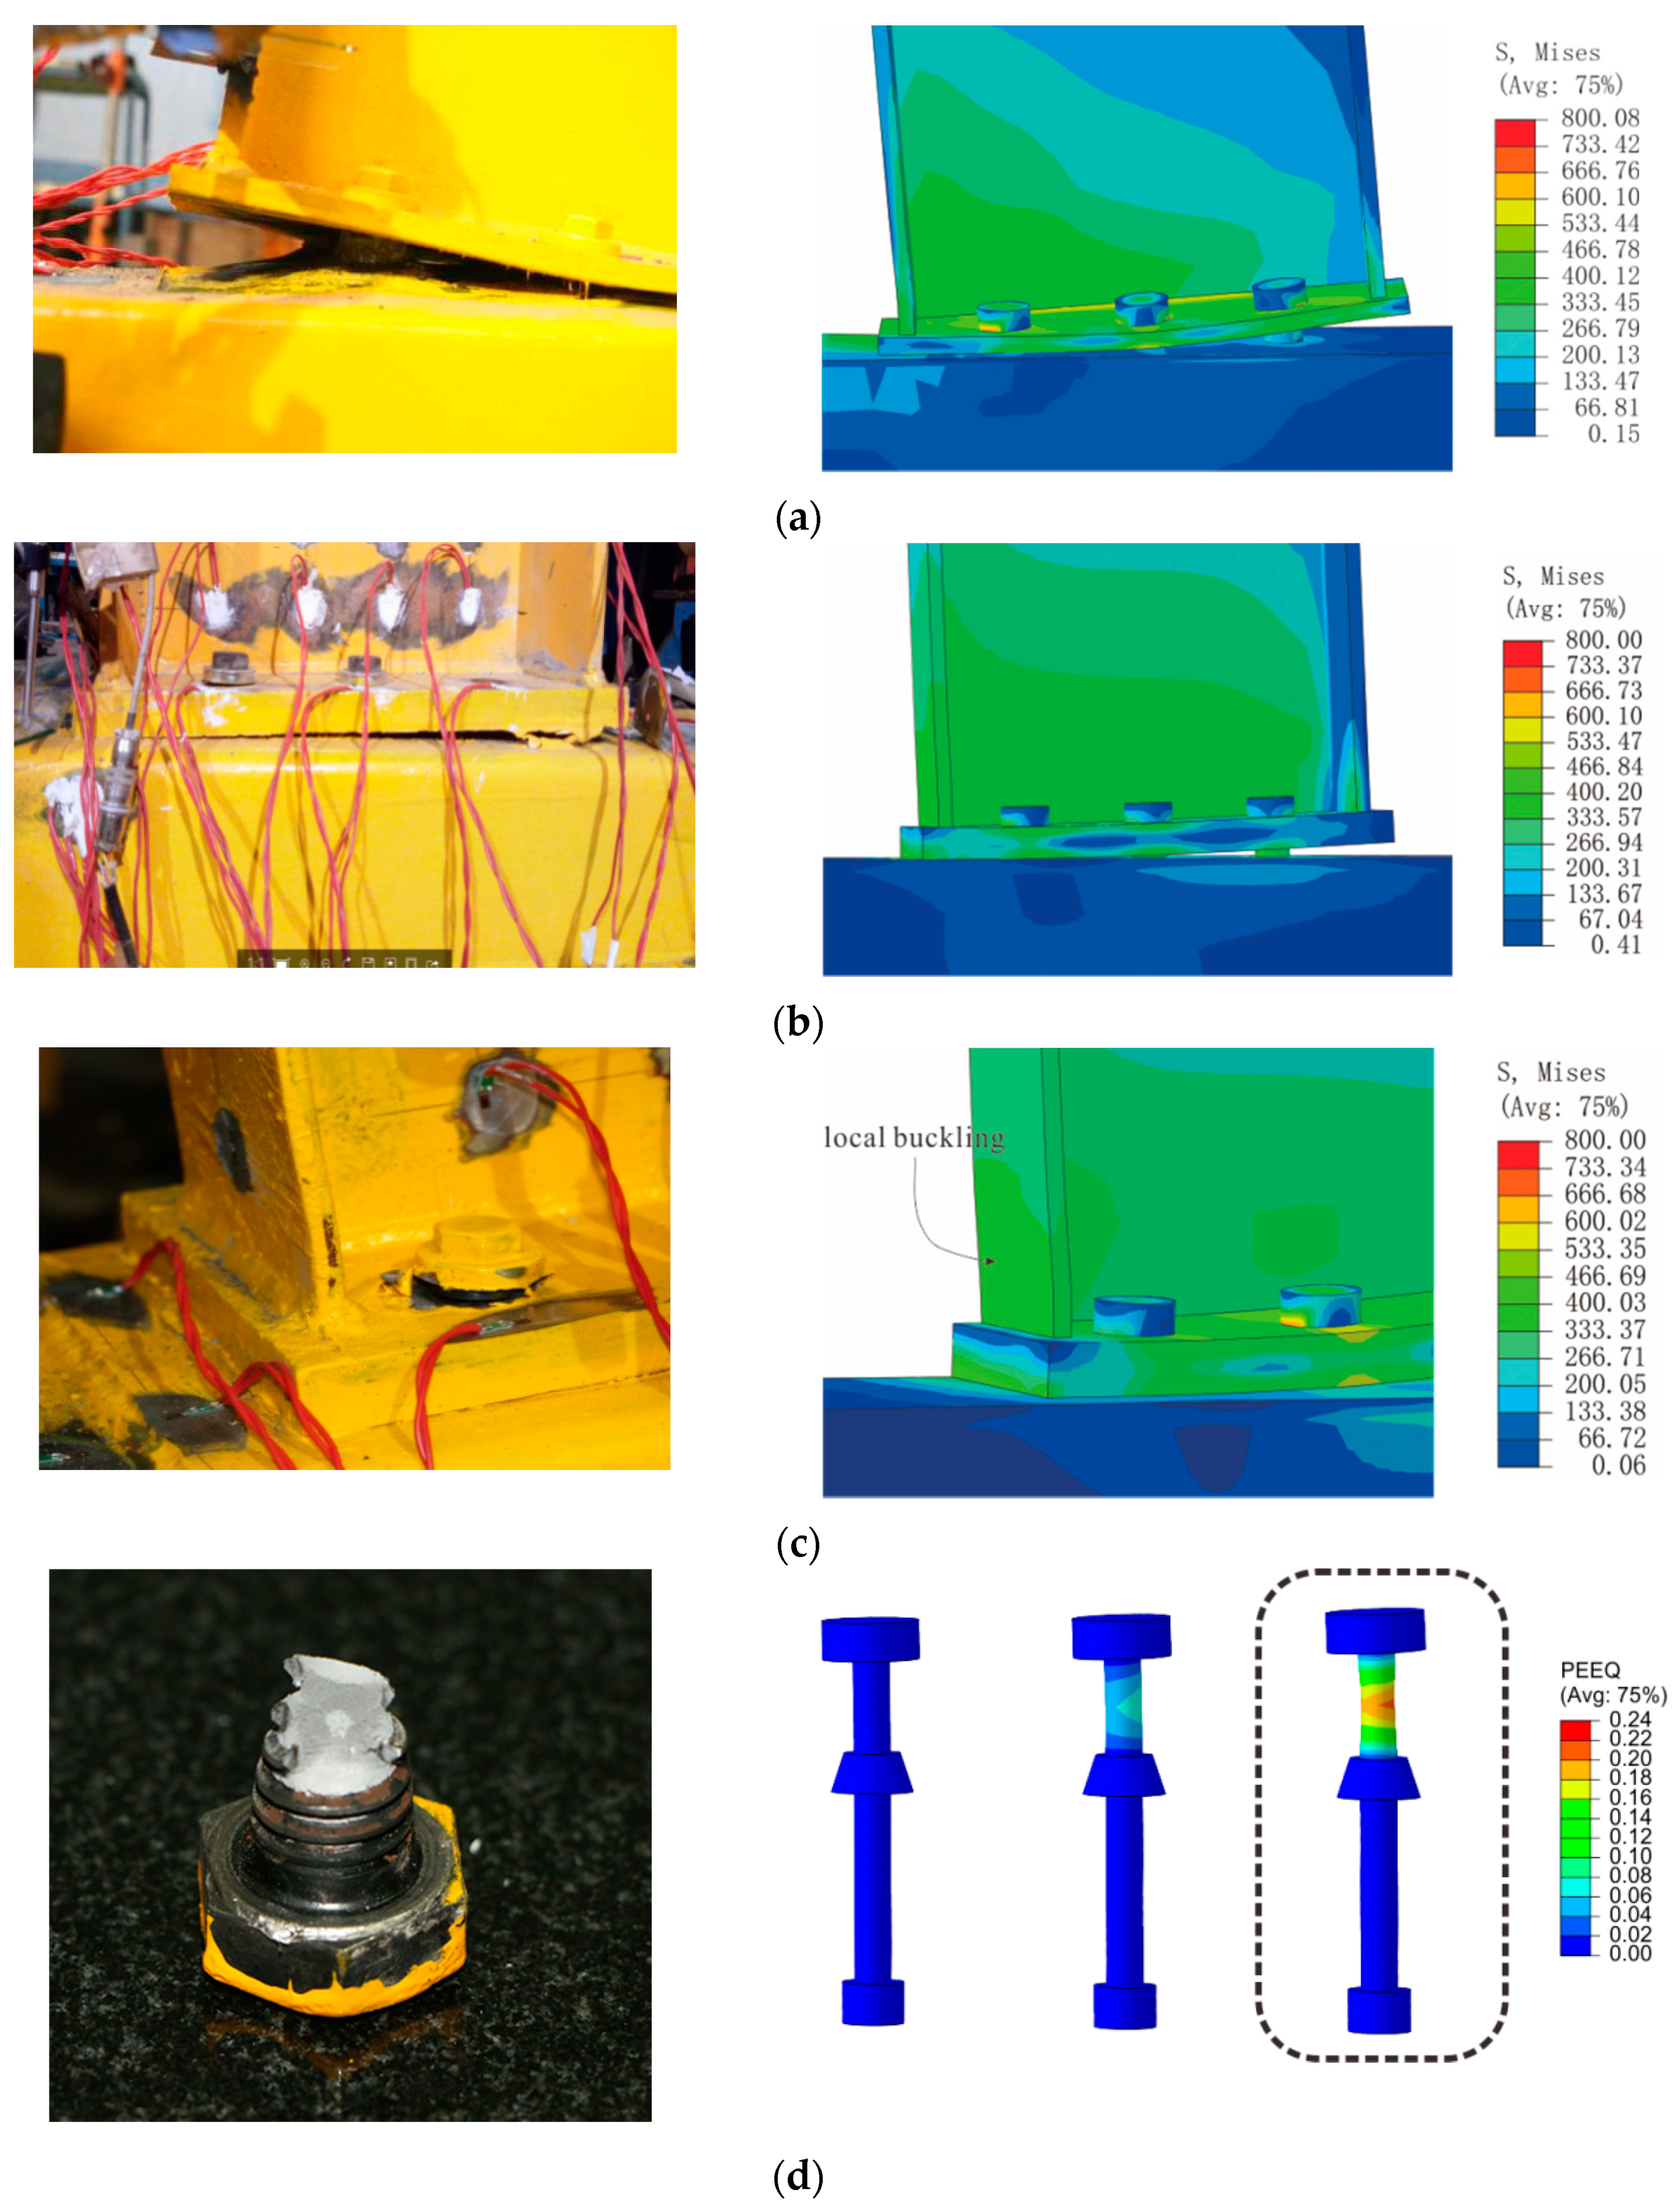
Figure 7. With the increase in the drift ratio, a gap formed between the column face and end-plate, but this gap is remarkably smaller than that formed in the failure mode I. This difference could be explained by the fact that the gap in the second failure mode was caused by the elongation of the internal bolt, while that in the first failure mode was caused by the pull-out of the blind bolts after anchorage failure. The deformation patterns of both the thick and thin end-plates are similar to that observed in the first failure mode. However, the fracturing of the bolts in specimen ST-3 occurred when the drift ratio reached 6%, while the bolts of ST-4 fractured at a drift ratio of 4%, indicating that the decrease in the end-plate thickness improved the deformation capacity of the connections. Under cyclic loading, only specimen ST-6 with a weak beam exhibited local buckling in the beam compression flange, as presented in Figure 7d. The bolts of specimen ST-6 fractured at a larger drift ratio of 6%, compared with specimen ST-3, indicating that the steel beam section can also affect the deformation capacity of the specimens and that use of the weaker steel beam can improve the deformation performance. Observations of the exposed concrete after cutting open the steel tube show that, as presented in Figure 7g, the concrete infill in the panel zone remained basically intact, and only local crushing around the bolt hole was observed. As the expanding sleeve, a part of the blind bolt, was pulled outwards, the surrounding concrete was likely to crack locally when the connections were under tension. The intact concrete could effectively restrain the pull-out of the blind bolts, causing rupture failure of the blind bolts.
In the two failure modes, as shown in Figure 8, the anchored blind bolts embedded in the concrete basically remained intact, despite the different failure patterns exhibited by the blind bolts. However, scratches were clearly observed at the anchor nut, undoubtedly caused by the mechanical anchorage against the concrete. In addition, throughout the loading process, no welding fracture occurred in the fillet weld and plug weld between the steel tube and the C-shaped channel. According to the observations on the deformation conditions around the bolt holes, as shown in Figure 9, the square steel tube and the C-shaped channel fit closely together, indicating that the steel tube wall and the C-shaped channel can work well together. The observed results demonstrate that the two proposed methods can both be effective and provide stability to the performance of connections under cyclic loading.
The steel tube thickness in the panel zone of the connection and the anchorage method of the blind bolt directly determine the connection failure mode. The use of thicker steel tube walls and blind bolts with anchor nuts can change the failure mode of an anchored blind bolt connection to CFST column from mode I to mode II. Therefore, when modified anchored blind bolts (Hollo-Bolt) and a locally strengthened steel tube (C-shaped channels) are used in the panel zone, the proposed connection demonstrated its ability to reach the ultimate strength of the blind bolts, exhibiting favorable flexural resistance and stiffness. The end-plate thickness and the steel beam section mainly affect the deformation capacity of the connections. In the proposed connection, the use of thinner end-plates and weaker steel beams can result in favorable deformability of the test specimens and avoid premature brittle failure.

4. Discussion

4.1. Moment–Rotation Hysteresis Curves

Figure 10 describes the moment–rotation hysteresis curves of the connections. The shapes of the hysteresis moment–rotation curves for these specimens are relatively similar until the maximum moments are reached. The moment–rotation relationship of the connection can be considered to be roughly linear in the early initial elastic stage. In the inelastic stage, an obvious pinching effect can be observed. As the drift ratio increased, the pinching effect becomes more obvious. This change can be due to the severe deformation of the tube face and the end-plate, the bolt slippage and deformation, the local buckling of the steel beam, and the concrete crushing, representing the failure modes of the different specimens.
The specimens (ST-1, ST-2, and ST-5) that failed in mode I have low flexural resistance, but their hysteresis performance is better than those that failed in mode II, which is attributed to progressive concrete crushing. With increasing drift ratio, a sudden drop in the moment can be observed, which reflects the simultaneous anchorage failure of the blind bolts and crushing of the concrete. In subsequent cycles of loading, the moment for the thin end-plate connection (ST-1) continues to decrease, but the moment for the thick end-plate connections (ST-2 and ST-5) first increases and then slowly decreases due to the considerable restriction of the thick end-plate on the rotation of the connection. The energy dissipation of the joints is mainly achieved by the crushing of concrete in the panel zone and the deformation of the steel tube walls. However, those failure modes are not expected in practical engineering. In addition, for the same reason mentioned above, obvious stiffness degradation was found at a larger drift ratio.
The specimens (ST-3, ST-4, and ST-6) that failed in mode II have high flexural resistance, but the hysteresis performance is worse than that of the specimens that failed in mode I. In particular, for specimen ST-4, bolt brittle fracture occurs before a drift ratio of 4% was reached, and the hysteresis loop is flat. Reductions in the end-plate thickness (ST-3 and ST-4) and steel beam section (ST-4 and ST-6) widen the hysteresis curve and produce relatively good hysteresis performance. The energy dissipation is mainly realized by the deformation of the blind bolts, steel beams, and end-plates. Moreover, a thicker steel tube wall relieved the stiffness degradation of the connection more, as infill concrete was effectively confined by the steel tube and failure was prevented even though its unconfined capacity was achieved.

4.2. Moment–Rotation Envelope Curves

The moment–rotation envelope curves for the test specimens, which are averaged for comparative purposes, are compared in 
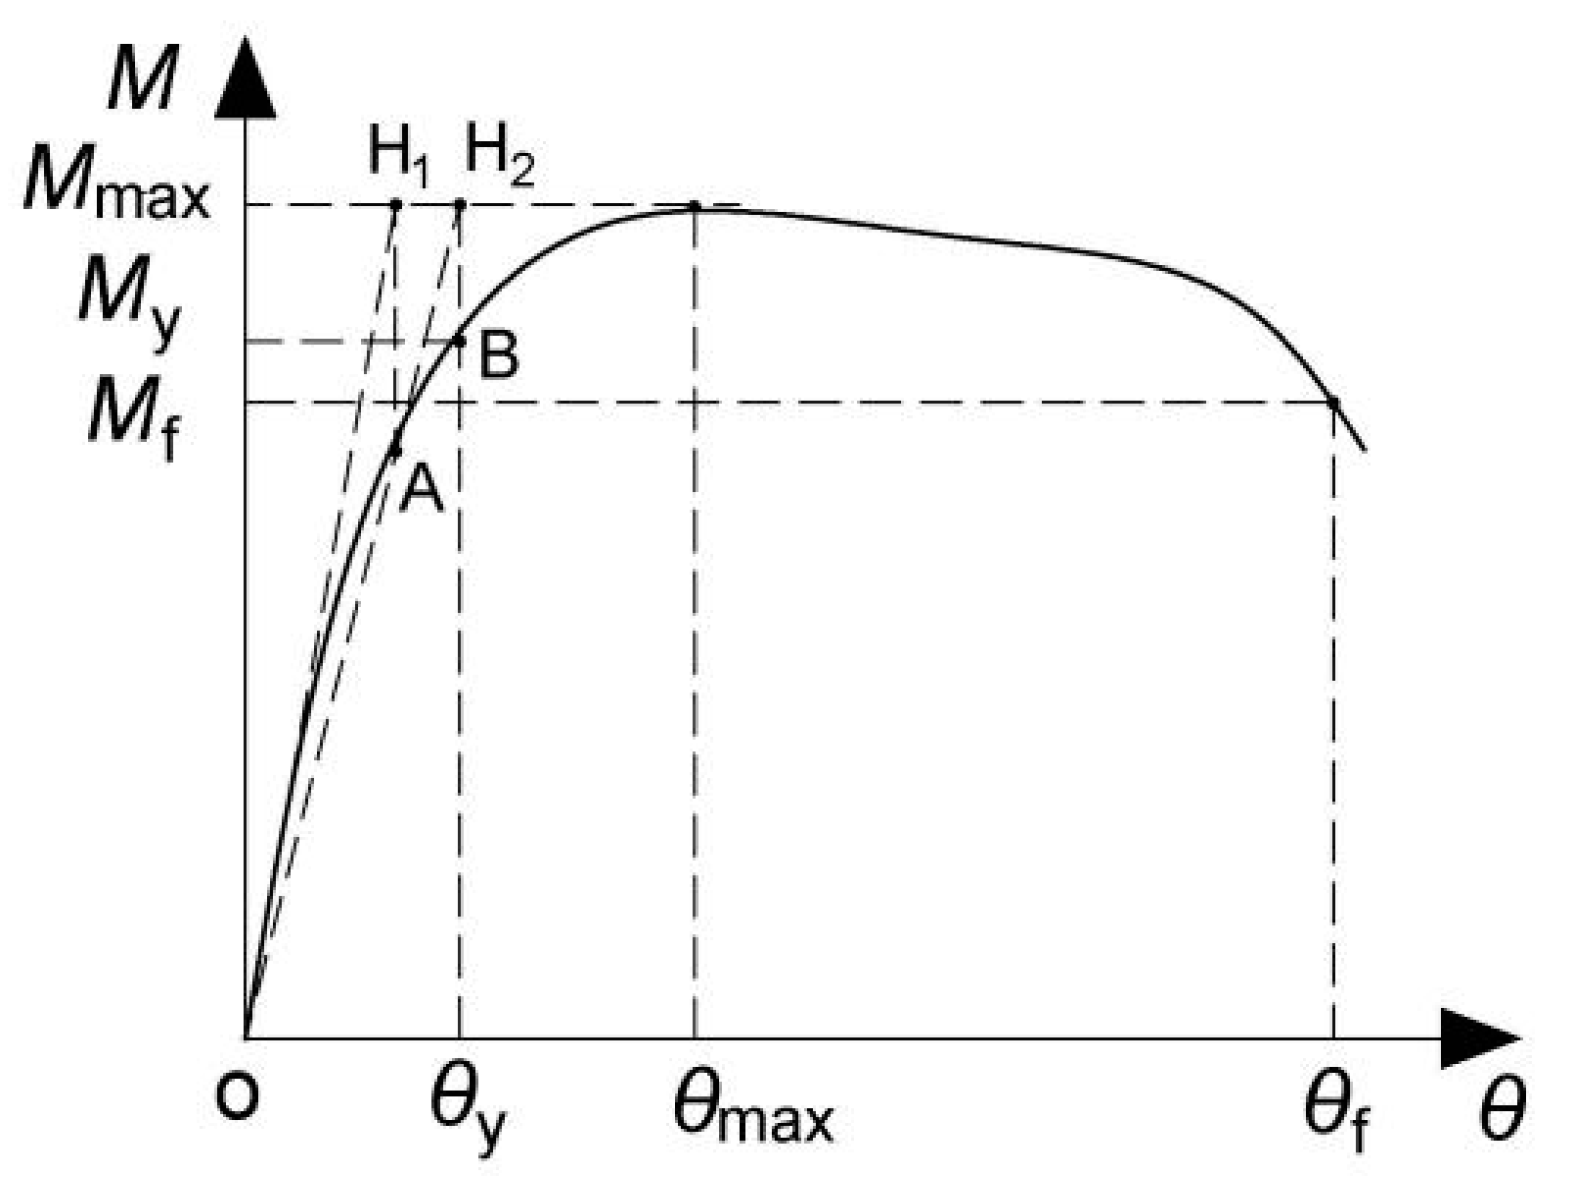
Figure 11. The key parameters in moment–rotation relationship of joints are defined in Figure 12. According to the yield moment defining method in reference [21], equivalent yield point B is determined in the diagram and the corresponding moment and rotation are the yield moment (My) and yield rotation (θy), respectively. The moment and rotation at the peak point are the measured flexural resistance (Mmax) and corresponding connection rotation (θmax), respectively. According to Chinese specification JGJ3-2010 [22], the moment equal to 0.85Mmax is defined as the moment (Mf) at failure, and θf is the corresponding connection rotation used to represent the rotation ability of a connection in this study. The main results and key parameters of the specimens are summarized in Table 4.
By the comparison of the moment–rotation envelope curves shown in Figure 11a,b,e, it is immediately apparent that the flexural resistances of the failure mode I specimens were much lower than those for the failure mode II specimens; additionally, while the initial stiffnesses of the failure mode I specimens were slightly reduced, their ductilities were greatly improved.
Figure 11a,b illustrate that the initial stiffness and flexural resistance of specimen ST-3 increased by 40% and 47%, respectively, compared to those of specimen ST-1 and that the initial stiffness and flexural resistance of specimen ST-4 increased by 22% and 84%, respectively, compared to those of specimen ST-2. The test results indicate that an increasing steel tube wall thickness had an improved effect on the stiffness and strength. As seen from parts (c) and (d) of Figure 11, the effect of end-plate thickness on the initial stiffness is similar to the effect observed due to the tube wall thickness, where the initial stiffness of specimens ST-2 and ST-4 increased by 42% and 26%, respectively, compared to those of specimens ST-1 and ST-3. However, in terms of the flexural resistance, when the connections failed in mode I, the influence of the end-plate thickness was negligible, as the flexural resistance was determined by the CFST columns; when the connections failed in mode II, a greater end-plate thickness increased the flexural resistance. Compared with specimen ST-1, the flexural capacity of specimen ST-2 increased by only 11%, while the flexural capacity of specimen ST-4 was 35% higher than that of specimen ST-3. Figure 11e shows that compared with those of specimen ST-5, the flexural resistance of specimen ST-4 increased by 22%, but the initial stiffness increased by only 7%. These results demonstrate that the use of the anchor nut in specimen T4 resulted in an increase in the flexural resistance as the failure mode changed from mode I to mode II but slightly increased the initial stiffness of connection. Figure 11f indicates that using a weak beam in specimen ST-6 resulted in a 19% reduction in the flexural resistance and an 8% reduction in the initial stiffness; however, significant improvement in the ductility of connection was observed.

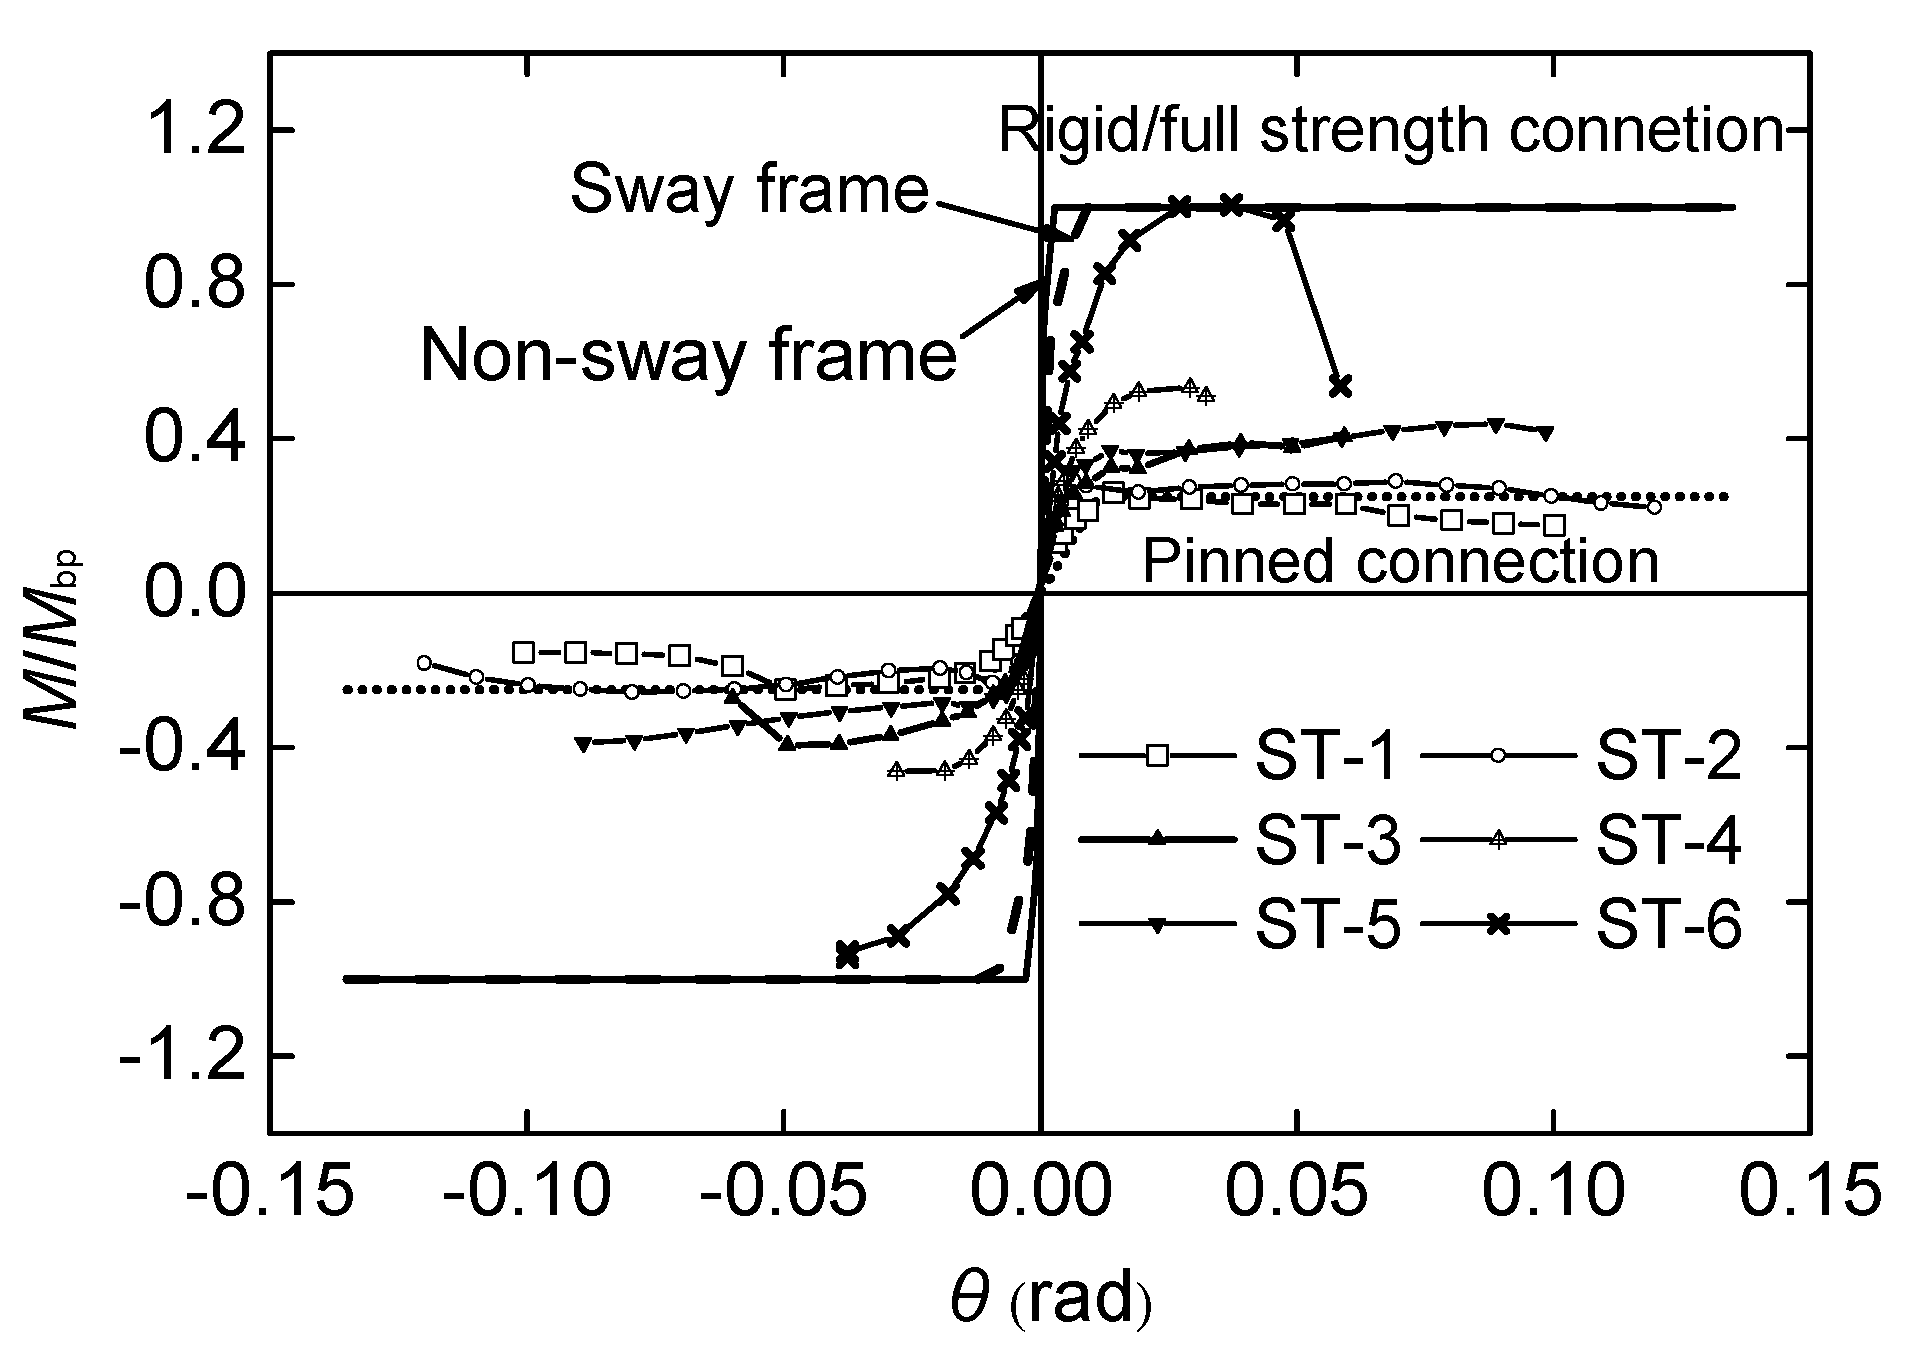
4.3. Classification of the Tested Connections

To determine the connection stiffness and strength in the moment–rotation envelope curve, the typed connection may be classified by EC3 [23]. A connection can be normally classified as nominally pinned, semi-rigid or rigid in terms of the connection stiffness. A connection is nominally pinned when the initial stiffness is less than 0.5EbIb/Lb, where Eb, Ib, and Lb are the elastic modulus, second moment of area, and span of the steel beam, respectively. A rigid connection has an initial stiffness greater than 25EIb/Lb for a non-braced frame and 8EbIb/Lb for a braced frame. A connection with an initial stiffness between these two thresholds is classified as semi-rigid. A connection can be classified as full strength, partial strength, and nominally pinned according to the connection strength. The maximum required connection resistance for nominally pinned connection design is 0.25Mbp, and the full-strength connection resistance is greater than Mbp, where Mbp represents the design plastic flexural resistance of the steel beam. If the flexural resistance is located between the two thresholds, the connection is partial strength. The classification of tested connections is illustrated in Figure 13. Most blind bolted flush end-plate connections to CFST columns are classified as semi-rigid and partial strength; however, specimen ST-6, with a weak beam, is classified as semi-rigid and full-strength.

4.4. Rotation Ability and Ductility Ratio

The Chinese code GB50011-2010 [24] specifies an elastic layer angular displacement [θe] of 0.004 rad and an elastic-plastic layer angular displacement [θp] of 0.02 rad. As is shown in Table 4, for all tested joints, the yield connection rotation (θy) is 1.55–3.13 times [θe], and the failure connection rotation (θf) is 1.62–5.13 times [θp]. To satisfy the ductility requirement in seismic design, FEMA 350 [25] suggests a ductility limit of 0.03 rad. It is indicated by comparison that the anchored blind bolted connections show excellent rotation ability, satisfying the specified earthquake design requirements in both GB50011-2010 and FEMA 350.
The concept of ductility is one of the important elements in the structural earthquake-resistant design. In this paper, the angular ductility coefficient (µθ) is adopted to define the ductility of the joint as follows:
μ θ = θ f θ y
where θf is the failure connection rotation and θy is the yield connection rotation.
The ductility coefficients of the test specimens are greater than 3, and the test specimens show good ductility. These specimens that failed in mode I exhibited much greater ductility coefficients than those that failed in mode II. However, failure mode I is achieved by concrete crushing in the columns and the local buckling of the steel tube faces, and the full strength of the anchored blind bolts cannot be reached, resulting in a low capacity of connections. Additionally, the ductility coefficient of specimens ST-1 is 42% and 65% those of ST-2 and ST-5, respectively. These results indicate that the ductility coefficient increased with an increase in the end-plate thickness due to the high stiffness of the thick end-plate, which limited the rotation of the joint and slowed the decline of the bearing moment of the joints, resulting in a more ductile joint. Moreover, the ductility coefficient of specimen ST-5 is 3.4 times that of specimen ST-4 because using blind bolts without anchor nuts directly led to the change in the failure mode from mode II to mode I, resulting in a significant improvement in the ductility.
For the specimens that failed in mode II, due to the thicker end-plates used in specimens ST-4 and ST-6, premature fracturing of the bolts was observed, and the corresponding ductility coefficients of both connections were less than 4, demonstrating a lower ductility for these connections. However, with the weaker steel beam used in specimen ST-6, the ductility coefficient increased by 22% at the cost of a 19% reduction in the flexural resistance compared to that of specimen ST-4. The ductility coefficient of specimen ST-3 is 5.171, which is clearly greater than that of the other specimens, showing good ductility. Compared with specimen ST-4, the ductility coefficient of specimen ST-3 increased by 66%, indicating that the connection ductility clearly increased with a decrease in the end-plate thickness. However, the counterpart flexural resistance for specimen ST-3 decreased by only 26%. Therefore, with a thick steel tube, the use of thin end-plates and a weak steel beam could exhibit good ductility and seismic performance and ensure a high flexural resistance, which is in accordance with the “strong column–weak beam” design concept. In addition, a large bolt diameter and high bolt grade should be adopted to avoid premature brittle fracture of the bolt and fully develop the deformation performance of the end-plate and steel beam.

4.5. Energy Dissipation

The three key parameters expressing the energy dissipation capacity for CFST column connections are the total dissipation energy (Wtotal), the equivalent viscous damping coefficient (ξe), and the dissipated energy capability (Ee). The total dissipation energy (Wtotal) is the cumulative dissipation energy (W) described as a function of the drift ratio, where W is the area of the P-Δ hysteresis curve at a certain cycle time. The dissipated energy capability (Ee) and the equivalent viscous damping coefficient (ξe) are calculated from Equations (5) and (6). Figure 14 describes the idealized load versus deflection relationship, where SABC and SCDA refer to the upper half area and lower half area of the hysteresis loop, respectively, and SOBE and SODF refer to the corresponding triangular areas.
E e = S A B C + S C D A S O B E + S O D F
ξ e = E e 2 π
Table 5 compares the dissipated energy capability (Ee), the equivalent viscous damping coefficient (ξe), and the total dissipation energy (Wtotal) in the limit state.
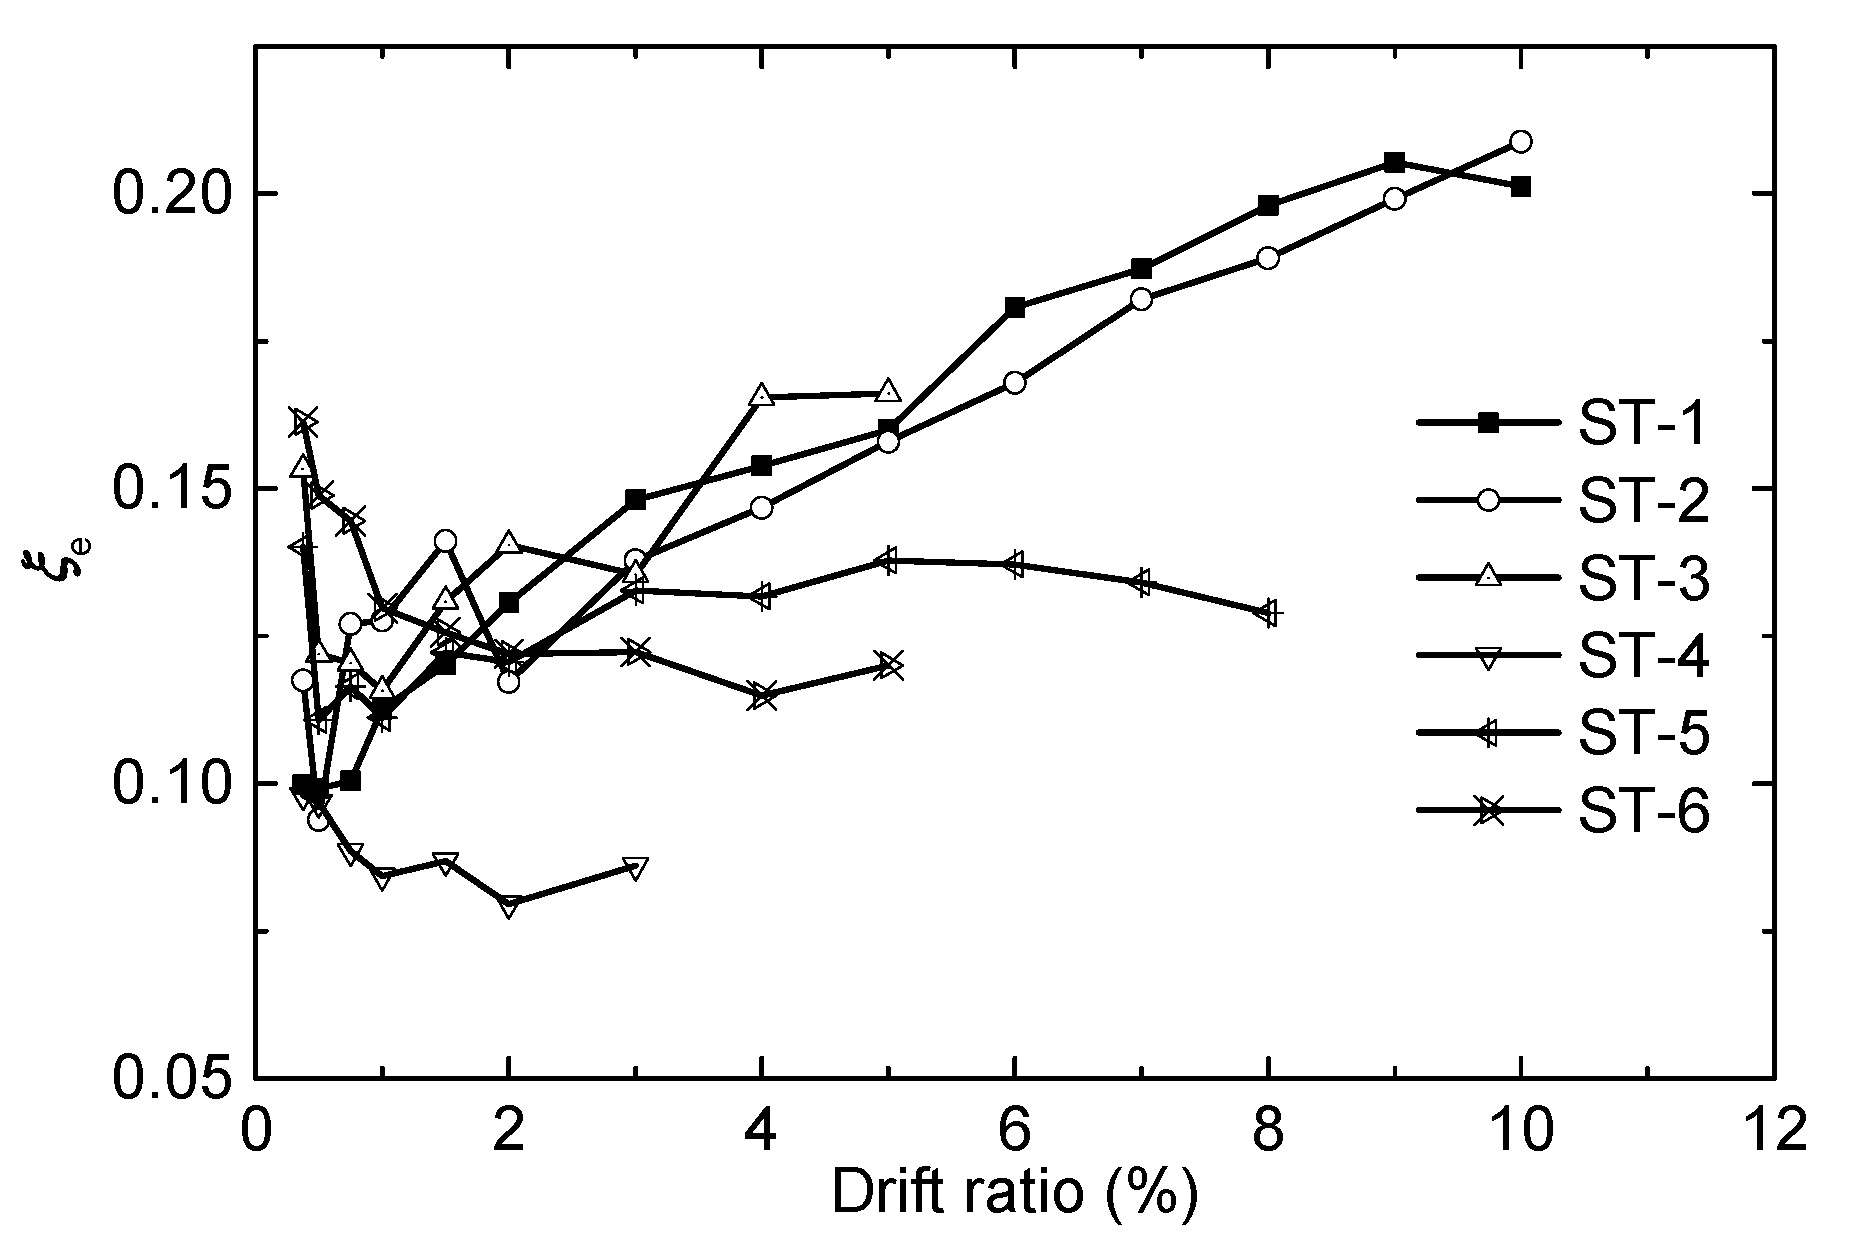
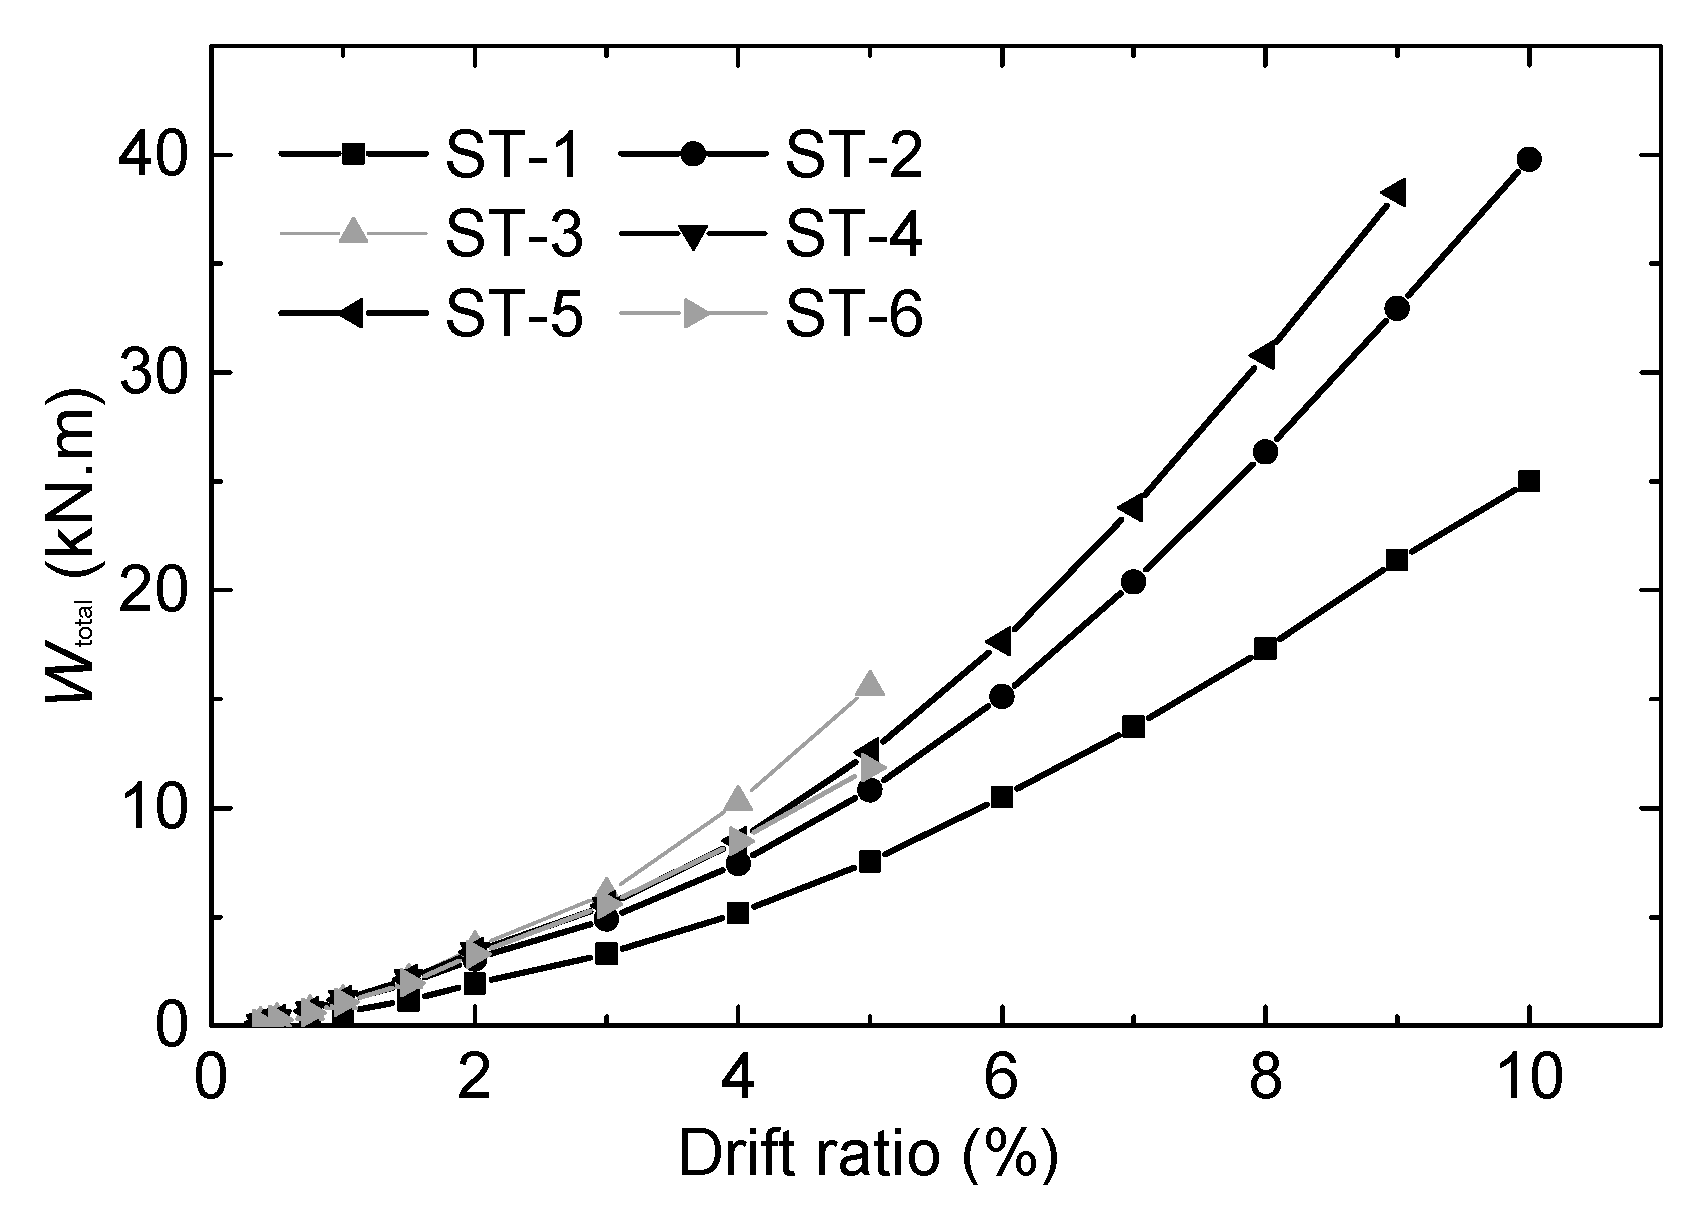
 Figure 15 and Figure 16 exhibit the equivalent viscous damping coefficients (ξe) of each hysteresis loop versus the drift ratio and the total dissipation energy (Wtotal) related to the drift ratio, respectively. These experimental results show:
(1)
The specimens that failed in mode I (ST-1, ST-2, and ST-5) have a better energy dissipation performance than the specimens that failed in mode II (ST-3, ST-4, and ST-6).
(2)
Among the specimens that failed in mode II, the energy dissipation capacity of specimen ST-3, with a thinner end-plate, is the best; a reduction of the steel beam section helps to increase the energy dissipation capacity of joints.
(3)
An increasing end-plate thickness results in a reduction in the equivalent viscous damping coefficient (ξe) for those specimens with failure mode II. The end-plate thickness has little influence on the energy dissipation capacity for the connections with failure mode I. Those connections mainly dissipate energy through CFST columns.
(4)
The influence of the steel tube thickness on the equivalent viscous damping coefficient (ξe) is related to the end-plate thickness. For the joints with thinner end-plates, the thickness of the steel tube had little effect on the equivalent viscous damping coefficient (ξe), which can be attributed to the fact that the thinner end-plate played a major role in energy dissipation. For the joints with thicker end-plates, the effective viscous damping coefficient (ξe) increased with a decreasing steel tube thickness. This result suggests that the CFST columns dominated the energy dissipation.

5. The Finite Element Model

5.1. Finite Element Modeling

5.1.1. Material Models

The stress–strain relationship of the steel can be simplified multi-linear stress–strain curves and is shown in Figure 17 with the material stress–strain curve suggested by Bahaari et al. [26] and Wang et al. [27] as references. The stress–strain relation model considers the plastic hardening of the material and based on the incremental theory of plasticity. The Von Mises yield criterion is adopted to determine whether the steel reaches the yield point in the multiaxial stress state.
The concrete model adopted in this paper is the damaged plasticity model, which can reflect the true condition of the concrete in the FE simulations. The core concrete in the concrete-filled steel tubes is restricted by the steel tubes to change its properties; i.e., the plasticity of the concrete increases. This change is mainly represented by two responses. The first is the strain increase in the corresponding peak stress. The second is the descending segment of the stress–strain curve plateaus. The change in concrete plastic behavior is not reflected by its typical uniaxial compression tests; consequently, the passive constraining force on the core concrete cannot be described. For a reasonable and accurate consideration of these factors, the uniaxial stress–strain relationship model recommended by Han et al. [28] and Wang et al. [12] is used to simulate the core concrete in the analysis. The default values of the parameters mentioned above were assumed to be 38, 0.1, 1.16, 0.66, and 0.0005, respectively.

5.1.2. Finite Element Modeling

The FE models are established and solved using ABAQUS/Standard module. All parts are modeled using the 8-node linear brick incompatible mode element (C3D8R). Seven parts are established, including: steel tube wall, end-plate, C-shape channel, concrete, steel beam, sleeve, and bolt shank. The bolt shank and anchor nut are modeled as the same component, and the modeling of weld fillets is not considered. ’Tie’ contact is used for the welding relationships between the end-plate and steel beam, and a surface-surface interaction with normal direction hard contact and the tangential penalty function is used to simulating the surface between the other components. The model assembly and meshing for these components are presented in Figure 18. Due to the numerous modeling elements, half of the symmetric connection is modeled to reduce computation time. According to the experimental setup, the top and bottom of the column were assumed to be hinged base, which limits three degrees of freedom in the direction and allow to rotate. Symmetry boundary conditions were imposed in the model. The test loading is controlled through displacement applied on a reference point coupled with the loading surface.

5.2. Validation

The flexural behavior of the anchored blind bolted joints to CFST columns is analyzed, and the FE models are validated against the experimental results. The moment–rotation curves obtained by the finite element calculations are compared with the moment–rotation envelope curves obtained by the experiments in Figure 19. The curves of specimens ST-3, ST-4, and ST-6 approximately coincide. The curves of specimens ST-1, ST-2, and ST-5 approximately coincide in the early stage and exhibit few errors in the latter stage. Due to the influence of anchor nuts, anchoring bolts, and expansive sleeves, and considering the group anchoring effect and steel tube confinement, the multidirectional stress states of concrete between the steel tube wall and anchoring end were very complicated. Moreover, in the latter loading stage, specimens ST-1, ST-2, and ST-5 underwent severe concrete damage and bolt slippage, and many cracks would continue to occur until the core concrete in the panel zone was totally destroyed. Regardless of whether the ordinary concrete uniaxial pull-out model or the confined concrete model was used to simulate concrete behavior, it was difficult to fully reflect the true concrete behavior in the complicate state of stress. In addition, under cyclic loading, the cracking of core concrete would be aggravated. Therefore, the maximum moment of those specimens would be reduced to some extent, and the ultimate moment was hard to predict accurately. As shown in Table 6, only the initial stiffness value calculated using FE analysis for specimen ST-3 is underestimated. Through the comparison between FE analysis and the following theoretical formula derivation, this underestimation might occur because the test data of specimen ST-3 in the elastic stage had some measurement errors and were overestimated to a certain extent. The prediction of the initial stiffness obtained from the other FE models shows sufficient accuracy, with an average value of the FE/Test ratio of 1.088 and a standard deviation of 0.017.
As shown in Figure 20, model validation is conducted by comparing the failure modes of the FE models with those observed in the experimental observations. The end-plates, the thick steel tube, the weak beam, and the bolts showed similar deformation in the test and FE models. The only differences observed between the experimental tests and FE models were for the thin tubes of specimens ST-1 and ST-2 due to the severe damage of the infill concrete, as mentioned above, which resulted in excessive outward deformation of the tube face. Therefore, the failure modes of the connections in both the experimental tests and FE models show good agreement.
Through this validation of the tested connections, it is clear that the FE models could simulate the connection behavior successfully; in particular, the stiffness of the anchored blind bolted joints obtained in the early stage could be predicted by the models with sufficient precision. Therefore, the FE models are suitable for the following stiffness analysis.

6. Research on the Initial Stiffness of Connection Based on the Component Method

6.1. A Mechanical Model of the Initial Stiffness

The initial stiffness of the joints anchored to the CFST columns by blind bolts can be predicted according to the classical component method recommended by EC3 [23]. The various finite element simulations show that when calculating the initial stiffness, the first two rows of bolts contribute to the tension of the connection, and the third row hardly contributes, especially for the proposed connections with a thin end-plate. The displacement cloud chart in Figure 21 shows that the area behind the third row of bolts undergoes approximately no displacement for specimen ST-3 at a drift ratio of 1%. Based on the plastic development of the FE models at the end-plate, the plastic hinge appeared around the center line of the third row of bolts. Therefore, when calculating the initial stiffness, the top two rows of bolts are assumed to be in tension, and the center line of the third row of bolts in compression is regarded as the center of the rotation of the specimen. The simplified initial stiffness mechanical model of the joint is shown in Figure 22a; keff, 1 and keff, 2 are the effective stiffnesses of the first bolt row and second bolt row, respectively, and they consist of four springs in series, representing the following stiffnesses: the end-plate in bending (k1), the bolt in tension (k2), the concrete in compression (k3), and the steel tube wall in bending (k4), as shown in Figure 22b. Therefore, k5 and k6 are the stiffnesses of the column wall in compression and concrete in compression, respectively. The CFST column is adequately rigid, therefore k5 and k6 are assumed to be infinite and neglected. These components are discussed further in the next section.

6.2. Stiffness Calculation of the End-Plate in Bending and the Bolt in Tension

The formula for calculating the stiffness of an end-plate in bending and a bolt in tension is provided by EC3 [23], as shown in Equations (7) and (8), respectively.
k 1 = 0.9 E s l eff t p 3 m 3
k 2 = 1.6 E s A s L bo
where Es is the elastic modulus of steel; leff is the effective length of the T-stub; tp is the end-plate thickness; m is the distance between the centre of the bolt hole and the intersection of stem and end-plate; As is the effective tensile area of the bolt; Lbo is the effective bolt length, given by Lbo = tc + tp + demb + (tw + tnut)/2, where tc is the steel tube wall thicknesses; and tw and tnut are the thicknesses of the blind bolt washer and anchor nut, respectively.

6.3. Stiffness Calculation of the Concrete in Compression and the Steel Tube Wall in Bending

Most of the force in the concrete is transmitted to the tube face in the form of a cone with the anchor nut as the vertex, as shown in Figure 23. The calculation assumes that the concrete deforms elastically in the initial state and that the bolt force can be spread to the tube face in the form of a cone. The model of the bolt force in concrete is shown in Figure 24, and the cone diffusion angle is approximately 60°, according to the results of FE analysis.

6.3.1. Stiffness Calculation of the Concrete in Compression

When the concrete is subjected to bolt pressure, it will produce compression deformation. Figure 25 shows the compression stiffness calculation model, where F indicates the resistance produced by a unit of compression deformation and Δ is the corresponding compression deformation. Moreover, the stiffness of concrete in tension was neglected according to EC3 [23]. The calculation formula is proposed as follows:
Δ = 0 d emb F / 2 E c A x d x
A x = π [ ( d nut + x cot θ cc ) 2 d b 2 ]
k 3 = F Δ
where demb is the embedded depth of the blind bolt, Ec is the elastic modulus of concrete, Ax is the compressive area of the concrete as a function of x, dnut is the diameter of the anchor nut, db is the effective diameter of the bolt, and θcc is the angle between the inclined plane and the horizontal plane of the cone. The parameters are shown in Figure 25.

6.3.2. Stiffness Calculation of the Steel Tube Wall in Bending

A steel tube wall pulled on by a row of bolts can be considered equivalent to the calculation model proposed by Neves et al. [29], where Hollo-Bolts were used without extended bolt shanks and an anchor nut. The formula for calculating the stiffness of the steel tube wall is shown in Equation (12).
k 4 = 16 E s t c 3 L e 2 · α + ( 1 β ) tan ϕ ( 1 β ) 3 + 10.4 ( λ 1 λ 2 β ) μ 2
where Es is the elastic modulus of steel, Le is the distance between the fixed axis of the two ends of the steel tube wall, tc is the steel tube thickness, α is the ratio of the diameter of the bolt head (c) to Le, β is the ratio of the distance between the outer diameter of the bolt head to Le, and µ is the ratio of Le to the steel tube wall thickness (tc). The proposed value of φ is 35-10 β (refer to Neves et al. [29]), and λ1 and λ2 are 1.5 and 1.6, respectively.
For the proposed connections in this paper, considering the compression surface of the steel tube wall to greatly increase in size, the compression surface is modified by introducing a magnification coefficient for the bolt head diameter (c). According to Elamin [30], this coefficient is related to the binding force of the steel tube wall to the concrete and the lateral spacing of the bolts; the value of the magnification coefficient used in this paper is 3.5.

6.4. The Calculation Results of Initial Stiffness

The effective stiffness keff r of bolt row r can be derived from
k eff , r = 1 1 k 1 , r + 1 k 2 , r + 1 k 3 , r + 1 k 4 , r
where ki,r is the stiffness for the i-th component corresponding to bolt row r.
A single equivalent spring with stiffness keq replaces components related to the first bolt row and second bolt row. The following expression can be derived for keq.
k eq = ( i k eff , i z i ) 2 i k eff , i z i 2
where zr defines the location of bolt row r with respect to the assumed center of rotation.
The corresponding equivalent lever arm zeq is derived from
z eq = i k eff , i z i 2 i k eff , i z i
The overall connection initial stiffness (Ki) can be calculated from Equation (16):
K i = M θ = z eq 2 i 1 k i = z eq 2 1 k eq + 1 k 5 + 1 k 6 = k eq z eq 2
Equation (16) is first applied to test specimens ST-1 to ST-6 for validating the improved component model for predicting the initial stiffness. The results from the proposed component model, the test and the corresponding FE models are summarized in Table 7. Compared with the test and the FE results, the theoretical predictions basically agree, and the error margin for individual specimens is 17%.
To further validate the proposed component model described above, an extensive parametric analysis was carried out on the typical connection configurations. Hence, a total of 17 FE models for various tube thickness, end-plate thickness, vertical bolt distances, and bolt diameters were modeled to validate the proposed component method. Table 8 provides the comparison of the stiffnesses from the FE predictions to the ones from the component-based model for the various research cases. The component-based model calculations are within ±17% of those of the FE models and mostly within an error margin of 10%. Although the initial stiffness error margins are very high, due to the complexity of the experiment, these values might be acceptable. Furthermore, it is also worth noting that an average value of the Theory/FE ratio is equal to 0.95 with a standard deviation equal to 0.072.
Therefore, it can be seen that the predicted initial stiffnesses are generally in good agreement with those of the test results and the FE analysis results for typical cases, proving the reliability of the proposed method for predicting the initial stiffness of a connection.

7. Conclusions

The observations and conclusions of the experimental and analytical study reported in this paper can be summarized as follows:
(1)
The observed results demonstrated that the application of the modified anchored blind bolts (Hollo-Bolt) and a locally strengthened steel tube column in the panel zone can effectively avoid the premature anchorage failure and CFST column damage for the bolted connections to square CFST columns in the moment-resisting frames. No obvious damage was observed for the embedded extensions of the blind bolts and C-shaped channels, providing a stable and sustained effect on the joint performance during cyclic loading. The proposed connection demonstrated its ability to reach the ultimate strength of the blind bolts and significantly improved the performance of the connections in terms of the flexural resistance, stiffness and stiffness degradation.
(2)
Two representative failure modes were presented in the test for the anchored blind bolted connections to square CFST columns. The tube wall thickness and blind bolt anchorage method mainly determined the failure mode, and the end-plate thickness and steel beam section had an influence on joint deformation. Connections that failed in mode II exhibited higher flexural resistances and stiffnesses, while better rotation ability, ductility and energy dissipation capability were observed for connections that failed in mode I. For connections that failed in mode I, the good deformation capacity is mainly achieved by the deformation of the steel tube walls and the crushing of concrete in the columns. For connections that failed in mode II, using thin end-plates and a weak steel beam could produce a good deformation capacity, avoiding premature brittle fracture of the connections while maintaining a high flexural resistance.
(3)
Due to the change of failure mode, the use of locally strengthened steel tube can not only enhance the initial stiffness and strength of a connection but also reduce the counterpart rotation capacity and ductility. The use of thin end-plate and weak beam can effectively enhance the hysteretic behavior, ductility, and energy dissipation capacity of joints. The change in anchorage method has a great influence on the flexural capacity but has little effect on the stiffness.
(4)
The rotation capacity and the ductility of these anchored blind bolted joints can satisfy the requirements for structural earthquake-resistant design in most seismic areas. In accordance with EC3 Part 1-8, most blind bolted flush end-plate connections to CFST columns were classified as semi-rigid and partial strength, except specimen ST-6 with a weak beam, which shows semi-rigid and full-strength behavior.
(5)
An FE model of these anchored blind bolted joints was also developed in this study using ABAQUS/Standard module. It is shown that the model could simulate the connection behavior successfully, particularly predicting the stiffness of the anchored blind bolted joints obtained in the early stage with sufficient precision. According to the mechanical behavior of the connection components, the component model of such a joint is proposed, and the initial stiffness expression is established. The expression was verified by the experimental results and the results obtained from numerous parametric FE models, demonstrating the reliability of the initial stiffness expression.
The current work can provide a good understanding of the performance of the proposed connection, which is an important reference in actual engineering. Especially, the theoretical analysis of the connection stiffness, which is a foundation of structural elastic analysis and calculation, offer a significant benefit in design guidance of the anchored blind-bolted connections. These will contribute to the application of the blind-bolted connections between CFST columns and steel beams in building construction. In this paper, only cyclic testing on the proposed connections was conducted to evaluate their seismic behavior. Future testing should be conducted on the proposed connections using benchmark earthquake load, such as El-Centro, Kobe et al., to assess the seismic behavior of the connections, which can get the dynamic response of the connections under the real earthquake.

Author Contributions

Conceptualization: Z.W. and Y.W.; methodology, Z.W. and Y.W.; validation, Z.W. and J.P.; formal analysis, P.W. and J.P.; investigation, Y.W. and Z.W.; writing—original draft preparation, Y.W.; writing—review and editing, P.W. and Y.W.; visualization, P.W. and Y.W.; supervision, P.W. and Z.W.; project administration, J.P. and Z.W.; funding acquisition, J.P. and Z.W. All authors have read and agreed to the published version of the manuscript.

Funding

This research was funded by National Natural Science Foundation of China, grant number 51638009, 51778241, and 51978279. This research was also funded by Fundamental Research Funds for the Central Universities, grant number 2019PY20, 2019ZD47, and 2019MS121. In addition, this research was funded by Chinese Postdoctoral Foundation of China, grant number 2019M652898 and Young Innovative Talents Program in Universities of Guangdong Province, grant number 2018KQNCX006.

Conflicts of Interest

The authors declare no conflict of interest.

References

  1. Han, L.; Li, W.; Bjorhovde, R. Developments and advanced applications of concrete-filled steel tubular (CFST) structures: Members. J. Constr. Steel Res. 2014, 100, 211–228. [Google Scholar] [CrossRef]
  2. Varma, A.H.; Ricles, J.M.; Sause, R.; Lu, L.W. Seismic behavior and modeling of high-strength composite concrete-filled steel tube (CFT) beam–columns. J. Constr. Steel Res. 2002, 58, 725–758. [Google Scholar] [CrossRef]
  3. Wang, Z.; Tao, Z.; Li, D.; Han, L. Cyclic behaviour of novel blind bolted joints with different stiffening elements. Thin Walled Struct. 2016, 101, 157–168. [Google Scholar] [CrossRef]
  4. Wang, J.; Han, L.; Uy, B. Behaviour of flush end plate joints to concrete-filled steel tubular columns. J. Constr. Steel Res. 2009, 65, 925–939. [Google Scholar] [CrossRef]
  5. Lee, J.; Goldsworthy, H.M.; Gad, E.F. Blind bolted moment connection to sides of hollow section columns. J. Constr. Steel Res. 2011, 67, 1900–1911. [Google Scholar] [CrossRef]
  6. Lee, J.; Goldsworthy, H.M.; Gad, E.F. Blind bolted moment connection to unfilled hollow section columns using extended T-stub with back face support. Eng. Struct. 2011, 33, 1710–1722. [Google Scholar] [CrossRef]
  7. Gardner, A.; Goldsworthy, H.; Bridge and, Foster. Moment-resisting connections for composite frames. In Mechanics of Structures & Materials; Gardner, A., Goldsworthy, H., Bridge and, Foster, Eds.; Balkema: Rotterdam, The Netherlands, 1999; pp. 309–314. [Google Scholar]
  8. Gardner, A.P.; Goldsworthy, H.M. Experimental investigation of the stiffness of critical components in a moment-resisting composite connection. J. Constr. Steel Res. 2005, 61, 709–726. [Google Scholar] [CrossRef]
  9. Goldsworthy, H.M.; Gardner, A.P. Feasibility study for blind-bolted connections to concrete-filled circular steel tubular columns. Struct. Eng. Mech. 2006, 24, 463–478. [Google Scholar] [CrossRef]
  10. Wang, J.; Chen, X.; Shen, J. Performance of CFTST column to steel beam joints with blind bolts under cyclic loading. Thin Walled Struct. 2012, 60, 69–84. [Google Scholar] [CrossRef]
  11. Wang, J.; Guo, S. Structural performance of blind bolted end plate joints to concrete-filled thin-walled steel tubular columns. Thin Walled Struct. 2012, 60, 54–68. [Google Scholar] [CrossRef]
  12. Wang, J.; Spencer, B.F. Experimental and analytical behavior of blind bolted moment connections. J. Constr. Steel Res. 2013, 82, 33–47. [Google Scholar] [CrossRef]
  13. Wang, J.; Zhang, L.; Spencer, B.F. Seismic response of extended end plate joints to concrete-filled steel tubular columns. Eng. Struct. 2013, 49, 876–892. [Google Scholar] [CrossRef]
  14. Tizani, W.; Ridley, E. The Performance of A New Blind-Bolt for Moment-Resisting Connections; Taylor & Francis: Abingdon, UK, 2003. [Google Scholar]
  15. Pitrakkos, T.; Tizani, W. Experimental behaviour of a novel anchored blind-bolt in tension. Eng. Struct. 2013, 49, 905–919. [Google Scholar] [CrossRef]
  16. Tizani, W.; Al-Mughairi, A.; Owen, J.S.; Pitrakkos, T. Rotational stiffness of a blind-bolted connection to concrete-filled tubes using modified Hollo-bolt. J. Constr. Steel Res. 2013, 80, 317–331. [Google Scholar] [CrossRef]
  17. Tizani, W.; Wang, Z.Y.; Hajirasouliha, I. Hysteretic performance of a new blind bolted connection to concrete filled columns under cyclic loading: An experimental investigation. Eng. Struct. 2013, 46, 535–546. [Google Scholar] [CrossRef]
  18. Agheshlui, H.; Goldsworthy, H.; Gad, E.; Fernando, S. Tensile behaviour of anchored blind bolts in concrete filled square hollow sections. Mater. Struct. 2016, 49, 1511–1525. [Google Scholar] [CrossRef]
  19. China Architecture and Building Press. JGJ3-2010. Technical Specification for Concrete Structures of Building; China Architecture and Building Press: Beijing, China, 2011. [Google Scholar]
  20. Peter Clark, K.F.H.K. Protocol for Fabrication, Inspection, Testing, and Documentation of Beam–column Connection Tests and Other Experimental Specimens. In Rep. No.SAC/BD-97/02; SAC Joint Venture: Sacramento, CA, USA, 1997. [Google Scholar]
  21. He, Y.; Huang, P.; Guo, J.; Zhou, H.; Li, Y. Experimental study on seismic behavior of steel-reinforced concrete square column and steel beam joint with bolted end-plate. J. Build. Struct. 2012, 33, 116–125. [Google Scholar]
  22. China Architecture and Building Press. JGJ101-96. Specificating of Testing Methods for Earthquake Resistant Building; China Architecture and Building Press: Beijing, China, 1996. [Google Scholar]
  23. European Committee for Standardization. EN1993-1-8. Eurocode 3: Design of Steel Structures-Part 1-8. In Design of Joints; European Committee for Standardization: Brussels, Belgium, 2005. [Google Scholar]
  24. ChineseStandard. GB50011-2010. Code for Seismic Design of Buildings; China Architecture and Building Press: Beijing, China, 2010. [Google Scholar]
  25. Federal Emergency Management Agency. FEMA-350. Recommended Seismic Design Criteria for New Steel Moment-Frame Buildings; Federal Emergency Management Agency: Washington, DC, USA, 2000. [Google Scholar]
  26. Bahaari, M.R.; Sherbourne, A.N. Behavior of eight-bolt large capacity endplate connections. Comput. Struct. 2000, 77, 315–325. [Google Scholar] [CrossRef]
  27. Wang, P.; Pan, J.; Wang, Z.; Chen, S. Experimental and analytical behavior of stiffened angle joints. Steel Compos. Struct. 2018, 26, 67–78. [Google Scholar]
  28. Han, L.H.; Yao, G.H.; Zhao, X.L. Tests and calculations for hollow structural steel (HSS) stub columns filled with self-consolidating concrete (SCC). J. Constr. Steel Res. 2005, 61, 1241–1269. [Google Scholar] [CrossRef]
  29. Neves, L.C.; da Silva, L.S.; Vellasco, P.C.G.S. A model for predicting the stiffness of beam to concrete filled column and minor axis joints under static monotonic loading. In Proceedings of the 4th European Conference on Steel and Composite Structures, Maastricht, The Netherlands, 8–10 June 2005; pp. 131–138. [Google Scholar]
  30. Elamin, A.M.E.A. The Face bending Behaviour of Blind-Bolted Connections to Concrete-Filled Hollow Sections. Ph.D. Thesis, University of Nottingham, Nottingham, UK, 2014. [Google Scholar]
Figure 1. Details of joint specimens (unit: mm). (a) Specimens ST-1 and ST-2; (b) specimens ST-3 and ST-4; (c) specimen ST-6; (d) end-plate.
Applsci 10 02517 g001
Figure 2. The modified Hollo-bolt.
Applsci 10 02517 g002
Figure 3. Test setup. (a) Schematic of test setup; (b) picture of test setup.
Applsci 10 02517 g003
Figure 4. Loading protocol.
Applsci 10 02517 g004
Figure 5. Arrangement of LVDTs (unit: mm). (a) For specimens ST-1–ST-5; (b) for specimen ST-6.
Applsci 10 02517 g005
Figure 6. Failure mode I (specimens ST-1, ST-2, and ST-5). (a) ST-1; (b) ST-2; (c) ST-5; (d) tube wall in specimen ST-1; (e) core concrete in specimen ST-2.
Applsci 10 02517 g006
Figure 7. Failure mode II (specimens ST-3, ST-4, and ST-6). (a) ST-3; (b) ST-4; (c) ST-6; (d) steel beam in specimen ST-6; (e) fractured blind bolts; (f) tube wall in specimen ST-3; (g) core concrete in specimen ST-3.
Applsci 10 02517 g007
Figure 8. Embedded extension of blind bolt.
Applsci 10 02517 g008
Figure 9. Bolt holes in specimen ST-3.
Applsci 10 02517 g009
Figure 10. Moment (M)-rotation (θ) hysteresis curves.
Applsci 10 02517 g010
Figure 11. Moment (M)–rotation(θ) envelope curves. (a,b) Effect of steel tube thickness; (c,d) effect of end-plate thickness; (e) effect of anchorage method; (f) effect of beam section.
Applsci 10 02517 g011
Figure 12. Key parameters definition in moment–rotation curve of connections.
Applsci 10 02517 g012
Figure 13. Classification of tested connections.
Applsci 10 02517 g013
Figure 14. An idealized hysteretic loop.
Applsci 10 02517 g014
Figure 15. ξe versus drift ratio.
Applsci 10 02517 g015
Figure 16. Wtotal related to drift ratio.
Applsci 10 02517 g016
Figure 17. Trilinear model.
Applsci 10 02517 g017
Figure 18. 3-D finite element (FE) model and mesh of the connection components.
Applsci 10 02517 g018
Figure 19. Comparison of test and finite element moment–rotation curves. (a) ST-1; (b) ST-2; (c) ST-3; (d) ST-4; (e) ST-5; (f) ST-6.
Applsci 10 02517 g019
Figure 20. Observed and predicted failure modes. (a) The flexural deformation of the thin end-plate in specimen ST-1. (b) The outward deformation of the thick end-plate in specimen ST-4. (c) The local buckling at the root of the steel beam in specimen ST-6. (d) The fractured bolt shank in specimen ST-6 (bending and shearing fracture).
Applsci 10 02517 g020
Figure 21. End-plate displacement cloud chart for specimen ST-3 at a drift ratio of 1%.
Applsci 10 02517 g021
Figure 22. Mechanical model of initial stiffness of connection. (a) Component model for the joint; (b) component model for the effective stiffness.
Applsci 10 02517 g022
Figure 23. Transmission of force in concrete.
Applsci 10 02517 g023
Figure 24. The model of bolt force in concrete.
Applsci 10 02517 g024
Figure 25. Calculation model of concrete stiffness in compression.
Applsci 10 02517 g025
Table 1. Details of joint specimens.
SpecimenColumn Section (mm)Beam Section (mm)End-Plate Thickness (mm)C-Shaped Channel ReinforcementAnchor Nut
ST-1250 × 250 × 5HN350 × 175 × 7 × 1112NoYes
ST-2250 × 250 × 5HN350 × 175 × 7 × 1124NoYes
ST-3250 × 250 × 5HN350 × 175 × 7 × 1112YesYes
ST-4250 × 250 × 5HN350 × 175 × 7 × 1124YesYes
ST-5250 × 250 × 5HN350 × 175 × 7 × 1124YesNo
ST-6250 × 250 × 5HN300 × 150 × 6 × 924YesYes
Table 2. Material properties of the steel components.
Steel CouponsSteel Wall Thickness(mm)Es (GPa)fy (MPa)fu (MPa)δ (%)
End plate-112197.29399.2562.825.7
End plate-224198.26408.5534.528.7
C-shaped channel7192.29395.2567.827.7
Steel tube5208.75477.1609.221.3
Beam web-17202.23412.6593.624.83
Beam web-26192.05254.1397.030.0
Beam flange-111202.02412.4591.518.6
Beam flange-29197.41269.7405.726.6
Table 3. Typical failure modes of the specimens.
ComponentFailure Mode I (Specimen ST-1, ST-2, and ST-5)Failure Mode II (Specimen ST-3, ST-4, and ST-6)
Anchored blind boltPartial pull-outBolt rupture
Column wallBulging deformationSlight bulging around the bolt holes
Core concreteSeverely damagedLocal concrete crushing
Steel beamNo obvious local beam bucklingNo obvious local beam buckling except ST-6
Table 4. Main test results.
SpecimenKi (kN·m/mrad)My (kN·m)θy (mrad)Mmax (kN·m)θmax (mrad)Mf (kN·m)θf (mrad)μ
ST-110.8356.999.070.2414.459.7062.66.96
ST-215.4263.976.278.0469.366.33102.616.55
ST-315.2180.1210.5106.3449.290.3954.35.17
ST-419.18118.5710.4143.8429.3138.0532.43.12
ST-517.7790.389.2118.6488.8113.0898.510.71
ST-617.5795.1912.5116.0237.3111.1747.53.80
Table 5. Key parameters of energy dissipation in the limit state.
SpecimenEeξeWtotal (kN·m)
ST-11.2630.20123.74
ST-21.3180.21039.80
ST-31.0420.16615.57
ST-40.5400.0865.51
ST-50.8300.13238.27
ST-60.7700.12311.86
Table 6. Comparison of the FE analysis and test results.
Specimen My (kN·m)θy (mrad)Ki (kN·m/mrad)KFE/Ktest
ST-1Test57.009.010.831.10
Model65.8710.511.96
ST-2Test63.976.215.421.08
Model71.267.916.70
ST-3Test80.1210.515.210.83
Model82.539.912.56
ST-4Test118.5710.419.181.07
Model119.899.820.60
ST-5Test90.389.217.771.10
Model99.8910.719.62
ST-6Test95.1912.517.571.09
Model96.0210.819.20
Table 7. Comparison of the component model to the test results and corresponding FE analysis results.
SpecimenComponent Model KtheoryTest KtestRatio Ktheory/KtestFE Model KFERatio Ktheory/KFE
ST-19.9010.830.9111.960.83
ST-214.7315.420.9516.700.88
ST-312.1515.210.8012.560.97
ST-420.3319.181.0620.600.98
ST-519.9917.771.1219.621.02
ST-620.3217.571.1619.201.06
Note: Units for stiffness, K: kN·m/mrad.
Table 8. Comparison between the component method and FE analysis results for overall connection stiffness.
SpecimenTube Thickness (mm)Endplate Thickness (mm)Vertical Bolt Distance (mm)Bolt Diameter (mm)KtheoryKFERatio Ktheory/KFE
M-1512100169.9011.960.83
M-28121001612.1413.750.88
M-312121001612.1512.560.97
M-45251001614.7316.700.88
M-58251001620.2820.590.99
M-612251001620.3220.600.98
M-7128100165.666.370.89
M-812161001616.6916.291.02
M-912201001619.0718.781.02
M-101212801610.3010.600.97
M-1112121201614.2016.090.88
M-121225801617.2417.990.96
M-1312251201623.7524.720.96
M-1412121001812.8713.790.93
M-1512121002013.6416.090.85
M-1612251001822.6421.891.03
M-1712251002025.4423.031.10

