Article

Improving a Manufacturing Process Using the 8Ds Method. A Case Study in a Manufacturing Company

by
Arturo Realyvásquez-Vargas
1,
Karina Cecilia Arredondo-Soto
2,
Jorge Luis García-Alcaraz
3,* and
Emilio Jiménez Macías
4
1
Department of Industrial Engineering, Tecnológico Nacional de México/Instituto Tecnológico de Tijuana, Calzada del Tecnológico S/N, Tijuana 22414, Baja California, Mexico
2
Chemical Sciences and Engineering Faculty, Universidad Autónoma de Baja California, Calzada Universidad #14418, Parque Industrial Internacional, Tijuana 22390, Baja California, Mexico
3
Department of Industrial and Manufacturing Engineering, Autonomous University of Ciudad Juarez, Ave. del Charro 450 Norte. Col. Partido Romero, Ciudad Juárez 32310, Chihuahua, Mexico
4
Department of Electrical Engineering, University of La Rioja, Edificio Departamental—C/San Jose de Calasanz 31, 26004 Logroño, La Rioja, Spain
*
Author to whom correspondence should be addressed.
Appl. Sci. 2020, 10(7), 2433; https://doi.org/10.3390/app10072433
Submission received: 31 January 2020 / Revised: 19 March 2020 / Accepted: 30 March 2020 / Published: 2 April 2020
(This article belongs to the Special Issue Design and Management of Manufacturing Systems)

Abstract

:

Featured Application

The present case study reports the 8D technique applied to a real manufacturing production process. Future applications can be adapted to other manufacturing industries by integrating the most important variables in their own contexts.

Abstract

Customer satisfaction is a key element for survival and competitiveness in industrial companies. This paper describes a case study in a manufacturing company that deals with several customer complaints due to defective custom cable assemblies that are integrated in an engine. The goal of this research is to find a solution to this problem, as well as prevent its recurrence by implementing the eight disciplines (8Ds) method in order to: (1) develop a team, (2) describe the problem, (3) develop an interim containment action, (4) determine and verify root causes, (5) develop permanent corrective actions, (6) define and implement corrective actions, (7) prevent recurrences, and (8) recognize and congratulate teamwork as well as individual contributions. Therefore, a software tool is proposed to conduct a functional test on assembly lines. After the test, the problem was successfully reduced and detected, because from 67 engines that were identified with problems, 51 were redesigned before being sent to customers, consequently decreasing the number of defective products by 75%, whereas the remaining 16 engines were replaced by new engines. In conclusion, the research goal was accomplished, and the 8Ds method proved to be a helpful model with which to increase employees’ motivation and involvement during the problem-solving process.

1. Introduction

In manufacturing industries, waste refers to the activities that consume resources but that do not directly add value to the product or service for the customer [1]. According to the literature review, there are seven categories of waste in manufacturing that negatively affect the quality of products, delivery times, and unit cost [2,3]. These wastes are overproduction, inventory, over-processing, motion, waiting, transport, and defects [4,5]. Regarding the defects, during the manufacturing processes, companies receive material or components from their suppliers. Then, those materials or components are changed to obtain a final product, which must be delivered to customers on time and without defects [6]. However, defects continue being present in the manufacturing industry nowadays. In fact, several authors mention that defects are the main cause of damages in final products or other components [7,8,9,10], which represent a critical situation for the industrial and manufacturing sector [11].
Moreover, customer satisfaction is a requirement that must be considered for any distributor business that is intending to remain globally competitive [12,13]. Nevertheless, if managers want to fulfill customer needs, an appropriate product design process must be included [14]. In this sense, one of main customer needs is a non-defective, quality product [15], since product defects lead to customer dissatisfaction, sales decreases, low financial profits, and greater unit costs [16,17]. In order to improve the effectiveness and efficiency of the production process, offer quality products, and avoid the latest problems, manufacturing companies rely on a wide range of methods and techniques for production improvement [18], including the six sigma management philosophy, DMAIC (i.e., define, measure, analyze, improve, and control) [19], process flow charting (PFC) [20], the Deming or PDCA cycle (i.e., plan, do, check, act) [21,22], and the eight disciplines (8Ds) method [23], among others.
Specifically, the 8Ds are focused on: (D1) develop a team, (D2) describe the problem, (D3) develop an interim containment action, (D4) determine and verify root causes, (D5) Choose/verify permanent corrective actions, (D6) implement and validate corrective actions, (D7) prevent recurrences, and (D8) recognize and congratulate teamwork as well as individual contributions, which is a powerful method because it helps with creating appropriate activities in order to identify the root causes of a problem, and provides permanent solutions to eliminate them. In addition, the 8Ds method is a special tool of ISO/TS 16949:2009 that has been broadly applied in automotive industry for service, including the issues concerning supplier qualification confirmation, process deviations, maintenance, customer complaints, and purchases.
The 8Ds method has been adopted widely in the manufacturing world [24]. For instance, several authors have applied it to solve problems of defects. Some of these authors are: Mitreva et al. [25], who applied it for solving a problem in a LED diode that does not perform its function in a circuit board. Likewise, Titu [26] implemented the 8Ds method to reduce complaints about a defective part; consequently, 60 days after corrective actions were implemented, no other product was identified with this type of defect, and customers decided to withdraw the complaint. Additionally, Kumar and Adaveesh [24] conducted a study in a spring and stamping manufacturing plant for solving a high rejection rate (i.e., 17.07%) of valve springs due to defects. In order to solve this problem, the 8Ds method was applied, and as a result the rejection rate decreased significantly in 6 months, by 4.91%.

Research Problem

A maquiladora is a factory that operates under preferential tariff programs established in Mexico that has headquarters in other countries and performs assembly operations with high hand labor required. Materials, assembly components, and production equipment used in maquiladoras are allowed to enter Mexico duty-free. Currently, in Mexico there are 5144 maquiladoras giving 2,678,633 direct jobs. However, Baja California state has 914 (17.76% from national) maquiladoras giving 333,392 direct jobs [27].
Those companies are using several techniques and methodologies for solving manufacturing problems in production lines. This paper reports a case study applied in a manufacturing company located in Tijuana, Mexico, dealing with the manufacturing of electric custom cables. Each cable is tested for quality through a series of computer-assisted programs for a complete inspection. This strategy allows the company to build and maintain long-term relationships with its customers, thereby helping the company reach its goals and be successful. However, the company has lately experienced problematic defects; as a result, customers are complaining due to 67 returned assemblies.
The problem concerns a stepper motor (see Figure 1), one of the main assembly components, which has a part number that will be called part number A. Customers provide the motors to the company, which introduces them into the production process; next, the motor cables are cut at a specific length, and the plate and terminals are riveted; then, the terminals are inserted into connector units in which a functional test is performed; finally, some defects that are found in this assembly process include cable inversion, incorrect cable length, and lack of an ID tag. In order to solve these problems, the 8Ds method is implemented to decrease the rate of defective products, and to increase customer satisfaction. Therefore, the objective of this paper is to prove the efficiency of the 8Ds method through a case study.
A case study is conducted because according to Easton [28], the critical realism approach (CRA) states that a single case study research method is enough to generalize theoretical and empirical findings, giving a new, rigorous, and coherent philosophical position that helps develop the theoretical and research process. Similarly, Tsang [29] states that CRA highlights the impacts of a case study on the theoretical process, empirical generalization, and theoretical evidence. Additionally, Tsang presents the fallibility of knowledge, which establishes that all developed theory requires being subjected to empirical evidence and evaluations; in that sense, case studies are appropriate research strategies to illustrate and analyze proposed theories. Therefore, only one case study is enough to generalize results [30]. Recently, several case studies in the manufacturing sector have been published in journals with a high impact factor. These case studies include the application of methodologies such as value-stream mapping [31,32], the plan-do-check-act (PDCA) cycle [22], lean six sigma [19], and standardized work [33], to mention few.
Specifically, this research implements the single case study approach, since the main contribution is that it allows generalizing the positive impact of the 8Ds methodology on defect reduction in the manufacturing processes with a single case study, which is supported by the CRA. Then, this paper contributes to illustrating how a single and easy technique can be applied for improving a production system in the maquiladora industry.
The rest of the paper is organized into five sections: Section 2 reports the literature review about the 8Ds method and its successful implementations from case studies; Section 3 addresses a description of materials and methods that are implemented in the present case study; Section 4 shows the findings obtained; and finally, Section 5 presents the conclusions and industrial implications regarding the 8Ds implementation.

2. Literature Review

The 8Ds is a teamwork-oriented problem-solving method that aims at identifying the root cause of a problem to solve it through a corrective-action-guided procedure [23]. From a business perspective, the 8Ds method seeks to find the main problems’ root causes, identify their possible solutions, and assess their impacts on companies [34]. Originally, the 8Ds method was developed at Ford Motor Company; it was introduced in 1987 to a manual entitled “Team Oriented Problem Solving” (TOPS) [35]. Since then, the method has been applied mainly in automotive industries to solve product and service-related problems, such as defects, customer complaints, manufacturing process deviations, returned purchases, poor machinery maintenance, and supplier qualification issues, among others [34,35].
According to Chelsom et al. [36] and Vargas [37], the 8Ds method can be applied to any type of problem or activity in order to provide assistance to achieving effective communication among departments that share a common objective. However, the 8Ds method is popularly applied to solve quality problems; it is typically required when at least one of the following events are presented [38]:
  • The company receives customer complaints.
  • Safety or regulatory issues have been discovered.
  • Internal rejects, waste, scrap, underperformance, or test failures occur at abnormal levels.
  • Warranty concerns indicate greater-than-expected failure rates.
The literature review mentions several successful case studies wherein the 8Ds method was applied. For instance, Mitreva et al. [25] implemented the 8Ds method to solve the problem of an LED diode that did not perform its function in a circuit board; they reported a decrease of operational defects after its implementation, and an increase the efficiency of software packages in the application of statistical methods and techniques. In the same way, Bremmer [39] applied the 8Ds method and other techniques to analyze Scania’s global supply chain; how the company could guarantee the quality of products was demonstrated. As a result, this author found the problem and its root causes.
Similarly, Pacheco-Pacheco [40] sought to optimize delivery times of alteration clothing (Alto de basta and Alto de camisa) products in a tailor shop by implementing the 8Ds method. It was found that production times decreased by 2.46% in two mix products. In both products, delivery delay times decreased by 33.33%. Finally, Zasadzień [41] employed the 8Ds method to reduce machine downtimes that were caused by bottlenecks. In summary, Table 1 presents the successful case studies wherein the 8Ds method was implemented.
Although the 8Ds method is flexible—it can be adapted to different situations—and has several successful applications, it has some disadvantages, such as [50]:
  • It can be time consuming and difficult to develop.
  • Employees that are involved in its implementation should receive appropriate training about it.
  • Constant communication among the participants and the application of a continuous improvement program are required.

3. Materials and Methods

In order to conduct the present case study, the following materials were used: Microsoft Excel® spreadsheets [51], AutoCAD® [52], Visual Basic® [53] software programs, a PDCA form, and a visual aid form. As for the methodology, the 8Ds method was applied and its steps are presented in Figure 2.
Some similar case studies to this research have used the Kano model as a tool to classify and prioritize customer needs based on how they affect customer satisfaction [54]. However, according to experts, the Kano model has several deficiencies, which discouraged its use in this case study. For instance, it is known that, to conveniently quantify the Kano model, customer satisfaction or dissatisfaction levels toward a product or service must be measured by using the customer satisfaction scale (see Table 2) of positive or negative comments with product or service attributes [55,56]. However, some experts claim that the satisfaction scale is asymmetric, since a positive answer is stronger than a negative answer, which reduces the impact of a negative assessment [54,55].
Another inconvenience with the Kano model is that it does not consider customer perceptions towards a product or service attributes. Particularly, it provides limited decision support for designers [57], and it is administered through a reduplicative survey, which is time-consuming. In addition, the classification obtained after analyzing the survey results is based merely on subjective assessments; therefore, it may be biased. Finally, it has been claimed that Kano’s different classification schemes may influence resource allocation and product design strategy, not only customer satisfaction, and it inherently emphasizes customer and market perspectives, but does not consider the capacity of the company [54,57].
An alternative to the Kano model is the 8Ds method, which relies on facts rather than opinions [37,58]. Specifically, the 8Ds method adopts an objective approach, whereas the Kano model is based on a subjective approach. In this case study, the 8Ds method is applied to solve the identified problem.

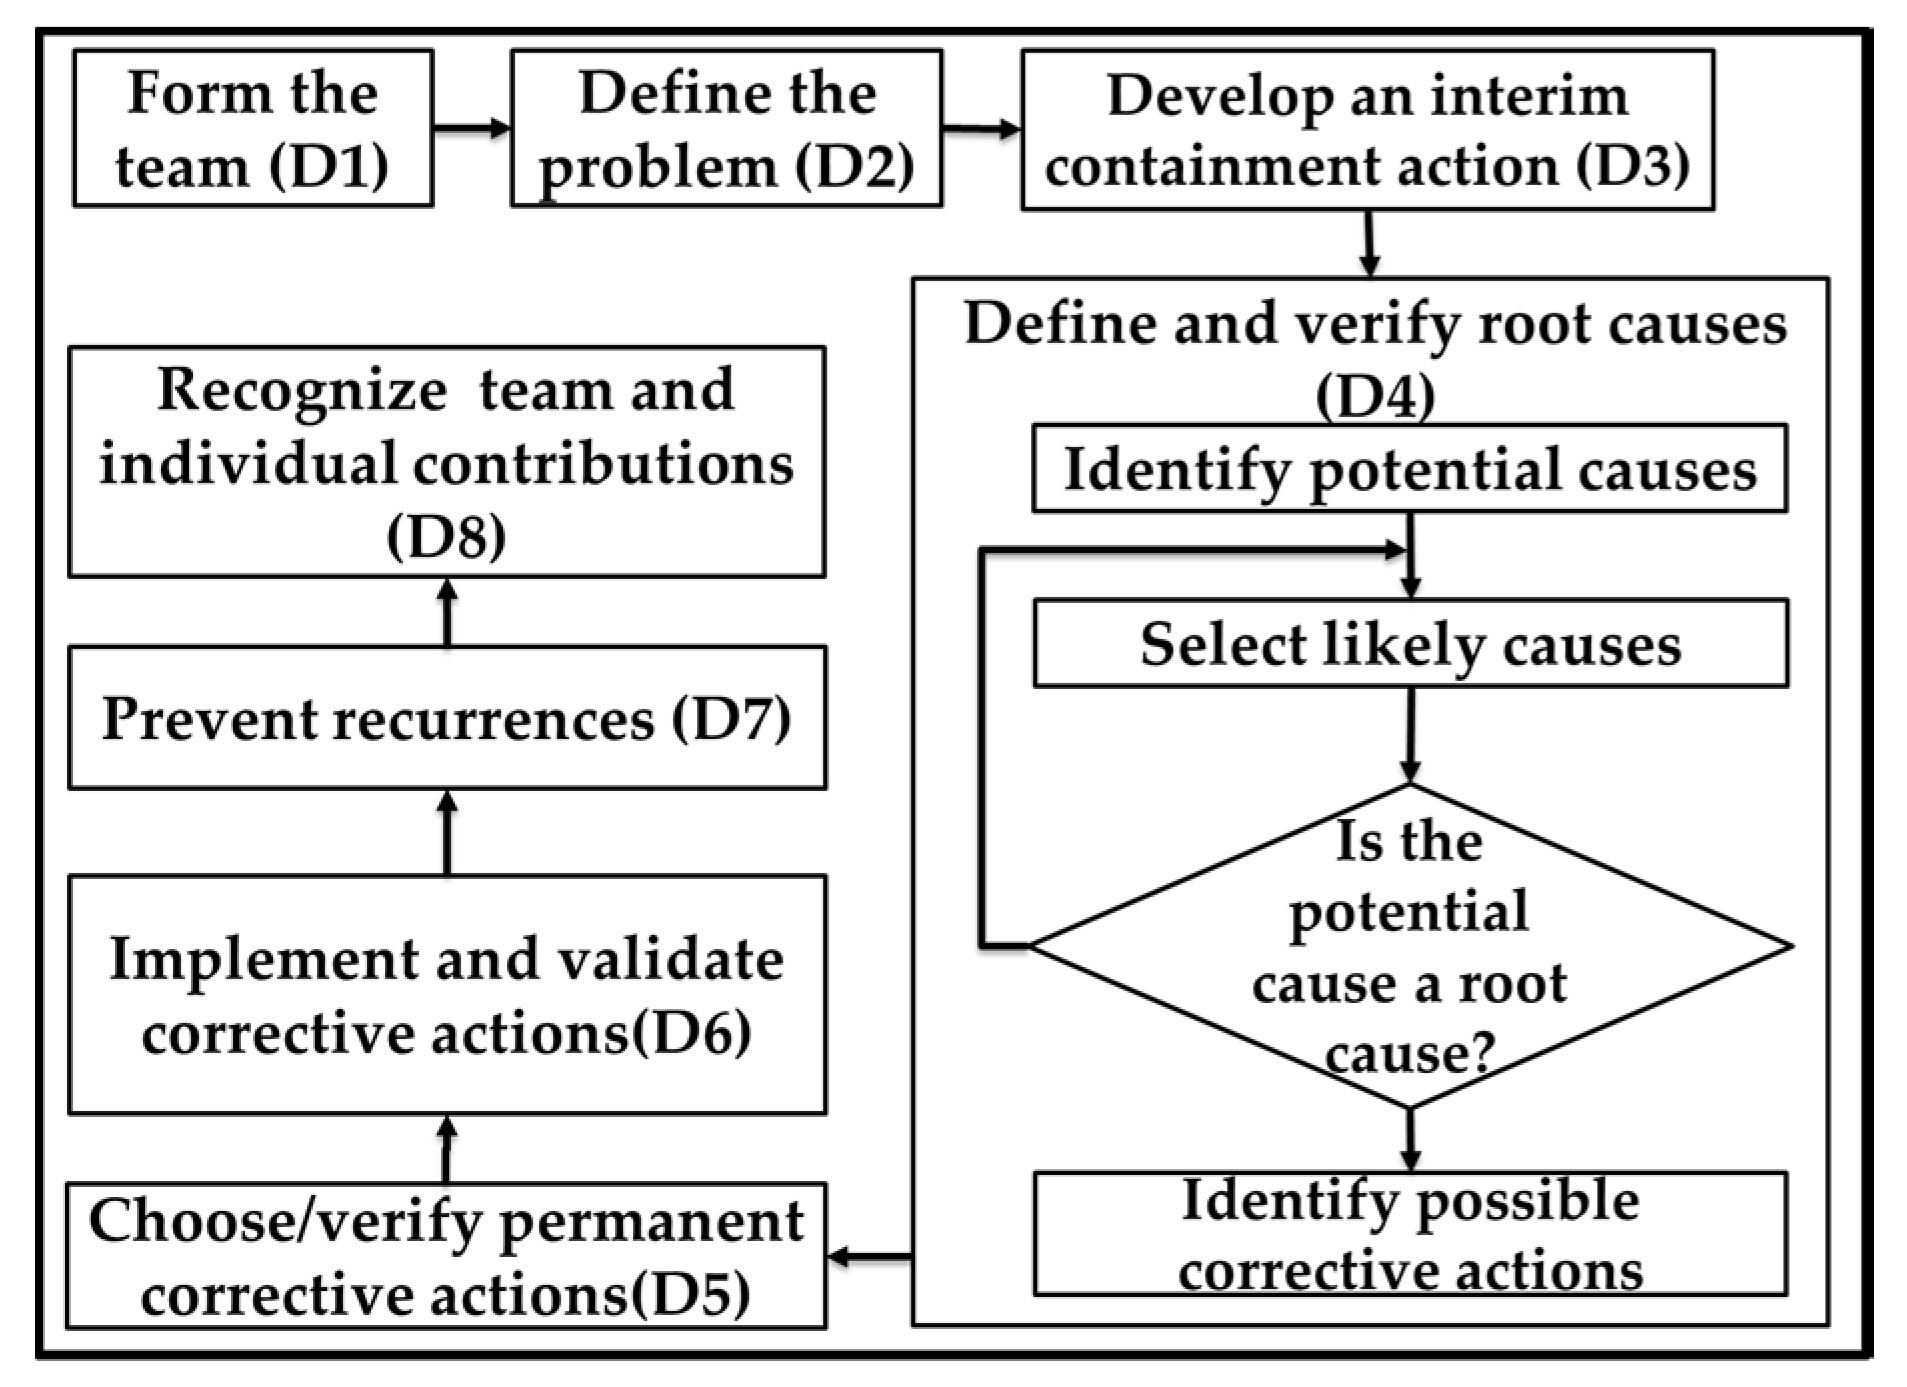
3.1. Develop a Teamwork (D1)

Proper planning will always guarantee a better start; therefore, the following criteria should be applied before integrating 8Ds teamwork [38]:
  • Collect information regarding symptoms, such as the ID number and description of the claimed part, failure date, customer and supplier numbers, and a short, descriptive analysis of the problem [39,59,60].
  • Use a symptoms checklist to ask the correct questions.
  • Identify the need for an emergency response action (ERA), which protects customers from further exposure to undesired symptoms.
Moreover, the 8Ds method involves organizing a cross functional teamwork that must have enough knowledge about the product/process to successfully deal with customer complaints or quality deviations in the problem-solving phase [23,35]. Additionally, the teamwork must be interdisciplinary—integrated by operators from several departments (i.e., manufacturing, engineering, and marketing) and different knowledge fields to create a solid task force [61], because the experience of the members is a key element to implementing any problem-solving method [62].
In addition, a teamwork leader is assigned, who ensures that all activities are being carried out and the 8Ds report is regularly updated. Additionally, there should be a champion; this is a person in a management position with enough authority to assist and lead the teamwork when it encounters difficulties or in case additional resources are required [59]. Similarly, any permanent solution may require subsequent teamwork involvement [36]. Based on these facts, manufacturing companies employ hundreds, or even thousands of people with different types of skill sets, ideas, and values, who must be useful for the company.

3.2. Describe the Problem (D2)

This step involves explaining the problem that affects quality or does not meet customer satisfaction [23]. The problem should be explained in detail, identifying in quantifiable terms the who, what, when, where, why, how, and how many problems are involved in the problem (i.e., 5W+2H) [35].

3.3. Develop an Interim Containment Action (D3)

Since 8Ds teamwork members have enough knowledge on the product/process, possible corrective actions must be undertaken in order to control the problem and avoid its expansion. Teamwork members should define and implement those intermediate actions that will protect the customer from the problem until permanent corrective actions are implemented. Additionally, interim containment actions should follow the ISO/TS 16949:2009 quality system and rely on the current approach to appropriately determine and verify the effectiveness of these actions. (ISO/TS 16949:2009 is a technical specification which defines the quality management system requirements for the design, development, production, relevant installation, and service of automotive-related products [23]). In addition, this step is aimed to preserve evidence and stop the outcome from being irremediably enlarged before the problem can be solved and the goal achieved. Some tasks must be monitored to ensure compliance with the requirements, such as documenting, control planning, scheduling, and assigning the specific needs according to the problem that is being solved [23].

3.4. Define and Verify Root Causes (D4)

This step refers to identification of all the applicable causes that could explain why the problem occurred, as well as the reasons why the problem was not perceived the first time it occurred. All causes shall be verified or proved, and not determined by assumptions. Experts recommend using the Ishikawa’s five-whys diagrams to map causes against the identified effect [35]. The 5W2H method is used to make diagrams about customer requirements, review the problem-solving process, and analyze the problem [23].

3.5. Develop Permanent Corrective Actions (D5)

Depending on the different causes of the problem, several suitable strategies ought to be proposed. Therefore, either results must be reviewed and the required adjustments have to be made, or some permanent corrective actions must be taken [23]. Finally, a quantitative method ought to be performed through pre-production programs to confirm that the selected corrections will solve the problem [35].

3.6. Implement and Validate Corrective Actions (D6)

In this step, the best corrective actions are defined and implemented to ensure that the target is reached and the problem is solved. In addition, it is necessary to control or monitor any potential effects [23,34,35].

3.7. Prevent Recurrences (D7)

In this step, management systems, operation systems, practices, and procedures should be modified and controlled to prevent their recurrence or any other similar problems, avoiding customer complaints [35].

3.8. Recognize and Congratulate Teamwork as Well as Individual Contributions (D8)

Finally, in this step, the problem is solved; therefore, the knowledge and results are shared. Additionally, the collective efforts from team members are recognized, providing positive feedback and being formally recognized. Training and education records are established and the plan-do-check-act (PDCA) cycle is followed to attain higher customer satisfaction [23,34,35].
The 8Ds method has been successfully implemented in a wide range of case studies across multiple settings. Table 1 presents a recent literature review conducted on the practical applications of the 8Ds method.

3.9. Supplementary Tools in 8D Method

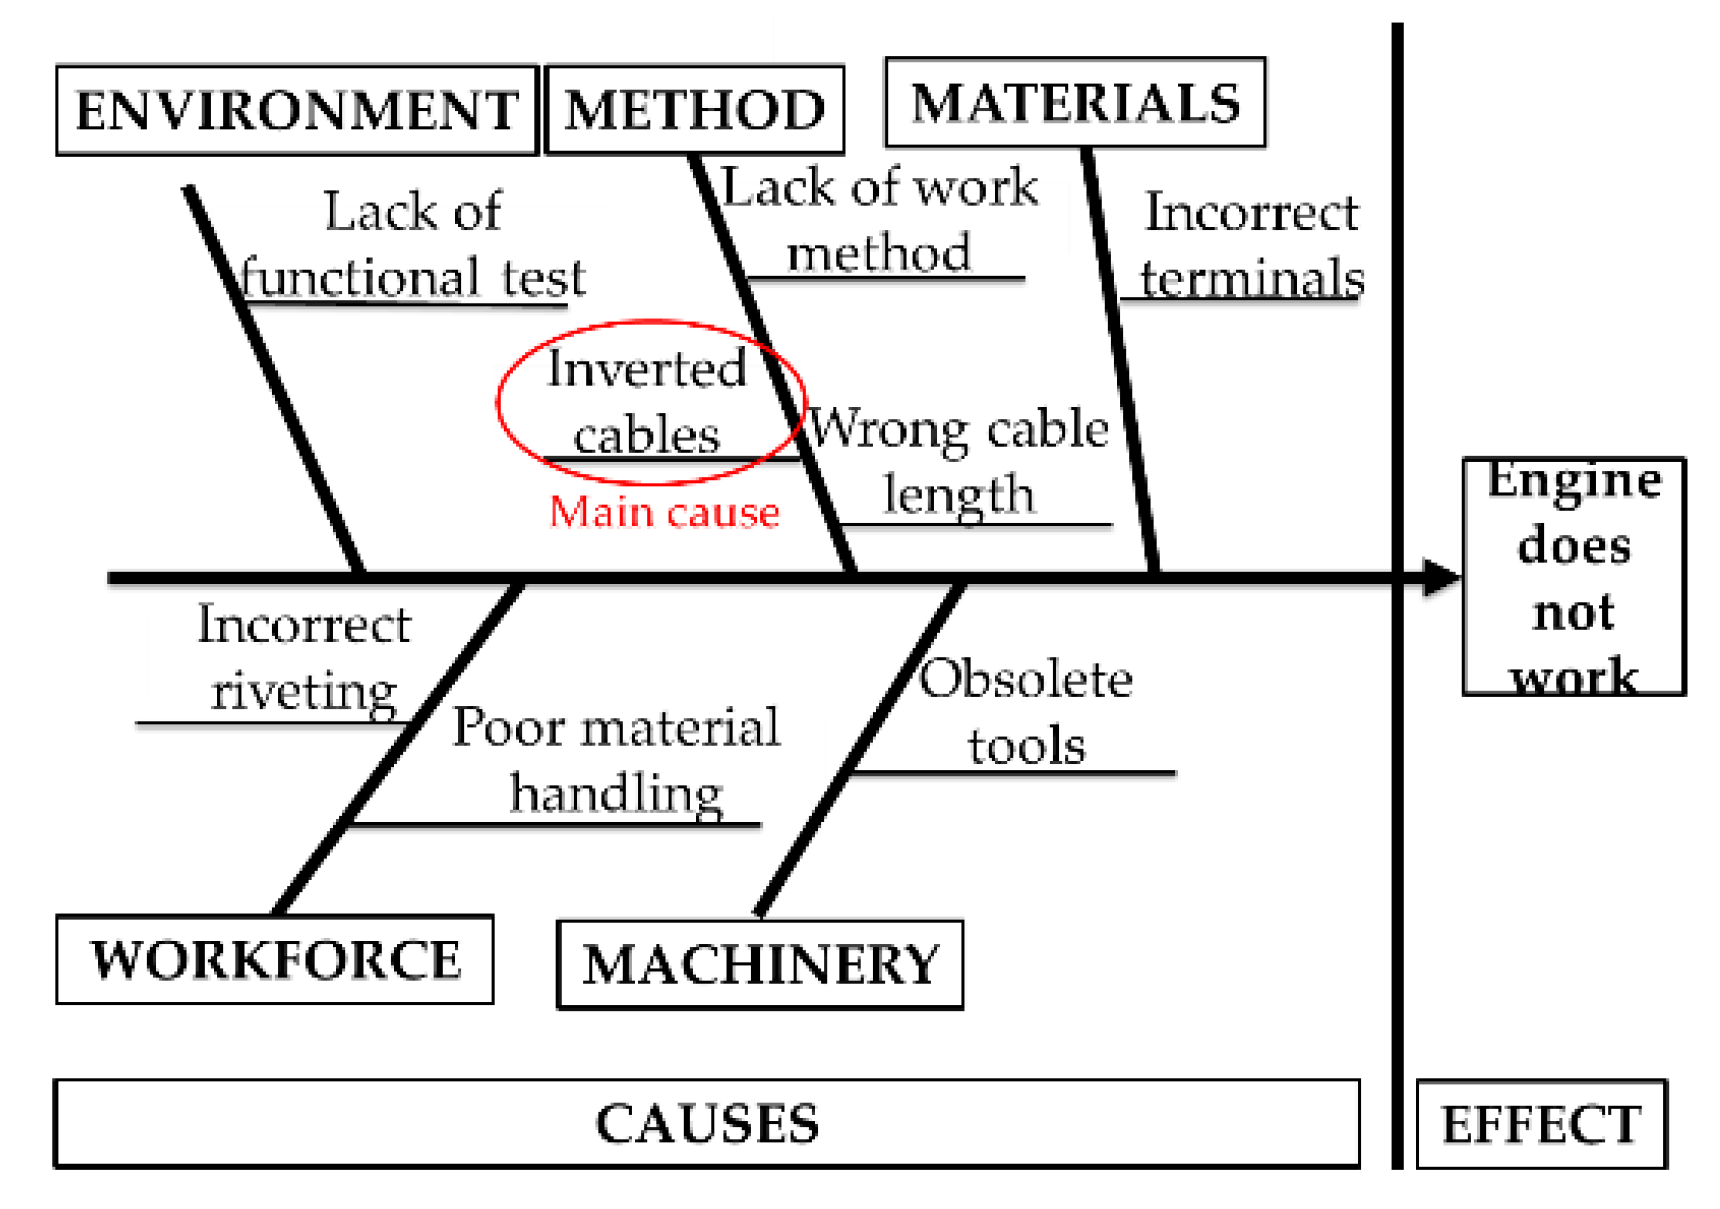
3.9.1. Ishikawa Diagram

The Ishikawa diagram is also known as a cause–effect diagram, fishbone diagram, or root cause analysis diagram, and was developed by Kaoru Ishikawa in the 1960s [63,64]. It helps to visualize a problem and categorize its root causes; it is considered as one of the seven basic quality management tools. The head of the diagram lists the problem to be studied, whereas the fish bones are arrows connected to the spine that list the causes that contribute to the problem. The arrows are interpreted as causal relationships.
According to Da Fonseca et al. [65], the diagram ramifications represent the possible sources of the problem that are related to some factors, such as materials work methods, workforce, measurements, machinery/equipment, and environment. The Ishikawa diagram offers multiple advantages, among which the following can be highlighted [66]. It:
  • Classifies all causes that are related to a problem.
  • Shortens a relatively large problem.
  • Encourages the participation of all the teamwork members in the analysis and creation of project management dynamics.
  • Increases the role of teamwork in the problem-solving process.
  • Identifies the areas that require more in-depth research when some information is missing.
  • Provides elements to develop an adequate solution to a problem.
  • Offers a concise view of cause-and-effect relationships.
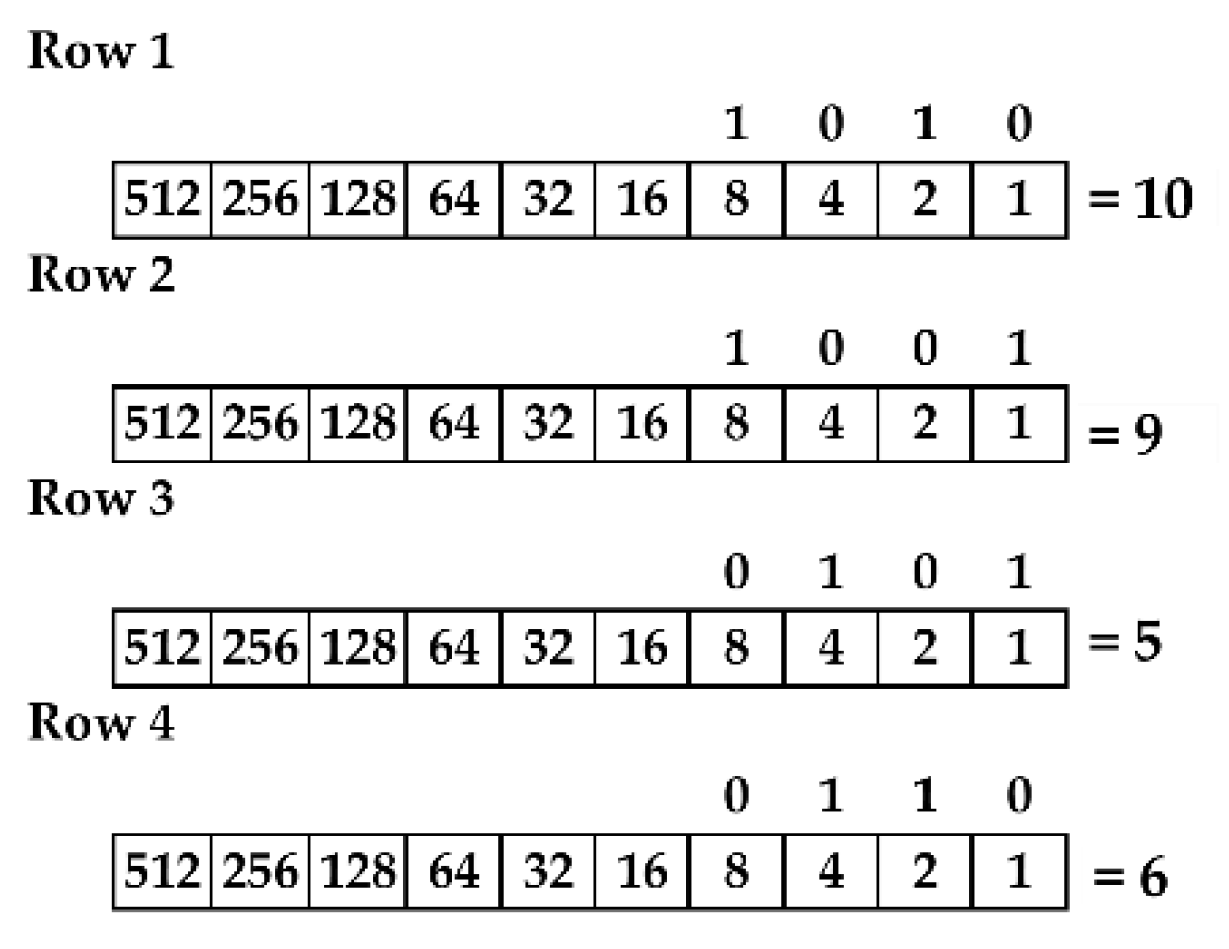
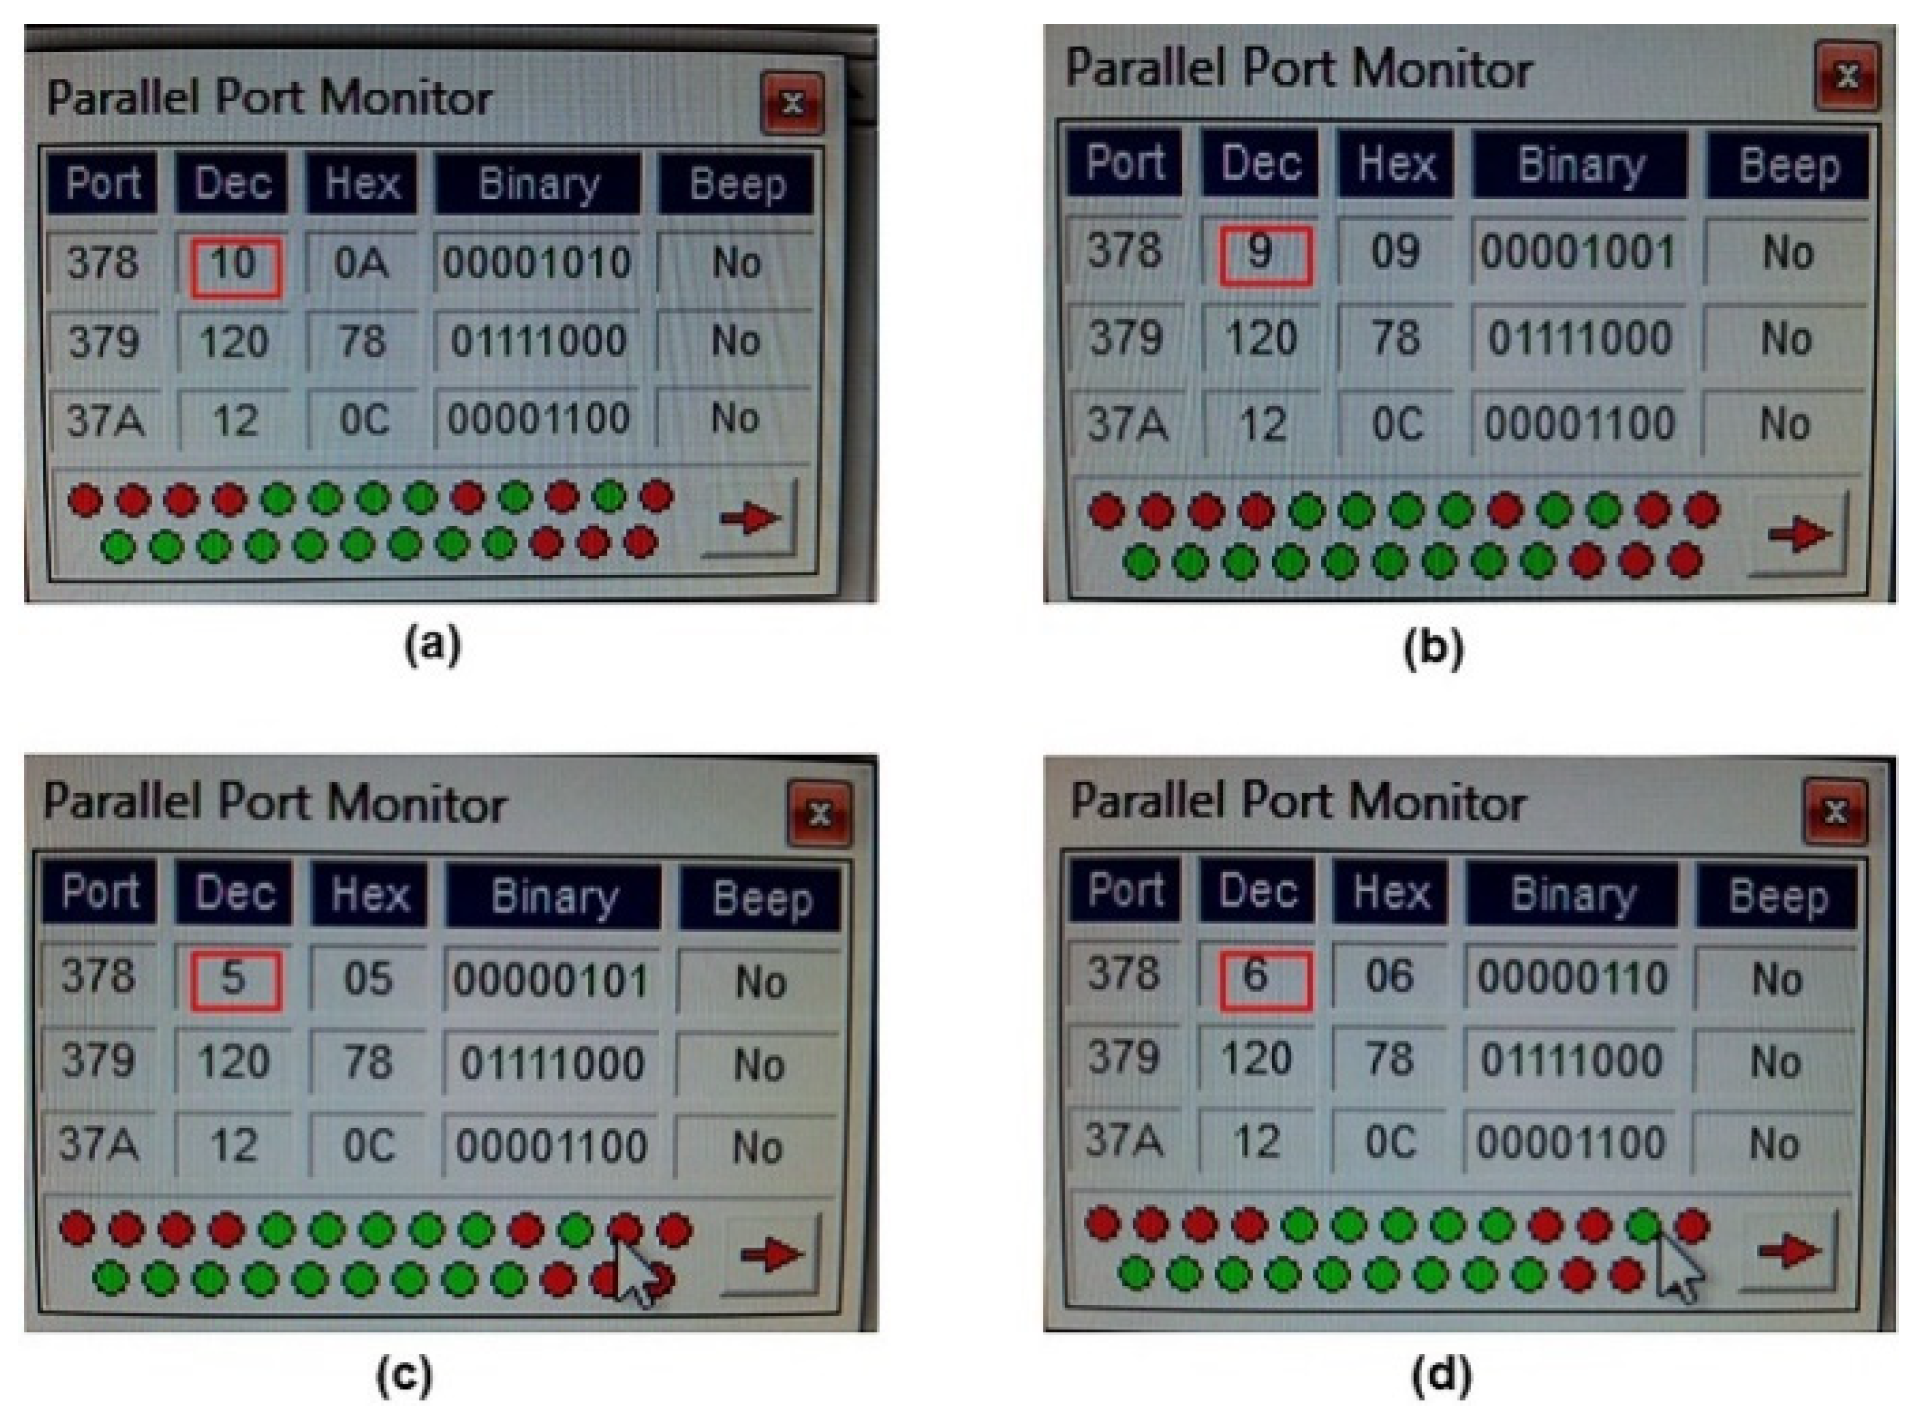
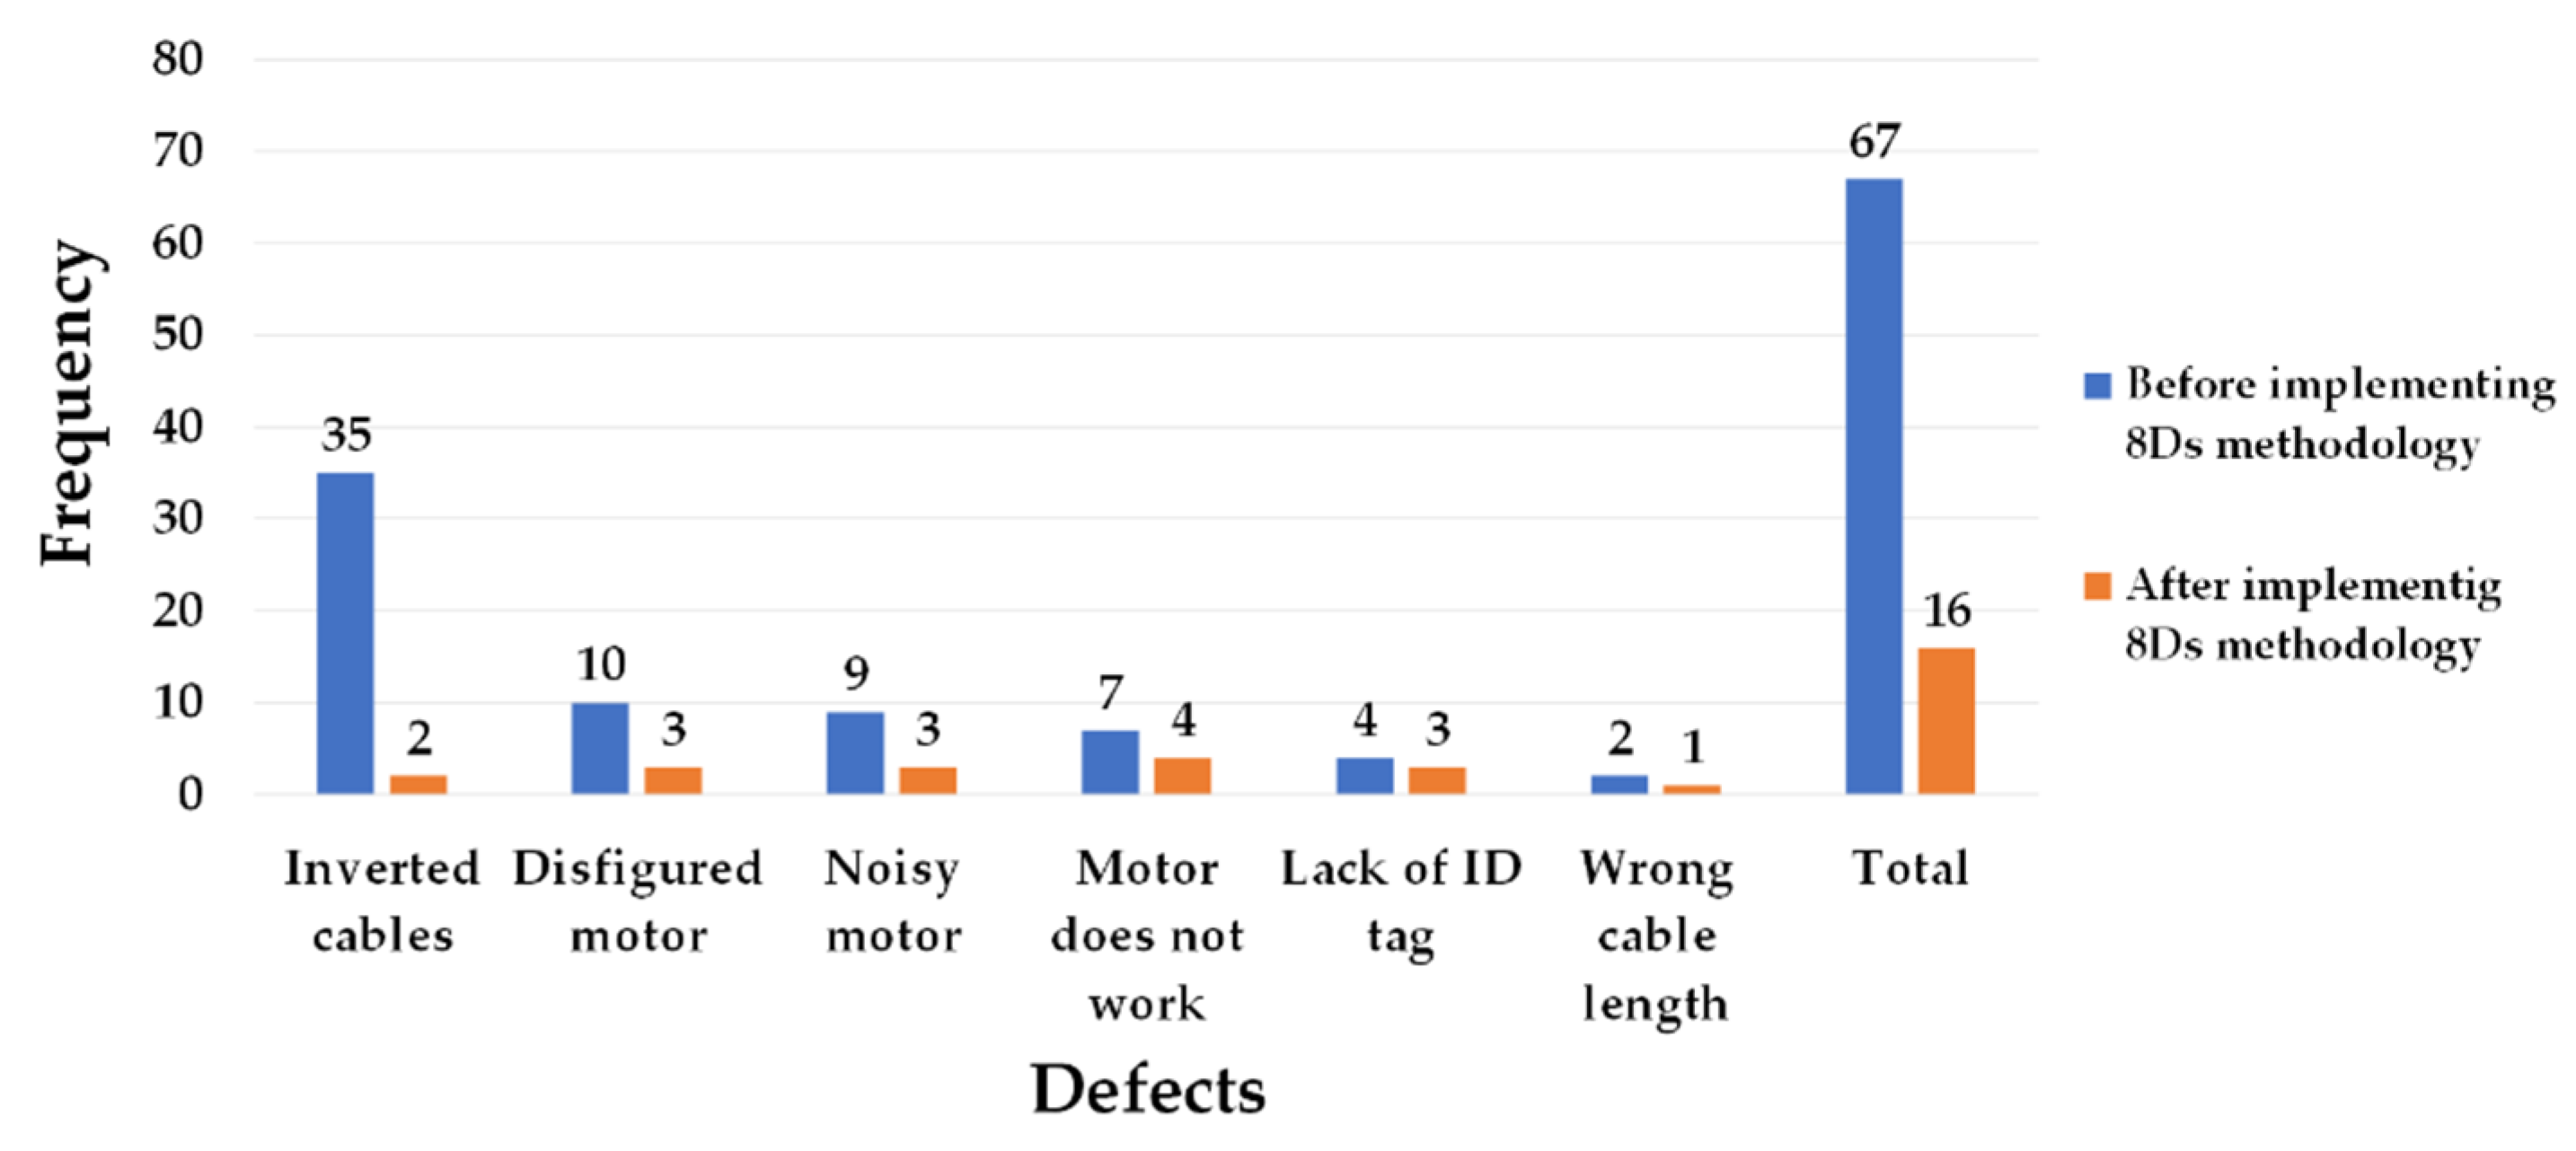
In this case study, an Ishikawa diagram is designed to find the root causes of the problem. For instance, it is supposed that there is an absenteeism problem in a manufacturing company; therefore, managers want to know the different causes of this problem that are related to the factors previously mentioned. Once the causes of the problem are identified, they are categorized by their factors, as shown in Figure 3.

3.9.2. Pareto Chart

The Pareto chart is a special type of bar graph in which each bar represents a different category or part of a problem [67]. It was developed by the Italian scientist Wilfredo Pareto, who found that 80% of the wealth was held by 20% of the people in Italy [68]. The Pareto chart illustrates the frequency distribution of descriptive data that are classified into categories. The categories are placed on the horizontal axis, whereas the frequencies are placed on the vertical axis [67,68]. The categories are arranged in a descending order, from left to right, while a line represents the frequencies in cumulative percentage. The highest bars of the chart represent the categories that contribute the most to the problem.
Furthermore, Pareto charts help identify how certain factors influence on a problem along with other factors; in other words, Pareto charts help identify the best opportunities for improvement [69]. Experts recommend using Pareto charts for two particular purposes: to decompose a problem into categories or factors and to identify the key categories that contribute the most to a specific problem [67]. For instance, continuing with the example of absenteeism in a manufacturing company, the six causes shown in Figure 3 were ordered according to their frequencies, as shown in Figure 4. Based on this order, managers should try to eliminate the first three causes (extreme temperature, sharp tools, and workload), since they represent the 80.47% of all causes of absenteeism.
In the present case study, a Pareto chart is created for a better understanding of the key causes that contribute to the problem of non-working custom cable assemblies.

4. Results

The results obtained for each stage of the 8Ds methodology are shown as follows:

4.1. Develop the Teamwork (D1)

The teamwork included a maintenance engineer, a processes engineer, an intern engineer, a production line manager, and two quality inspectors. The principal teamwork goals were to determine an adequate manufacturing process for part number A and to define the root causes of the defects. In order to achieve these goals, a task was assigned to each teamwork member, as summarized in Table 3. Note that each PDCA cycle step comprised at least one discipline, since the 8Ds method follows the logic of this cycle [50,70]. Additionally, disciplines are assigned to different teamwork members; i.e., no more than one discipline was assigned to more than one member.
Once the tasks have been assigned to the teamwork members, they have to implement an efficient communication system to keep each other informed, and as a result, guarantee the involvement of all the members in the problem-solving process. Similarly, a PDCA form was designed on Microsoft Excel® for each teamwork member to report their corresponding tasks from the PDCA cycle.

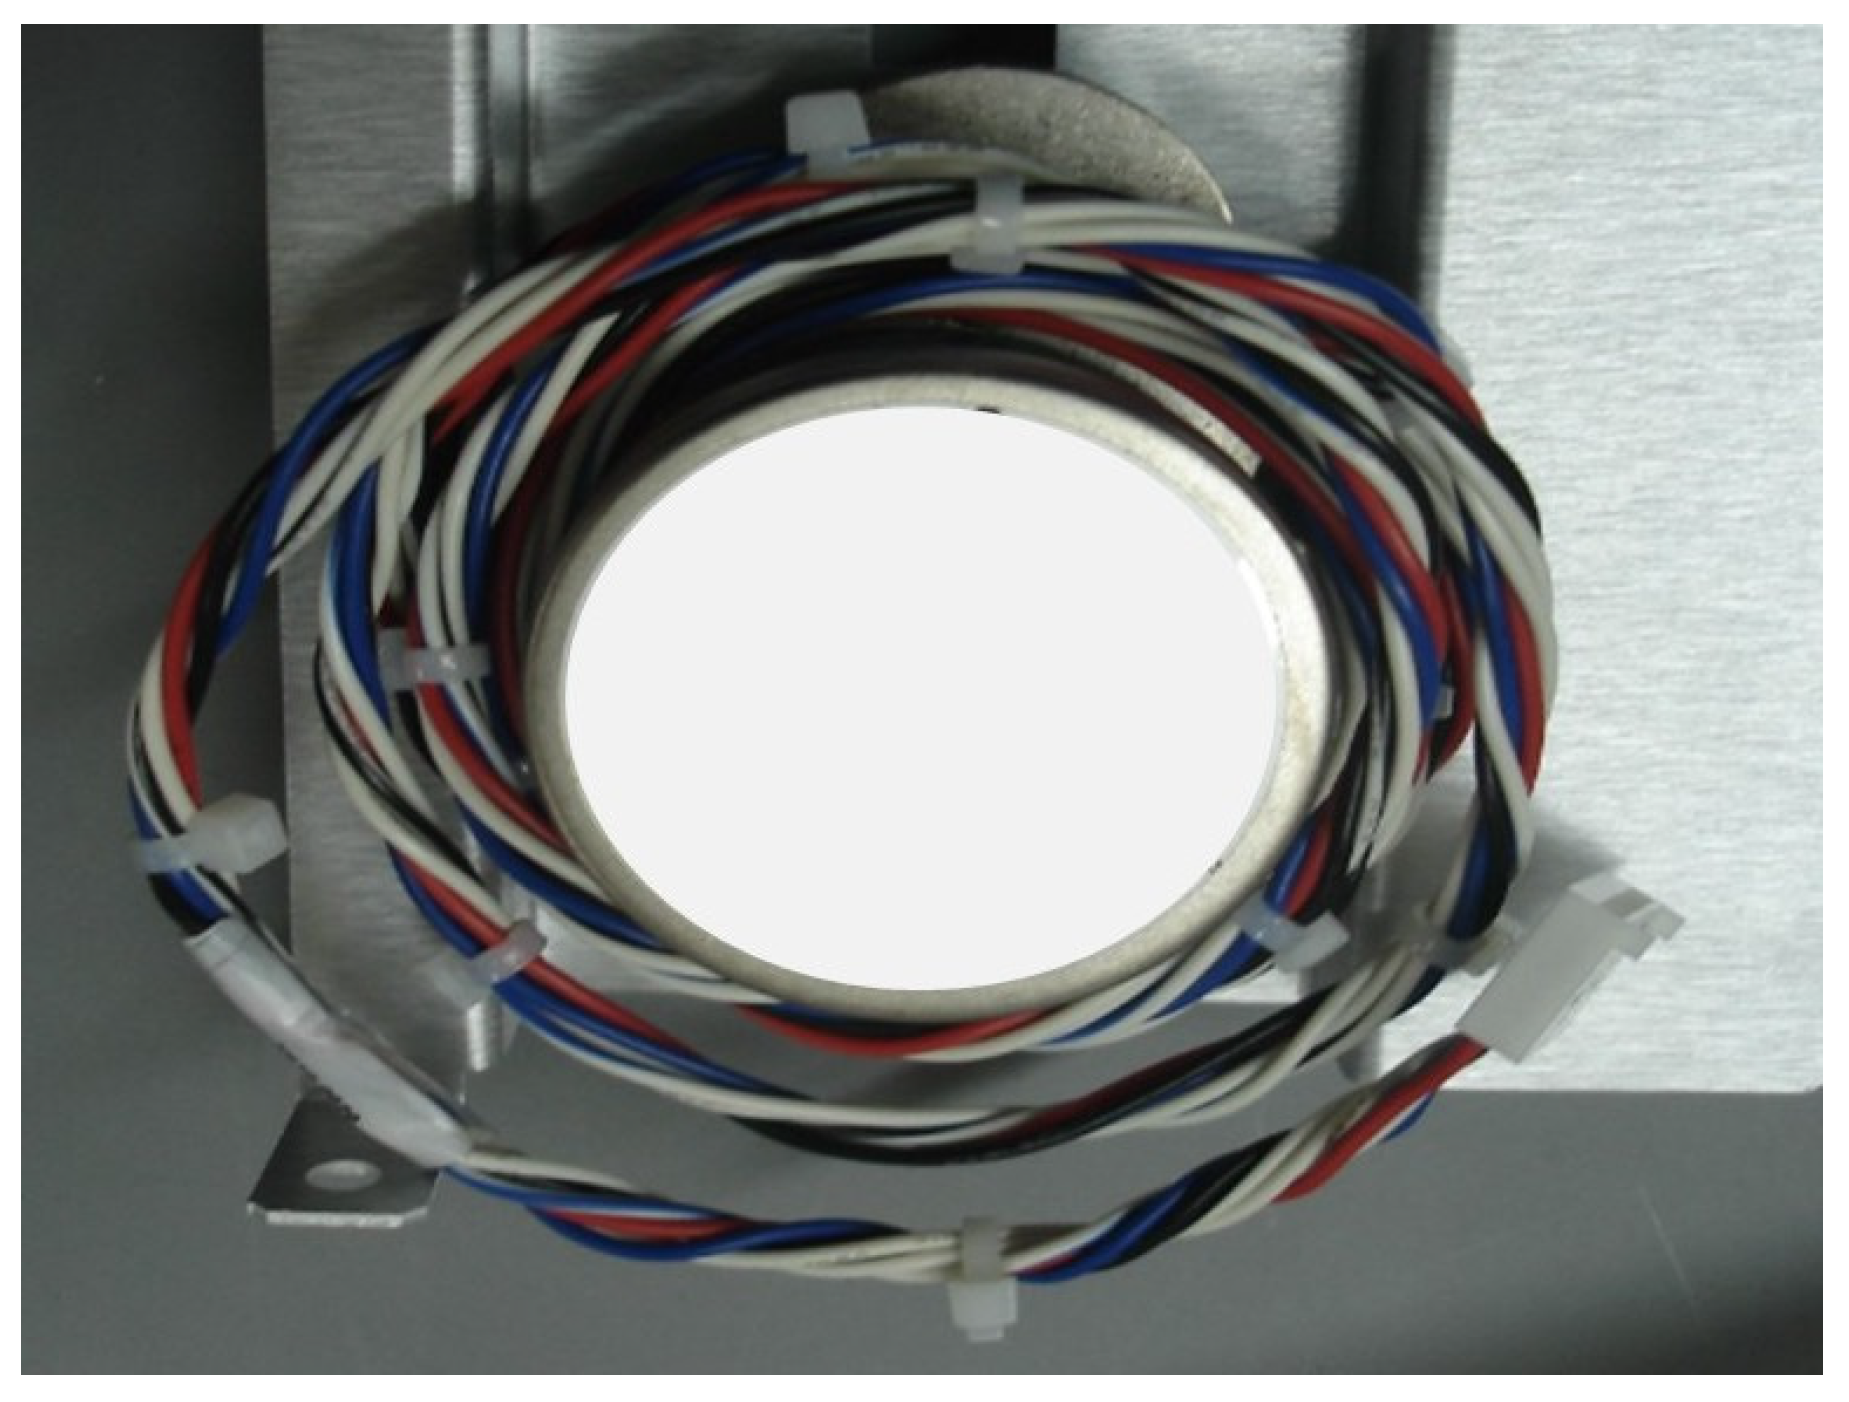
4.2. Describe the Problem (D2)

As previously mentioned, 67 cable assemblies were returned to the company by customers, who complained about either the product’s poor performance or regarding unacceptable features. The main problem was that the assembly did not work; however, that can be due to several types of defects. Table 4 lists the six different types of defects that were found in the cable assemblies.
Specifically, the data in Table 4 were used to create a Pareto diagram, as shown in Figure 5. The diagram helped define which problems or defects had to be prioritized, according to their frequencies. In this sense, the most frequent defect was inverted cables, followed by a disfigured motor. Even though both wrong cable length and the lack of an ID tag were less frequent problems, they had to be solved from the root cause as well.

4.3. Develop an Interim Containment Action (D3)

Both interim and rapid interventions were implemented to solve most of the six problems, including those concerning inverted cables, disfigured motors, lack of ID tag, and wrong cable length. A series of interim visual aids were developed to help employees assemble the components. Regarding inverted cables and disfigured motors, a document is created to report the conditions of both the stepper motor and the cables before and after being handled by the employee. Additionally, as Figure 6 presents, a provisional sign is created for helping employees to insert the assembly cables not only in the correct positions, but also in the right entry holes by using the colors of the cables as references. Similarly, the sign is intended to help employees guarantee that each cable’s final end is the one that is required by customers.
Finally, AutoCAD® was used to design a customizable 1:1 scale 2D template of a drawing provided by customers for the assemblies to verify that customers’ demands would be accomplished, as shown in Figure 7. Perhaps the greatest advantage of this electronic template is that it can be stored in a database and updated for new specifications (i.e., new cable length) if required. The updates can be performed quickly and effectively without compromising the template function. After implementing this system of solutions (i.e., the spreadsheet, the sign, and the 2D template), it was noticed that the most insignificant errors were immediately fixed; consequently, four of the six problems were solved. In order to confirm this, a quality inspector assessed the assemblies and later confirmed that the problems had been successfully solved.

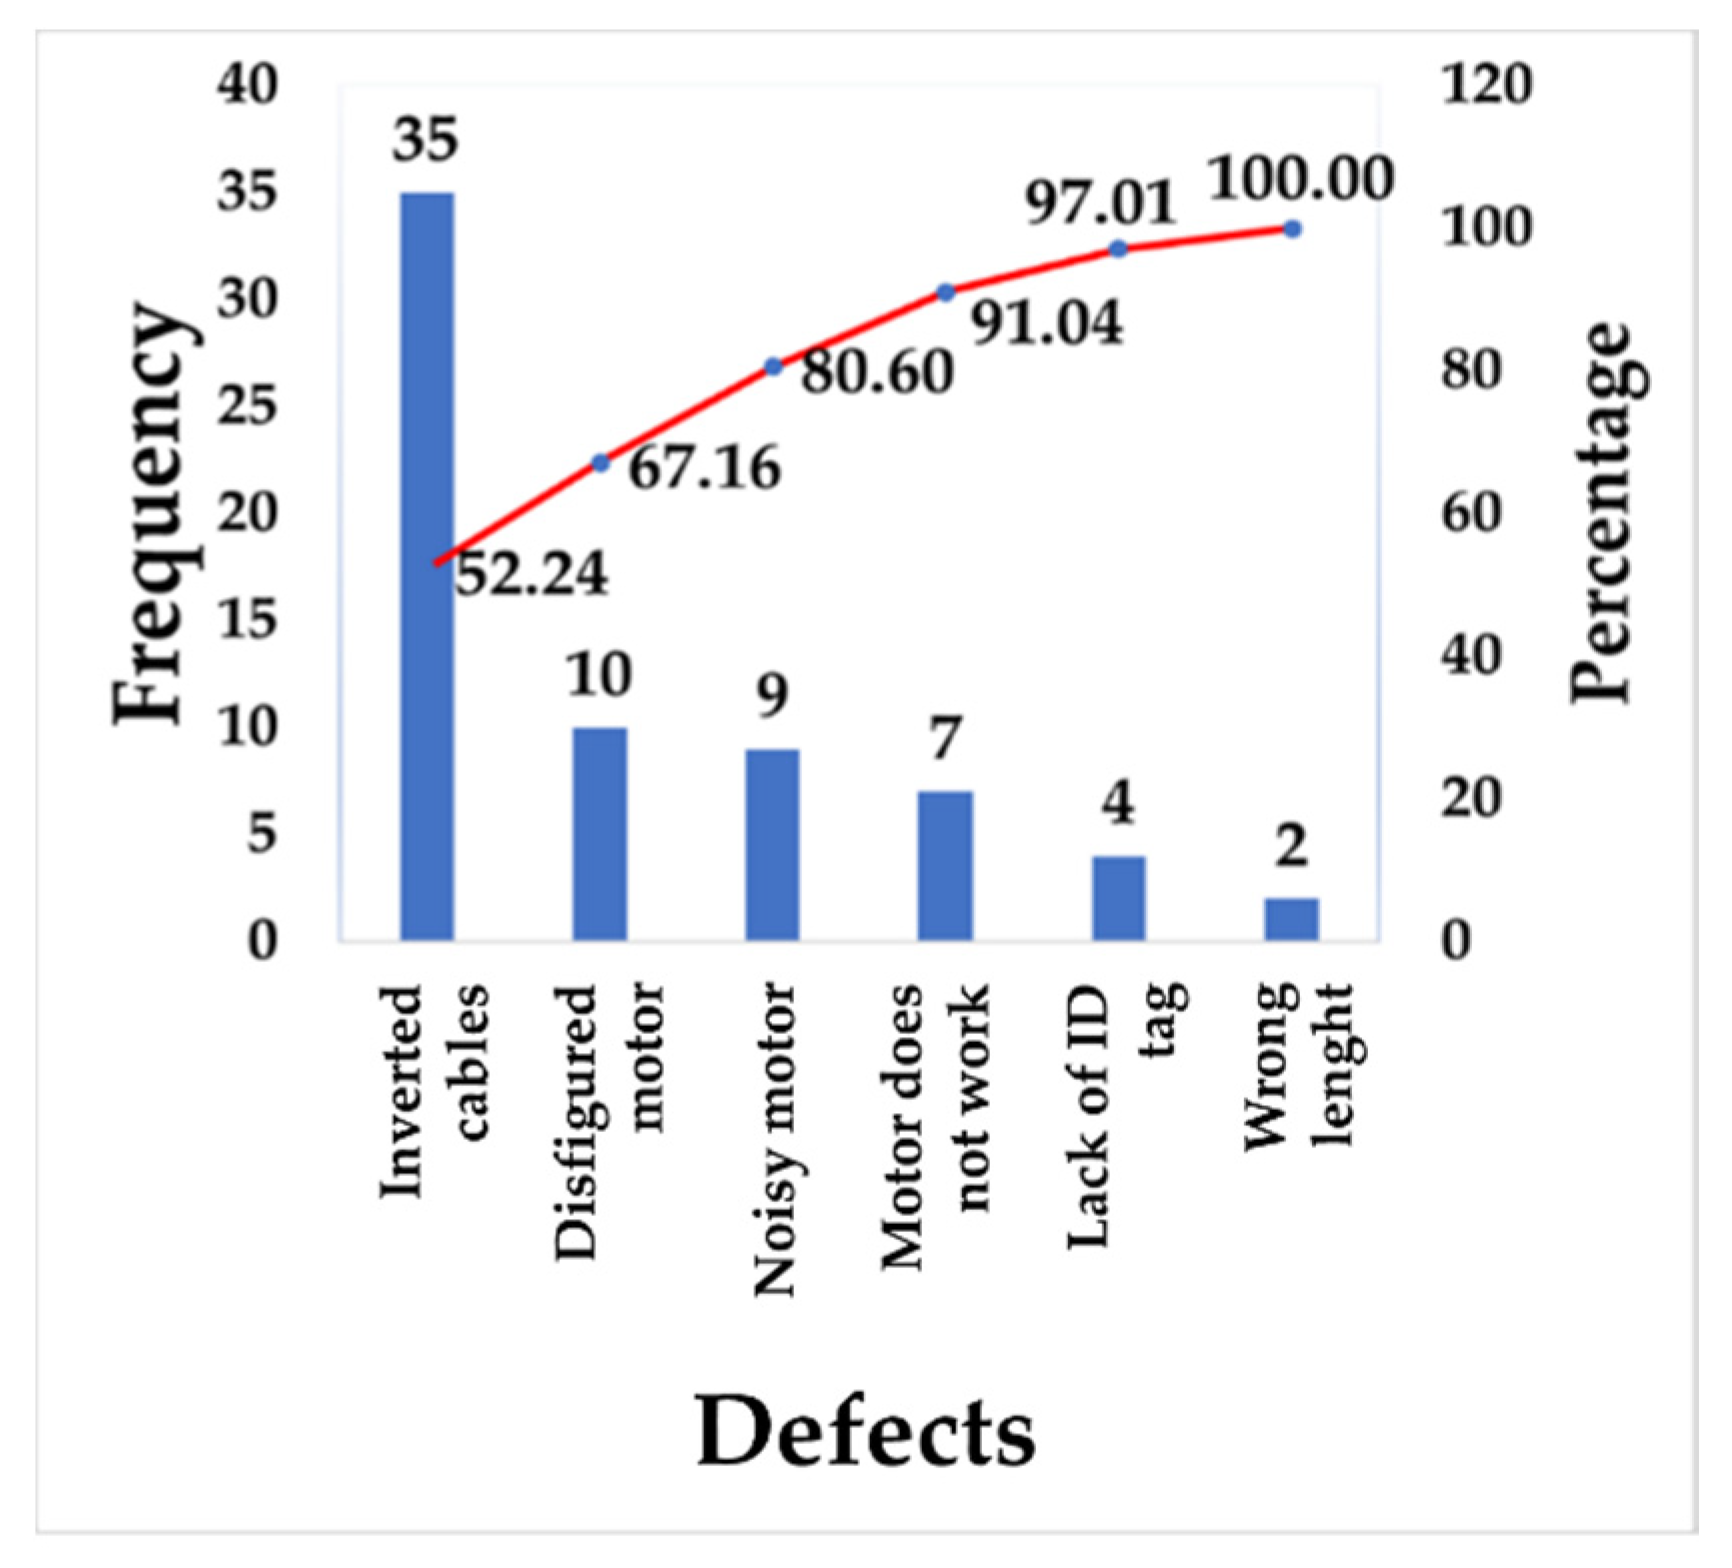
4.4. Determine and Verify Root Causes (D4)

This discipline aims to find the root causes of problems. According to Škůrková (2017), cause–effect diagrams can be used to map causes with their corresponding effects or problems. The general problem in this case study is that the assembly does not work; hence, a fishbone diagram is developed—also known as Ishikawa diagram—as depicted in Figure 8 to identify the root cause. As can be observed, several causes were identified across five aspects: materials, methods, environment, workforce, and machinery.
Regarding the environment, the reason why the returned assemblies were defective is because the company lacked a functional test to confirm that they worked. However, to perform this evaluation, the cables first had to be correctly assembled—and even then, it would have been impossible to know if the assemblies worked properly. As for the materials, it was found that the cable end terminals were incorrect, since the warehouse employees mistakenly provided the wrong types to the operators. Additionally, two more problem causes were associated with the work method. Usually, the motors supplied to the company come with already-integrated cables, and the employees only need to cut these cables as specified by the customers, and then rivet the excess. However, sometimes the cables are not always cut at the right length or inverted.
In terms of machinery, it was found that the tools of the company were obsolete and needed required to be replaced. Finally, regarding the workforce aspect, the diagram indicates that the assembly cables were not always riveted properly, yet correct riveting makes it possible for the motor to be connected to the cables, which in turn enables the functional test to be successfully performed. Similarly, it was found that the employees may poorly handle the motors, and in the case of the rejected assemblies, this could have an impact on their performance. Another possible cause of having defective assemblies is that the motors might have been damaged during their delivery.
Moreover, since most of the assemblies were returned because of inverted cables, this issue is considered as the main root cause of the problem (see Figure 3). In most of the assemblies, the black, white, and blue cables had been inverted. At first, this can be a problem related to the company work method; however, a functional test could have also solved the problem. In addition, with a functional test, the company could have prevented non-working motors and abnormal noise problems. During functional tests, motors usually display a “not working” message, in which case the position of the cables must be thoroughly reviewed. Finally, to prevent the problem from re-occurring, a program on Visual Basic® was developed to conduct motor functional tests (see Appendix A). The test uses binary values (0 and 1) that allow employees to confirm an assembly’s functionality before it is delivered to the customer. Figure 9 introduces the truth table for the motor, with values 1 = true (ON) and 0 = false (OFF).
The binary values are translated into decimal values to be used in the program; first a formula table is built, as depicted in Figure 10, wherein each row corresponds to one cable. Then, in each row, the first ten powers of 2 are displayed, i.e., 20 = 1, 21 = 2, ..., 2 9 = 512, from right to left, and it is assigned one binary value from Figure 9 corresponding to a power of two, starting at 20 = 1. Finally, each binary value in each row is multiplied by its corresponding power of 2, and the sum of the products is the resulting decimal value that is reported on the right side of each row. Once the four decimal values were obtained, they were used in the program commands to be executed, consequently beginning a new project according to customer specifications.
Once the Visual Basic® program was designed, the Parmon’s parallel port monitor application was used to verify that the decimal values were correct when the program was executed, as shown in Figure 10. The Dec column contains the decimal values corresponding to the binary values from the binary column. In all the decimal values shown in Figure 11, the motor being tested was turned on. Once the motor finished its cycle, the program indicates that the motor is turning in the opposite direction regarding the position it had started in. The goal of this test is to confirm that the motor works properly without abnormal noise.

4.5. Develop Permanent Corrective Actions (D5)

In this discipline, the following corrective actions are implemented:
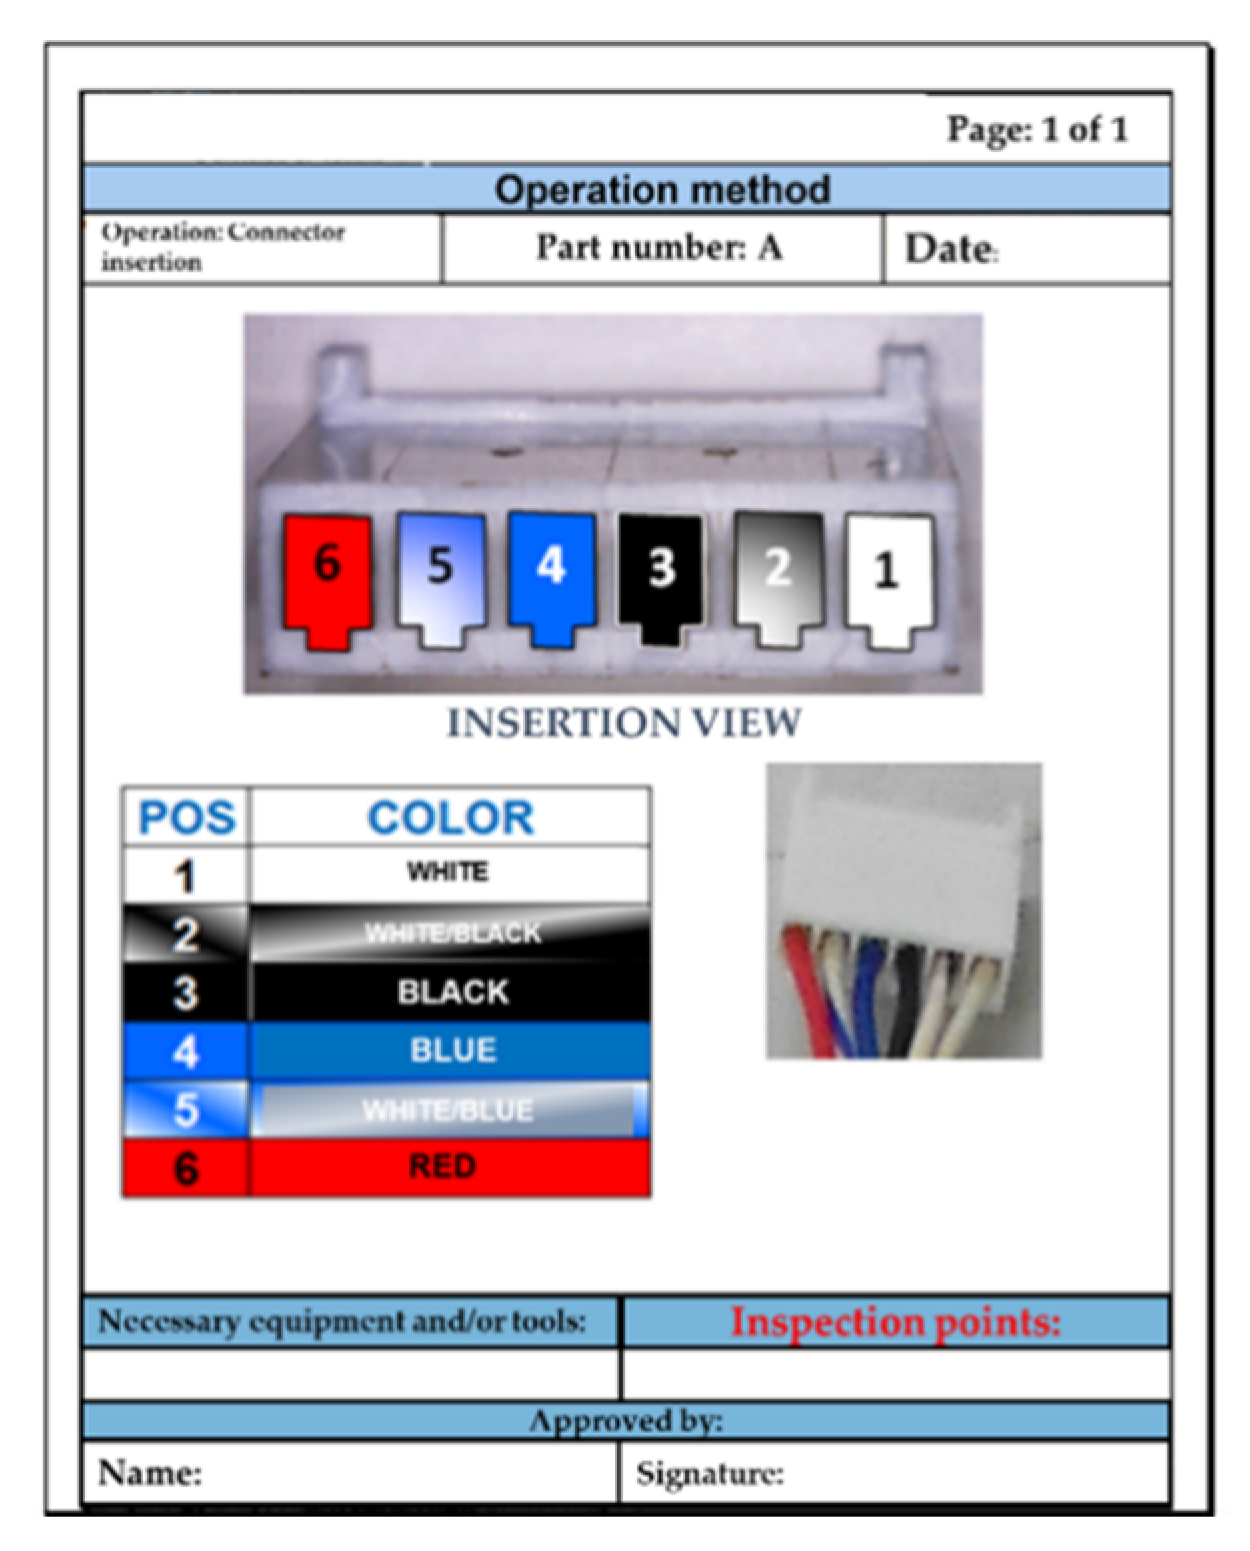
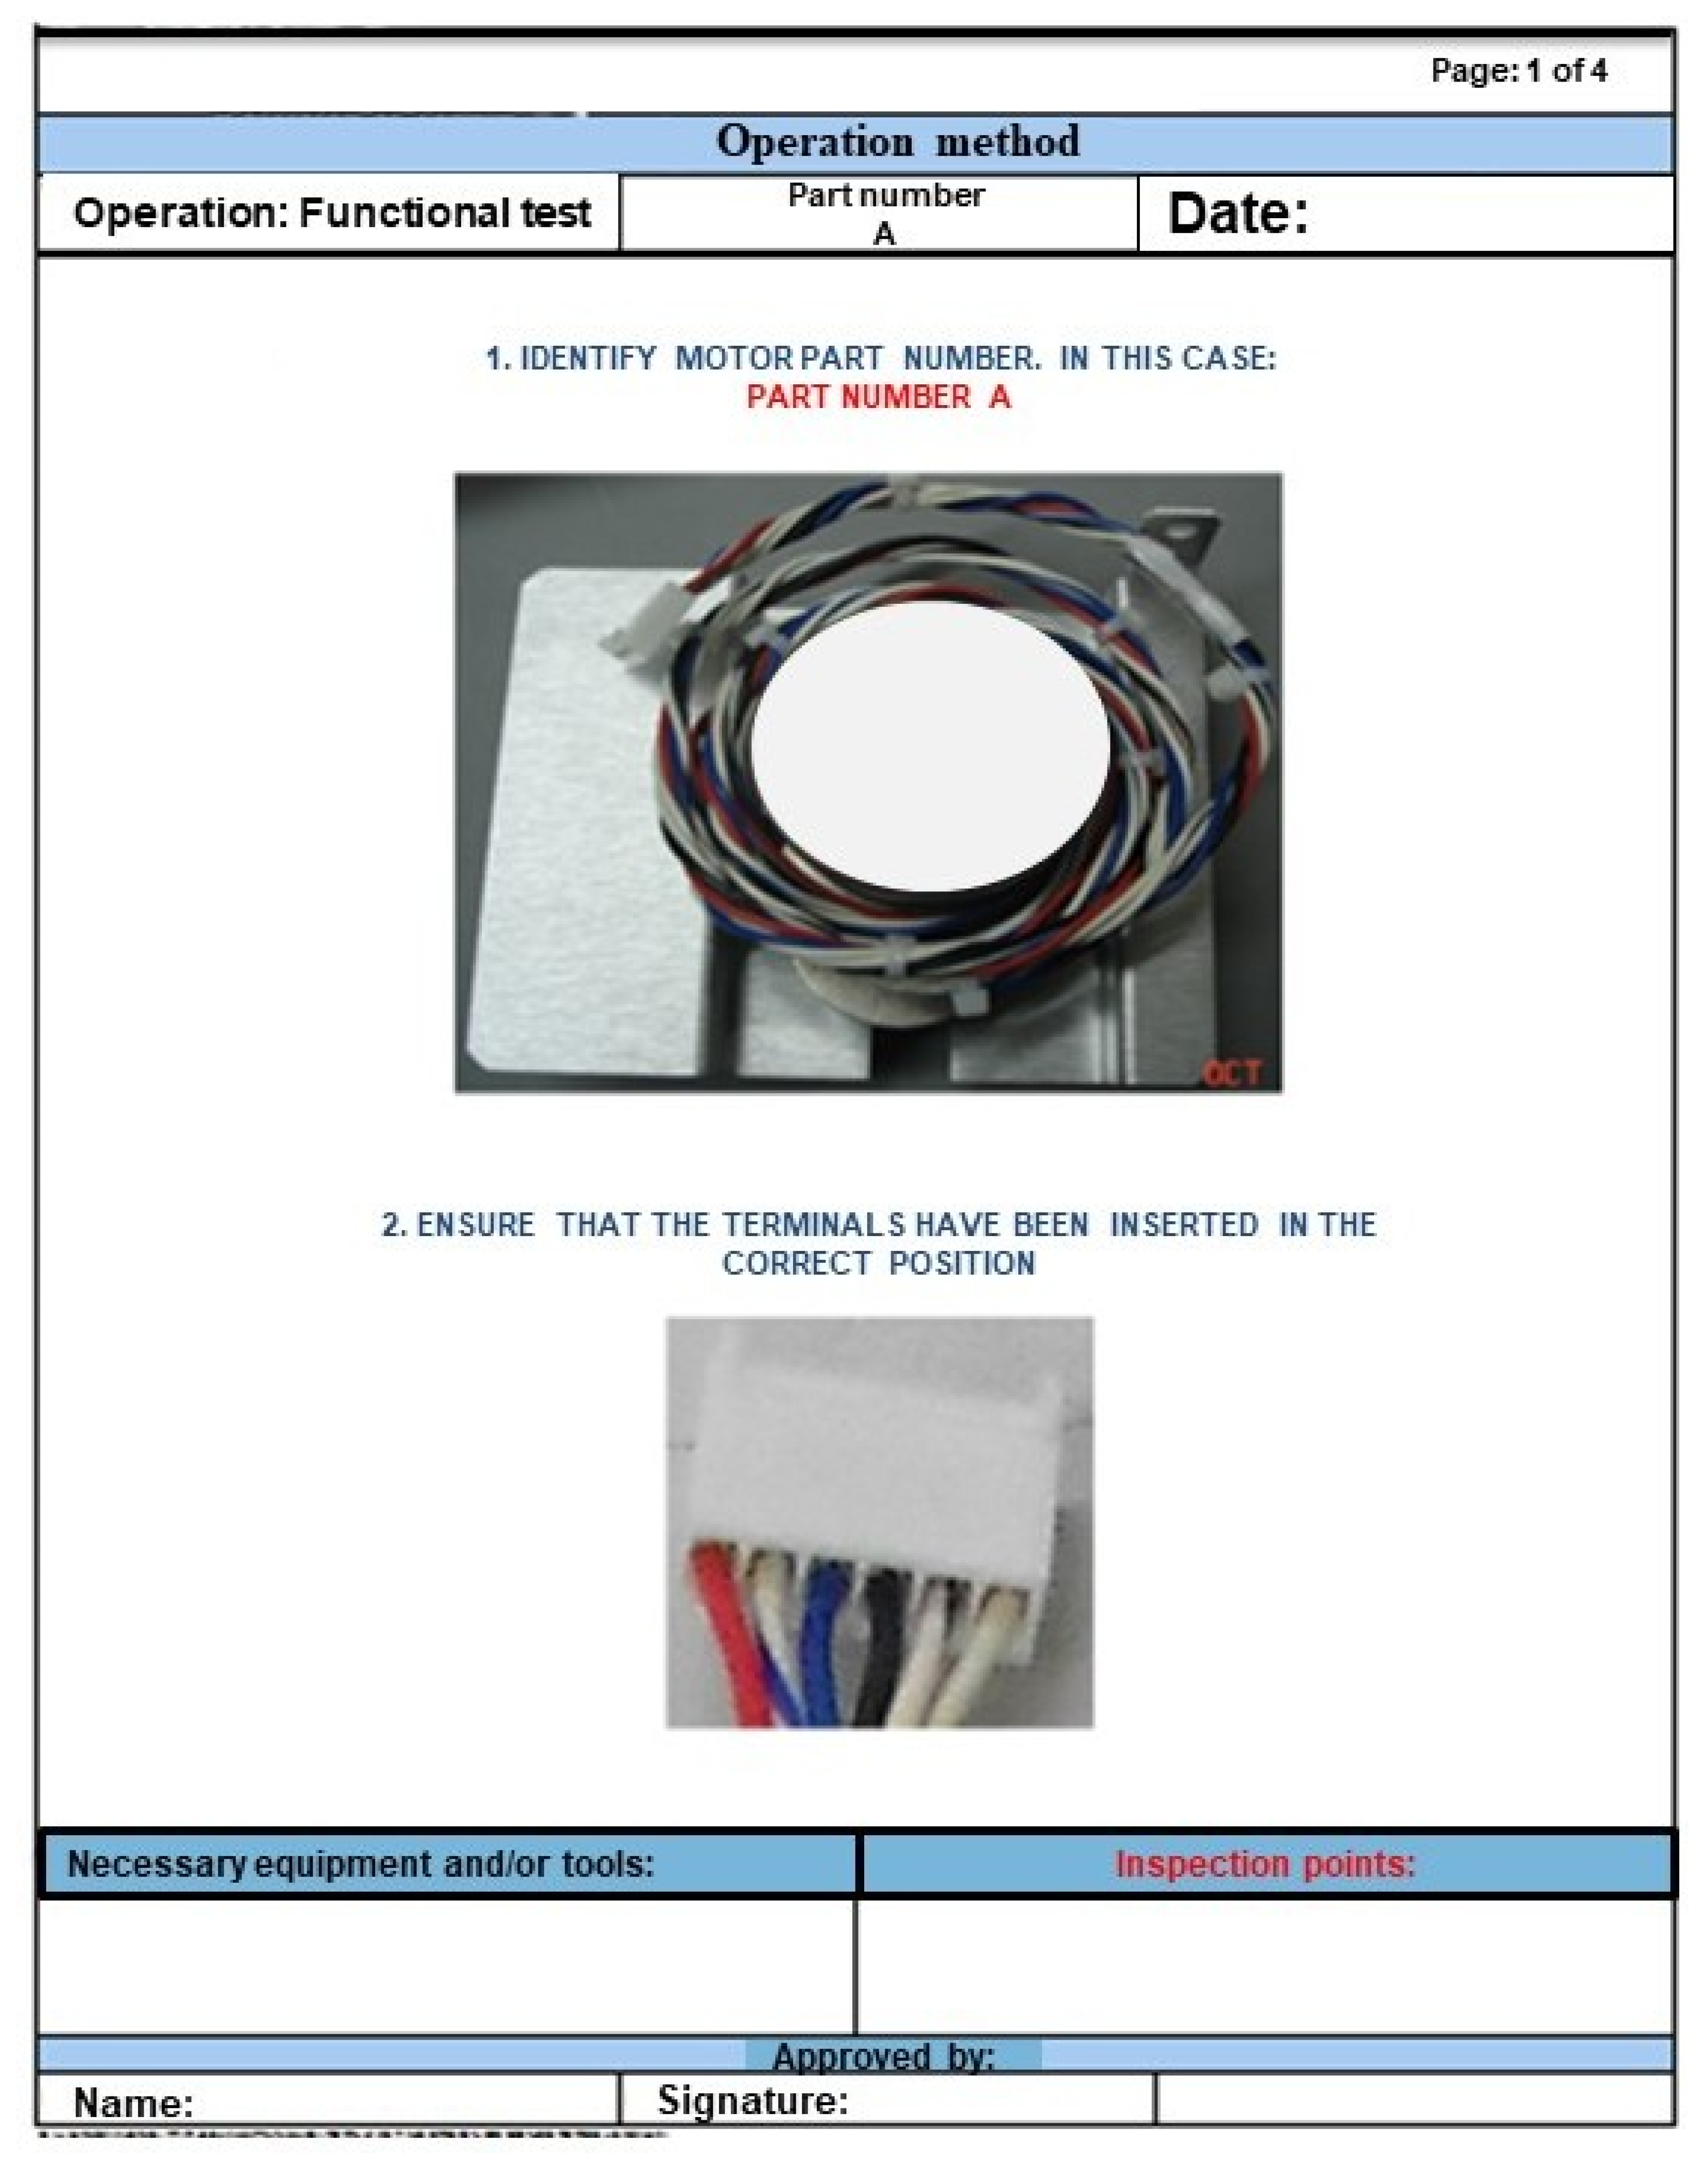
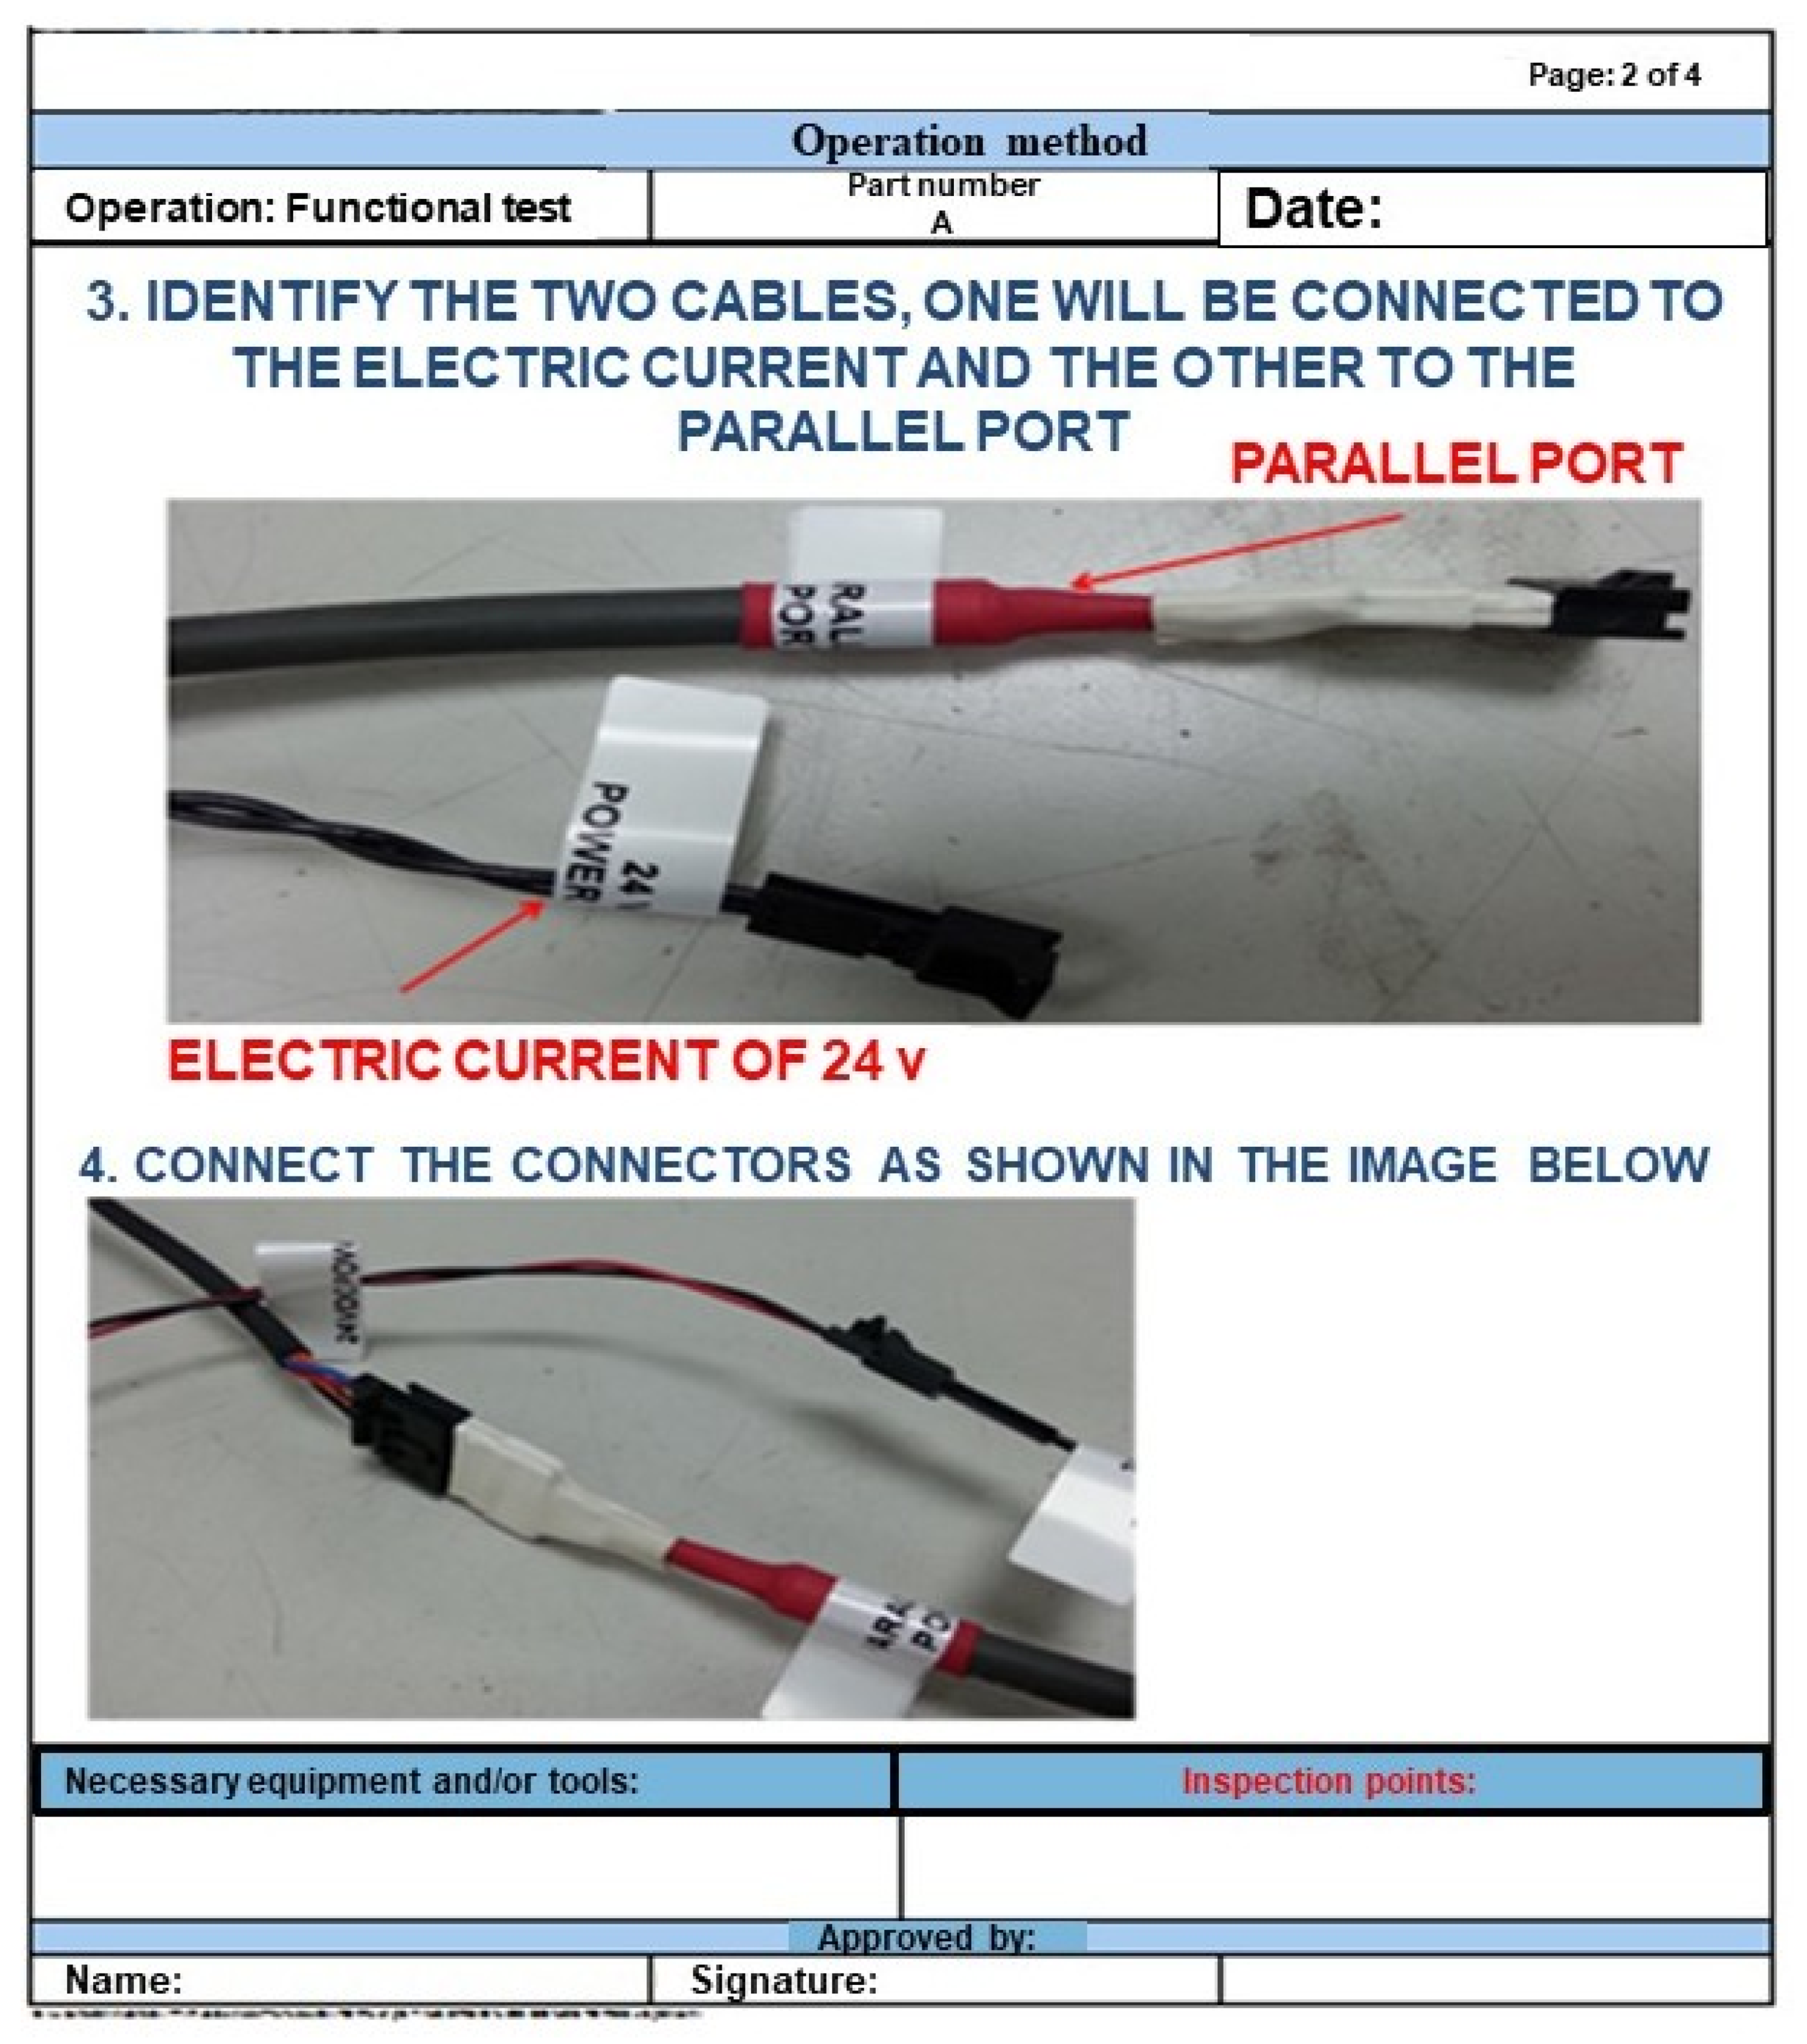
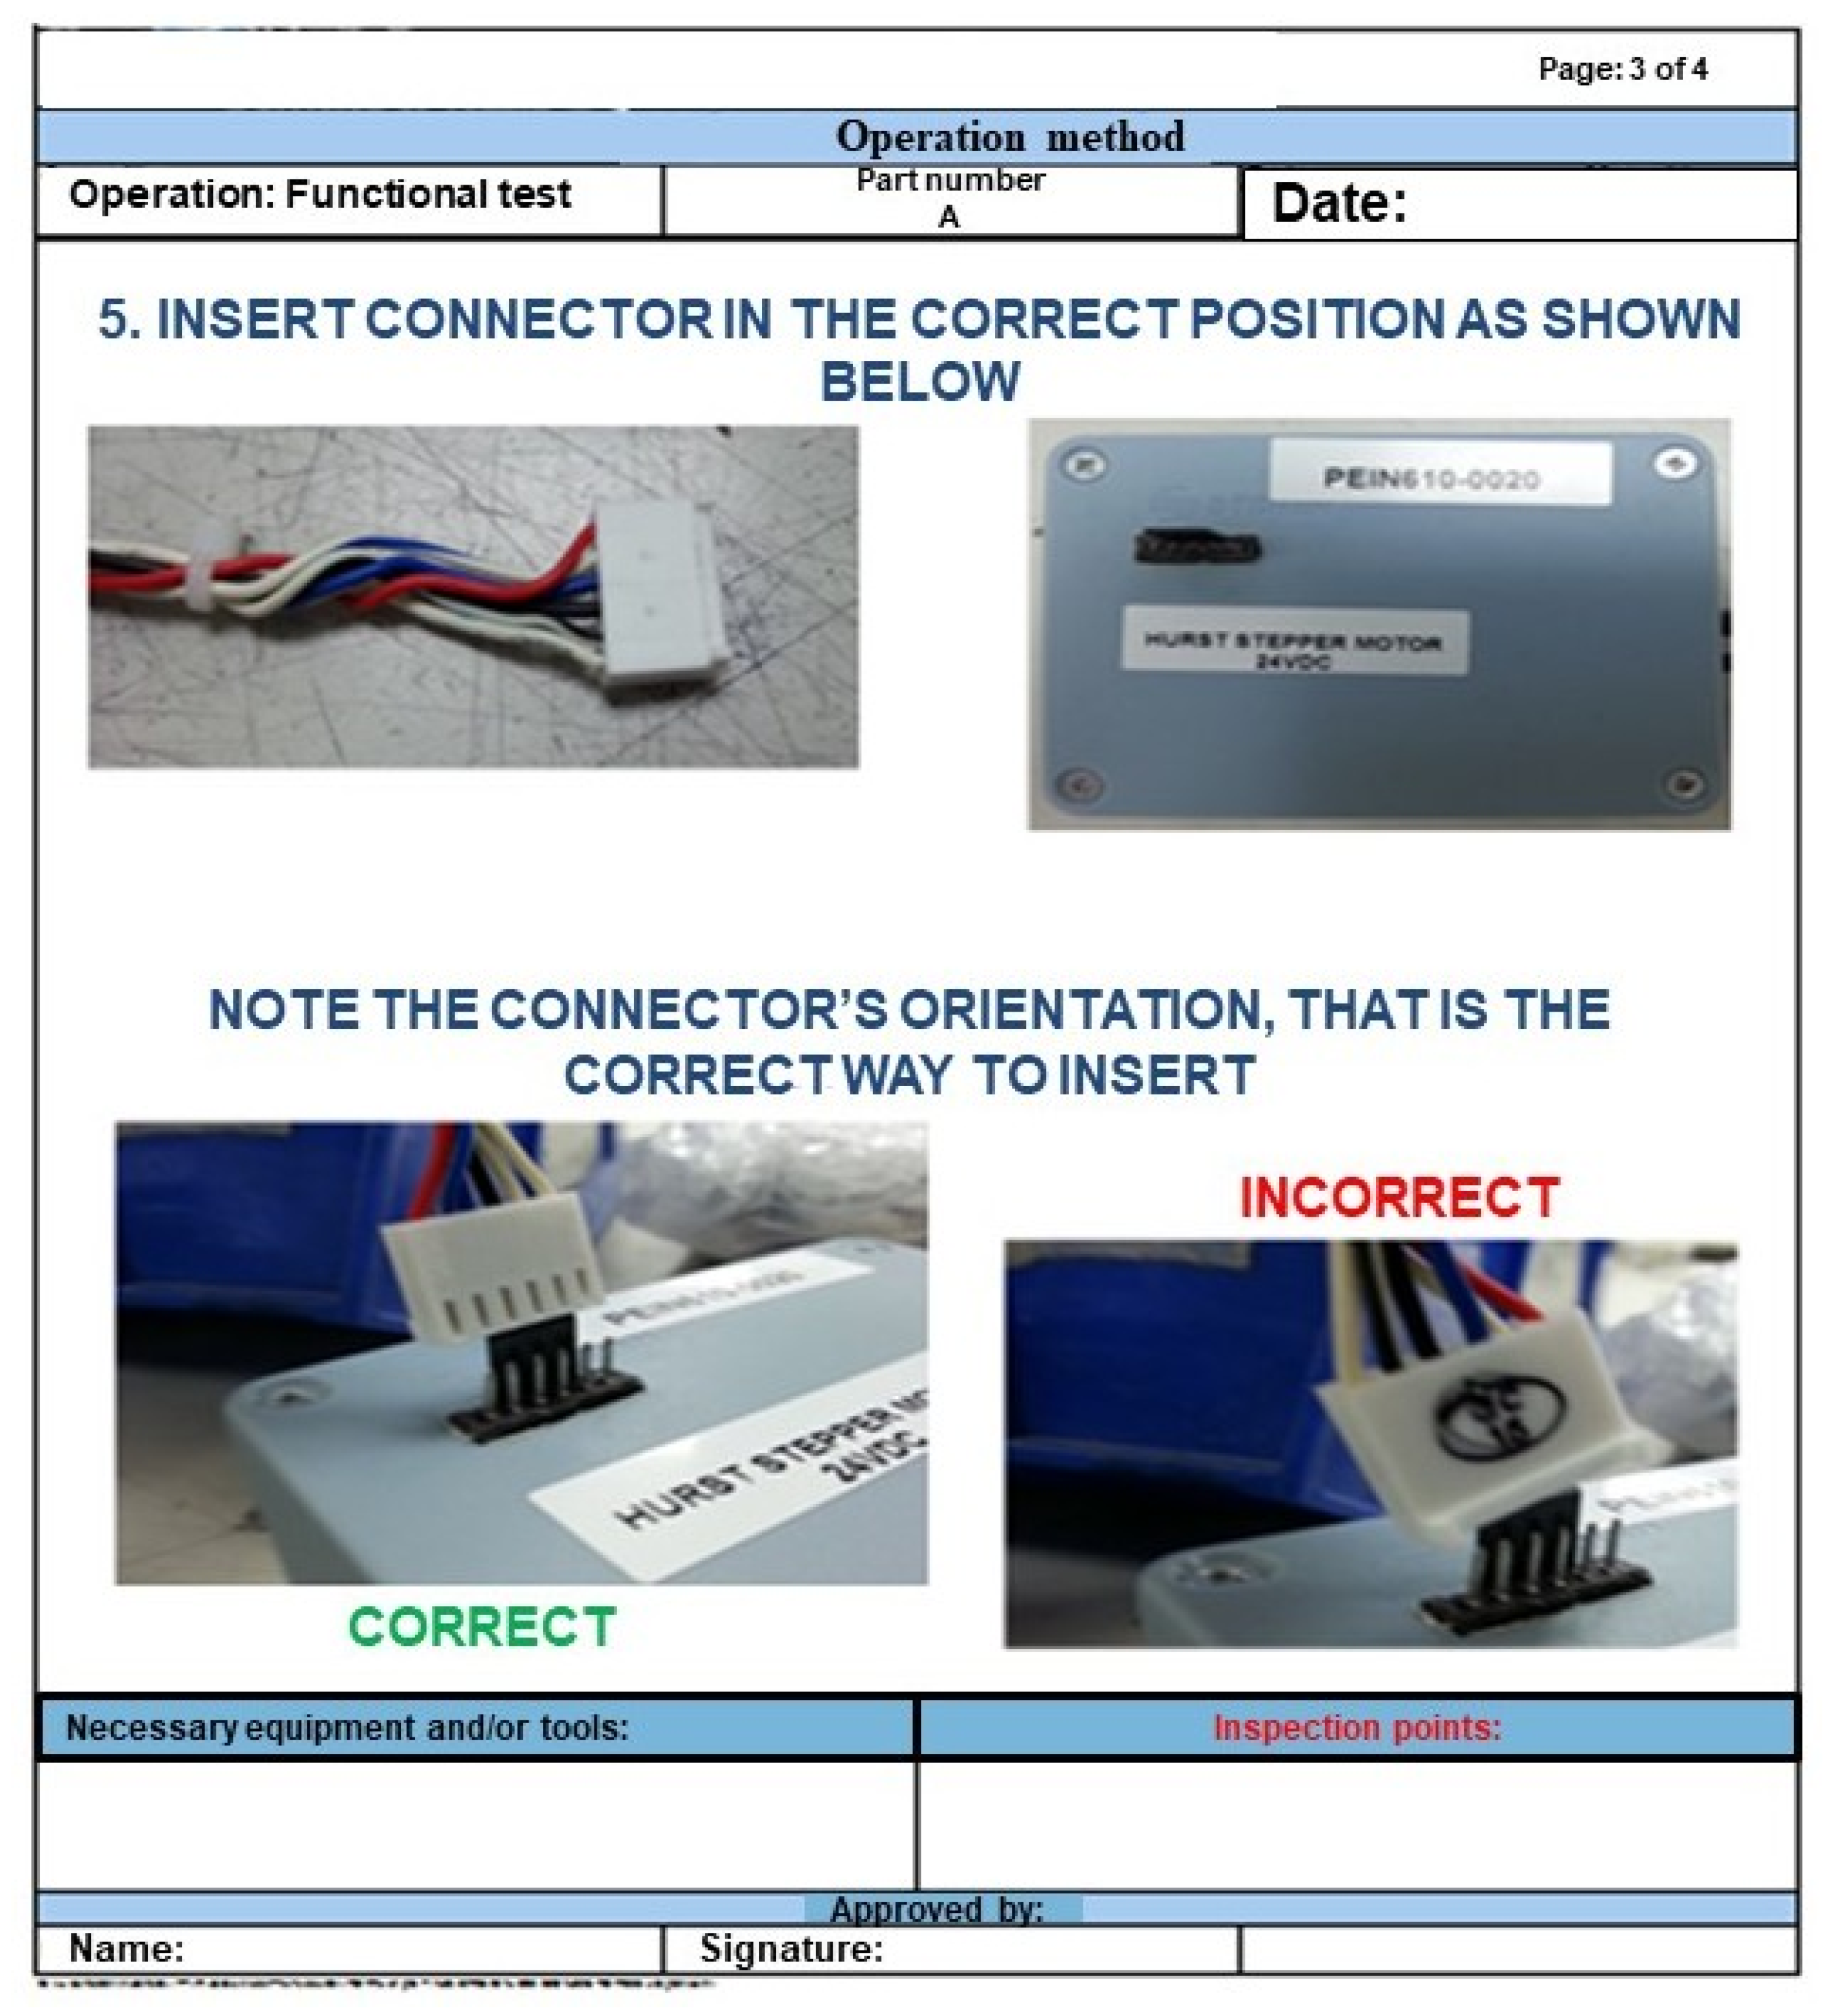
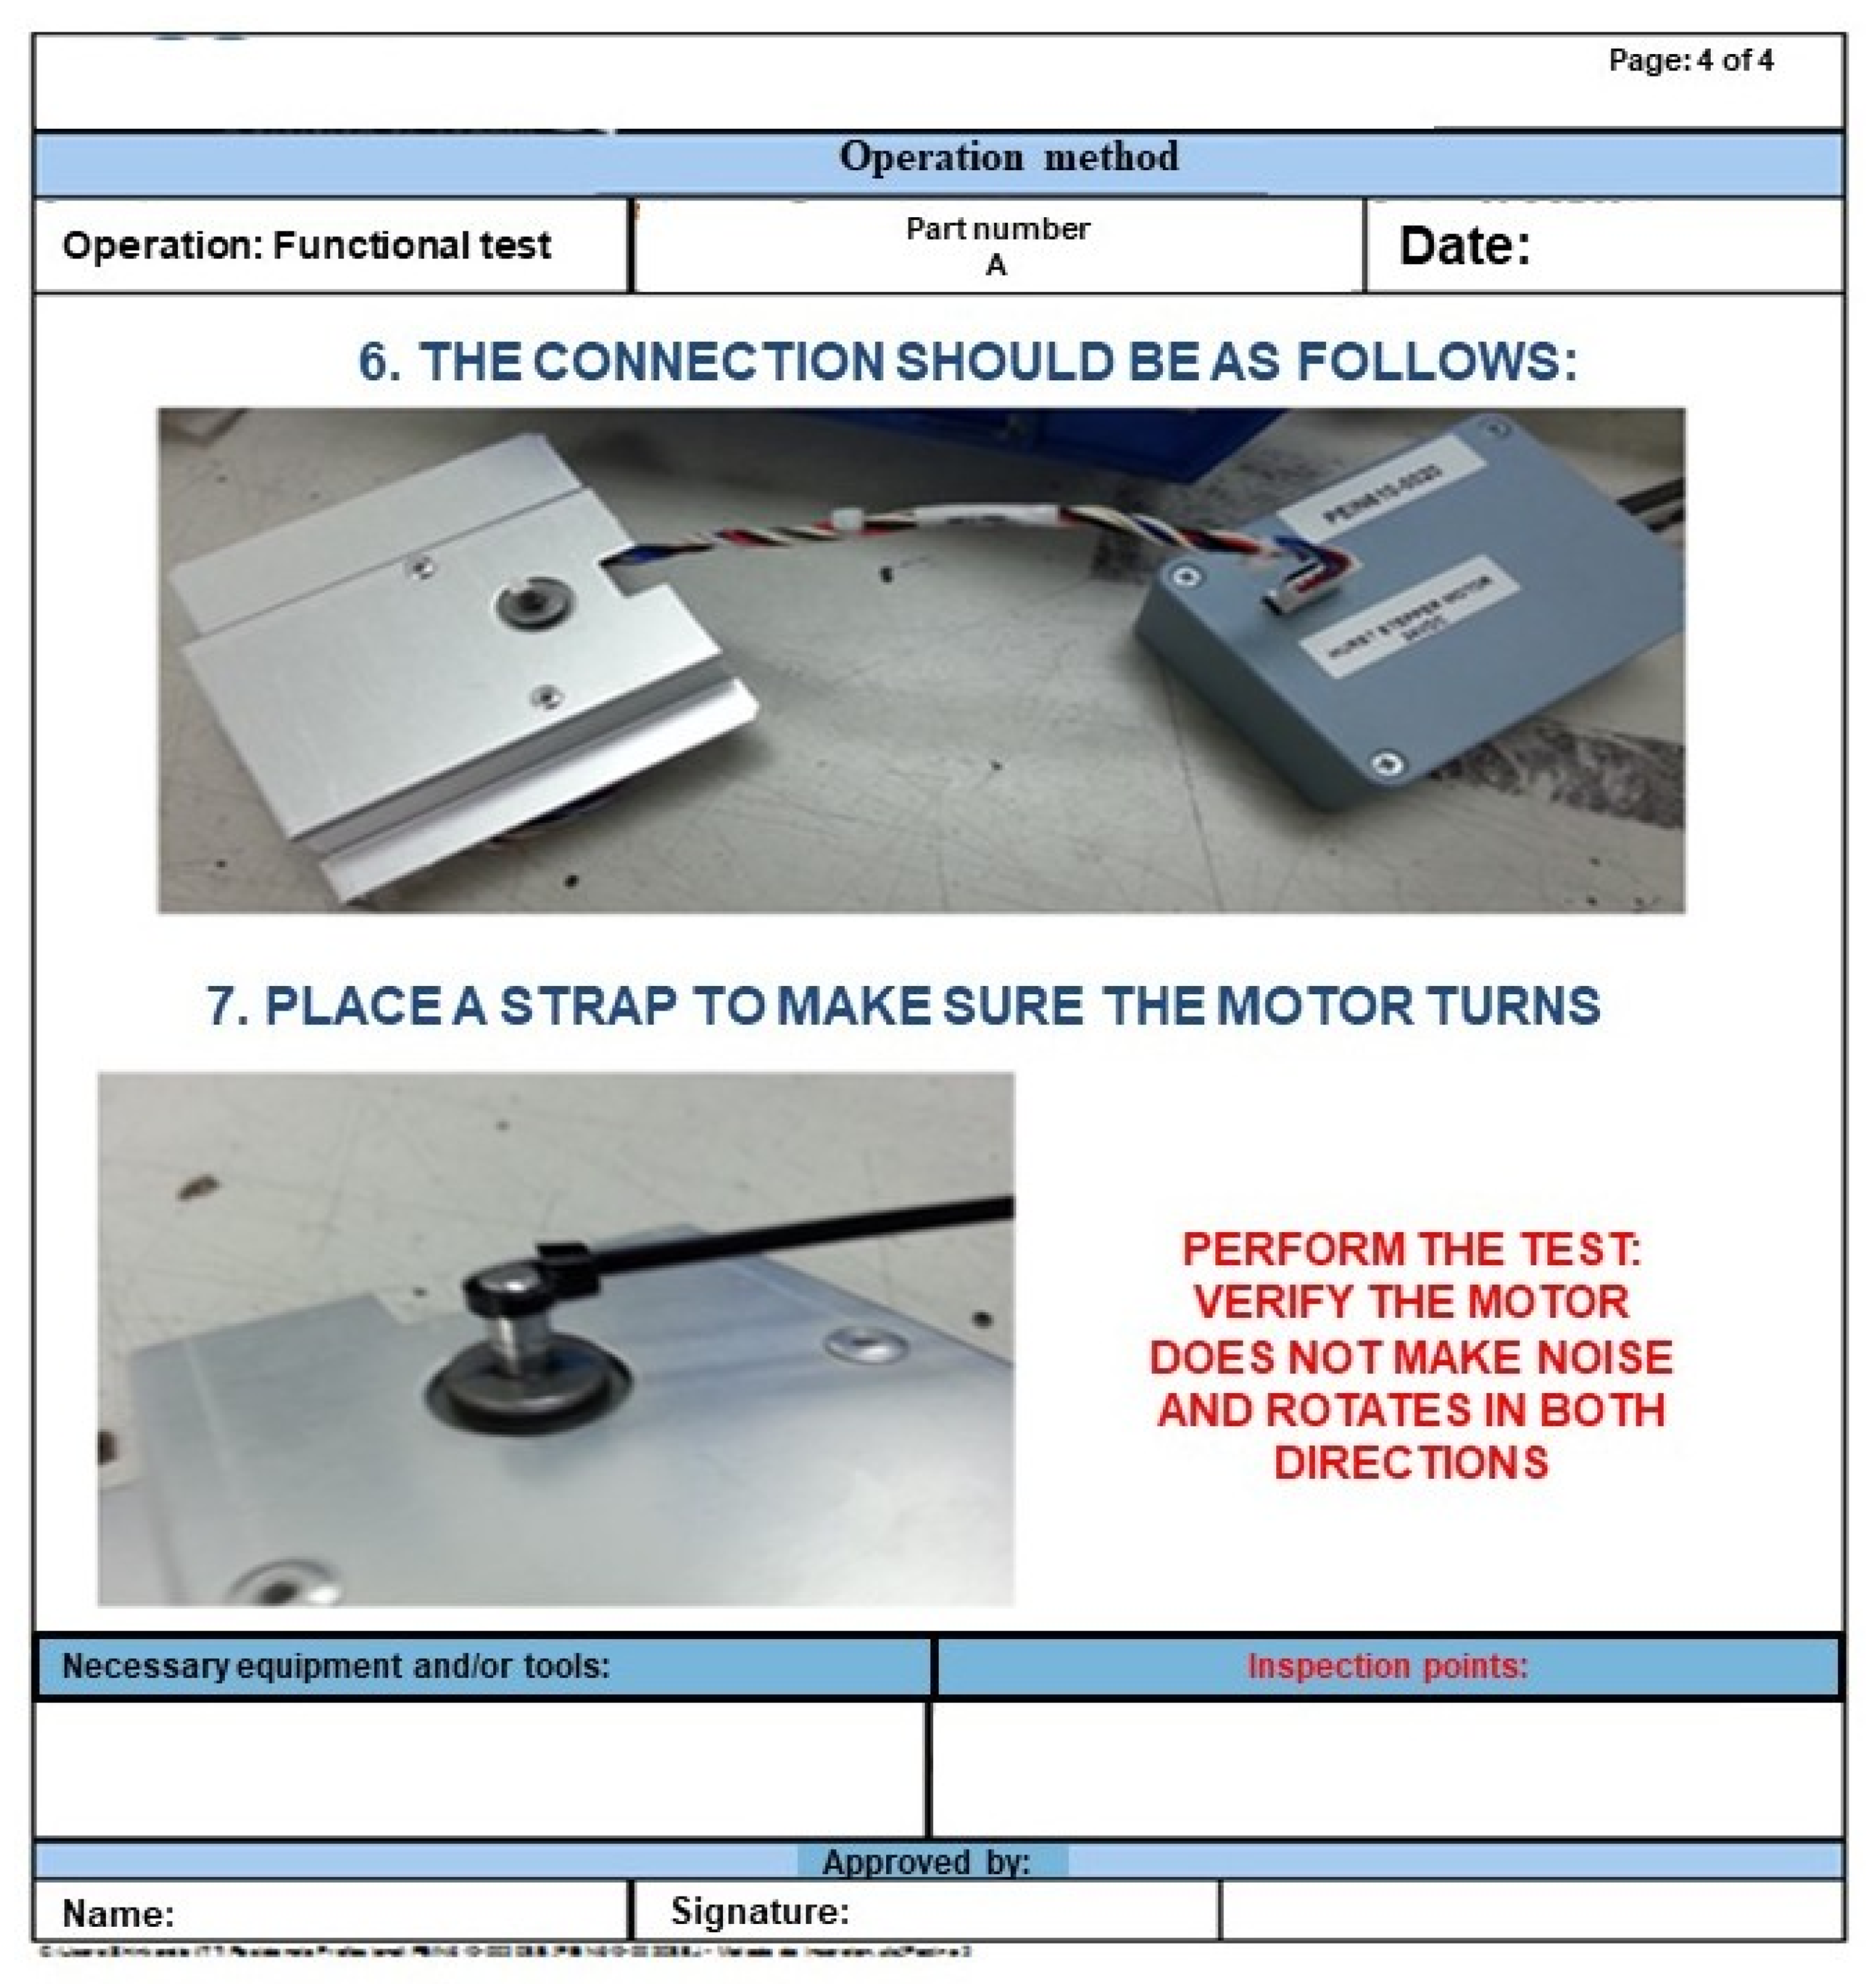
  • Connector insertion method: This action was implemented because inverted cables were the root cause of the problem.
  • Functional test: This action was implemented, since the lack of a functional test was one of the reasons why the assemblies had inverted cables. Functional tests can help solve the problems of noisy motors and dysfunctional motors.
  • Template: This action was demanded by customers, because the template guarantees that the assembly component features match the customer specifications.
The three corrective actions significantly improved the production system, since they helped solve problems of inverted cables, noisy motors, dysfunctional motors, and wrong component features. Additionally, the brand-new insertion method was added in the datasheet of part number A, and it was stored in an electronic file to be updated when necessary. However, one important factor to consider is that, regardless of whether the motor was properly assembled or not, it was still likely to fail or generate abnormal noise.

4.6. Implement and Validate Corrective Actions (D6)

An operation method for the functional test was developed (see Appendix B). Specifically, each connector being tested only had to be connected to the box containing the driver. The process time established by the customer was 7.28 min, but it is managed to decrease in 4.61 min (i.e., 36.68% less time) after the process was documented and a functional test was conducted. In the end, the operation method helped employees avoid mistakes when assembling the cable. The corrective actions were validated by comparing the analysis results from the defective assemblies before and after implementing these actions. Actually, the defective products decreased by 76%, which validates the implemented corrective actions [24].

4.7. Prevent Recurrences (D7)

The manufacturing process of part number A comprises eight tasks: manual cable cutting, semi-automatic cable riveting, cable end terminal insertion, cable labeling, performing electrical and functional tests, conducting final inspection, packaging, and shipping. Once these tasks were identified, a series of checklists was designed to monitor their successful completion and ensure continuity in the manufacturing process. At the shipping stage, all this documentation was assigned a customer revision number, which would allow the resulting datasheet to be immediately updated as customer specifications change, thereby informing the production, quality, and cutting departments of such updates.
Finally, in this discipline, an executable version of the Visual Basic® program was developed. The program forbid employees from changing any of its settings, since it only allows them to open it and perform the test in a pre-configured mode to prevent misconfiguration problems.

4.8. Recognize Teamwork and Individual Contributions (D8)

In this stage, all the teamwork members were acknowledged for their individual and group performances. Although each member had his/her own ideas, and different suggestions were proposed during the problem-solving process, the teamwork remained united and worked towards a common goal.

5. Conclusions and Industrial Implications

The principal goal of this work was successfully accomplished. The 8Ds method implemented in the manufacturing company managed to decrease the number of assembly defects in part number A from 67 to 16, which represents a decrease of 76.12%. Figure 12 shows a comparison about the frequency of each defect before and after implementing the 8Ds method. Note that the frequency of all defects decreased. For example, the frequency of inverted cables, the most common defect, decreased from 35 to 2. Similarly, the frequency of motor disfigured decreased from 10 to 3, and the noisy motor decreased from 9 to 3, to just mention the higher frequency defects.
Simultaneously, the 8Ds method implementation allowed increasing customer satisfaction. In the 16 case studies reported in Section 3, the 8Ds method was applied to help corporations to comply with delivery times, reduce scrap and defect costs, implement new processes or develop new products, improve quality assurance systems, minimize supply chain and customer complaints, and improve services. However, solving these types of problems involves having a solid and effective communication system among the affected departments, which should also share a common goal.
In addition, by implementing the 8Ds method, the company managed to decrease production time, machine downtimes, scrap costs, operational defects, the rate of late deliveries, and customer complaints. Regarding the manufacturing system, the 8Ds method increased efficiency and productivity in the application of statistical methods and techniques at low operational costs. Table 5 shows a comparison of the main indicators before and after implementing the 8Ds method. It is important to note that the total defects were reduced by 76.12%, while the customer complaints were reduced by 100%. Similarly, production, inspection, and packing times for the part number A were reduced by over 30%; and machines stoppages were reduced by over 77%. This reduction of time cycles allowed for increasing the production level by 34.22%.
Moreover, the implementation of the 8Ds method had a positive impact on the company’s competitiveness in terms of quality and safety. Furthermore, the 8Ds method had a significantly positive effect on employees and managerial responsibility, participation, and commitment, which streamlined and improved the company problem-solving process, especially by helping delegate equal responsibilities to the lowest organizational levels. Finally, the 8Ds method implementation allows collecting information concerning a problem in a quick manner, and reduces the communication time between the quality teamwork and operators.
When problems arise, a method, technique, or abstract tool ought to be implemented to find the best solution. On some occasions, the implementation process may require making small modifications in the organization, whereas in other cases, engineers must be more careful to spare the company losses. Additionally, in the implementation of any method, communication is a key element of success. A solid, rapid, and effective communication system encourages employees to be creative and be engaged in the problem-solving process and motivates employees to be prepared for any further change. In other words, the 8Ds method has a two-fold goal: to solve problems and to increase active employee participation in the problem-solving process. In order to achieve these goals, experts recommend the following strategies:
  • Implement the 8Ds method to solve problems with other part numbers, and/or in other areas (purchase or sales, for instance).
  • Always consider each employee’s opinion, since it will make their work motivating.
  • Engage customers’ opinions and ideas to improve both the production processes and their satisfaction.
As future work and based on the findings obtained in the present case study, the authors of this research plan to implement the 8Ds method in some companies from the 914 manufacturing industries located in Baja California state to solve problems related to defective products and/or production process efficiency. Additionally, the authors plan to extend the 8Ds method implementation, as well as other industrial engineering tools (PDCA cycle, standardized work, poka-yoke, DMAIC, to mention few) not only to companies in the manufacturing sector, but also in another sectors, such as construction, education, agriculture, and food services.
Finally, the authors encourage researchers from the industrial engineering field to publish their case studies on the applications of different techniques, methods, or tools, supported by the CRA.

Author Contributions

Conceptualization, A.R.-V. and J.L.G.-A.; data curation, A.R.-V. and K.C.A.-S.; formal analysis, J.L.G.-A. and E.J.M.; funding acquisition, A.R.-V.; investigation, A.R.-V. and K.C.A.-S.; methodology, J.L.G.-A. and E.J.M.; project administration, A.R.-V. and J.L.G.-A.; validation, J.L.G.-A.; visualization, E.J.M.; writing—original draft, A.R.-V.; writing—review and editing, J.L.G.-A. and E.J.M. All authors have read and agreed to the published version of the manuscript.

Funding

This research has received no external funding.

Acknowledgments

The authors would like to acknowledge the manufacturing company where the 8Ds method was implemented. Additionally, the authors would like to thank the Tijuana Institute of Technology, the Autonomous University of Baja California, the Autonomous University of Ciudad Juarez, and the University of La Rioja for allowing the use of their facilities for this research. Finally, the authors would like to thank CONACYT and PRODEP for their constant support toward develop projects and research.

Conflicts of Interest

The authors declare that there is no conflict of interest.

Appendix A. Code for the Program on Visual Basic

The next step involved introducing the following command:
Command for the input variable:
Private Declare Function Inp Lib “inpout32.dll” _
Alias “Inp32” (ByVal PortAddress As Integer) As Integer
Command for the output variable:
Private Declare Sub Out Lib “inpout32.dll” _
Alias “Out32” (ByVal PortAddress As Integer, ByVal Value As Integer)
Command to tell the program that a delay function exists in milliseconds:
Private Declare Sub Sleep Lib “kernel32” (ByVal dwMilliseconds As Long)
The following instructions are given to the MOTOR TURNS TO THE LEFT button.
Private Sub Command2_Click()
MsgBox (“BE SURE THAT THE MOTOR IS TURNING COUNTER CLOCKWISE. PRESS OK TO START”)
Dim x As Integer
For x = 10 To 500
Sleep 200
Out &H378, 6
Sleep 200
Out &H378, 5
Sleep 200
Out &H378, 9
Sleep 200
Out &H378, 10
Sleep 200
Next x
MsgBox (“END OF TEST TO THE LEFT”)
End Sub
Now, instructions are given to the MOTOR TURNS TO THE RIGHT button.
Private Sub Command4_Click()
MsgBox (“BE SURE THAT THE MOTOR IS TURNING CLOCKWISE. PRESS OK TO START”)
Dim x As Integer
For x = 10 To 500
Sleep 200
Out &H378, 10
Sleep 200
Out &H378, 9
Sleep 200
Out &H378, 5
Sleep 200
Out &H378, 6
Sleep 200
Next x
MsgBox (“END OF TEST TO THE RIGHT”)
End Sub
Finally, instructions are given for the EXIT TEST button.
Private Sub Command3_Click()
MsgBox (“ARE YOU SURE YOU WANT TO EXIT?”)
End
End Sub

Appendix B

Figure A1. First Visual Aid to Conducting the Functional Test.
Applsci 10 02433 g0a1
Figure A2. Second Visual Aid to Conducting the Functional Test.
Applsci 10 02433 g0a2
Figure A3. Third Visual Aid to Conducting the Functional Test.
Applsci 10 02433 g0a3
Figure A4. Fourth Visual Aid to Conducting the Functional Test.
Applsci 10 02433 g0a4

References

  1. Razali, N.M.; Rahman, M.N.A. Value Stream Mapping—A Tool to Detect and Reduce Waste for a Lean Manufacturing System. In Proceedings of the 4th International Manufacturing Engineering Conference and the 5th Asia Pacific Conference on Manufacturing Systems; Osman-Zahid, M., Abd.-Aziz, R., Yusoff, A., Mat-Yahya, N., Abdul-Aziz, F., Yazid-Abu, M., Eds.; Springer: Singapore, 2020; pp. 266–271. ISBN 978-981-15-0949-0. [Google Scholar]
  2. Botti, L.; Mora, C.; Regattieri, A. Integrating ergonomics and lean manufacturing principles in a hybrid assembly line. Comput. Ind. Eng. 2017, 111, 481–491. [Google Scholar] [CrossRef]
  3. Walder, J.; Karlin, J.; Kerk, C. Integrated lean thinking & ergonomics: Utilizing material handling assist device solutions for a productive workplace. In MHIA White Paper: Material Handling Industry of America; South Datota School of Mines: Charlote, NC, USA, 2007; pp. 1–18. [Google Scholar]
  4. El-Namrouty, K.A.; Abushaaban, M.S. Seven wastes elimination targeted by lean manufacturing case study “gaza strip manufacturing firms”. Int. J. Econ. Financ. Manag. Sci. 2013, 1, 68–80. [Google Scholar] [CrossRef] [Green Version]
  5. Jadhav, P.K.; Nagare, M.R.; Konda, S. Implementing Lean Manufacturing Principle In Fabrication Process- A Case Study. Int. Res. J. Eng. Technol. 2018, 5, 1843–1847. [Google Scholar]
  6. Guiras, Z.; Turki, S.; Rezg, N.; Dolgui, A. Optimization of Two-Level Disassembly/Remanufacturing/Assembly System with an Integrated Maintenance Strategy. Appl. Sci. 2018, 8, 666. [Google Scholar] [CrossRef] [Green Version]
  7. Zhou, X.-Y.; Gosling, P.D. Influence of stochastic variations in manufacturing defects on the mechanical performance of textile composites. Compos. Struct. 2018, 194, 226–239. [Google Scholar] [CrossRef] [Green Version]
  8. Buixansky, B.; Fleck, N.A. Compressive failure of fibre Composites. J. Mech. Phys. Solids 1993, 41, 183–211. [Google Scholar]
  9. Pinho, S.T.; Iannucci, L.; Robinson, P. Physically-based failure models and criteria for laminated fibre-reinforced composites with emphasis on fibre kinking: Part I: Development. Compos. Part A Appl. Sci. Manuf. 2006, 37, 63–73. [Google Scholar] [CrossRef] [Green Version]
  10. Gommer, F.; Endruweit, A.; Long, A.C. Quantification of micro-scale variability in fibre bundles. Compos. Part A Appl. Sci. Manuf. 2016, 87, 131–137. [Google Scholar] [CrossRef]
  11. Sreedharan, R.; Rajasekar, S.; Kannan, S.S.; Arunprasad, P.; Trehan, R. Defect reduction in an electrical parts manufacturer: A case study. TQM J. 2018, 30, 650–678. [Google Scholar] [CrossRef]
  12. González-Reséndiz, J.; Arredondo-Soto, K.C.; Realyvásquez-Vargas, A.; Híjar-Rivera, H.; Carrillo-Gutiérrez, T.; González-Reséndiz, J.; Arredondo-Soto, K.C.; Realyvásquez-Vargas, A.; Híjar-Rivera, H.; Carrillo-Gutiérrez, T. Integrating Simulation-Based Optimization for Lean Logistics: A Case Study. Appl. Sci. 2018, 8, 2448. [Google Scholar] [CrossRef] [Green Version]
  13. Pérez-Domínguez, L.; Luviano-Cruz, D.; Valles-Rosales, D.; Hernández Hernández, J.; Rodríguez Borbón, M. Hesitant Fuzzy Linguistic Term and TOPSIS to Assess Lean Performance. Appl. Sci. 2019, 9, 873. [Google Scholar] [CrossRef] [Green Version]
  14. Wang, C.-H. Incorporating customer satisfaction into the decision-making process of product configuration: A fuzzy Kano perspective. Int. J. Prod. Res. 2013, 51, 6651–6662. [Google Scholar] [CrossRef]
  15. Abolhassani, A.; Harner, J.; Jaridi, M.; Gopalakrishnan, B. Productivity enhancement strategies in North American automotive industry. Int. J. Prod. Res. 2018, 56, 1–18. [Google Scholar] [CrossRef]
  16. Saeidi, S.P.; Sofian, S.; Saeidi, P.; Saeidi, S.P.; Saaeidi, S.A. How does corporate social responsibility contribute to firm financial performance? The mediating role of competitive advantage, reputation, and customer satisfaction. J. Bus. Res. 2015, 68, 341–350. [Google Scholar] [CrossRef]
  17. Galbreath, J. Twenty-first century management rules: The management of relationships as intangible assets. Manag. Decis. 2002, 40, 116–126. [Google Scholar] [CrossRef]
  18. Liu, A.X.; Liu, Y.; Luo, T. What Drives a Firm’s Choice of Product Recall Remedy? The Impact of Remedy Cost, Product Hazard, and the CEO. J. Mark. 2016, 80, 79–95. [Google Scholar] [CrossRef]
  19. Wang, C.-N.; Chiu, P.-C.; Cheng, I.-F.; Huang, Y.-F. Contamination Improvement of Touch Panel and Color Filter Production Processes of Lean Six Sigma. Appl. Sci. 2019, 9, 1893. [Google Scholar] [CrossRef] [Green Version]
  20. Bunce, M.M.; Wang, L.; Bidanda, B. Leveraging Six Sigma with industrial engineering tools in crateless retort production. Int. J. Prod. Res. 2008, 46, 6701–6719. [Google Scholar] [CrossRef]
  21. Dudin, M.N.; Frolova, E.E.; Gryzunova, N.V.; Borisovna, E.S. The Deming Cycle (PDCA) Concept as an Efficient Tool for Continuous Quality Improvement in the Agribusiness. Asian Soc. Sci. 2015, 11, 239–246. [Google Scholar] [CrossRef]
  22. Realyvásquez-Vargas, A.; Arredondo-Soto, K.C.; Carrillo-Gutiérrez, T.; Ravelo, G. Applying the Plan-Do-Check-Act (PDCA) Cycle to Reduce the Defects in the Manufacturing Industry. A Case Study. Appl. Sci. 2018, 8, 2181. [Google Scholar] [CrossRef] [Green Version]
  23. Cheng, H.-R.; Chen, B.-W. A case study in solving customer complaints based on the 8Ds method and Kano model. J. Chin. Inst. Ind. Eng. 2010, 27, 339–350. [Google Scholar]
  24. Kumar, S.; Adaveesh, B. Application of 8D Methodology for the Root Cause Analysis and Reduction of Valve Spring Rejection in a Valve Spring Manufacturing Company: A Case Study. Indian J. Sci. Technol. 2017, 10, 1–11. [Google Scholar] [CrossRef] [Green Version]
  25. Mitreva, E.; Taskov, N.; Gjorshevski, H. Methodology for design and implementation of the TQM (Total Quality Management) system in automotive industry companies in Macedonia. In Proceedings of the Regionalna Naucno Strucna Konferencija—ERAZ 2015—Odrzivi Ekonomski Razvoj-Savremeni i Multidisciplinarni Pristup, Belgrade, Serbia, 9–11 June 2015; pp. 1–9. [Google Scholar]
  26. Titu, M.A. Management of customers’ complaints within SC COMPA SA Sibiu. Case study for a topical complaint. J. Electr. Eng. Electron. Control Comput. Sci. 2016, 2, 1–4. [Google Scholar]
  27. Instituto Nacional de Estadística Geografía e Informática (INEGI) INEGI. Monthly Survey of Manufacturing (Emim). Available online: http://www.inegi.org.mx/sistemas/bie/default.aspx?idserPadre=10400100 (accessed on 18 March 2020). (In Spanish).
  28. Easton, G. Critical realism in case study research. Ind. Mark. Manag. 2010, 39, 118–128. [Google Scholar] [CrossRef]
  29. Tsang, E.W.K. Case studies and generalization in information systems research: A critical realist perspective. J. Strateg. Inf. Syst. 2014, 23, 174–186. [Google Scholar] [CrossRef]
  30. Easton, G. One Case Study is Enough; The Department of Marketing: Lancaster, TX, USA, 2010. [Google Scholar]
  31. Acero, R.; Torralba, M.; Pérez-Moya, R.; Pozo, J.A. Value Stream Analysis in Military Logistics: The Improvement in Order Processing Procedure. Appl. Sci. 2020, 10, 106. [Google Scholar] [CrossRef] [Green Version]
  32. Pérez-Pucheta, C.E.; Olivares-Benitez, E.; Minor-Popocatl, H.; Pacheco-García, P.F.; Pérez-Pucheta, M.F. Implementation of Lean Manufacturing to Reduce the Delivery Time of a Replacement Part to Dealers: A Case Study. Appl. Sci. 2019, 9, 3932. [Google Scholar] [CrossRef] [Green Version]
  33. Realyvásquez-Vargas, A.; Flor-Moltalvo, F.J.; Blanco-Fernández, J.; Sandoval-Quintanilla, J.D.; Jiménez-Macías, E.; García-Alcaraz, J.L. Implementation of Production Process Standardization—A Case Study of a Publishing Company from the SMEs Sector. Processes 2019, 7, 646. [Google Scholar] [CrossRef] [Green Version]
  34. Saad, N.M.; Al-Ashaab, A.; Shehab, E.; Maksimovic, M. A3 Thinking Approach to Support Problem Solving in Lean Product and Process Development. In Concurrent Engineering Approaches for Sustainable Product Development in a Multi-Disciplinary Environment; Stjepandić, J., Rock, G., Bil, C., Eds.; Springer: London, UK, 2013; pp. 871–882. ISBN 978-1-4471-4425-0. [Google Scholar]
  35. Joshuva, N.; Pinto, T. Study and Analysis of Process Capability of 4000 Ton Mechanical Press Using 8D Method. In Proceedings of the National Conference on Advances in Mechanical Engineering Science, Hangzhou, China, 9–10 April 2016; pp. 104–108. [Google Scholar]
  36. Chelsom, J.V.; Payne, A.C.; Reavill, L.R.P. Management for Engineers, Scientists, and Technologists, 2nd ed.; John Wiley & Sons: Hoboken, NJ, USA, 2005; ISBN 0470021268. [Google Scholar]
  37. Vargas, D.L. Resolução de problemas utilizando a metodologia 8D: Estudo de caso de uma indústria do setor sucroalcooleiro. In Proceedings of the Simpósio de Engenharia de Produção de Sergipe Anais do IX SIMPROD, São Cristóvão, Brazil, 28 Novembre–1 December 2017; pp. 464–477. [Google Scholar]
  38. Quality-One Eight Disciplines of Problem Solving. Available online: https://quality-one.com/8d/ (accessed on 12 October 2018).
  39. Bremmer, J. Update and Upgrade the Current Quality Assurance in the Global Supply Chain of a Heavy Truck Manufacturing Company: Managing Product Quality in the North Bound Flow (NBF) at Scania Production Zwolle. Master’s Thesis, University of Twente, Snschede, The Netherlands, 2015. [Google Scholar]
  40. Pacheco-Pacheco, V.H. Implementación de un Modelo de Mejora para Optimizar el Tiempo de Entrega de los Productos “Alto De Basta” y “Alto De Camisa” en el Proceso Confección, Arreglo y Modificación, mediante la Aplicación de las 8 Disciplinas. In Caso: Symp—Sastrería; Universidad Católica del Ecuador: Quito, Ecuador, 2018. [Google Scholar]
  41. Zasadzień, M. Six Sigma methodology as a road to intelligent maintenance. Prod. Eng. Arch. 2017, 15, 45–48. [Google Scholar] [CrossRef]
  42. Kumar, S.; Singh, D. Implementing 8D Model of Problem Solving in Employee Turnover: A Study of Selected Hotels in Delhi and Rajasthan. J. Kashmir Tour. Cater. Technol. 2015, 2, 1–10. [Google Scholar]
  43. Zasadzień, M. Wykorzystanie metody 8D do doskonalenia procesu remontowego wagonów kolejowych. Syst. Wspomagania w Inżynierii Prod. 2016, z2, 392–399. [Google Scholar]
  44. Mitreva, E.; Zdrvkovska, L.; Taskov, N.; Metodijeski, D.; Gjorshevski, H. Quality management and practises in automotive parts production. In Proceedings of the XXIV International Scientific-Technical Conference on Transport, Road-Building, Agricultural, Hoisting & Hauling and Military Technics and Technologies, Sofia, Bulgaria, 29 June–2 July 2016; pp. 4–7. [Google Scholar]
  45. Zhou, F.; Wang, X.; Mpshe, T.; Zhang, Y.; Yang, Y. Quality Improvement Procedure (QIP) based on 8D and Six Sigma Pilot Programs in Automotive Industry. Adv. Econ. Bus. Manag. Res. 2016, 16, 275–281. [Google Scholar]
  46. Nicolae, V.; Ionescu, L.M.; Belu, N.; Elena Știrbu, L. Improvement of the 8D Analysis Through a System Based on the “Internet of Things” Concept Applied in Automotive Industry. In CONAT 2016 International Congress of Automotive and Transport Engineering; Chiru, A., Ispas, N., Eds.; Springer International Publishing: Berlin/Heidelberg, Germany, 2017; pp. 635–642. [Google Scholar]
  47. Roque, R.; Berenice, E. Reengineering Process in the Manufacture of Dental Units Applying the Eight Discipline Methodology. Bachelor’s Thesis, Universidad Tecnológica de Perú, Lima, Peru, 2017. (In Spanish). [Google Scholar]
  48. Škůrková, K.L. Implementation of a System Quality Tool to Reduce tThe Costs of Scrap Loss in Industrial Enterprise. Zesz. Nauk. Qual. Prod. Improv. 2017, 1, 93–111. [Google Scholar] [CrossRef]
  49. Wichawong, P.; Chongstitvatana, P. Knowledge management system for failure analysis in hard disk using case-based reasoning. In Proceedings of the 2017 18th IEEE/ACIS International Conference on Software Engineering, Artificial Intelligence, Networking and Parallel/Distributed Computing (SNPD), Kanazawa, Japan, 26–28 June 2017; pp. 1–6. [Google Scholar]
  50. Chlpeková, A.; Večeřa, P.; Šurinová, Y. Enhancing the Effectiveness of Problem-Solving Processes through Employee Motivation and Involvement. Int. J. Eng. Bus. Manag. 2014, 6, 1–9. [Google Scholar] [CrossRef]
  51. Slayter, E.; Higgins, L.M. Hands-On Learning: A Problem-Based Approach to Teaching Microsoft Excel. Coll. Teach. 2018, 66, 31–33. [Google Scholar] [CrossRef]
  52. Hamad, M.M. AutoCAD 2019: Beginning and Intermediate; Stylus Publishing: Dulles, VA, USA, 2019; ISBN 9781683922599. [Google Scholar]
  53. Garcés, K.; Casallas, R.; Álvarez, C.; Sandoval, E.; Salamanca, A.; Viera, F.; Melo, F.; Soto, J.M. White-box modernization of legacy applications: The oracle forms case study. Comput. Stand. Interfaces 2018, 57, 110–122. [Google Scholar] [CrossRef]
  54. Xu, Q.; Jiao, R.J.; Yang, X.; Helander, M.; Khalid, H.M.; Opperud, A. An analytical Kano model for customer need analysis. Des. Stud. 2009, 30, 87–110. [Google Scholar] [CrossRef]
  55. Meng, Q.; Zhou, N.; Tian, J.; Chen, Y.; Zhou, F. Analysis of Logistics Service Attributes Based on Quantitative Kano Model: A Case Study of Express Delivering Industries in China. J. Serv. Sci. Manag. 2011, 4, 42–51. [Google Scholar] [CrossRef]
  56. Matzler, K.; Hinterhuber, H.H. How to make product development projects more successful by integrating Kano’s model of customer satisfaction into quality function deployment. Technovation 1998, 18, 25–38. [Google Scholar] [CrossRef]
  57. He, L.; Song, W.; Wu, Z.; Xu, Z.; Zheng, M.; Ming, X. Quantification and integration of an improved Kano model into QFD based on multi-population adaptive genetic algorithm. Comput. Ind. Eng. 2017, 114, 183–194. [Google Scholar] [CrossRef]
  58. Patel, S. The Global Quality Management System. Improvement through Systems Thinking; Productivity Press: New York, NY, USA, 2016; ISBN 978-1-4987-3980-1. [Google Scholar]
  59. Barsalou, M.A. Root Cause Analysis, A Step-By-Step Guide to Using the Right Tool at the Right Time; CRC Press: Boca Raton, FL, USA, 2014; ISBN 9781482258790. [Google Scholar]
  60. Barsalou, M.A. In the Loop. Use 8D reports to track the status of custmer complaints. Qual. Prog. 2016, 49, 80. [Google Scholar]
  61. Parker, F. Strategy + Teamwork = Great Products. Management Techniques for Manufacturing Companies, 1st ed.; CRC Press: Boca Raton, FL, USA, 2015; ISBN 978-1-4822-6011-3. [Google Scholar]
  62. Camarillo, A.; Ríos, J.; Althoff, K.-D. Knowledge-based multi-agent system for manufacturing problem solving process in production plants. J. Manuf. Syst. 2018, 47, 115–127. [Google Scholar] [CrossRef]
  63. Lira, L.H.; Hirai, F.E.; Oliveira, M.; Portellinha, W.; Nakano, E.M. Use of the Ishikawa diagram in a case-control analysis to assess the causes of a diffuse lamellar keratitis outbreak. Arq. Bras. Oftalmol. 2017, 80, 281–284. [Google Scholar] [CrossRef] [PubMed]
  64. Silva, A.S.; Medeiros, C.F.; Vieira, R.K. Cleaner Production and PDCA cycle: Practical application for reducing the Cans Loss Index in a beverage company. J. Clean. Prod. 2017, 150, 324–338. [Google Scholar] [CrossRef]
  65. Da Fonseca, C.M.; Leite, J.C.; De Oliveira Freitas, C.A.; Da Silva Vieira, A.; Fujiyama, R.T. Proposal for improvement the welding process of the micro-USB connector on the mother board on tablets. J. Eng. Technol. Ind. Appl. 2016, 02, 39–47. [Google Scholar] [CrossRef]
  66. de Saeger, A.; Feys, B. The Ishikawa Diagram for Risk Management: Anticipate and Solve Problems Within your Business; Plurilingua Publishing: Brussels, Belgium, 2015; ISBN 9782806268426. [Google Scholar]
  67. Joiner Associates, I. Pareto Charts: Plain & Simple; Reynard, S., Ed.; Oriel Incorporated: Madison, WI, USA, 1995; ISBN 9781884731044. [Google Scholar]
  68. Beheshti, M.H.; Hajizadeh, R.; Dehghan, S.F.; Aghababaei, R.; Jafari, S.M.; Koohpaei, A. Investigation of the Accidents Recorded at an Emergency Management Center Using the Pareto Chart: A Cross-Sectional Study in Gonabad, Iran, During 2014–2016. Health Emergencies Disasters 2018, 3, 143–150. [Google Scholar] [CrossRef] [Green Version]
  69. Webber, L.; Wallace, M. Quality Control for Dummies; John Wiley & Sons: Hoboken, NJ, USA, 2011; ISBN 9781118051030. [Google Scholar]
  70. Dan, M.C.; Filip, A.M. Sorin Popescu mistakes in the application of 8d methodology and their impact on customer satisfaction in the automotive industry. In Proceedings of the 2016 International Conference on Production Research—Africa, Europe and the Middle East 4th International Conference on Quality and Innovation in Engineering and Management, Cluj-Napoca, Romania, 25–30 July 2016; pp. 298–303. [Google Scholar]
Figure 1. Stepper motor.
Applsci 10 02433 g001
Figure 2. Steps for the 8Ds problem-solving process. Adapted from Joshuva and Pinto [35].
Applsci 10 02433 g002
Figure 3. Ishikawa diagram to illustrate the causes of an absenteeism problem.
Applsci 10 02433 g003
Figure 4. Example of a Pareto chart application for causes of absenteeism.
Applsci 10 02433 g004
Figure 5. Pareto diagram of cable assembly defects.
Applsci 10 02433 g005
Figure 6. Provisional aid for cable insertion.
Applsci 10 02433 g006
Figure 7. Template of the drawing provided by the customer: (a) picture of the template made in AutoCAD; (b) picture of the printed template.
Applsci 10 02433 g007
Figure 8. Cause-effect diagram to find out the root cause of the problem.
Applsci 10 02433 g008
Figure 9. Truth values for the motor.
Applsci 10 02433 g009
Figure 10. Translation of binary values to decimal values.
Applsci 10 02433 g010
Figure 11. Parmon’s parallel port monitor application and motor functioning: (a) decimal value 10 enabled, the motor starts turning; (b) decimal value 9 enabled, the motor continues its cycle; (c) decimal value 5 enabled, the motor continues its cycle; (d) decimal value 6 enabled, the motor finishes its cycle.
Applsci 10 02433 g011
Figure 12. Comparison of the frequency of defects before and after applying the 8Ds method.
Applsci 10 02433 g012
Table 1. Recent case studies applying the 8Ds method.
AuthorImplementation of 8DsResults
Mitreva et al. [25]The study applies the 8Ds method to solve the problem of a LED diode that does not perform its function in the circuit board.Employees’ responsibility was improved towards carrying out business processes.
Fewer operational defects were shown.
Software packages efficiency increase in the application of statistical methods and techniques.
Employees’ participation increased.
Employees’ commitment towards quality improvement.
Full managerial commitment.
Ability to solve problems at all levels increased.
Slightly, but significant improvements in the production processes and products.
Business processes were optimized.
Low organizational job levels were incorporated to the decision-making process.
Bremmer [39]The research analyzes the Scania’s global supply chain and determines how the corporation can guarantee the quality of products by applying 8Ds and other methodologies.The current production process at Scania is working, but it is requiring some improvements, especially due to the expected growth of the North Bound Flow (NBF).
Kumar and Singh [42]The study explores the hospitality industry of Delhi and Rajasthan, in India. Specifically, the research addresses the issue of employee turnover in the housekeeping department by identifying both causes and solutions with the help of an 8Ds model for problem solving.In the hospitality industry, the 8Ds method can be positively adopted to solve problems, especially in terms of employee turnover in the housekeeping department.
Zasadzień [43]The research seeks to solve problems that are identified in the process of railway carriage renovation by implementing the 8Ds method.The 8Ds method enabled to identify causes of problems in the railway repair process, as well as allowed the author to develop improvement actions, which considerably streamlined the analyzed process.
Mitreva et al. [44]This work analyzes the quality assurance system of an automotive company to determine its efficiency. Specifically, the authors studied the company’s business process management strategies (identification, documentation, and control), as well as verified whether the system’s efficiency documentation had been properly developed or not.The quality and a better productivity at the lowest costs in operation were defined.
Titu [26]This study relies on the 8Ds method to solve the complaint about a defective part. The study takes place in SC COMPA S.A., a company based in Sibiu, Romania.60 days after corrective actions were implemented, there were no other pieces identified with this type of defect.
Thus, the customer decided to withdraw complaints.
Fuli et al. [45]The research develops a quality improvement procedure for automotive companies based on quality management practices. The 8Ds method and the Six Sigma pilot programs were implemented.The results indicated that the proposed procedure is effective among the studied in Chinese and South African automotive industries.
Nicolae et al. [46]This work proposes a solution to decrease the response time for the 8Ds method by: (a) warning workstations and warehouses about the appearance of a customer complaint, as well as (b) using a software program for the computerized management of some documents that are needed for the 8Ds analysis.There are some of the main results: a decreased in the communication time between the quality teamwork and the staff in the manufacturing process, since when a customer complaint is received, it is solved.
A faster process of collecting information on manufacturing processes during the 8Ds analysis.
A better quality of information that can lead to the resolution of non-compliance was obtained.
Less 8Ds analysis time, especially in the first phase of the method.
A brand-new customer interface that informs customers about the problem-solving steps that are being taken.
The platform is more consistent with the common guidelines for reporting 8Ds analyses.
Kumar and Adaveesh [24]The six-month study was conducted in a spring and stamping company. The research found a high rejection rate (i.e., 17.07%) of valve springs due to defects. Thus, the 8Ds method was implemented to reduce the rate in 4.91%.The product rejection rate decreased significantly in 6 months: from 17.07%, in January 2014, to 4.91%, in July 2014.
Roque and Berenice [47]This work relies on the 8Ds method to design and implement new processes for manufacturing dental units with current technology for a company named Briggith. The goal was to ensure the company’s subsistence in the current market.The standardization of raw materials and variables that intervene in the process was possible.
Design of new, lighter, and modern structures.
Design of an overall electronic control method for the variables identified in the production process.
Compliance with quality standards established in the project.
Škůrková [48]The research focuses on reducing scrap costs in an industrial company. The author implemented a series of methodologies, including the 8Ds method.Causes of scrap costs were identified, and corrective actions were taken to reduce such costs.
Wichawong and Chongstitvatana [49]The research introduces a knowledge management system for failure analysis of hard disks that applies a case-based reasoning. The 8Ds method was implemented for problem solving to design a document template.The document template was successfully designed.
The system reported a high customer satisfaction rate, as well as searching effectiveness was acceptable. In summary, the system was successful.
Vargas [37]This work implements the 8Ds method to solve the problem of sudden stoppages in a continuous vacuum batch cooker that is used in a Brazilian sugar and alcohol company.An effective method combined with quality tools for detecting and solving the problem and eliminating its recurrence was implemented.
The application of the 8Ds method increased the company’s performance, as well as and contributed to the continuous improvement of its production process. However, the method could also be applied in other type of processes to increase the company’s competitiveness in terms of quality and safety.
Zasadzień [41]The study implements a quality engineering method to improve the company’s maintenance processes in a Silesian production plant. Specifically, the research implements the 8Ds method to reduce machine downtimes caused by bottlenecks.Machine downtimes caused by bottlenecks were significantly reduced.
Pachecho-Pacheco [40]The research seeks to optimize delivery times of alteration clothing (Alto de basta and Alto de camisa) products in a tailor shop by implementing the 8Ds method.Production times decreased by 2.46%, for Alto de basta products (i.e., from 13.30 min to 12.98 min), and by 21.16% for Alto de camisa products (i.e., from 8.49 min to 6.69 min).
In both products, delivery delay times decreased by 33.33%: from 3 days to 2 days.
Table 2. Satisfaction scale of positive and negative comments.
I Don’t Like ItI Can Live with ItI Am NeutralIt Must Be This WayI Like It Very Much
Product or service attributeWithout the attribute10.50−0.25−0.5
With the attribute−0.5−0.2500.51
Table 3. Task assignment.
The 8Ds MethodologyPDCA CycleTeamwork Member
Develop the teamwork (D1)PlanMaintenance engineer
Describe the problem (D2)
Develop an interim containment action (D3)Do
Define and verify root causes (D4)Production line manager
Develop permanent corrective actions (D5)Intern engineer
Implement and validate corrective actions (D6):CheckQuality inspector 1
Prevent recurrences (D7):ActQuality inspector 2
Recognize and congratulate the teamwork as well as individual contributions (D8):All involved employees
Table 4. Defects found in the rejected cable assemblies.
DefectFrequencyPercentageCumulative Percentage
Inverted cables3552%52%
Disfigured motor1015%67%
Noisy motor913%81%
Motor does not work710%91%
Lack of ID tag46%97%
Wrong cable length23%100%
Total67100%
Table 5. Comparison of the main indicators before and after applying the 8Ds method.
IndicatorBefore Implementing the 8Ds MethodologyAfter Implementing the 8Ds MethodologyDifference
Total defects6716−76.12%
Time for the production process of part number A7.28 min4.61 min−36.68%
Time for the inspection and packing of part number A6.5 min4.28 min−34.22%
Customer complaints670−100%
Machines stoppages155 min/day35 min/day−77.42%
Production850 products/day1141 product/day+34.22%

