1. Introduction
Cities and energy play a key role in solving the environmental crisis [
1], and building energy efficiency has received a widespread interest. More than 1/3 of the total global energy consumption can be attributed to the building and construction sectors [
2]. According to the research report released by CABEE (China Association of Building Energy Efficiency) in 2018, building energy consumption is 20.6% of the country’s total energy consumption, statistical data also shows that public buildings and urban residential buildings account for the two highest proportions of building energy consumption, each with a percentage of 38% [
3]. Besides, the energy consumption per unit floor area in public buildings is more than twice as much as that in residential buildings [
4]. Hence, energy efficiency of buildings especially public buildings needs to be optimized.
To reach the best possible solutions that will ensure the maximization of the building energy efficiency and satisfy the needs of the building’s final user/occupant/owner simultaneously [
5], designers have to make tradeoff decisions among environmental, energy efficiency, financial and occupant comfort performance. In the early stage, architects relied on previous experience and building performance simulation to find the best possible building design solutions. The trial-and-error approach is too time-consuming to be practical [
6]. Thus, some researchers tried to introduce optimization techniques, which can greatly improve the design efficiency and support designers to find the optimal design [
7]. In a conventional building performance optimization study, an automated process can be achieved by the coupling between building simulation tools and an optimization engine [
8]. This method is known as Building Performance Simulation (BPS) based optimization. As multiple performance objectives involved in building design usually have conflicts with each other, the improvement of one objective often leads to the decline of other objectives. Multiobjective optimization is introduced and widely adopted as it can simultaneously improve more than one building performance objectives. Through BPS based multiobjective optimization, designers can explore complex performance trade-offs in building design, consider the effect of design changes on multiple performance objectives as well as search for optimal solutions in design space [
9].
Previous studies have used the BPS based multiobjective optimization method during the building design process to optimize the performance related to building energy efficiency, environmental impact, daylighting, thermal comfort, cost, etc. In 2010, Tuhus-Dubrow and Krarti adopted a genetic algorithm to minimize energy use and life-cycle cost of residential buildings, and investigated various building forms as well as building envelope parameters [
10]. In 2012, Fesanghary et al. proposed a multiobjective optimization model based on the harmony search algorithm and optimized the envelope parameters of a residential building to minimize the life cycle cost and carbon dioxide equivalent emissions [
11]. In 2013, Lartigue et al. selected the window to wall ratio (WWR) and the window type as decision variables, optimized the heating load, cooling load and daylighting performance of a dormitory room [
12]. In 2015, Méndez Echenagucia et al. optimized the number, position, shape and type of windows and the thickness of the masonry walls to minimize the heating, cooling and lighting energy of an open space office building [
13]. In the same year, Rahmani Asl et al. developed a building information modeling (BIM)-based performance optimization (BPOpt) framework and demonstrated the use of BPOpt in minimizing the energy consumption while maximizing the appropriate daylighting level for a residential building, the decision variables were seven parameters related to windows and curtain panels [
14]. In 2016, using idealized mass models of commercial buildings, Konis et al. optimized the daylighting and building energy consumption by varying building forms and WWR parameters [
15]. In 2017, Zhang et al. optimized the minimal energy use for heating and lighting, minimal summer discomfort time, and maximal Useful Daylight Illuminance (UDI) of typical classrooms in the cold regions of China through optimization process [
16]. In 2018, Toutou et al. studied a residential building to find the best building parameters such as WWR, construction material, glass material and shading device configurations, which lead to the optimum performance in daylighting and energy performance [
17]. The current trend indicates that building performance optimization has been increasingly deployed both in building academia research and practice [
18].
However, the above studies usually optimized two or three building performances, and the number of objective functions was rarely larger than three. The limitation lies in the BPS based objective evaluation model, which is time-consuming [
19]. As the number of objectives grows, the complexity and the time required for searching solutions will increase exponentially. Multiobjective problems with four or more objectives are often referred to as many-objective problems [
20], and practical projects especially large-scale public building design projects often involves such problems because of the complex nature of the building optimization problems. To solve the many-objective optimization bottleneck problems in building design, many researchers have explored methods of coupling surrogate models with optimization tools to improve the efficiency of searching techniques for large-scale building optimization problems [
8]. Artificial Neural Networks (ANNs) are effective tools that can solve intricate nonlinear problems, especially where classical mathematical modeling processes fail to succeed [
21], and are the most commonly used surrogate models for objective evaluation in building performance optimization process.
In 2013, Gossard et al. coupled an ANN and non-dominated sorting genetic algorithm II (NSGA-II) to optimize the annual energy consumption and the summer comfort degree of a dwelling in two French climates, and selected different thermal properties of the building envelope as decision variables [
22]. In 2015, Yu et al. used back-propagation (BP) neural network optimized by genetic algorithm (GA) to evaluate the energy consumption and indoor thermal comfort during the optimization process of typical residential buildings [
23]. In 2016, Azari et al. combined GA with an ANN to explore optimum building envelope design with respect to energy use and life cycle contribution to the impacts on the environment in a low-rise office building [
24]. In 2018, using the ANN model and NSGA-II algorithm, Gou et al. optimized the passive design of newly built residential buildings in China for improving indoor thermal comfort while reducing building energy demand [
25]. In 2019, Si et al. optimized the window types and the eave shape of a tourist center in China to improve building energy efficiency and indoor thermal comfort, and developed an ANN model for building performance prediction [
26]. Li et al. tested the performances of three building optimization strategies, including two BPS based methods and an ANN based, the ANN based method was proved to have the shortest execution time [
27].
Even so, there are still few researches on building many-objective optimization. When faced with many-objective problems, the most widely adopted building multiobjective optimization algorithm, NSGA-II, shows a severe deterioration on the convergence property [
20]. In addition, most of the researchers developed ANN models in MATLAB, which is a non-architectural platform and requires a computer coding ability. The dilemma is that a traditionally trained architect’s design decisions have a great impact on building performance, but they are not familiar with optimization algorithms and complex programs, let alone computer coding [
28]. So, in the typical building optimization design workflow, building optimization is kind of separated from the design process. An architect proposes a building design first, hands it to engineers or optimization experts to be optimized and then modifies the design based on the optimization results. This process, along with the difficulty in converting between different software models, is a severe limitation for architects to create a design loop in which timely performance feedback can effectively influence overall building forms [
29]. Since the application of building multiobjective optimization requires extensive mathematical and computer programming knowledge [
30], teaching architectural students and designers the basics of building performance simulation and optimization is necessary and can alleviate this dilemma. From a researcher’s perspective, it is necessary to enable architects optimize building design in traditional architectural parametric modeling tools and get timely performance optimization feedback during the building design process. To sum up, the limitations in previous studies can be summarized as follows:
Few studies have explored building many-objective optimization design problems, either through BPS based optimization or ANNs based. The BPS based optimization method can be extremely slow when faced with many-objective problems, while the existing ANN based methods require strong programming skills of coupling multiple algorithms in different software to achieve building many-objective optimization.
Most buildings in the case studies were residential or office buildings, and few large-scale public buildings. The foremost reason is that the design of a large-scale public building is highly complex and flexible, and it is very difficult to model the building for performance simulation, the optimization process also takes longer. However, the energy saving potential in per unit area of public buildings is greater, so performance optimization of public buildings is even more necessary.
Many studies have used simple hypothetical buildings or oversimplified building models. The hypothetical and simplified modeling methods can reduce the difficulty of building energy simulation modeling and shorten the optimization time, but are very likely to be far from the actual situation.
A lack of architect-friendly software and tools, not to mention an integrated many-objective optimization workflow, which is efficient and architect oriented. In most of the existing studies, optimization process has not been integrated with the building design modeling process. Although in recent years, more and more studies have achieved BPS based multiobjective optimization cases on an architectural parametric modeling platform [
14,
15,
16,
17], but the slow feedback of the optimization results still can be a bottleneck.
Confronted with the limitations above, this paper aims to propose an architect oriented ANN based many-objective optimization design method to improve the energy, daylighting and cost performance of a large-scale public building. A model fitting the actual building design characteristics was developed for simulation and optimization. In addition, an architect-friendly integrated workflow was implemented based on the architectural parametric modeling platform of a Rhinoceros and Grasshopper.
2. Methods
2.1. ANN based Many-Objective Optimization Design Workflow
The ANN based many-objective optimization design method includes three subprocesses: optimization design problem determination, ANN prediction modeling and many-objective optimization, as shown in
Figure 1.
Firstly, the designer should determine the optimization objectives, decision variables and constraints according to the conditions and requirements of the building design case. In this paper, Energy Use Intensity (EUI), Spatial Daylight Autonomy (sDA), Useful Daylight Illuminance (UDI) and Building Envelope Cost (BEC) were defined as four objectives to improve the energy, daylighting and cost performance of a large-scale public building. Ten building envelope design parameters were selected as decision variables and each within a certain constraint.
Secondly, ANN models for EUI, sDA and UDI prediction were developed through four steps: step 1, Latin Hypercube Sampling (LHS) was used to get the samples of feasible solutions from the design space; step 2, a parametric simulation model was established based on the decision variables of the samples and with the consideration of objectives; step 3, energy and daylight simulations were performed for each sample and step 4, with the samples as the input data and the simulation results as the output data for ANN training, ANN models for EUI, sDA and UDI prediction were developed and trained. The prediction accuracy of the ANN models was optimized by minimizing the Mean Square Error (MSE) between the prediction and simulation results of the training data at the same time maximizing the correlation coefficients (R) between the prediction and simulation results of the validation data.
Finally, BEC was calculated by adding up the cost of walls, windows and roofs, and the calculation program along with the ANN prediction models were coupled with the optimization engine to obtain the non-dominated solution set.
To support the ANN based many-objective optimization design workflow, an optimization design model was developed based on the Rhinoceros and Grasshopper platform to achieve the process of ANN prediction modeling and many-objective optimization. Compared with MATLAB, modeFRONTIER, GenOpt and other non-architectural platforms, the Rhinoceros and Grasshopper platform has a friendly visual programming interface, and is widely used by architects. The proposed model is composed of five modules, which are the Latin Hypercube Sampling module, Parametric Simulation Modeling module, Energy and Daylight Simulation module, ANN Modeling and Training module and the Many-Objective Optimization module. Various software and plug-ins have been coupled with each other in the proposed model, as shown in
Figure 2.
Latin Hypercube Sampling module coupled Grasshopper components with the Design Space Exploration (DSE) plug-in, and a given number of samples that well represented the feasible solutions could be generated by performing LHS in the design space. The output data of this module was the decision variable values of the samples.
Parametric Simulation Modeling module coupled Grasshopper components with Honeybee plug-in, with the decision variable values of the samples as input data, a thermal zone model of the reference building could be built and sent to the Energy and Daylight Simulation module.
Energy and Daylight Simulation module coupled Grasshopper components, Ladybug and Honeybee plugin, energy simulation tool of EnergyPlus and daylight simulation tools of Radiance, Daysim. Energy and daylight simulation parameters were set by Grasshopper as well as Ladybug and Honeybee components, then simulations were performed with EnergyPlus, Radiance and Daysim. The output data of this module was the EUI, sDA and UDI values of the corresponding samples and was sent to the ANN Modeling and Training module.
ANN Modeling and Training module coupled grasshopper components, Crow and Octopus plug-ins. The decision variable values of the samples and the corresponding simulation results were used as input data of this module. ANN models were developed and trained by the Crow plug-in with the input data. Octopus plug-in was used to optimize the ANN models to ensure prediction accuracy.
Many-Objective Optimization module coupled grasshopper components, plug-ins of Octopus, Honeybee and Crow. The BEC value was obtained through the calculation program composed of Grasshopper and Honeybee components. The optimized ANN models were the load to the Crow plug-in and used to calculate the EUI, sDA and UDI values. Octopus plug-in was used as the optimization engine to search for optimal design solutions. As the search stopped, a set of non-dominated solutions were obtained and saved as the output data.
To sum up, the optimization design model integrated multiple software and plug-ins, could support the ANN based many-objective optimization design process with an architect-friendly interface. For the architects that already used different building optimization tools, the advantage of the proposed workflow is the emphasis on the accessibility and ease of use for architects. They can optimize building design through the familiar software interface, and can directly obtain the optimization feedback related to many building performance objectives without converting between different software models. In addition, the proposed workflow can be used in any stage of the building design process to improve the building performance, for example, the optimization of the building conceptual form design, facade design, envelope design, the selection of passive strategies, the selection of the heating, ventilation, and air conditioning (HVAC) system, etc.
2.2. Optimization Design Problem Determination
During the building optimal design process, a large number of decision variables (orientation, floor height, WWR, envelope properties, etc.) and multiple building performance (energy consumption, carbon emission, daylighting, ventilation, thermal comfort, cost, etc.) need to be taken into account, which make the problem a complex many-objective optimization problem. The designer needs to define the optimization problems based on the conditions and requirements of building design cases. The more objectives are considered, the more complex the optimization problem will become. Besides, building performance indicators with negative correlations are recommended as optimization objectives first.
2.2.1. Reference Building
Due to the high complexity of building multiobjective optimization design problems, few researches have used the whole large-scale public buildings as reference buildings. To fill the research gap, this study carried out a many-objective optimization experiment in the design stage of a school library building to generate a better design option. The building is located in Changchun (43.88N, 125.35E), a city in the severe cold region of China. In most actual building design projects, despite the need for architects and owners to improve building performance, they do not want to compromise on the basic building form and the layout design. So, the optimization process was done based on the initial form and layout design of the building, which adopts a symmetry form along the east–west axis, as shown in
Figure 3, and an atrium exists in the middle of the building. There are 5 floors in the building, the area of a standard floor is about 6200 m
2 and the atrium area is about 300 m
2. Different types of vertical strip windows and large arched windows are assigned on the walls to form a rhythmic façade, and there are also skylights on the roofs.
2.2.2. Optimization Objectives
This study aimed at reducing building energy consumption and financial cost while ensuring the maximization of indoor daylight quality. The energy consumption is known to have a conflict with daylighting quality in the severe cold region. Commonly, less energy will be consumed by reducing the WWR value, but there is a high possibility of a worse daylighting quality. Bringing daylight into the indoor environment has a significant effect on the occupants’ health and well-being [
31], especially in the library as the reading environment can be highly improved by well-designed daylighting. The building envelope plays a key role in improving building energy efficiency and daylighting quality, many researchers have focused on building envelope optimization. As financial factors are considered, the design of the building envelope becomes more complex, and a balance must be found between the capital cost and energy efficiency of the building envelope [
10]. Therefore, in this study the optimization objectives were to minimize the Energy Use Intensity (EUI), maximize the Spatial Daylight Autonomy (sDA), maximize the Useful Daylighting Illuminance (UDI) and minimize the Building Envelope Cost (BEC). As explained above, incorporating dynamic building simulation in the optimization process is inefficient and complex, so the objective functions related to the building performance simulation were calculated according to the values predicted by ANN models. The specific objective functions were set as follows:
Energy Use Intensity (EUI)
EUI was defined as the annual energy consumption per unit area of the buildings, with a metric of kWh/m
2 [
15]. Annual cooling load, annual heating load, annual artificial lighting load and annual equipment load of the building were considered. The lower the EUI value is, the better the building energy performance will be. The relevant objective function can be described as:
Spatial Daylight Autonomy (sDA)
sDA is defined as the percentage of floor space where a minimum light illuminance level can be completely met by daylight for 50% of the working hours [
16]. sDA considers not only the temporal but also the spatial dynamics of daylight in buildings [
32]. In this study, 300 lx is chosen as the minimum daylight illuminance level for sDA. With a higher sDA value, more floor area will meet the daylight illuminance of 300 lx during the analysis period, and the relevant objective function can be described as:
Useful Daylighting Illuminance (UDI)
UDI is defined as the annual occurrence percentage of daylight illuminances that falls within a given range at the given points [
33]. The lower threshold of UDI is 100 lx and incorporates an upper threshold of 2000 lx. Daylight illuminances less than 100 lx are generally considered insufficient for the occupants, and higher than 2000 lx will lead to glare and unwanted solar gains. A higher UDI value indicates a better daylighting performance. The relevant objective function can be described as:
Building Envelope Cost (BEC)
In this study, BEC includes three parts: the exterior wall cost, the exterior window cost and the roof cost. The optimization process aims to minimize the BEC value and the relevant objective function is:
where C
wall is the index for the cost of exterior walls, C
window refers to the cost of window panels and C
roof refers to the cost of roofs. C
wall, C
window and C
roof are calculated by multiplying the corresponding unit price and the area of exterior walls, window panels and roofs respectively.
2.2.3. Decision Variables and Constraints
The building envelope has significant impacts on the building energy, daylight and cost performance [
24]. Compared with residential buildings, the fenestration of public buildings has less limitations and the WWR values are relatively higher, which lead to more energy consumption. In this study, 10 building envelope decision variables were selected as decision variables, as shown in
Table 1. Considering that the building is a public library, the range of the floor height variable was set to vary from 3.9 to 6.0 m. According to the original building façade design, windows on the façade were classified into different types according to their shape and size. The widths of five types of windows were selected as decision variables, and each was given a constraint based on the original façade design rules. The widths of the skylights of the building were also selected as decision variables and were distinguished into two types. The one on the flat roofs was constraint to 0.5-1.5m, and the other on the sloped roof was constraint to 1.0-7.5m. The variables related to windows and skylights have been marked in
Figure 4.
Different types of building envelope constructions are varied in thermal, optical as well as cost properties, and the thermal properties often conflict with the cost property, which will lead to a conflict between energy and cost performance. In this research, wall construction type and window panel type of the building envelope were also selected as decision variables. As the reference building is located in the severe cold region of China, the U-value of the exterior wall was recommended to be between 0.45 and 0.5 according to the Design Standard for Energy Efficiency of Public Buildings (GB50189-2015) in China [
34]. A typical composite wall construction was selected from the book of public building energy conservation structure charts (06J908-1) [
35], and set to be the basic wall construction. From the exterior to the interior there were five layers including decorative brick layer, air space layer, insulation layer, 250 mm concrete block layer and 15 mm gypsum layer. The insulation layer was set to be varied on the material type and thickness, so that the different thermal and price properties can be assigned to the basic wall construction, as shown in
Table 2. The average R-value in this table is a measurement of the wall thermal resistance and the average U-value refers to the heat transfer coefficient of the wall. The unit price of the wall was calculated based on the local engineering information supervision platform. Nine types of walls with different insulations were explored by the optimization algorithm, the variable values correspond to the integer of 0–8. In terms of window constructions, 4 types of window panels including double pane of clear glass, triple pane of clear glass, single silver low-e coating glass and double silver low-e coating glass were selected, which can be presented by the integer of 0–3. The thermal, optical and price properties of different window panel types are shown in
Table 3. The U-value in this table refers to the heat transfer coefficient of the window. The SHGC is the abbreviation of the solar heat gain coefficient, which measures the fraction of the external solar radiation admitted through a window or skylight. The lower the SHGC value is, the less solar heat it transmits and the greater shading ability it has. The VT is the abbreviation of the visible transmittance, which is an optical property that indicates the fraction of visible light transmitted through the window.
2.3. ANN Prediction Modeling
2.3.1. Latin Hypercube Sampling (LHS)
The design space refers to the range of all possible values of decision variables, and the optimization algorithm needs to search in the design space for the optimal design solutions. To improve the accuracy of ANN model, a dataset that covers the design space need to be generated for ANN training and validation. A good coverage of the design space can be achieved with a small sample by adopting Latin Hypercube Sampling (LHS) [
26], which is a stratified random sampling method. According to Gou et al., a sample size of 1.5–10 times of the number of input variables is enough when using this method [
25].
In this study, 200 samples were generated by LHS, as 20 times of the number of the decision variables, and the process was completed by the Latin Hypercube Sampling module as shown in
Figure 5. The Grasshopper plug-in named Design Space Exploration (DSE) was used for sampling in this module. The sampler component of the DSE can automatically generate a nested list of decision variables that span the design space being explored based on the selected sampling technique [
38]. There are three optional sampling methods, namely, random sampling, grid sampling and LHS, which were adopted in this study. The generated samples were indexed by the order to be output into other program modules.
2.3.2. Parametric simulation modeling
In this study, building energy simulation and daylight simulation were performed to generate the ANN training and validation dataset. A parametric simulation model was developed with the Grasshopper and Honeybee components. First, thermal zones were defined according to different design conditions. The functional areas in a typical floor plan including reading area, book storage area, office area and auxiliary areas for stairs, elevators, restrooms, machines, etc. and an atrium was inserted through every floor.
Figure 6 illustrates that a typical floor plan was divided into 10 zones, namely, zone A-I, and an atrium zone. All of the 5 floor plans share the same zone division pattern, and the floor numbers 1-5 was used as suffixes for zone names of zone A-I to distinguish zones of different floors. There were 46 zones of the 5 floors and all of them were set to be conditioned zones. In addition, there were 3 unconditioned zones to modeling the tower above the fifth floor.
Later, thermal zones with windows or skylights were modeled by the Parametric Simulation Modeling module as shown in
Figure 7. The zone geometry surfaces and masses were created by the grasshopper components and the height of each zone was set to vary with the floor height variable. Then the zone geometry model was sent to the Honeybee components (createHBSrfs, createHBZones and Masses2Zones) to generate thermal zones. A zone program template of the SecondarySchool: Library was assigned to the zones and the status of whether the zone was conditioned or not was defined respectively. Instead of generating windows simply by WWR, parametric window geometry surfaces were first created by grasshopper components and then added to the zones by the Honeybee component. Skylights were added on the specific roofs in the similar way. After the window and skylight objects were added, all the zones were sent to the Energy and Daylight Simulation module to be simulated.
2.3.3. Energy and Daylight Simulation
Before energy simulation, a HVAC system template of ideal air loads was assigned to the conditioned zones by the Honeybee_HVACSystem component. This HVAC template can be thought of as an ideal unit that mixes air at the zone exhaust condition with the specified amount of outdoor air and then adds or removes heat and moisture at 100% efficiency in order to produce a supply air stream at the specified conditions [
39]. Zone loads and schedules of the conditioned zones were set by the components of Honeybee_setEPZoneLoads and Honeybee_setEPZoneSchedules. The ventilation, people, lights and equipment parameters of each conditioned zone can be seen in
Table 4. Zone schedules of occupancy, ventilation, lighting, equipment, heating set point and cooling set point were defined to be distinguished on working days and holidays, based on the energy simulation schedules for school buildings on the China Design Standard for Energy Efficiency in Public Buildings (GB50189-2015) [
34]. The zone schedules on working days can be shown in
Table 5, while during all time periods of the holidays, occupancy rate, lighting and equipment usage rate were set to be 0%, the ventilation system was set to be off, the heating set point was 37 °C and the cooling set point was 5 °C.
After the zone load and schedule parameters were assigned, the optional wall constructions and window constructions of the building envelope need to be created and written to the EnergyPlus (EP) construction library. The EP constructions were defined by construction names and layers of different materials, the materials not existing in the material library were created by assigning names and properties first and then used to create EP constructions. After being written to the library, the wall constructions and window constructions were indexed according to the decision variable values of the wall construction type and window panel type, the corresponding constructions were called from the library and assigned to the simulation model.
Other energy simulation parameters including the location and annual weather information of Changchun city, which can be obtained from the website of U.S. Department of Energy by downloading the EnergyPlus Weather (EPW) file [
40]. The simulation analysis period was set from 1 January to 31 December. The type numbers of the wall construction and window construction were altered automatically to the corresponding values of another design sample after one simulation run. The simulation time step was 6 per hour and zone energy use of cooling load, heating load, electric lights and equipment was set to be the output data for EUI calculating.
Daylight simulation is time-consuming, so the test grid was not arranged on all of the zones. Zone A can have enough daylight with big windows and the atrium nearby, Zone E and H rely largely on artificial lights because of a long distance for daylighting, so Zone B, C, D, F, G and I of the third floor were chosen for creating daylight analysis grid. The EPW file was input again, the daylight analysis grid was set as 1 m × 1 m, and was 0.76 m from the floor as the typical height of working plane is 0.76 m. The daylight simulation analysis period was also set from 1 January to 31 December. A Daysim occupancy file was generated in which the daily occupied hours were set to from 7 to 18. Then daylight simulation was performed and sDA, UDI values were calculated by the simulation results.
The workflow described above was completed by the Energy and Daylight Simulation module, as shown in
Figure 8. The EUI, sDA and UDI values of the samples were obtained in this module, and output to the ANN Modeling and Training module.
2.3.4. ANN Modeling and Training
Before developing the ANN models, the 200 groups of samples were normalized and divided randomly into two parts: 120 groups of training data and 80 groups of validation data. The Crow plug-in is an architect-friendly ANN modeling tool, which offers the Backpropagation (BP) algorithm for ANN training, only 3 parameters of the Layer Structure (LS), Neuron Count (NC) and Learning Rate (LR) were used to develop an ANN model, also a training cycle (C) parameter needs to be defined for ANN training.
However, manual adjustments of these parameters still lead to a high probability of inaccurate prediction models. To improve the ANN modeling efficiency and ensure high precision, a multiobjective optimization process was performed using the Octopus plug-in. Octopus adopts the Strength Pareto Evolutionary Algorithm 2 (SPEA2) in combination with the Hypervolume Estimation Algorithm (HypE) for multiobjective optimization. The SPEA2 algorithm is a robust and efficient multiobjective evolution algorithm (MOEA), sharing a similar performance with the widely adopted NSGA-II algorithm [
41]. HypE algorithm, which is based on the hypervolume indicator, is highly effective for many-objective problems in comparison to existed MOEAs [
42]. As there were two objectives, namely, the minimized Mean Square Error (MSE) between the prediction and simulation results of the training data as well as the maximized correlation coefficients (R) between the prediction and simulation results of the validation data, the SPEA2 reduction method was chosen to combine with the default mutation strategy in the optimization process. The NC, LR and C parameters of the ANN were optimized, and the LS parameter was not considered by the optimization process, as the structure of the 0—sigmoid layer performed significantly better than the other options in this case and was set as a fixed parameter. Considering that the optimization engine always tries to minimize objective function values, MSE and 1/R were used for evaluation of objectives. When the optimization engine stopped, a trained ANN prediction model could be obtained. A preliminary experiment suggested that developing an ANN model for each objective could achieve higher prediction accuracy than one ANN model for three objectives in this case. Hence, three ANN models of EUI, sDA and UDI were trained and optimized, and then saved as the output data in the .cnw file format. The ANN Modeling and Training module is shown in
Figure 9.
In this study, the final MSE values, which represent the average squared difference between the ANN prediction results and the simulation results of the training data, were 0.001 for EUI, 0.0009 for sDA and 0.001 for UDI. The MSE results indicated that the ANN models could perform well on the prediction ability. The reliability of the prediction models was further verified by the regression between ANN prediction results and EnergyPlus simulation results of the validation data, as shown in
Figure 10. The R values of EUI, sDA and UDI were 0.973, 0.986 and 0.983 respectively, which proved that the prediction results were in agreement with the simulation results and the ANN models were good enough to surrogate the energy and daylight simulation models.
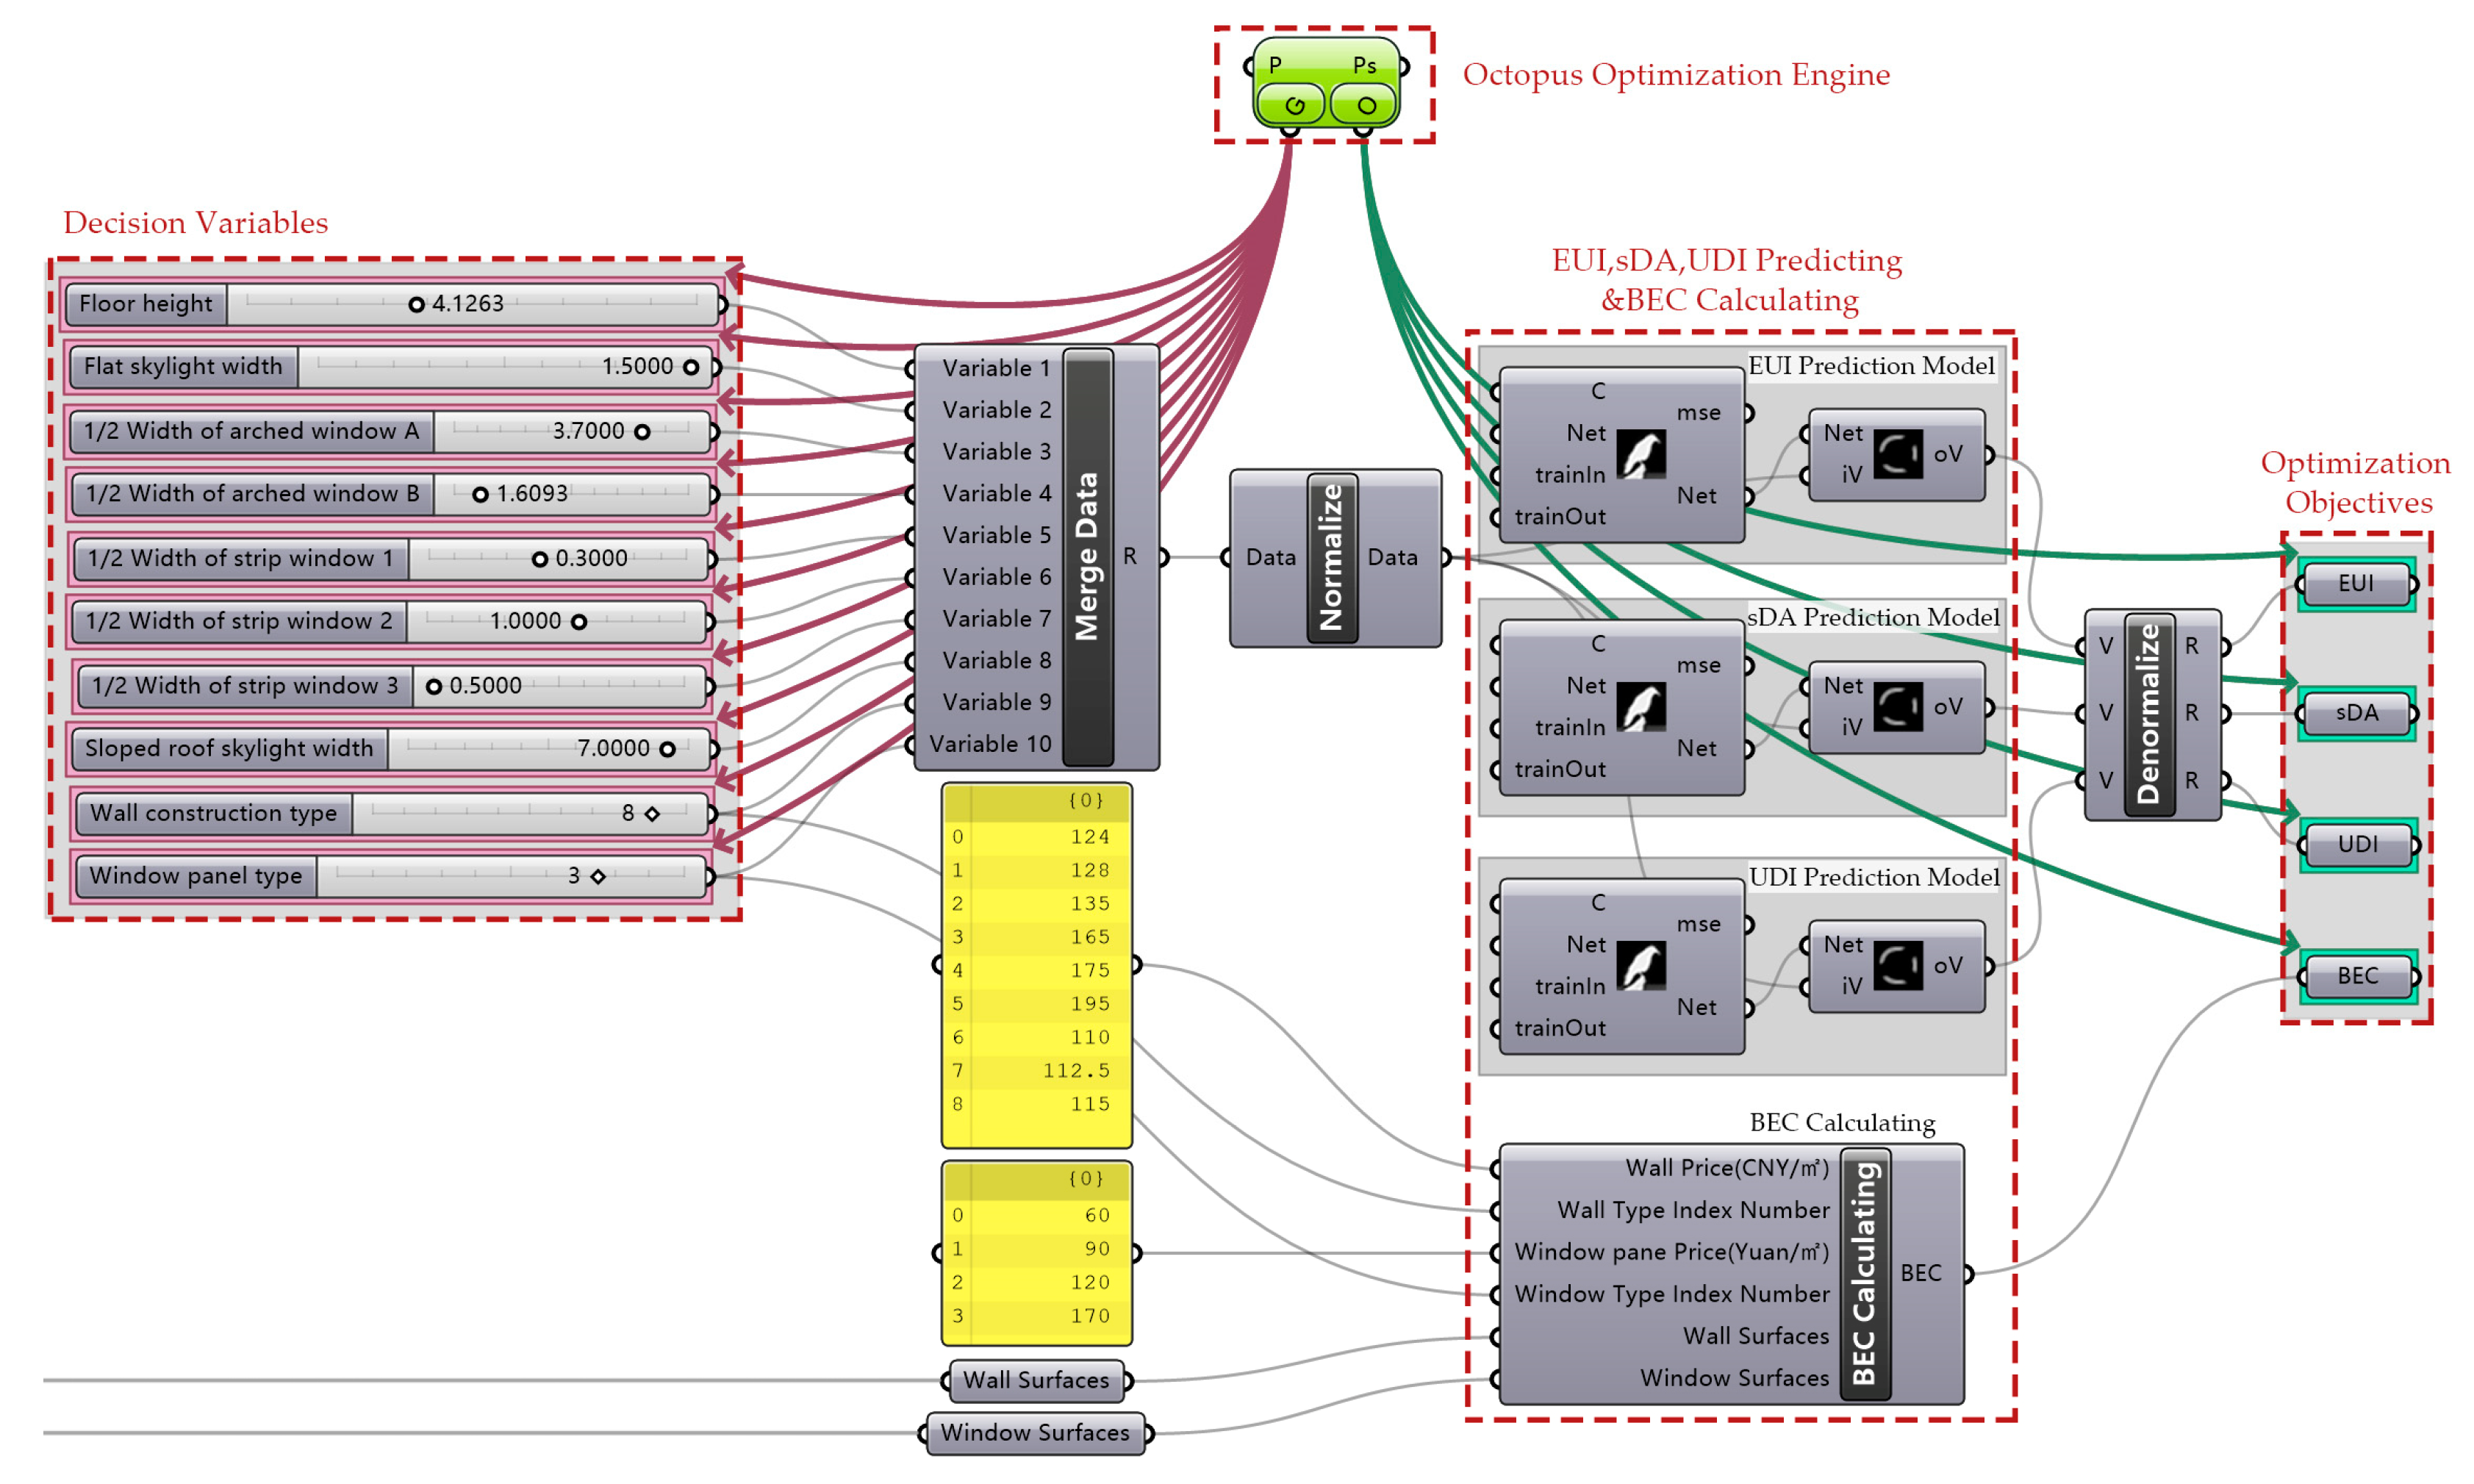
2.4. Many-Objective Optimization
The ANN prediction models were used to calculate the objective function values of EUI, sDA and UDI, the .cnw files of the ANN models were loaded into the platform and coupled with the optimization engine. The objective function values of BEC were calculated with the zone geometry model. The HypE algorithm in the Octopus plug-in was adopted for the many-objective optimization. The optimization algorithm can select, cross, mutate and recombine the values of decision variables, and adopts the elitism strategy in the iteration process. The hypervolume indicator was introduced to judge the dominant relation of different solutions, so as to balance the performance between convergence and distribution in high dimension. In the optimization process, settings of the algorithm were 0.500 for elitism, 0.200 for mutation probability, 0.900 for mutation rate, 0.800 for crossover rate and the population size was set to 100. The optimization process was achieved by the Many-Objective Optimization module, as shown in
Figure 11.
3. Results and Discussions
After an optimization search of 50 generations, the 176 non-dominated solutions in the last generation showed a tendency of convergence, as shown in
Figure 12. The three axes of the 3-D scatter plots represent BEC, sDA and UDI values respectively, and the colors of the boxes indicate the EUI values. Non-dominated solutions with higher EUI values are drawn as red boxes and those with lower EUI values are drawn as green, which also indicate a better EUI performance. The closer the boxes are to the origin, the better the sDA, UDI and BEC performance will be. The gray-green boxes represent the feasible solutions in different generations. With the number of iteration rises, the gray-green boxes become darker, and the value distribution range get closer to a surface composed by non-dominated solutions. The non-dominated solutions with higher sDA values suggest a decrease tendency in UDI values and an increase tendency in EUI and BEC values, which demonstrates that sDA has certain contradictory relationships with the other three objectives.
To further understand the relationship between four objectives and the distribution characteristics of the non-dominated solutions, a matrix plot was drawn as
Figure 13. The upper triangular part of the matrix is composed of the correlation coefficients calculated between different objectives of the non-dominated solutions while the lower triangular part of the matrix is composed of the 2-dimensional scatter plots in objective space. The diagonal part of the matrix shows the distribution of the non-dominated solutions in each objective dimension. The results suggest that the non-dominated solutions tended to be evenly distributed in the EUI range, more non-dominated solutions were distributed in the range where sDA was greater than 90%, UDI was around 60% and BEC was less than ¥2.5×10
6 (
$3.6×10
5), which proved that the optimization process could achieve tradeoffs between different objectives.
The correlation coefficients in the upper triangular part suggest that there was a significant positive correlation between sDA and EUI, with an R value of 0.680. The scatter plot between sDA and EUI also verifies that with an increase in sDA values, EUI values tended to be higher. That is to say, a better sDA performance may lead to a worse EUI performance, which can be attributed to that both objectives are very sensitive to WWR parameters as well as the window thermal and optical properties. As the reference building is located in severe cold region, the correlation between the WWR value and the energy consumption is very strong. According to the research results obtained by Méndez Echenagucia et al. [
13], a lower WWR value can cause less heating and cooling requirement but more lighting requirement in cold region of Frankfurt and Oslo, but in the hot region of Palermo and Torino a lower WWR value can cause less cooling requirement but more heating and lighting requirement. The conflict relationship between building energy consumption and daylighting is obvious in cold regions. On the other hand, it also explains the importance of WWR parameters while designing buildings in cold regions. In addition, windows with lower U values will have a better thermal performance, but in which case the SHGC and VT values of them are often lower, the conflict between window thermal and optical properties can also lead to a contradiction between sDA and EUI.
As shown by the correlation coefficient between sDA and UDI, there was a significant negative correlation between the two objectives, with an R value of -0.623. When we focus on the scatter plot of the two objectives, the correlation seems to be more complicated and nonlinear. As sDA increased, UDI showed an increase tendency as well in the initial stage, but the reduction tendency of UDI became more and more significant with sDA attained a higher level. The reason is that sDA only has a minimum illumination limit of 300 lx. Indoor daylight illumination levels above 300 lx will be considered to meet the lighting requirements of the environment, and are used for sDA calculation. Except for a minimum illumination limit of 100 lx, UDI also adopts an upper illumination limit of 2000 lx. When daylight illumination level exceeds 2000 lx, UDI will take it as unwanted and may cause visual and thermal discomfort for the occupants. So, daylight illumination above 2000 lx is not taken into consideration in the UDI calculation. Judging the daylighting performance by just one indicator is not enough, so both of the sDA and UDI values need to be improved to achieve a better visual comfort environment.
The correlation coefficient between EUI and BEC was 0.602, and the two objectives seemed to be positive correlated. However, EUI and BEC are supposed to have a negative correlation under normal circumstances. The reason is that most of the wall constructions of the non-dominated solutions adopted the expanded polystyrene board in the insulation layer as a result of optimization. This kind of insulation material is more cost-effective compared to other options, and a better thermal performance can be obtained at a relative low cost level. In addition, most of the non-dominated solutions adopted the double silver low-e coating glass window, which is relatively expensive. Therefore, when this type of window construction was used, the BEC could be higher as the window area was larger, and the increase of window area also caused the increase of EUI, so there was no contradiction between EUI and BEC in this case.
The correlations between the other pairs of objectives were less significant. The relationship between EUI and UDI was nonlinear, the R value between the two objectives was -0.445, and from the scatter plot we can see that UDI increased at the initial stage but tended to decrease later with EUI increased, which suggest that the two objectives were contradictory when the EUI value was at a low level. The R value between sDA and BEC was 0.430, and from the scatter plot of the two objectives we can also observe a nonlinear relationship between them. As sDA increased, BEC didn’t change much at first, but when sDA values reached a higher level, the growth of the BEC value accelerated, which suggests that sDA and BEC had a contradictory relationship in the range where sDA value was high. The correlation coefficient between UDI and BEC was lowest, with an R value of -0.354, from the scatter plot we can see that the non-dominated solutions were more densely distributed in the range where BEC was lower and UDI was higher, which demonstrates that the two objectives were not contradictory to each other.
The comparison between the distribution range of the samples and that of the non-dominated solutions can be shown in
Figure 14, the EUI values (unit: kWh/m
2) of the samples were concentrated between 199.2 and 203.7, with a median of 201.6. The EUI values of the non-dominated solutions were centrally distributed between 196.6 and 203.3, with a median of 199.1. The sDA values (unit: %) of the samples were centrally distributed between 79.1 and 89.4, with a median of 84.1. The sDA values of the non-dominated solutions were centrally distributed between 82.2 and 95.1, with a median of 89.5. The UDI values (unit: %) of the samples were centrally distributed between 55.5 and 58.7, with a median of 57.1. The UDI values of the non-dominated solutions were centrally distributed between 56.6 and 60.9, with a median of 59.5. The BEC values (unit: ¥) of the samples were centrally distributed between 2.36×10
6 and 2.90×10
6, with a median of 2.66×10
6. The BEC values of the non-dominated solutions were centrally distributed between 2.03×10
6 and 2.35×10
6, with a median of 2.20×10
6. As the samples can represent the feasible solutions, the results indicate that the overall performance of the non-dominated solutions was better than that of the feasible solutions, which proved that the proposed method was highly effective.
Three relative optimal solutions were selected from the non-dominated solution set, which have achieved high performance and tradeoffs among four objectives. The decision variables of the original design and the relative optimal solutions are shown in
Table 6, while the optimization objectives of them are shown in
Table 7. From
Table 6 we can see that the decision variables of the original design were obviously different from that of the relative optimal solutions, but the three relative optimal solutions had more similarities with each other. The H in this table refers to the floor height variable. The window and skylight variables were the flat skylight width (W), widths of arched window A (W
a) and arched window B (W
b), widths of strip window 1 (W
1), strip window 2 (W
2), strip window 3 (W
3), as well as sloped roof skylight width (d). T
wall refers to the wall construction type, the integer 0 represents that the insulation layer of the wall is the rock wool board (65 mm), integer 6 is for the expanded polystyrene board (60 mm) and integer 8 is for the expanded polystyrene board (80 mm). T
win refers to the window panel type, integer 0 under this column represents the double pane clear glass window and integer 3 represents the double silver low-e coating window.
Table 7 illustrates that the performance of the relative optimal solutions was evidently better than that of the original design in all aspects. The EUI value was reduced by 5.1–6.7 kWh/m
2, which means that 1.6×10
5–2.1×10
5 kWh energy could be saved per year. The indoor daylighting environment could be improved with an increase in sDA value by 8.1%–11.0% and an increase in UDI value by 4.3%–4.7%. Moreover, Building envelope cost (BEC) could be reduced by ¥1.2×10
5–2.1×10
5 (
$1.7×10
4–3.0×10
4).
The whole optimization process just took 2 h with the implementation of ANN prediction models. Only 200 groups of energy and daylighting simulations were performed, the number can rise to 5000 groups in a traditional BPS based optimization process with the same population size and generation number, which will take much longer time to complete. Though the time for energy simulation modeling of a large-scale public building has not been shortened much, the way of energy simulation modeling in architectural parametric modeling software can be easier for architects to practice. Moreover, by integrating the whole process in the Rhino + Grasshopper platform, the efficiency was further improved when manual data conversion time was saved.
Although Building Energy Simulation and Optimization is a research subject that has been extensively studied over the past two decades, it is not yet widely applied in the building design community [
43]. This research hopes to encourage more widespread and effective usage of building many-objective optimization by architects. There is still a long way to go for not all architects have enough knowledge of building performance simulation and parametric modeling. However, more and more architects will want to learn the knowledge as the concept of zero-energy buildings and high-performance buildings is increasingly popular. The open source learning materials of Rhino + Grasshopper, as well as all kinds of Grasshopper plug-ins and building performance simulation software are enough for architects to master relevant skills gradually.


