Featured Application
A novel, simple and environmentally friendly method was developed and optimize to produce a dietary fiber ingredient from Agaricus bisporus by-products, with suitable characteristics for food application and potential biological activity, as a mean for upgrading mushroom industry wastes.
Abstract
Mushroom production generates large amounts of by-products whose disposal creates environmental problems. The high abundance of biological active non-starch polysaccharides in mushroom cell walls makes these by-products attractive for dietary fiber-based ingredient (DFI) production. Traditional methods of dietary fiber preparation didn’t allow to obtain a DFI with suitable chemical and functional properties. In this work a simple and environmentally friendly method was developed and optimized for DFI production using a central composite design with treatment time, hydrogen peroxide and sodium hydroxide concentration as factors and chemical composition, chromatic and functional properties as dependent variables. The chemical composition of the DFI was strongly influenced by the process parameters and its functional and color properties were dependent on its fiber and protein content, respectively. The method developed is simple, uses food grade and low-cost reagents and procedures yielding a DFI with white color, no odor and a high concentration of dietary fiber (>60%) with an identical sugar composition to the original mushroom fiber. Due to the high water and oil retention capacity, this DFI may be used not only for dietary fiber enrichment and reduction of the food energy value but also as a functional ingredient with potential bioactivity.
1. Introduction
Mushrooms consumption and production over the last decades has shown a phenomenal growth with several times increase in tonnage [1]. Some of the more common cultivated mushroom species are the button mushroom (Agaricus bisporus) which is widely cultivated in Europe and comprising about 32% of the world mushroom production, the Shiitake mushroom (Lentinus edodes) which is grown for centuries in China and other oriental countries and the oyster mushroom (Pleurotus ostreatus) cultivated in several countries around the world [2]. This increase is related to the increasing awareness of consumers for the importance of a healthy diet [3,4]. Indeed, a variety of substances present in mushrooms have been shown to present beneficial biological effects, from these, polysaccharides comprising the β-D-glucans and heteroglucans are the best known and most potent mushroom-derived substances with antitumor and immunomodulating properties [5,6,7,8]. The fungal cell walls are composed by an alkali-insoluble structural skeleton mainly composed of β-(1→3)-glucan covalently linked to chitin [9,10], forming a chitin-glucan complex (CGC). Chitin and CGC have been shown to have very interesting biological activities [11,12,13,14,15]. In addition, several studies have shown that polysaccharides from a variety of mushrooms, including those of A. bisporus, have been successfully used as prebiotics [16,17,18,19,20,21,22].
Nevertheless, mushroom production generates a large amount of by-products including waste and off-grade mushrooms with no suitable commercial use that ranges between 5% and 20% of production volume [23]. Mushrooms and mushroom by-products, especially those from A. bisporus, are rapidly perishable products [24], and they suffer rapid and deleterious transformations resulting in darker products due to the tyrosinase activity and synthesis of melanins [25] and with an unpleasant smell, creating environmental problems for their disposal. The European regulation of waste management, Directive 2008/98/ EC (‘Waste Framework Directive’), focused on the reduction of waste generation by 30% in 2025, requires that waste should be managed without endangering human health and harming the environment, in particular without risk to water, air, soil, plants or animals, and without causing a nuisance through noise or odors [26]. To reduce the environmental impact of the agro-food industries and the dependence on raw materials, the implementation of valorization procedures for these materials is stimulated. Some strategies have already been evaluated, for example, the use of A. bisporus by-products for non-animal chitin and chitosan production [27]. Nevertheless, most of the methods employed for the extraction of fungal cell wall polysaccharides are tedious and time-consuming involving the use of high temperatures and high concentrated alkaline and acid solutions or using specific enzymatic treatment in combination with synthetic detergents [28,29,30,31]. In addition, the use of concentrated reagents can deteriorate the native properties of the obtained products [32]. The production of dietary fiber ingredients (DFI) has been successfully used to upgrade agricultural products and by-products of cereals, fruits, and vegetables [33,34], therefore, the production of a high added value food ingredient based on mushroom dietary fiber from by-products and off-grade mushrooms can be an economical alternative to the simple waste disposal. Nevertheless for the food industry, beyond their nutritional and health benefits, dietary fibers also have technological properties that can be used in food formulations, resulting in texture modification and enhancement of food stability during production and storage, and more importantly, added fibers cannot alter the sensorial properties of foods where they are used. Altogether, these factors will determine their successful use in foods.
The purpose of this work was to develop and optimize a simple and green method for the production of mushroom CGC enriched dietary fiber from A. bisporus off-grade mushrooms and in situation of excessive mushroom production, using a response surface methodology based on a central composite design to evaluate the influence of the process variables in the chemical composition, nutritional and functional properties to evaluate its suitability for use as a DFI in food formulations.
2. Materials and Methods
2.1. Materials
As the method developed in this work is intended to be used for the valorization of off-grade mushrooms with no commercial value and the excesses of mushroom production, for reasons of simplicity and easier management, the A. bisporus mushrooms were bought on the local market for obtaining the DFI. Samples were stored in dark conditions at 4 °C until experiments began for a maximum of one day. All reagents used were of analytical grade. All reported values, unless otherwise stated, are expressed on a dry weight basis and are the average values of the analysis of at least two different replicates.
2.2. Method for Preparation of Mushroom DFI
Preliminary experiments in our lab allow concluding (detailed later) that to obtain a food ingredient based on dietary fiber from mushrooms with good technological properties, i.e., with a white color and no aroma, an alkaline oxidative treatment using sodium hydroxide and hydrogen peroxide was the most appropriate, and this method was further optimized concerning the treatment time, sodium hydroxide concentration and hydrogen peroxide concentration (Table 1). For obtaining mushroom DFI, mushrooms (300 g) were sliced and ground in a Waring blender (3 min) and transferred to the treatment solution (1 L) whose composition was varied according to Table 1. The material was stirred at 300 rpm at room temperature (20–22 °C) during the time for each specific treatment. After the treatment, the solution pH was neutralized with concentrated sulfuric acid to pH 6–7, and hydrogen peroxide was destroyed by adding NaHSO3. The material was filtrated, re-suspended in water and filtered again. The material was freeze-dried and the solid was ground and weighted. The yield, chemical and functional properties of the prepared mushroom DFI were determined to evaluate the impact of the studied process parameters.
2.3. Dietary Fiber, Protein, Moisture, Lipids, Ash and Caloric Value Content of the DFI
Due to the expected presence of chitin in the DFI, the content and sugar composition of dietary fiber of the mushroom DFI was determined as non-starch polysaccharides (NSP) by the method of Englyst et al. [35,36], being determined by the sum of sugars released after acid hydrolysis, and quantified by anion-exchange chromatography with pulsed amperometric detection (HPAEC-PAD) [37]. Protein content was determined by quantification of the nitrogen content of the mushroom DFI after correction for the nitrogen from glucosamine present and multiplication by 6.25. The total nitrogen content of the DFI was determined by the Dumas method. Moisture, lipids and ash content of the mushroom DFI were determined according to AOAC [38]. Total carbohydrates were calculated by difference. Caloric values, on a dry basis, were computed using the Attwater coefficients [39], corrected for 2% of ash.
2.4. FTIR Analysis
A Unicam Research Series FTIR spectrometer was used. The spectra were recorded in the range of wavenumbers 4000–450 cm−1 with 50 scans being taken at 2 cm−1 resolution. Pellets were prepared by thoroughly mixing DFI sample or reference polysaccharides (chitin, chitosan, and curdlan) and KBr at a 1:200 sample/KBr weight ratio in a small size agate mortar. The resulting mixture was placed in a Perkin–Elmer manual hydraulic press, and a force of 15 tons was applied for 10 min. The spectra obtained were background corrected and smoothed using the Savitzky–Golay algorithm using PeakFit v4 (AISN Software Inc., Oregon, United States, 1995). Chitin from crab shells (Sigma), Chitosan 66% deacetylation degree (Sigma) and curdlan (Sigma) were used as reference polysaccharides.
2.5. DFI Chromatic Characteristics
The chromatic characteristics of the DFI were evaluated with a Chroma Meter CR-300 Minolta (Osaka, Japan). CIE Lab coordinates were obtained using D65 illuminant a 10 observer as a reference system. L*, a*, and b* parameters were calculated from the average of five color measurements. The equipment was calibrated with a white standard (L* = 97.71; a* = −0.59 and b* = 2.31).
2.6. Water Retention Capacity and Oil Retention Capacity
Water retention capacity (WRC) of the mushroom DFI obtained under the different experimental conditions was determined under external centrifugal force using the method described by Robertson et al. [40]. Fiber (~1 g) was hydrated in water (30 mL) for 18 h, centrifuged (3000× g; 20 min), drained, and dried. WRC was calculated as the amount of water retained per g of dry fiber residue. For determination of the oil retention capacity (ORC) of the mushroom DFI, the same procedure described previously was used, but instead of water 30 mL of corn oil were used.
2.7. Experimental Design
A rotatable central composite design of the experiments was performed with k = 3—treatment time, hydrogen peroxide and sodium hydroxide concentrations as independent variables. Central composite experiments consisted of three sets of experimental points [41]: (1) a factorial design with 2k points, k is the number of xi variables (factors) with coded levels +1 and −1 for each; (2) a star for 2k points, coded as +α and −α on the axis of the system at a distance of 2k/4 from the origin, that accounts for non-linearity; (3) central points, which are replicated to provide an estimate of the lack of fit of the linear statistical model obtained as well as the pure error of the experiments (due to unreliability in the measurement of the dependent variable) [42]. The main advantage of this methodology is to decrease the number of experimental trials needed to evaluate multiple parameters and their interactions. The established ranges were: sodium hydroxide concentration () 0.1–0.5 M, hydrogen peroxide concentration ()—1.5–4.5%, treatment time (T)—2–6 h. Table 1 shows the coded and uncoded experimental design.
2.8. Statistical Analysis
Data was fit to second-order polynomial Equation (1) for each dependent Y variable, through multiple regression analysis using Statistic® vs. 10 software.
Y=β0 + β1X1 + β2X2 + β3X3 + β4X12 + β5X22 + β5X32 + β7X1X2 + β8X1X3 + β9X2X3,
βn are regression equation coefficients and Xn the independent variables. Based on the predicted model equations surface plots were generated. The analysis of the variance was performed to determine the lack of fit and the significance of the effects of each of the three independent factors, using the mean square pure error as the error term. This provides a more sensitive test of model fit because the effects of the additional higher-order terms are removed from the error.
2.9. Principal Component Analysis (PCA)
PCA is one of the most often used chemometric methods for data reduction and exploratory analysis of high-dimensional data sets [43]. PCA decomposes the original matrix into multiplication of loading (chemical composition, color, and functional properties) and score (dietary fiber samples) matrices. The principal components are linear combinations of the original variables. The principal components are uncorrelated and account for the total variance of the original variables. PCA is an unsupervised method of pattern recognition in the sense that no grouping of the data has to be known before the analysis. The new sub-space defined by the principal components leads to a model that is easier to interpret than the original data set. From these results, it should be possible to highlight several characteristics and correlate them to the chemical composition of the different DFI produced.
3. Results
3.1. Development and Optimization of a Method for Obtaining Mushroom DFI
Preliminary experiments using methods previously described for the production of DFIs from other sources, including the simple hot water extraction [44], ethanol extraction of the low molecular weight material [45] and enzymatic removal of protein [46], rendered a deep yellow-brown material with an unpleasant smell (results not shown). This prompts us to develop an efficient method for the production of mushroom DFI that could render a food ingredient with desirable characteristics for their application in foods. This could be accomplished by using a chemical treatment with an alkaline solution containing hydrogen peroxide at room temperature. Under these conditions, the product obtained presented a white color and with no perceived odor. The method developed for the production of mushroom dietary fiber was optimized considering three process variables: treatment time (T), hydrogen peroxide concentration () and sodium hydroxide concentration (). A rotatable central composite design with α = 1.68 was used for the optimization of the parameters for the production of mushroom DFI as well as optimization of the DFI physico-chemical, nutritional and functional properties. Table 1 shows the design matrix of factors for the rotatable central composite design. DFI yield, chemical and nutritional composition, color, and functional properties were measured as the output variables.

Table 1.
Coded and actual variables for the experimental design for the optimization of mushroom dietary fiber isolation, yield (in relation to the initial mushroom fresh weight) and chemical composition concerning the fiber, protein, fat and ash of the dietary fiber ingredient (DFI) obtained in each experiment.
3.2. Yield of the Mushroom DFI
The yield of mushroom DFI obtained varied between a minimum of 15% to a maximum of 53% of the mushroom dry weight (0.77% to 2.8% of the fresh mushroom weight for a mushroom water content of 94.7%) (Table 1). Based on the central composite design, each of the three factors (T, , and ) had a significant effect on the mushroom DFI yield (Table 2). There was also observed a significant interaction between T and Using multiple regression analysis, a second-order polynomial equation model based on codded levels was used to fit the experimental results. This model which consists of the factors found to be significant is shown in Table A1. The ANOVA results of the model obtained indicated an adequate performance with R2 = 0.64, implying that 64% of the variations observed for the mushroom DFI yield are explained by the factors considered. It was therefore considered that the model provided a good description of the experimental data. Nevertheless, the F-test for the lack of fit was also significant (p < 0.05) therefore a more complicated model or additional factors (for example variability of the mushrooms used in each experiment) are required to a higher fit of the experimental data [41]. Figure 1 shows the three-dimension response surface curves of mushroom DFI yield for each pair of factors by keeping the third factor constant at the level where it presented the maximum value. The factor T presented the highest positive effect (Table 2, Figure 1a) on the mushroom DFI yield (maximum for the +1.682 level), followed by the factor were it was observed a positive effect (Table 2; Figure 1b) for the linear effect and a negative effect for the quadratic effect (maximum value for the > 0 level). The interaction between the factor T and and the linear effect of the factor both had a positive effect on the DFI yield (Table 2, Figure 1a).
Table 2.
Analysis of Variance Results for the physico-chemical and functional response variables of mushroom dietary fiber ingredient (DFI).
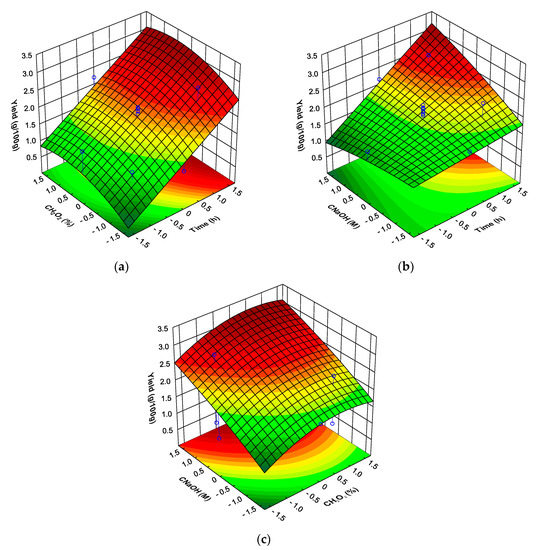
Figure 1.
Response surfaces for mushroom DFI yield as a function of: (a) time and hydrogen peroxide concentration (at sodium hydroxide concentration level of 1.682); (b) time and sodium hydroxide concentration (at hydrogen peroxide concentration level of 1); (c) hydrogen peroxide concentration and sodium hydroxide concentration (at time level of 1.682).
These results show that during the treatment of the mushroom material with the alkaline solution containing hydrogen peroxide there was observed an insolubilization of material with treatment time, this insolubilization being promoted by higher NaOH concentrations. According to the response surface analysis, the predicted maximum mushroom DFI yield in the range studied is 2.9% of the mushroom fresh weight (95% prediction interval: 2.1–3.6%) when the factor T is +1.682, the factor is +0 and the factor is +1.682, corresponding to 55% of the mushroom solids. To understand what is being insolubilized during the treatment of the mushroom material, and as the composition of DFIs are important from a legal perspective [47] but also for its nutritional and functional properties, the fiber, protein, lipid and ash contents of the DFI were determined.
3.3. Fibre Content and Composition
As can be observed in Table 1, fiber was the main component of the mushroom DFI for all the conditions employed and ranged from 45.9% to 70.4%. Only the factor T had a significant negative effect on the DFI fiber content (Table 2), therefore although higher treatment times resulted in higher DFI yields, there was also observed a decrease in the relative abundance of dietary fiber in the DFI. The previously described increase in the DFI yield with T is not related to an increase in fiber retention during the treatment as there was not observed a correlation between fiber yield and treatment time (R2 = 0.2092). For obtaining a mushroom DFI with higher fiber contents the lower processing times assure this value (Table 1). The yield of dietary fiber obtained ranged between 0.50% of the mushroom’s fresh weight to 1.3%, corresponding to a yield of fiber between 31% and 81% of original mushroom fiber content (on average 54%). This yield is explained by the fact that some of the A. bisporus polysaccharides are water and alkali-soluble [48].
In Table 3 it is shown the sugar composition of the mushroom DFI obtained for the different experimental conditions tested. In addition, the sugar composition of the fiber of the freeze-dried mushrooms is shown. The method applied resulted in a relative increase of the fiber in the DFI from 1.9 to 2.9 times in comparison with the original mushroom, showing the efficiency of the method employed for enriching the DFI with the original mushroom fiber. As can be observed, the main sugars present in the mushroom DFI were glucose followed by glucosamine and xylose that together account for more than 91% of the total sugars present. Smaller amounts of mannose, glucuronic acid, fucose, and galacturonic acid were also present. This sugar composition is similar to that described in previous works that have shown that A. bisporus cell walls are composed predominantly by β(1→3)-linked glucan containing some β(1→6) linkages containing also chitin [27,48,49]. FTIR analysis of the DFI confirms the presence of chitin (Figure 2). The spectra had characteristic bands at 3400–3480 cm−1 that responded to OH-3 and CH2OH-6 intra- and intermolecular hydrogen bonds, bands at 1650 cm−1 for amide I, and 1557 cm−1 for amide II vibrational mode. The chitin present in the mushroom DFI is in an antiparallel α-conformation [50] as there is observed a split of the amide I vibration band at 1655 cm−1, identical to the reference crustacean chitin (Figure 2). These results confirmed that the glycosaminoglycans of DFI from A. bisporus were in highly acetylated form. The ratio of intensities of the bands at ~1379 and ~2920 cm−1 has been suggested as the crystallinity index for chitin and chitosan [51]. The crystallinity index of the DFI chitin was similar to that of the reference chitin (1.07 vs. 1.12, respectively) and higher than that observed for the reference chitosan (0.78). The crystallinity index obtained mushroom DFI was higher than that obtained by Wu et al. [27], this being probably due to the preparation method used by these authors (1M NaOH at 95 °C during 30 min followed by 2% acetic acid at 95 °C during 6 h). A clear spectrum of the glucan in DFI could not be observed, due to the overlapping of chitin bands and the lack of unique bands in β-glucans when compared to chitin (Figure 3). This composition of dietary fiber is similar to that previously described [52], although in our work the amount of glucosamine was lower, and this can be related with different times after harvesting of the mushrooms [53] or to different A. bisporus strains used [54], nevertheless the chitin content of the A. bisporus obtained in this work is in agreement with previous works [27,48,49,55]. Although the relative abundance of the different sugars in the mushroom DFI is similar to that observed for the original mushroom there was a decrease in the relative abundance of fucose (−60%), galactose (−70%), and glucuronic acid (−60%). The other sugars present increased their relative abundance by 10% for glucose, 70% for xylose and 30% for mannose. Galacturonic acid was not detected in the original mushrooms but was present in most of the DFI obtained, and the relative abundance of glucosamine was on average the same as that found in the original mushroom dietary fiber.
Table 3.
Sugar composition of starting material (g/100 g) and mushroom dietary fiber ingredient (g/100 g ashless basis).
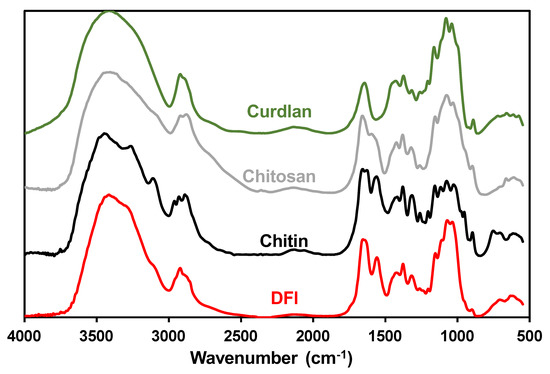
Figure 2.
FTIR spectra of the DFI obtained in treatment nº 4 and of the reference polysaccharides chitin, chitosan and curdlan.
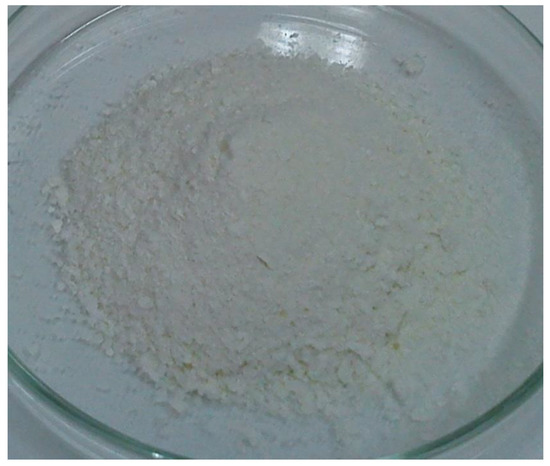
Figure 3.
Dietary fiber ingredient obtained for the treatment nº 4. = 0.419 M; = 3.9% and T = 2.81 h.
3.4. Protein, Fat, Ash Content and Energy
Protein was the second most abundant component of the mushroom DFI, ranging from 11 to 40% (Table 1). The yield of protein obtained varied between a minimum of 0.081% of the mushroom fresh weight to 0.88%, representing between 6.7% and 73% of the original mushroom protein content. Only T had a significant effect on the yield of protein from the mushroom. There was observed an increase in the amount of protein recovered in the DFI with increasing T, nevertheless, the model (Table 3) is not enough to explain the variations observed in the amount of protein recovered in the DFI (R2 = 0.33) during the chemical treatment of the mushroom material. Lower T assure lower amounts of protein in the DFI. This higher recovery of protein in the ingredient with increasing T was probably due to the denaturation of protein during the treatment in alkaline solution [56], to the crosslinking of protein due to the hydrogen peroxide treatment [57] or due to the alkaline conditions employed leading to the formation of lysinoalanine crosslinks [58].
The fat recovered in the mushroom DFI varied between a minimum of 0.016% of the mushroom fresh weight, to 0.057%, representing between 4.9% and 17.4% of the original mushroom fat content. There is observed an increase in the amount of fat recovered in the DFI with the increasing T and increasing being observed a significant interaction between these two factors. This higher recovery of fat in the final product was probably due to the precipitation or adsorption of fatty acids released from triglycerides during the alkaline treatment, as also higher and increasing T resulted in higher amounts of fat recovered.
The caloric values were calculated for each mushroom DFI produced under the different conditions employed and ranged from 261 to 316 kcal on a dry basis (Table 1). As can be observed, and as expected, the DFI with a higher amount of dietary fiber presented the lower caloric values.
3.5. Colour of Mushroom DFI
The mushroom DFI presented a white/yellowish color depending on the treatment conditions (Table 4).
Table 4.
Yield, water and oil retention capacity and color parameters a obtained for the different runs used for the optimization process.
In theory, the perfect colorless white (white point) has the values L* = 100, a* = 0, b* = 0, therefore, processing conditions rendering DFI with values close to these theoretical values will allow to obtain DFI with a white color. Lightness (L*) was significantly affected by the three factors, being also observed a significant interaction between T and and between and (Table 2). Taking all these effects into account, for obtaining a DFI with a high L* value, the optimum . level is 0 and aiming having a DFI with higher fiber values (Section 3.2), the level should be 1.682 and the level for the treatment time factor should be −1 (predicted L* = 103.79; 88.90 to 118.18). For the a* value (red-green coordinate of the color space), all factors, either linear or quadratic effects were significant. In addition, there was observed a significant interaction between all factors (Table 2). There are several combinations of independent variables (T, , ) that allow to obtain the desired value of a* = 0 as there is observed a significant interaction between all factors (Table 2). Optimum values for a* for factor T − 1, important for obtaining high fiber percentage in the DFI, can be obtained with the following combination: levels of of 1 and of of 1 (predicted a* value of 0.785 and prediction interval of −5.760 to 7.330). For the b* value (yellow-blue coordinate of the color space), the linear terms of T and and all quadratic terms of the factors had a significant effect (Table 2). Additionally, there was observed a significant interaction between T and and and (Table 2). For the desired value of b*, all factors should remain at the lower level yielding a b* value of 0.131 (95% prediction interval of −2.814 to 3.076). These results show that the method developed allowed us to obtain a DFI with desirable neutral color values for their application as a food ingredient (Figure 3).
3.6. Mushroom DFI Water and Oil Retention Capacity
The water retention capacity (WRC) of mushroom DFI is shown in Table 4. WRC ranged from a minimum of 4.2 g water/g of DFI to a maximum of 21.3 g water/g of DFI. The highest WRC values obtained for the mushroom DFI are higher than that obtained for dietary fiber concentrates obtained from orange, peach, artichoke and asparagus, mango peel, sugar beet (10–14 g/g), apple and pear (6–7 g/g) and much higher than that observed for wheat and oat bran, carrot, and pea dietary fiber concentrates (3–4 g/g) [59,60,61] and in the range of that observed for potato fiber (23–25 g/g) [62]. As can be observed in Figure 4a, the WRC of the mushroom DFI was strongly dependent on T, being observed a decrease in the WRC with increasing T, whatever the .
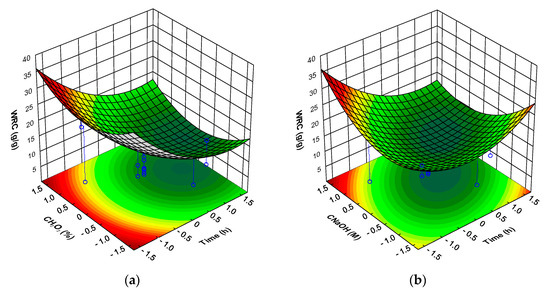
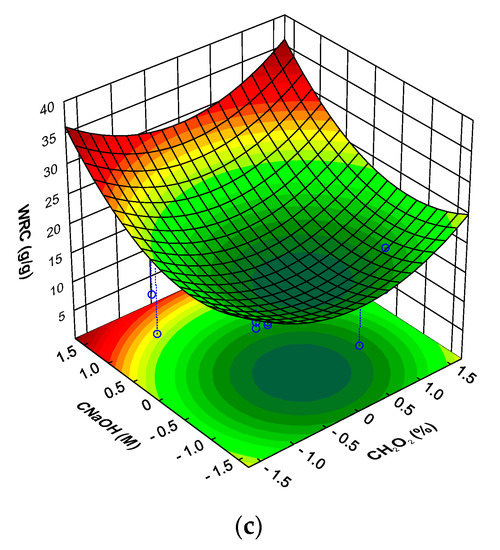
Figure 4.
Response surfaces for mushroom DFI water retention capacity (WRC) as a function of: (a) time and hydrogen peroxide concentration (at sodium hydroxide concentration level of 1.682); (b) time and sodium hydroxide concentration (at hydrogen peroxide concentration level of 1.682); (c) hydrogen peroxide concentration and sodium hydroxide concentration (at time level of −1.682).
For the there was observed a minimum for the WRC at the central value of this factor, with lower and higher levels showing a positive effect in the WRC of the DFI. For the there were observed to different situations (Figure 4b), for lower treatment times there was observed an increase in the WRC with increasing , the reverse was true for higher treatment times. Keeping the level of factor T at the minimum, the effect of on the WRC of DFI was much more important than the (Figure 4c). Whatever the the higher WRC was observed for the higher . For a higher WRC of the DFI the optimum level was 1.682, the level should be 1.682 and the level for factor T should be −1.682 (predicted WRC of 36.0 g/g of DFI with a 95% prediction interval of 29.6 to 42.4 g/g).
The oil retention capacity (ORC) of mushroom DFI is shown in Table 4. ORC varied from a minimum of 6.0 g oil/g of DFI to a maximum of 18.9 g oil/g of DFI. The ORC values obtained for the mushroom DFI were higher than that obtained for dietary fiber concentrates obtained from apple, pea, wheat, carrot (1–2.3 g/g) and sugar beet (5 g/g) [59], apple pomace and citrus by-products (0.6–1.8 mL oil/g) [63], unripe banana flour (~2 mL oil/g) [64]; carrot pulp dried at 50 °C (~6 mL oil/g) [65] and asparagus by-products (5.5–8.5 mL oil/g) [66]. As can be observed in Figure 5a, the ORC of the mushroom DFI was strongly dependent on the and T, being observed the higher value of ORC for lower T and higher .
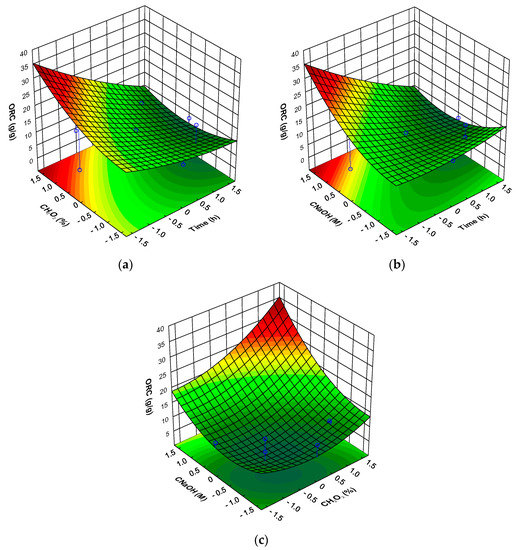
Figure 5.
Response surfaces for mushroom DFI oil retention capacity (ORC) as a function of: (a) time and hydrogen peroxide concentration (at sodium hydroxide concentration level of 1.682); (b) time and sodium hydroxide concentration (at hydrogen peroxide concentration level of 1.682); (c) hydrogen peroxide concentration and sodium hydroxide concentration (at time level of −1.682).
The same effect was observed for factor , for lower T there was observed an increase in the ORC with increasing , the reverse was true for high T (Figure 5b). When the effect of the factors and are represented, there was observed that the maximum ORC was obtained or for high and when the treatment time was at the lower level (Figure 5c) the reversed being observed for longer treatment times (result not showed). Using the factor levels where the maximum value is observed (T = −1.682; and = 1.682) the predicted value of ORC of the DFI is 35.8 g/g of DFI (95% prediction interval between 30.8 to 40.8 g/g).
3.7. Effect of Mushroom DFI Chemical Composition on the Colour and Functional Properties
To understand the effect of the chemical composition of the mushroom DFI obtained under the different processing conditions on the color and functional properties of mushroom DFI, the data obtained was analyzed by principal component analysis (PCA). The first three principal components obtained explained >70% of the total variance in the original data set. The loadings express how well the new PCs correlate with the original variables (Figure 6a and Table A2). The first PC, which explains 44.4% of the total variance, correlates positively with total fiber, glucosamine, glucose, xylose, WRC and ORC and negatively with protein and the b* value. The second PC, which explains 14.6% of the total variance, correlates positively with galacturonic acid content and negatively with glucuronic acid content, and PC3, which explains 13.5% of the total variance correlates positively with the a* value and negatively with lightness (L*). These results show that the WRC and ORC of the DFI are correlated with the total sugar content of the DFI (Figure 6a) and the b* value, related to the yellowness of the DFI is correlated with its protein content.
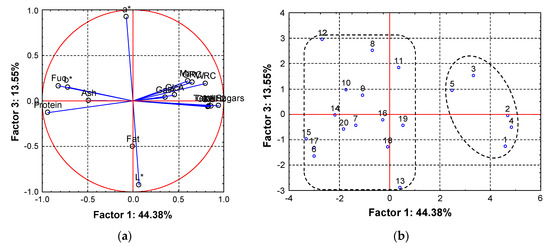
Figure 6.
(a) Factor loading plot based on correlations of the mushroom DFI chemical composition, color characteristics and functional properties projected on the space of PC1 vs. PC3; (b) scores plot of the mushroom DFI samples projected on the space of PC1 vs. PC3.
The scatter plot of the sample scores on the PC1 and PC3 scores (Figure 6b) shows the formation of two distinct clusters along the PC1. Samples with positive PC1 scores have a high relative content of total sugars and also a high WRC and low protein content and were less yellow, the opposite being true for the samples with negative PC1 scores. The WRC of dietary fibers is dependent on its structure [62,67] and chemical composition [68,69]. The water retained by dietary fiber material generally comprise three types of water, retained by three mechanisms: water bound by the hydrophilic polysaccharides of the fiber, dependent on the chemical composition of the fiber; water held by the fiber in the fiber matrix, mainly dependent on the pore size distribution of the fiber matrix; and water associated with fiber other than bound or matrix water, trapped within the cell wall lumen, dependent on the fiber source, method of preparation and method of measurement. Contrarily the ORC is in part related to its chemical composition but is more largely a function of the porosity of the fiber structure rather than the affinity of the fiber molecule for oil [70].
Samples with high scores on PC3 contain a relatively high a* value and lower L* value. As can be observed in Figure 6b, the group composed by the samples with a high PC1 score, corresponding to the DFI resulting from the 5 first treatments applied, are subdivided according to PC3 forming two groups, samples 3 and 5 contain a higher a* and lower L* values when compared to samples 1, 2 and 4.
4. Discussion
The production of a DFI from A. bisporus by-products, besides being a good strategy to reduce wastes generated in the mushroom agro-industry, can yield a DFI that besides having prebiotic activity [19,21,22] can also present a range of other very interesting biological activities. Several studies have shown that A. bisporus polysaccharides show immunostimulatory [71,72,73,74], antioxidant [74,75], antitumor [76,77,78], anti-inflammatory [7,79] and anti-sepsis activities [80], as well as antinociceptive inhibition [7,80]. The method developed allowed to concentrate the A. bisporus fiber polysaccharides up to 2.9 times, with a chemical composition similar to the initial cell wall, and so the biological activities of these polysaccharides are expected to be enhanced due to the concentration observed during the production process. In addition, it is expected that the original CGC present in A. bisporus cell walls is maintained [27,48,49]. CGC has been shown beneficial effects concerning the development of obesity and associated metabolic diabetes and hepatic steatosis, through a mechanism related to the restoration of the composition and/or the activity of gut bacteria, namely, bacteria from clostridial cluster XIVa [81]. Furthermore, CGC has potential beneficial effects concerning the development of atherosclerosis, mainly related to improving the antioxidant status [11,12]. On the other hand, chitin consumption can reduce triglyceride and cholesterol levels in liver and increase excretion of triglycerides in feces [13] and reduce cholesterol levels [14], and linear β-(1→3)-glucans have shown hypoglycemic activity accompanied by promotion of metabolism and inhibition of inflammation, through suppressing SGLT-1 expression and possibly associated with alteration of gut microbiota [15]. Nevertheless, to be acceptable, a DFI added to a food product must perform in a satisfactorily as a food ingredient [82], namely be bland in taste, color, and odor. Besides the well-established nutritional benefits of adding dietary fiber ingredients to food products, the use of DFI can also have important technological advantages [59]. Of the various technological benefits, the increases in the water retention capacity (WRC) and oil retention capacity (ORC) of foods are one of the main advantages of using DFIs [59,83]. Both WRC and ORC can increase the technological yield of food. WRC of DFIs can be advantageous in sauces and soups, but also for their textural properties, enhancing the flow properties and avoiding lump formation in powdered mixes (e.g., ready-to-eat sauces, mixes of spices, flavoring agents). ORC can be exploited in foods (cooked meat products) to enhance their retention of fat that is normally lost during cooking, being also beneficial for flavor retention [59]. The WRC can have a nutritional interest as well, as increase in water retention has been related to an increase in orocaecal transit time. The water-holding capacity of dietary fiber has been proposed to be valuable in the diet to alter stool bulking [84]. Increased stool weight can cause shorter gut transit times limiting the exposure of the gut to secondary bile acids and other toxins [85,86].
The use of a sodium hydroxide concentration of 0.419 mol/L and hydrogen peroxide of 3.9% during 2.81 h, at room temperature, allow to obtain the highest yield of DFI (1.22% in relation to the fresh weight) with one of the highest dietary fiber (63.7 g/100 g) and lower protein (12.0 g/100 g) contents and highest WRC (21.3 g/g of DFI) and ORC (18.9 g/f of DFI). In addition, the chromatic characteristics of the DFI obtained show that it has a good lightness (L* = 90.6) and neutral (white) color (a* = −0.470 and b* = 13.71).
The by-products of A. bisporus production can be successfully used for the production of a DFI using a simple method at room temperature and using food-grade materials, being a good strategy to reduce wastes in the mushroom agro-industry. Due to the simplicity and the efficiency shown in the production of A. bisporus DFI, there are no anticipated problems in applying this technology to other abundant mushrooms wastes as those derived from the production of Lentinus edodes and the oyster mushroom (Pleurotus ostreatus).
Author Contributions
Conceptualization, F.M.N.; investigation, S.M.F.; resources, F.M.N.; writing—original draft preparation, F.M.N.; writing—review and editing, F.M.N. and S.M.F.; supervision, F.M.N.; project administration, F.M.N.; funding acquisition, F.M.N. All authors have read and agreed to the published version of the manuscript.
Funding
This research was funded by the Centro de Química—Vila Real (CQ-VR), through the Fundação para a Ciência e Tecnologia (FCT)—Portugal, grant number UIDB/00616/2020 and the APC was funded by Fundação para a Ciência e Tecnologia (FCT)—Portugal, grant number UIDB/00616/2020.
Acknowledgments
The authors would like to acknowledge to João Coutinho for the nitrogen analysis.
Conflicts of Interest
The authors declare no conflicts of interest.
Appendix A
Table A1.
Regression equation coefficients for response parameters of mushrooms DFI.
Table A1.
Regression equation coefficients for response parameters of mushrooms DFI.
| Dependent Variable | Equation 1 | R2 | R2Adj |
|---|---|---|---|
| DFI Yield | Y = −1.937 + 0.391X1 + 0.166X2 − 0.130X22 + 0.112X3 − 0.119X32 + 0.170X1X3 | 0.647 | 0.483 |
| Protein Yield | Y = −0.528 + 0.177X1 | 0.339 | 0.303 |
| Fat Yield | Y = − 0.035 − 0.0066X1 − 0.0031X22 − 0.005X1X3 | 0.515 | 0.424 |
| L* | Y = 90.20 − 0.92X1 − 1.13X12 − 1.46X2 − 2.78X22 − 1.02X3 − 2.27X1X3 | 0.596 | 0.409 |
| a* | Y = −0.397 + 0.207X1 + 0.514X12 + 0.410X2 + 0.733X22 + 0.412X3 − 0.371X32 + 0.285X1X2 + 0.453X1X3 + 0.261X2X3 | 0.785 | 0.592 |
| b* | Y = 23.07 + 0.749X1 − 1.646X12 − 1.425X22 + 1.000X3 − 2.140X32 − 1.004X1X2 − 0.810X2X3 | 0.588 | 0.348 |
| WRC | Y = 5.784 − 2.229X1 + 2.566X12 + 2.467X22 + 2.377X32 − 1.996X1X3 | 0.714 | 0.612 |
| ORC | Y = 6.989 − 1.174X1 + 1.985X12 + 1.449X22 + 0.609X32 − 1.580X1X2 − 2.489X1X3 + 1.379X2X3 | 0.875 | 0.801 |
1 X1 = Time; X2 = ; X3 = .
Table A2.
Factor-variable correlations (factor loadings), based on correlations.
Table A2.
Factor-variable correlations (factor loadings), based on correlations.
| Factor 1 | Factor 2 | Factor 3 | |
|---|---|---|---|
| Total Sugars | 0.946 | −0.167 | −0.054 |
| GlcNH2 | 0.861 | 0.326 | −0.059 |
| Glc | 0.825 | −0.463 | −0.065 |
| Xyl | 0.837 | 0.376 | −0.061 |
| Man | 0.607 | 0.551 | 0.219 |
| GalA | 0.358 | 0.686 | 0.037 |
| GlcA | 0.458 | −0.801 | 0.063 |
| Fuc | −0.819 | 0.213 | 0.166 |
| Fat | −0.000 | −0.284 | −0.501 |
| Ash | −0.484 | −0.383 | 0.004 |
| Protein | −0.938 | 0.002 | −0.129 |
| WRC | 0.801 | −0.030 | 0.192 |
| ORC | 0.652 | −0.083 | 0.205 |
| L* | 0.068 | 0.090 | −0.924 |
| a* | −0.072 | −0.226 | 0.922 |
| b* | −0.717 | 0.311 | 0.151 |
References
- Chang, S.T. World production of edible and medicinal mushrooms in 1997 with emphasis on Lentinus edods (Berk). Sing. in China. Int. J. Med. Mushrooms 1999, 1, 291–301. [Google Scholar] [CrossRef]
- Chakravarty, B. Trends in mushroom cultivation and breeding. Aust. J. Agric. Eng. 2011, 2, 102–109. [Google Scholar]
- Wani, B.A.; Bodha, R.H.; Wani, A.H. Nutritional and medicinal importance of mushrooms. J. Med. Plants Res. 2010, 4, 2598–2604. [Google Scholar] [CrossRef]
- Kalač, P. A review of chemical composition and nutritional value of wild-growing and cultivated mushrooms. J. Sci. Food Agric. 2013, 93, 209–218. [Google Scholar] [CrossRef]
- Carbonero, E.R.; Gracher, A.H.P.; Komura, D.L.; Marcon, R.; Freitas, C.S.; Baggio, C.H.; Santos, A.R.S.; Torri, G.; Gorin, P.A.J.; Iacomini, M. Lentinus edodes heterogalactan: Antinociceptive and anti-inflammatory effects. Food Chem. 2008, 111, 531–537. [Google Scholar] [CrossRef]
- Chang, C.-W.; Lur, H.-S.; Lu, M.-K.; Cheng, J.-J. Sulfated polysaccharides of Armillariella mellea and their anti-inflammatory activities via NF-κB suppression. Food Res. Int. 2013, 54, 239–245. [Google Scholar] [CrossRef]
- Komura, D.L.; Carbonero, E.R.; Gracher, A.H.P.; Baggio, C.H.; Freitas, C.S.; Marcon, R. Structure of Agaricus spp. fucogalactans and their anti-inflammatory and antinociceptive properties. Bioresour. Technol. 2010, 101, 6192–6199. [Google Scholar] [CrossRef]
- Lindequist, U.; Niedermeyer, T.H.J.; Jülich, W.-D. The pharmacological potential of mushrooms. Evid. Based Complement. Altern. Med. 2005, 2, 285–299. [Google Scholar] [CrossRef]
- Wessels, G.H. Developmental regulation of fungal cell wall formation. Annu. Rev. Phytopathol. 1994, 32, 413–437. [Google Scholar] [CrossRef]
- Michalenko, G.O.; Hohl, H.R.; Rast, D. Chemistry and Architecture of the Mycelial Wall of Agaricus bisporus. J. Gen. Microbiol. 1976, 92, 251–256. [Google Scholar] [CrossRef]
- Berecochea-Lopez, A.; Decordé, K.; Ventura, E.; Godard, M.; Bornet, A.; Teissèdre, P.L.; Cristol, J.P.; Rouanet, J.M. Fungal chitin-glucan from Aspergillus niger efficiently reduces aortic fatty streak accumulation in the high-fat fed hamster, an animal model of nutritionally induced atherosclerosis. J. Agric. Food Chem. 2009, 57, 1093–1098. [Google Scholar] [CrossRef] [PubMed]
- Bays, H.E.; Evans, J.L.; Maki, K.C.; Evans, M.; Maquet, V.; Cooper, R.; Anderson, J.W. Chitin-glucan fiber effects on oxidized low-density lipoprotein: A randomized controlled trial. Eur. J. Clin. Nutr. 2013, 67, 2–7. [Google Scholar] [CrossRef] [PubMed]
- Zacour, A.C.; Silva, M.E.; Cecon, P.R.; Bambirra, E.A.; Vieira, E.C. Effect of dietary chitin on cholesterol absorption and metabolism in rats. J. Nutr. Sci. Vitaminol. 1992, 38, 609–613. [Google Scholar] [CrossRef] [PubMed]
- Mathew, P.T.; Ramachandran-Nair, K.G. Hyphocholesterolemic effect of chitin and its hydrolysed products in albino rats. Fish. Technol. 1998, 35, 46–49. [Google Scholar]
- Cao, Y.; Zou, S.; Xu, H.; Li, M.; Tong, Z.; Xu, M.; Xu, X. Hypoglycemic activity of the Baker’s yeast β-glucan in obese/type 2 diabetic mice and the underlying mechanism. Mol. Nutr. Food Res. 2016, 60, 2678–2690. [Google Scholar] [CrossRef]
- Synytsya, A.; Míčková, K.; Synytsya, A.; Jablonský, I.; Spěváček, J.; Erban, V.; Kováříková, E.; Čopíková, J. Glucans from fruit bodies of cultivated mushrooms Pleurotus ostreatus and Pleurotus eryngii: Structure and potential prebiotic activity. Carbohydr. Polym. 2009, 76, 548–556. [Google Scholar] [CrossRef]
- Xu, X.; Yang, J.; Ning, Z.; Zhang, X. Lentinula edodes-derived polysaccharide rejuvenates mice in terms of immune responses and gut microbiota. Food Funct. 2015, 6, 2653–2663. [Google Scholar] [CrossRef]
- Xu, X.; Zhang, X. Lentinula edodes-derived polysaccharide alters the spatial structure of gut microbiota in mice. PLoS ONE 2015, 10, e0115037. [Google Scholar] [CrossRef]
- Giannenas, I.; Tsalie, E.; Chronis, E.F.; Mavridis, S.; Tontis, D.; Kyriazakis, I. Consumption of Agaricus bisporus mushroom affects the performance, intestinal microbiota composition and morphology and antioxidant status of turkey poults. Anim. Feed Sci. Technol. 2011, 165, 218–229. [Google Scholar] [CrossRef]
- Pallav, K.; Dowd, S.E.; Villafuerte, J.; Yang, X.; Kabbani, T.; Hansen, J.; Dennis, M.; Leffler, D.A.; Newburg, D.S.; Kelly, C.P. Effects of polysaccharopeptide from Trametes versicolor and amoxicillin on the gut microbiome of healthy volunteers A randomized clinical trial. Gut Microbes 2014, 5, 458–467. [Google Scholar] [CrossRef]
- Zhao, J.; Cheung, P.C.K. Fermentation of β-Glucans derived from different sources by bifidobacteria: Evaluation of their bifidogenic effect. J. Agric. Food Chem. 2011, 59, 5986–5992. [Google Scholar] [CrossRef] [PubMed]
- Rodrigues, D.; Walton, G.; Sousa, S.; Rocha-Santos, T.A.P.; Duarte, A.C.; Freitas, A.C.; Gomes, A.M.P. In vitro fermentation and prebiotic potential of selected extracts from seaweeds and mushrooms. LWT Food Sci. Technol. 2016, 73, 131–139. [Google Scholar] [CrossRef]
- Zivanovic, S. Identification of Opportunities for Production of Ingredients Based on Further Processed Fresh Mushrooms, Off-Grade Mushrooms, By-Products, and Waste Materials. Project Report Prepared for Mushroom Council. Available online: http://mushroomcouncil.org/wp-content/uploads/2012/02/2006_09IndustryReport.pdf (accessed on 20 December 2012).
- Wani, A.M.; Hussain, P.R.; Meena, R.S.; Dar, M.A.; Mir, M.A. Effect of gamma irradiation and sulphitation treatments on keeping quality of white button mushroom Agaricus bisporus (J. Lge). Int. J. Food Sci. Technol. 2009, 44, 967–973. [Google Scholar] [CrossRef]
- Jolivet, S.; Arpin, N.; Wichers, H.J.; Pellon, G. Agaricus bisporus browning: A review. Mycol. Res. 1998, 102, 1459–1483. [Google Scholar] [CrossRef]
- European Commission. The European Regulation of Waste Management, Directive 2008/98/ EC (‘Waste Framework Directive’); European Commission: Brussels, Belgium, 2008. [Google Scholar]
- Wu, T.; Zivanovic, S.; Draughon, F.A.; Sams, C.E. Chitin and Chitosan Value-Added Products from Mushroom Waste. J. Agric. Food Chem. 2004, 52, 7905–7910. [Google Scholar] [CrossRef]
- Dallies, N.; Francois, J.; Paquet, V. A new method for quantitative determination of polysaccharides in the yeast cell wall. Application to the cell wall defective mutants of Saccharomyces cerevisiae. Yeast 1998, 14, 1297–1306. [Google Scholar] [CrossRef]
- Aguilar-Uscanga, B.; Francois, J.M. A study of the yeast cell wall composition and structure in response to growth conditions and mode of cultivation. Lett. Appl. Microbiol. 2003, 37, 268–274. [Google Scholar] [CrossRef]
- Baker, L.G.; Specht, C.A.; Donlin, M.J.; Lodge, J.K. Chitosan, the deacetylated form of chitin, is necessary for cell wall integrity in Cryptococcus neoformans. Eukaryot. Cell 2007, 6, 855–867. [Google Scholar] [CrossRef]
- Roca, C.; Chagas, B.; Farinha, I.; Freitas, F.; Mafra, L.; Aguiar, F.; Oliveira, R.; Reis, M.A.M. Production of yeast chitin–glucan complex from biodiesel industry byproduct. Process Biochem. 2012, 47, 1670–1675. [Google Scholar] [CrossRef]
- Ivshin, V.P.; Artamonova, S.D.; Ivshina, T.N.; Sharnina, F.F. Methods for isolation of chitin-glucan complexes from higher fungi native biomass. Polym. Sci. Ser. B 2007, 49, 305–310. [Google Scholar] [CrossRef]
- Rodríguez, R.; Jiménez, A.; Fernández-Bolaños, J.; Guillén, R.; Heredia, A. Dietary fibre from vegetable products as source of functional ingredients. Trends Food Sci. Technol. 2006, 17, 3–15. [Google Scholar] [CrossRef]
- Guillon, F.; Champ, M. Structural and physical properties of dietary fibres, and consequences of processing on human physiology. Food Res. Int. 2000, 33, 233–245. [Google Scholar] [CrossRef]
- Englyst, H.N.; Wiggims, H.S.; Cummings, J.H. Determination of the non-starch polysaccharides in plant foods by gas-liquid chromatography of constituent sugars as alditol acetates. Analyst 1982, 107, 307–318. [Google Scholar] [CrossRef] [PubMed]
- Englyst, H.N.; Hudson, G.J. The classification and measurement of dietary carbohydrates. Food Chem. 1996, 57, 15–21. [Google Scholar] [CrossRef]
- Abraão, A.S.; Lemos, A.M.; Vilela, A.; Sousa, J.M.; Nunes, F.M. Influence of osmotic dehydration process parameters on the quality of candied pumpkins. Food Bioprod. Process. 2013, 91, 481–494. [Google Scholar] [CrossRef]
- AOAC. Official Methods of Analysis, 15th ed.; AOAC International: Arlington, VA, USA, 1996. [Google Scholar]
- Buchholz, A.C.; Schoeller, D.A. Is a calorie a calorie? Am. J. Clin. Nutr. 2004, 79, 899S–906S. [Google Scholar] [CrossRef]
- Robertson, J.A.; de Monredon, F.D.; Dysseler, P.; Guillon, F.; Amado, R.; Thibault, J.-T. Hydration properties of dietary fibre and resistant starch: A European collaborative study. LWT Food Sci. Technol. 2000, 33, 72–79. [Google Scholar] [CrossRef]
- Box, G.E.P.; Wilson, K.B. On the experimental attainment of optimum conditions. J. R. Stat. Soc. Ser. B 1951, 13, 1–45. [Google Scholar] [CrossRef]
- Montgomery, D.C. Introduction to Statistical Quality Control, 3rd ed.; John Wiley and Sons, Inc.: New York, NY, USA, 1996. [Google Scholar]
- Vandeginste, B.G.; Massart, L.; Buydens, L.M.; De Jong, S.; Lewi, P.J.; Smeyers-Verbeke, J. Handbook of Chemometrics and Qualimetrics; Elsevier: Amsterdam, The Netherlands, 1998. [Google Scholar]
- Massiot, P.; Renard, C.M.G.C. Composition, physicochemical properties and enzymatic degradation of fibers prepared from different tissues of apple. LWT Food Sci. Technol. 1997, 30, 800–806. [Google Scholar] [CrossRef]
- Thomas, M.; Crepeau, M.J.; Rumpunen, K.; Thibault, J.-F. Dietary fiber and cell-wall polysaccharides in the fruits of Japanese quince (Chaenomeles japonica). LWT Food Sci. Technol. 2000, 33, 124–131. [Google Scholar] [CrossRef]
- Wong, K.H.; Cheung, P.C. Dietary fibers from mushroom sclerotia: 1. Preparation and physicochemical and functional properties. J. Agric. Food Chem. 2005, 53, 9395–9400. [Google Scholar] [CrossRef] [PubMed]
- FAO/WHO. Joint FAO/WHO food standards programme. In Report of the 30th Session of the Codex Committee on Nutrition and Foods for Special Dietary Uses, Proceedings of the Codex Alimentarius Commission 32nd Session, Rome, Italy, 29 June–4 July 2009; ALINORM 09/332/26, Part B Provisions on Dietary Fibre; FAO/WHO: Rome, Italy, 2009. [Google Scholar]
- Bernardo, D.; Mendoza, C.G.; Calonje, M.; Novaes-Ledieu, M. Chemical analysis of the lamella walls of Agaricus bisporus fruit bodies. Curr. Microbiol. 1999, 38, 364–367. [Google Scholar] [CrossRef] [PubMed]
- Novaes-Ledieu, M.; Mendoza, G.C. The cell walls of Agaricus bisporus and Agaricus campestris fruiting body hyphae. Can. J. Microbiol. 1981, 27, 779–787. [Google Scholar] [CrossRef] [PubMed]
- Focher, B.; Najji, A.; Torri, G.; Cosani, A.; Terbojevich, M. Structural differences between chitin polymorphs and their precipitates from solutions-evidence from CP-MAS 13C NMR, FT-IR and FT-Raman spectroscopy. Carbohydr. Res. 1992, 17, 97–102. [Google Scholar] [CrossRef]
- Kumirska, J.; Czerwicka, M.; Kaczyński, Z.; Bychowska, A.; Brzozowski, K.; Thöming, J.; Stepnowski, P. Application of spectroscopic methods for structural analysis of chitin and chitosan. Mar. Drugs 2010, 8, 1567–1636. [Google Scholar] [CrossRef]
- Cheung, P.C.-K. Dietary fibre content and composition of some edible fungi determined by two methods of analysis. J. Sci. Food Agric. 1997, 73, 255–260. [Google Scholar] [CrossRef]
- Hammond, J.B.W. Changes in composition of harvested mushrooms (Agaricus bisporus). Phytochemistry 1979, 18, 415–418. [Google Scholar] [CrossRef]
- Ramírez, L.; Muez, V.; Alfonso, M.; Barrenechea, A.G.; Alfonso, L.; Pisabarro, A.G. Use of molecular markers to differentiate between commercial strains of the button mushroom Agaricus bisporus. FEMS Microbiol. Lett. 2001, 198, 45–48. [Google Scholar] [CrossRef]
- Vetter, J. Chitin content of cultivated mushrooms Agaricus bisporus, Pleurotus ostreatus and Lentinula edodes. Food Chem. 2007, 102, 6–9. [Google Scholar] [CrossRef]
- Monahan, F.J.; German, J.B.; Kinsella, J.E. Effect of pH and temperature on protein unfolding and thiol/disulfide interchange reactions during heat-induced gelation of whey proteins. J. Agric. Food Chem. 1995, 43, 46–52. [Google Scholar] [CrossRef]
- Rice, R.H.; Lee, Y.M.; Brown, W.D. Interactions of heme proteins with hydrogen peroxide: Protein crosslinking and covalent binding of benzo[a]pyrene and 17P-estradiol. Arch. Biochem. Biophys. 1983, 221, 417–427. [Google Scholar] [CrossRef]
- Friedman, M. Chemistry, biochemistry, nutrition, and microbiology of lysinoalanine, lanthionine, and histidinoalanine in food and other proteins. J. Agric. Food Chem. 1999, 47, 1295–1319. [Google Scholar] [CrossRef] [PubMed]
- Thebaudin, J.Y.; Lefebvre, A.C.; Harrington, M.; Bourgeois, C.M. Dietary fibres: Nutritional and technological interest. Trends Food Sci. Technol. 1997, 8, 41–48. [Google Scholar] [CrossRef]
- Grigelmo-Miguel, N.; Martin-Belloso, O. Comparison of dietary fibre from by-products of processing fruits and greens and from cereals. LWT Food Sci. Technol. 1999, 32, 503–508. [Google Scholar] [CrossRef]
- Larrauri, J.A.; Rupérez, P.; Borroto, B.; Saura-Calixto, F. Mango peels as a new tropical fibre: Preparation and characterization. LWT Food Sci. Technol. 1996, 29, 729–733. [Google Scholar] [CrossRef]
- Robertson, J.A.; Eastwood, M.A. An examination of factors which may affect the water holding capacity of dietary fibre. Br. J. Nutr. 1981, 45, 83–88. [Google Scholar] [CrossRef]
- Figuerola, F.; Hurtado, M.L.; Estévez, A.M.; Chiffelle, I.; Asenjo, F. Fibre concentrates from apple pomace and citrus peel as potential fibre sources for food enrichment. Food Chem. 2005, 91, 395–401. [Google Scholar] [CrossRef]
- Rodríguez-Ambriz, S.L.; Islas-Hernández, J.J.; Agama-Acevedo, E.; Tovar, J.; Bello-Pérez, L.A. Characterization of a fibre-rich powder prepared by liquefaction of unripe banana flour. Food Chem. 2008, 107, 1515–1521. [Google Scholar] [CrossRef]
- Garau, M.C.; Simal, S.; Rosselló, C.; Femenia, A. Effect of air drying temperature on physico-chemical properties of dietary fibre and antioxidant capacity of orange (Citrus aurantium v. Canoneta) by-products. Food Chem. 2007, 104, 1014–1024. [Google Scholar] [CrossRef]
- Fuentes-Alventosa, J.M.; Rodríguez-Gutiérrez, G.; Jaramillo-Carmona, S.; Espejo-Calvo, J.A.; Rodríguez-Arcos, R.; Fernández-Bolaños, J.; Guillén-Bejarano, R.; Jiménez-Araujo, A. Effect of extraction method on chemical composition and functional characteristics of high dietary fibre powders obtained from asparagus by-products. Food Chem. 2009, 113, 665–671. [Google Scholar] [CrossRef]
- Chaplin, M.F. Fibre and water binding. Proc. Nutr. Soc. 2003, 62, 223–227. [Google Scholar] [CrossRef] [PubMed]
- Elhardallou, S.B.; Walker, A.F. The water-holding capacity of three starchy legumes in the raw, cooked and fibre-rich fraction forms. Plant Food Hum. Nutr. 1993, 44, 171–179. [Google Scholar] [CrossRef] [PubMed]
- Chau, C.F.; Huang, Y.L. Comparison of the chemical composition and physicochemical properties of different fibers prepared from the peel of Citrus sinensis L. Cv. Liucheng. J. Agric. Food Chem. 2003, 51, 2615–2618. [Google Scholar] [CrossRef] [PubMed]
- Biswas, A.K.; Kumar, V.; Bhosle, S.; Sahoo, J.; Chatli, M.K. Dietary fibers as functional ingredients in meat products and their role in human health. Int. J. Livest. Prod. 2011, 2, 45–54. [Google Scholar]
- Volman, J.J.; Helsper, J.P.F.G.; Wei, S.; Baars, J.J.P.; van Griensven, L.J.L.D.; Sonnenberg, A.S.M.; Mensink, R.P.; Plat, J. Effects of mushroom-derived β-glucan-rich polysaccharide extracts on nitric oxide production by bone marrow-derived macrophages and nuclear factor-κB transactivation in Caco-2 reporter cells: Can effects be explained by structure? Mol. Nutr. Food Res. 2010, 54, 268–276. [Google Scholar] [CrossRef]
- Smiderle, F.R.; Ruthes, A.C.; van Arkel, J.; Chanput, W.; Iacomini, M.; Wichers, H.J.; Van Griensven, L.J. Polysaccharides from Agaricus bisporus and Agaricus brasiliensis show similarities in their structures and their immunomodulatory effects on human monocytic THP-1 cells. BMC Complement. Altern. Med. 2011, 11, 58. [Google Scholar] [CrossRef]
- Smiderle, F.R.; Alquini, G.; Tadra-Sfeir, M.Z.; Iacomini, M.; Wichers, H.J.; Van Griensven, L.J. Agaricus bisporus and Agaricus brasiliensis (1→6)-β-D-glucans show immunostimulatory activity on human THP-1 derived macrophages. Carbohydr. Polym. 2013, 94, 91–99. [Google Scholar] [CrossRef]
- Kozarski, M.; Klaus, A.; Niksic, M.; Jakovljevic, D.; Helsper, J.P.F.G.; Van Griensven, L.J.L.D. Antioxidative and immunomodulating activities of polysaccharide extracts of the medicinal mushrooms Agaricus bisporus, Agaricus brasiliensis, Ganoderma lucidum and Phellinus linteus. Food Chem. 2011, 129, 1667–1675. [Google Scholar] [CrossRef]
- Tian, Y.; Zeng, H.; Xu, Z.; Zheng, B.; Lin, Y.; Gan, C.; Lo, Y.M. Ultrasonic-assisted extraction and antioxidant activity of polysaccharides recovered from white button mushroom (Agaricus bisporus). Carbohydr. Polym. 2012, 88, 522–529. [Google Scholar] [CrossRef]
- Jeong, S.C.; Koyyalamudi, S.R.; Jeong, Y.T.; Song, C.H.; Pang, G. Macrophage immunomodulating and antitumor activities of polysaccharides isolated from Agaricus bisporus white button mushrooms. J. Med. Food 2012, 15, 58–65. [Google Scholar] [CrossRef]
- Pires, A.D.R.A.; Ruthes, A.C.; Cadena, S.M.; Acco, A.; Gorin, P.A.; Iacomini, M. Cytotoxic effect of Agaricus bisporus and Lactarius rufus β-D-glucans on HepG2 cells. Int. J. Biol. Macromol. 2013, 58, 95–103. [Google Scholar] [CrossRef] [PubMed]
- Pires, A.D.R.A.; Ruthes, A.C.; Cadena, S.M.S.C.; Iacomini, M. Cytotoxic effect of a mannogalactoglucan extracted from Agaricus bisporus on HepG2 cells. Carbohydr. Polym. 2017, 170, 33–42. [Google Scholar] [CrossRef] [PubMed]
- Ruthes, A.C.; Rattmann, Y.D.; Malquevicz-Paiva, S.M.; Carbonero, E.R.; Córdova, M.M.; Baggio, C.H.; Santos, A.R.; Gorin, P.A.; Iacomini, M. Agaricus bisporus fucogalactan: Structural characterization and pharmacological approaches. Carbohydr. Polym. 2013, 92, 184–191. [Google Scholar] [CrossRef] [PubMed]
- Ruthes, A.C.; Rattmann, Y.D.; Carbonero, E.R.; Gorin, P.A.J.; Iacomini, M. Structural characterization and protective effect against murine sepsis of fucogalactans from Agaricus bisporus and Lactarius rufus. Carbohydr. Polym. 2012, 87, 1620–1627. [Google Scholar] [CrossRef]
- Neyrinck, A.M.; Possemiers, S.; Verstraete, W.; De Backer, F.; Cani, P.D.; Delzenne, N.M. Dietary modulation of clostridial cluster XIVa gut bacteria (Roseburia spp.) by chitin-glucan fiber improves host metabolic alterations induced by high fat-diet in mice. J. Nutr. Biochem. 2012, 23, 51–59. [Google Scholar] [CrossRef]
- Jaime, L.; Mollá, E.; Fernández, A.; Martín-Cabrejas, M.; López-Andréu, F.; Esteban, R. Structural carbohydrates differences and potential source of dietary fiber of onion (Allium cepa L.) tissues. J. Agric. Food Chem. 2000, 50, 122–128. [Google Scholar] [CrossRef]
- Kethireddipalli, P.; Hung, Y.-C.; Phillips, R.O.; Mc Watters, K.H. Evaluating the role of cell material and soluble protein in the functionality of cowpea (Vigna unguiculata) pastes. J. Food Sci. 2002, 67, 53–59. [Google Scholar] [CrossRef]
- Roehrig, K.L. The physiological effects of dietary fiber-a review. Food Hydrocoll. 1988, 2, 1–18. [Google Scholar] [CrossRef]
- Faivre, J.; Doyon, F.; Boutron, M. The ECP calcium fibre polyp prevention study. The ECP colon group. Eur. J. Cancer Prev. 1993, 2 (Suppl. 2), 99–106. [Google Scholar] [CrossRef]
- Reddy, B.S.; Engle, A.; Katsifis, S.; Simi, B.; Bartram, H.P.; Perrino, P.; Mahan, C. Biochemical epidemiology of colon cancer: Effect of types of dietary fibre on fecal mutagens, acid and neutral sterols in healthy subjects. Cancer Res. 1989, 49, 4629–4635. [Google Scholar]
© 2020 by the authors. Licensee MDPI, Basel, Switzerland. This article is an open access article distributed under the terms and conditions of the Creative Commons Attribution (CC BY) license (http://creativecommons.org/licenses/by/4.0/).