Article

Assessing the Energy Demand Reduction in a Surgical Suite by Optimizing the HVAC Operation During Off-Use Periods

by
Antón Cacabelos-Reyes
1,
José Luis López-González
2,
Arturo González-Gil
1,
Lara Febrero-Garrido
1,*,
Pablo Eguía-Oller
3 and
Enrique Granada-Álvarez
3
1
Defense University Centre, Spanish Naval Academy, Plaza de España, s/n, 36920 Marín, Spain
2
SERGAS, Xunta de Galicia, Edificio Administrativo San Lázaro s/n, 15703 Santiago de Compostela, Spain
3
Department of Mechanical Engineering, Heat Engines and Fluid Mechanics, Industrial Engineering School, University of Vigo, 36310, Spain
*
Author to whom correspondence should be addressed.
Appl. Sci. 2020, 10(7), 2233; https://doi.org/10.3390/app10072233
Submission received: 29 February 2020 / Revised: 17 March 2020 / Accepted: 23 March 2020 / Published: 25 March 2020
(This article belongs to the Special Issue Efficiency and Optimization of Buildings Energy Consumption)

Abstract

:
Hospital surgical suites are high consumers of energy due to the strict indoor air quality (IAQ) conditions. However, by varying the ventilation strategies, the potential for energy savings is great, particularly during periods without activity. In addition, there is no international consensus on the ventilation and hygrothermal requirements for surgical areas. In this work, a dynamic energy model of a surgical suite of a Spanish hospital is developed. This energy model is calibrated and validated with experimental data collected during real operation. The model is used to simulate the yearly energy performance of the surgical suite under different ventilation scenarios. The common issue in the studied ventilation strategies is that the hygrothermal conditions ranges are extended during off-use hours. The maximum savings obtained are around 70% of the energy demand without compromising the safety and health of patients and medical staff, as the study complies with current heating, ventilation and air conditioning (HVAC) regulations.

1. Introduction

Hospitals operate 24/7 with high rates of occupancy and stringent air quality requirements. Accordingly, they generally present greater end-use energy consumption and greenhouse gas emissions per unit of floor area in comparison with residential and other commercial buildings. Thus, it has been recently reported that the average energy intensity of hospitals in the United States is 738.5 kW/m2/year, which is approximately 2.6 times greater than that of other buildings of the tertiary sector [1]. In turn, the energy consumption of hospitals in Greater London (UK) ranges from 194 to 1270 kWh/m2/year [2], whereas the average values for Germany and Spain are approximately 270 kWh/m2/year [3,4]. In addition, a recent study on the CO2 emissions derived from the energy consumption in Spanish hospitals estimates that the average annual ratio is 100 kg per m2 of floor area [5].
The scientific literature offers a wide range of investigations evidencing that there is a large potential for energy savings and CO2 emissions reduction in hospitals worldwide. Such studies mostly focus on enhancing the efficiency of heating, ventilation and air conditioning (HVAC) systems, as they are typically responsible for the greatest share of the total end-use energy consumption in hospitals, with ratios ranging from 50% to 75% [6,7]. These investigations were conducted worldwide (e.g., in Europe [8] and Australia [9]), achieving similar results. For example, in China, a comprehensive study indicates that electricity consumption in hospitals accounts for 64% of the total energy, mostly from air conditioning systems [10]. Other publications include the evaluation of different retrofitting strategies, such as renovating the building envelope [11,12], introducing renewable energy sources [13] or recovering energy from medical waste incineration [14]. For instance, it has been estimated that the yearly electrical energy consumption of a Greek hospital could be reduced by 45% through the implementation of energy policies, and the installation of new LED luminaries and photovoltaic panels [15]. Likewise, García-Sanz-Calcedo et al. have reported that it is possible to save up to 6.88 kWh and 4.82 kg of CO2 per m2 and year by implementing a series of relatively low-cost strategies that include improving the HVAC and lighting systems, introducing the use of renewable energies, enhancing the envelope thermal insulation or optimizing the maintenance management [16]. However, it is common that the implementation of energy efficiency measures in hospitals is hindered by a series of issues intrinsically related to the healthcare sector, including technical obstacles, political barriers and behavioral concerns [17,18,19,20].
Operating rooms (ORs) have rigorous ventilation, hygrothermal, lighting and functional requirements. In consequence, they present a large energy use intensity compared to other areas in a hospital, principally due to the energy consumption of HVAC systems. In fact, a recent study on the energy performance of the ORs of a Spanish hospital reveals that their average thermal energy demand is 1685 kWh/m2/year, or 1021 kWh/m2/year if the adjunct facilities, such as scrub rooms, sterile storage areas and preoperative rooms, are considered [21]. HVAC systems play a fundamental role in preventing infections during surgical operations while maintaining acceptable indoor thermal conditions for patients and medical staff [22], which makes them consume large amounts of energy. Thus, elevated constant ventilation rates, together with an efficient air filtration and air distribution, are required to remove airborne bioparticles, anesthetic gases, fumes and other contaminants, as well as to keep a constant positive differential pressure in the surgical areas [23,24,25,26]. In addition, it is necessary to maintain temperature and humidity within determined values that avoid the proliferation of bacteria, viruses and fungi, while providing the most comfortable working conditions possible for the surgical personnel [27,28,29]. However, hygrothermal and ventilation requirements in ORs may significantly vary depending on the standard considered for designing the HVAC equipment, as different countries define their own technical guidelines [30,31,32]. A detailed comparative of different standards can be found in [21].
The high-energy intensity associated with surgical facilities provides an opportunity to develop and implement energy saving measures in ORs, particularly those aimed at minimizing their HVAC loads. However, reducing the energy consumption in ORs is a complex and challenging task, as it inevitably involves preserving or enhancing the safety and comfort conditions for patients and staff. In fact, energy efficiency is mostly overlooked by current standards, while the number of investigations addressing the analysis and optimization of the energy performance in ORs is rather limited.
The installation of heat exchangers to recover energy from the exhaust airflow has been proposed to reduce the air conditioning energy demand in surgical facilities [33,34]. However, the use of heat recovery units is not always possible due the risk of cross-contamination of the fresh airstream. Ozyogurtcu et al. [35] have estimated that the energy consumption of Turkish ORs could be reduced up to 74% by introducing heat recovery systems and lowering the number of air changes per hour (ACH) during night periods by half. Decreasing the airflow intake during off-use hours is a simple measure that could effectively minimize the energy use for fans and air conditioning, but it might also involve difficulties in keeping adequate overpressure levels in the surgical areas or producing an ineffective removal of smoke from cleaning activities. Hence, energy saving proposals based on reducing the ventilation rates beyond the limits recommended by standards, either during occupied or unoccupied periods, should include a thorough assessment of the contaminant concentration in the OR environment, as airflow patterns have a major influence in their elimination and dilution [36]. In this regard, Alsved et al. [37] have evaluated the performance of different ventilation systems for ORs, concluding that a temperature-controlled airflow can provide high levels of air cleanliness, comfortable working conditions and reduced energy consumption. Likewise, Febrero- Garrido et al. suggest that energy savings up to 51% are achievable in a Spanish hospital by reducing the ventilation rates by half while complying with airborne particle standards [38]. In turn, the use of air recirculation is supported by most of the current standards in the design of HVAC systems for ORs [39]. Thus, it has been recently estimated that the energy demand of a conventional Spanish OR may be lowered by 55% if the fresh air intake is reduced to 50% of the total ACH [40], which is the highest recirculation rate contemplated in the Spanish standard [41]. Similar results were obtained by González-Gil et al. [21] for an existing OR in Spain, although they have additionally found that energy savings could increase up to 79% if the recirculation rate was 80%, as recommended by the American standard [42].
González-Gil et al. [21] have also revealed that approximately 80% of the total thermal energy demand of a surgical suite corresponds to periods of inactivity, thus confirming that large amounts of energy are currently spent on maintaining comfort and aseptic conditions in ORs when no surgical works are being performed. However, it is known that, assuming high filtering efficiency and an adequate number of ACH with effective air distribution, the concentration of infectious particles is determined by their ratio of generation, the principal source of such particles being the staff and the surgical activities [43]. In this vein, Loomans et al. [44] have determined that demand-controlled ventilation based on occupancy could lead to energy savings of up to 93% in pharmaceutical cleanrooms. Also, Porowski [45] has assessed through simulations that a substantial amount of energy may be saved by allowing wider limits for temperature and relative humidity (RH) when there is no surgical activity in the ORs.
This paper aims to explore the extension of the current set point ranges for hygrothermal conditions during unoccupied periods as a strategy to minimize the energy demand in surgical areas. Such an approach is not contemplated by the actual Spanish standard, which recommends keeping the same ventilation and hygrothermal conditions as for periods with surgical activity; that is, a room temperature between 22 and 26 °C and a RH range of 45–55% [41]. However, results from the literature discussed above suggest that there is a substantial margin for reducing the ventilation loads in ORs during off-use hours without compromising the safety of the indoor environment. In fact, more up-to-date guidelines are beginning to promote the energy efficiency through this kind of strategy, with the French standard allowing the widest range for temperature during unoccupied hours [46]. In particular, this code permits the air temperature to vary between 15 and 30 °C during off-use periods, instead of the normal operation range of 19–26 °C, and with no defined limits for the RH in conventional ORs.
Therefore, the principal objective of this investigation is to assess the potential energy savings derived from applying the aforementioned recommendation of the French code to the case of an existing surgical suite of a Spanish hospital. First, the authors develop a dynamic energy model; second, it is calibrated using experimental data collected during occupied and unoccupied periods in the surgical suite. Such a simulation model, created in TRNSYS, is used to evaluate the annual energy performance of the whole suite under different ventilation scenarios. The scenarios were defined following the Spanish [41] and American standards. Temperature and RH setpoint ranges were, during operations, the same as currently used in the surgical suite; during unoccupied periods, temperature limits of 15–30 °C with non-controlled HR were employed. In principle, the safety of the surgical environment is guaranteed because both the ventilation and the hygrothermal conditions will be within the limits established by widely accepted standards. However, the hygrothermal conditions during transitions from unoccupied to occupied periods will be carefully studied, as well as the possibility of moisture condensation.

2. Materials and Methods

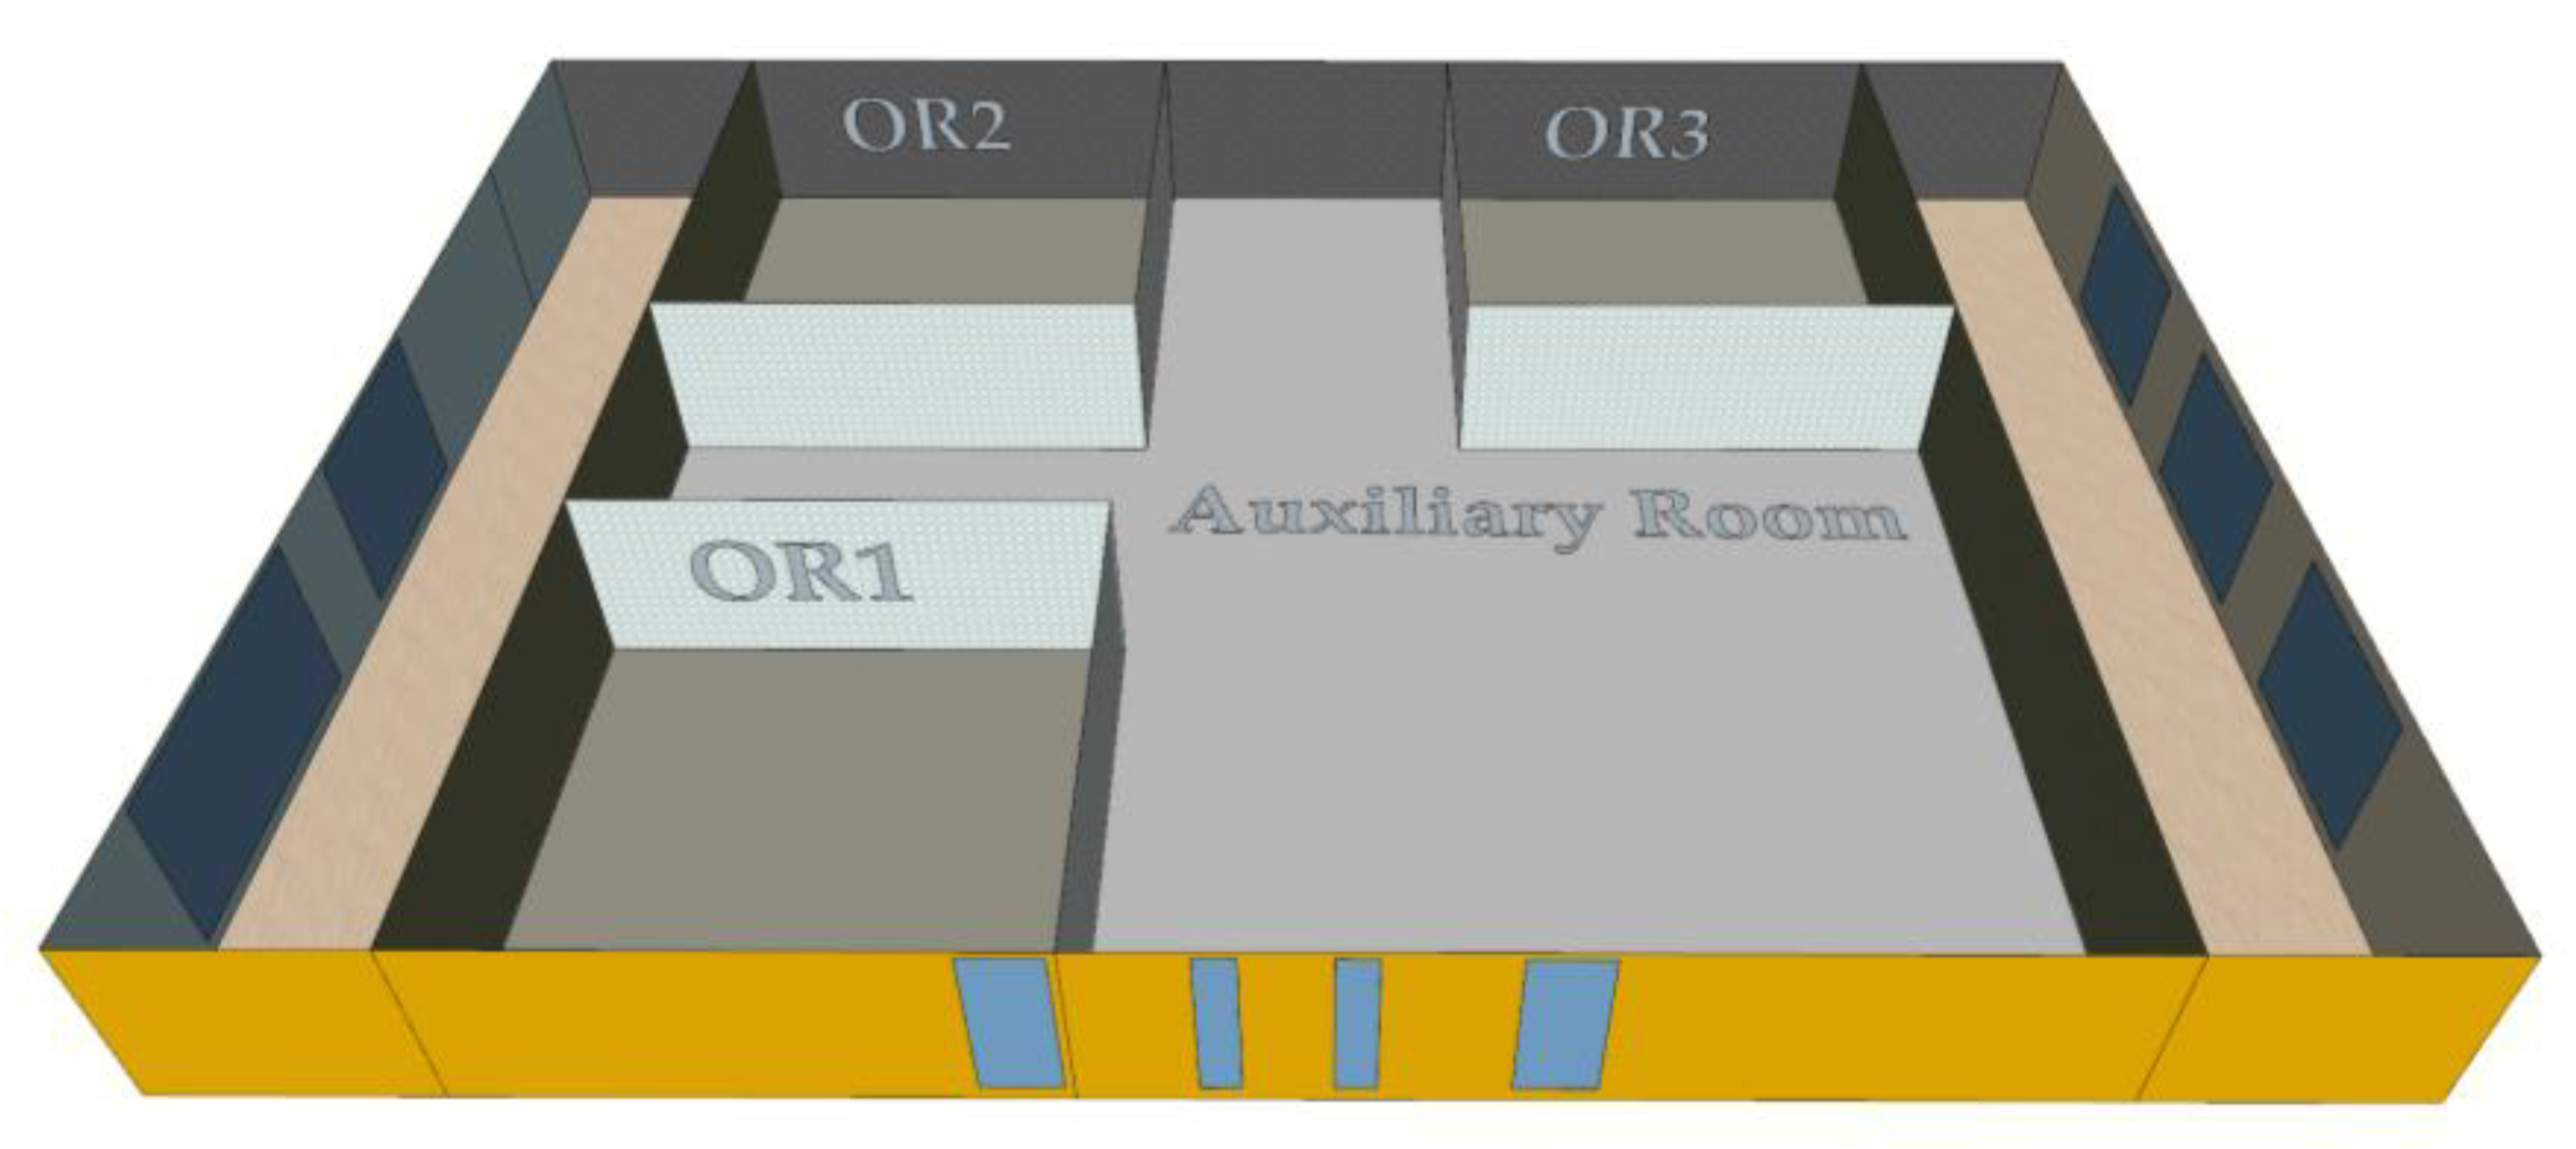
2.1. Description of the Surgical Suite and the Experimental Procedure

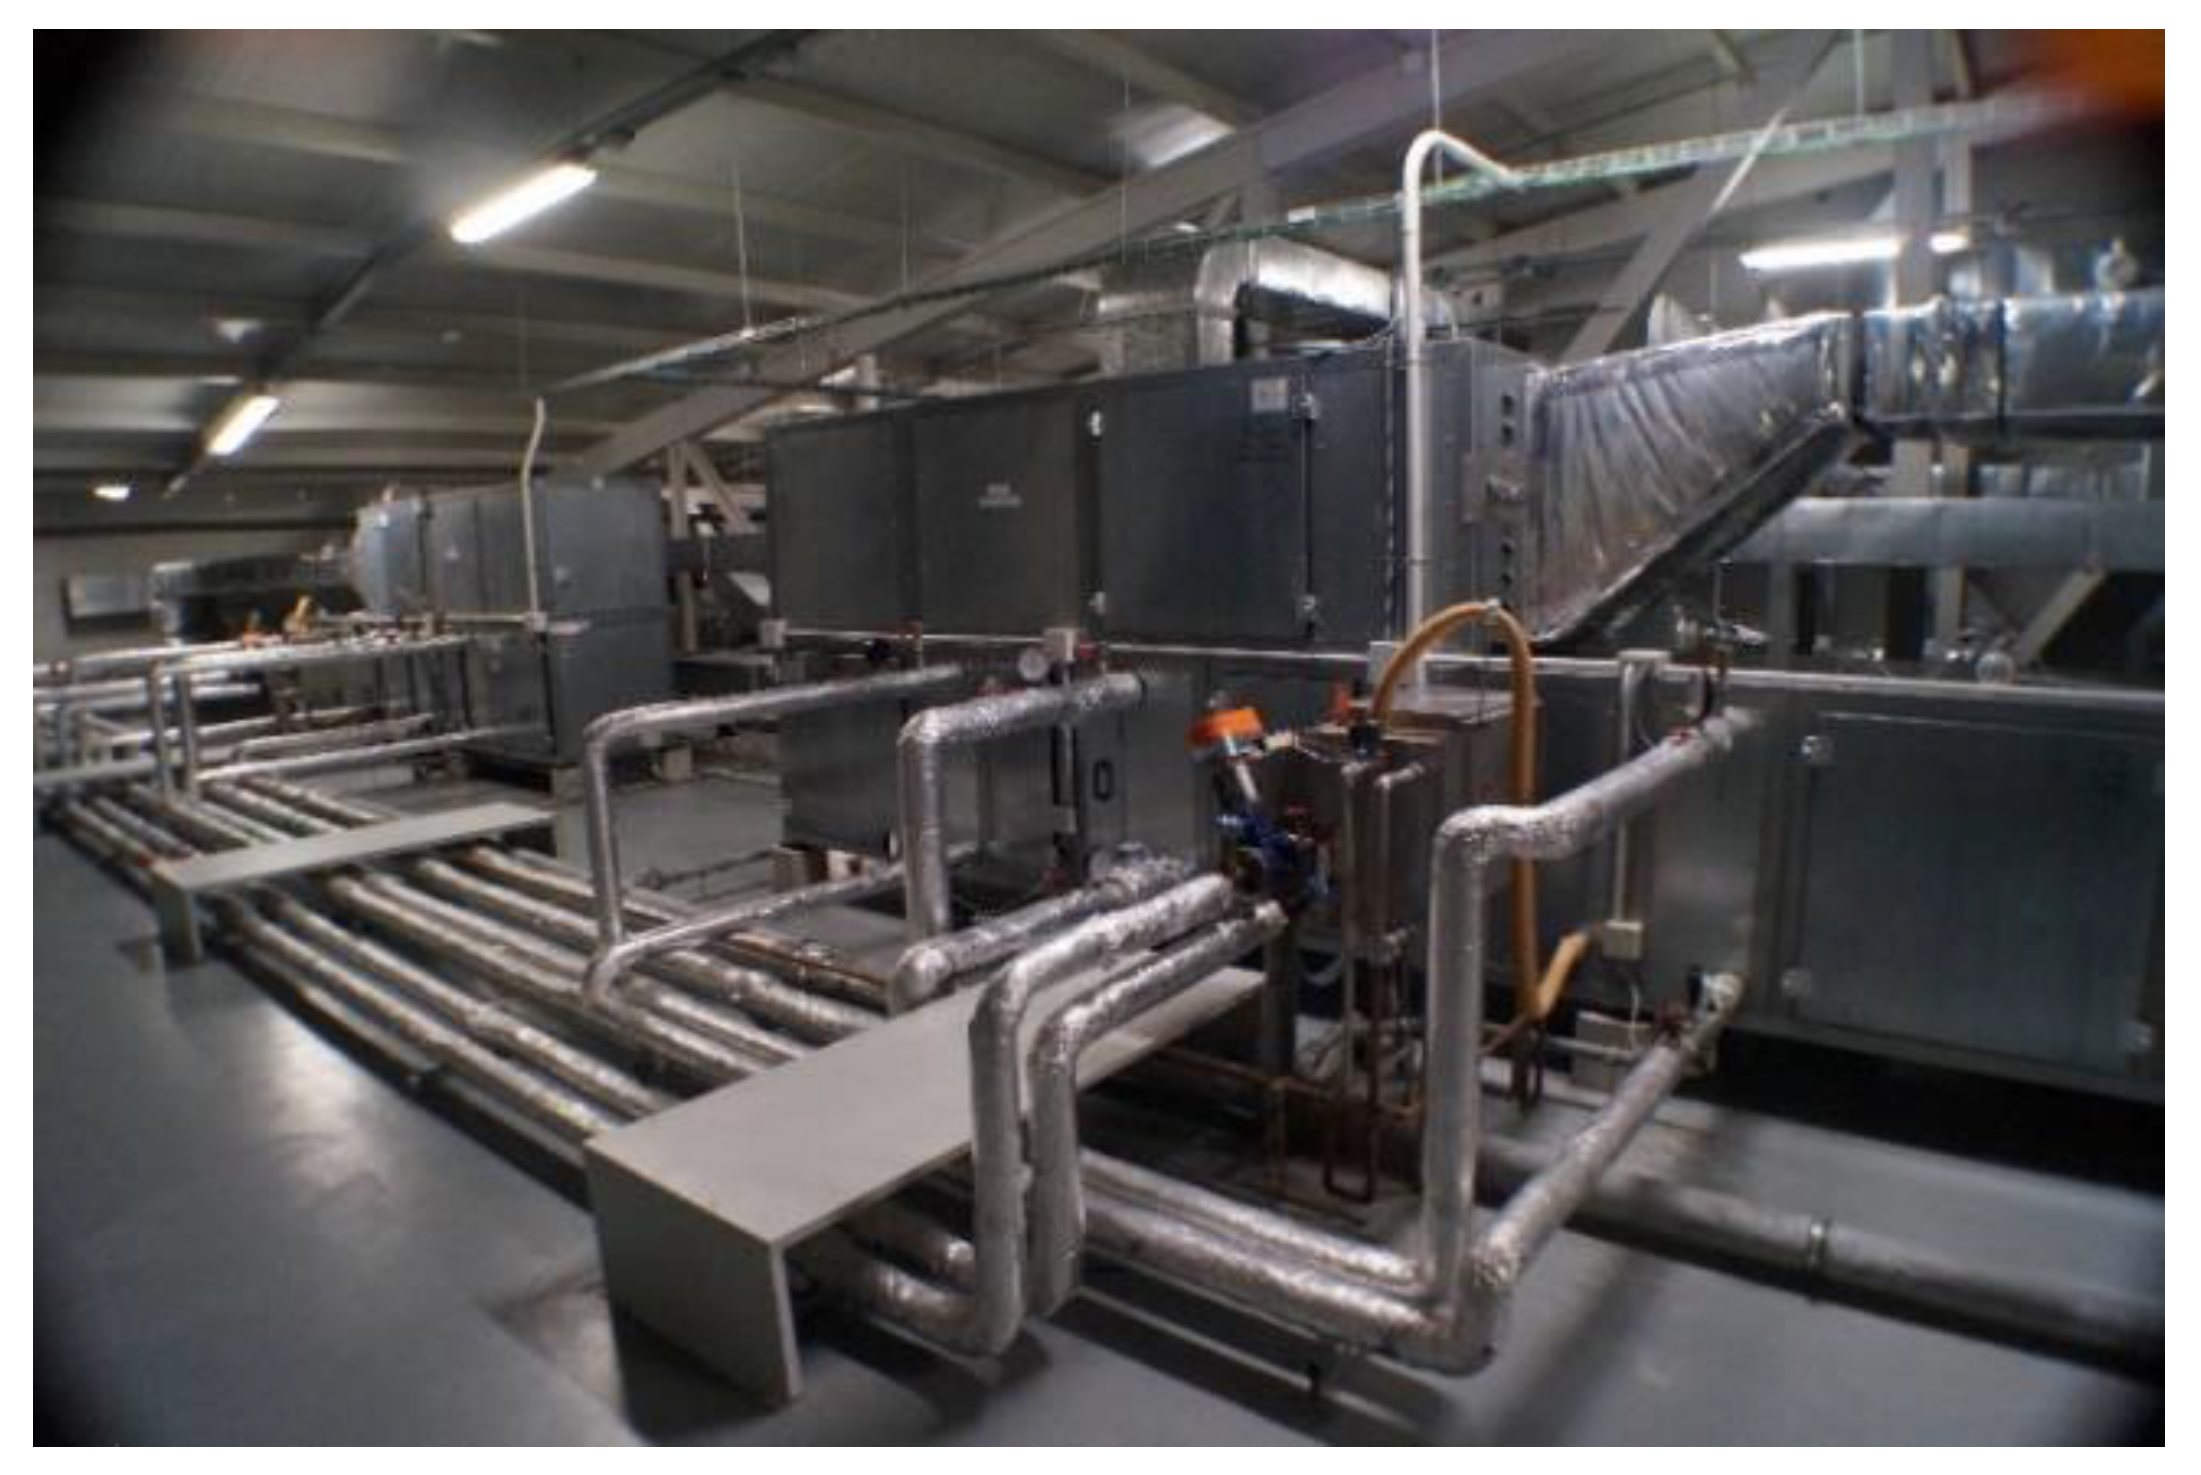
2.1.1. The Surgical Suite and Its HVAC System

The surgical suite studied in this article is located in the Lucus Augusti University Hospital (HULA) in Lugo, in the northwest of Spain. The electrical energy consumption of the hospital in 2018 was 22.08 GWh and its thermal energy consumption in 2018 was around 30.8 GWh (Liquefied Natural Gas - LNG). As the HULA has an area of 185,000 m2, this implies a consumption of 285 kWh/m2/year (119 kWh/m2/year electrical energy and 166 kWh/m2/year thermal energy). This means an energy bill of around 3.1 M€. This data highlights the importance of an efficient use of energy and the consequent economic savings that this would entail. However, energy savings must be implemented guaranteeing air indoor quality (AIQ) conditions. The hospital incorporates six surgical suites and four dedicated ORs. For its part, the studied surgical suite consists of three identical ORs, a sterile entrance corridor, an unsterile exit corridor, two scrub rooms, a storage room, a pre-anesthesia room, an anteroom and a hall. Detailed information of the hospital, the surgical suite and the characteristics of the ORs, as well as construction characteristics of the surgical suite envelope and its interior partition walls can be found in [21,38].
The internal loads of the surgical suite are occupancy, lighting and equipment. The occupancy includes patients and medical staff present during operations, so it depends on the operations schedule. Lighting comes from fluorescents and LED lamps placed in ORs, ancillary rooms and corridors. Moreover, the medical and surgical equipment comprises batteries, monitors, electrosurgical units, laparoscopy tower, etc. This equipment does not always work simultaneously. Table 1 summarizes the lighting and equipment power in the different spaces of the surgical suite. Further information can be found in [21,38].
The surgical suite is generally used to conduct ordinary surgeries in the mornings of working days; it is not used for emergency operations. The schedule of the working days is from 8 am to 3 pm from Monday to Friday. Therefore, the surgical suite is not occupied in evenings and weekends
Regarding the HVAC system, the surgical suite comprises six Air Handling Units (AHUs) (Figure 1), one for each OR, one for the ancillary rooms and one for each corridor. It is allocated in the upper floor. The total net area of the surgical suite is 425.37 m2. The Spanish standard UNE 100713:2005 Air conditioning in hospitals [41] establishes a minimum airflow of 2400 m3/h with a minimum of outdoor air of 1200 m3/h and with a minimum of 20 ACH for air mixing diffusion systems. Therefore, taking into account the dimensions of the surgical suite and the Spanish standard recommendations [41], the ORs operate with 2400 m3/h or 21.5 ACH and the remaining spaces with 2680 m3/h or 6 ACH. At present, the HVAC system maintains a constant ventilation 24/7 with 100% outdoor airflow intake without reduction in periods of inactivity. The supply air outlets use High Efficiency Particulate Air (HEPA) filters. Temperature and RH conditions are maintained throughout the surgical suite according to Spanish standards [41], with temperature between 22 and 26 °C and RH between 45% and 55%, and positive pressurization of ORs to ensure adequate conditions of comfort and asepsis.

2.1.2. Experimental Tests

Two experimental campaigns were carried out in the surgical area. The first data collection period was developed from 00:00 h on Thursday 18th July 2019 to 09:00 h on Sunday 21th July 2019. It was conducted during unoccupied periods to avoid interference with the normal activity of the surgical suite and uncertainty of unforeseen events. During these days there were no scheduled operations; therefore, it was tested to introduce directly 100% outside air without air conditioning from 13:30 h on Friday 19th July 2019. The data of indoor conditions measured during this period were used to calibrate the energy model of the surgical suite. The second data collection period was performed from 10:00 h on Friday 13th September 2019 to 2:00 h on Friday 20th September 2019. In this case, the ventilation period with non-conditioned fresh air started at 10:00 h on Saturday 14th September 2019 and continued for a 24-h period. This second experimental campaign was used to validate the calibrated model, as there were normal periods of surgical activity and periods of inactivity.
Temperature and RH sensors were used to record the indoor air conditions of the surgical suite, as observed in Table 2. These sensors were located at a height of 1.5 m. Other measured variables were supply airflow rate of AHUs, return airflow rate of AHUs, enthalpy and electrical consumption in the ORs. A five-minute SCADA (Supervisory Control And Data Acquisition) system collected all data. The SCADA system consists of a PXC64-U automation station working with the software DDESIGO INSIGHT V4.1.1, both provided by Siemens (Berlin, Germany). In addition, surgical activity and the number of people present in the ORs were recorded at all times. Further description of the sensors can be found in [21,38].

2.2. Simulation Procedure

This section describes the simulation procedure, from the energy model creation to the model calibration and the different simulation scenarios defined to assess the energy performance of the surgical suite.

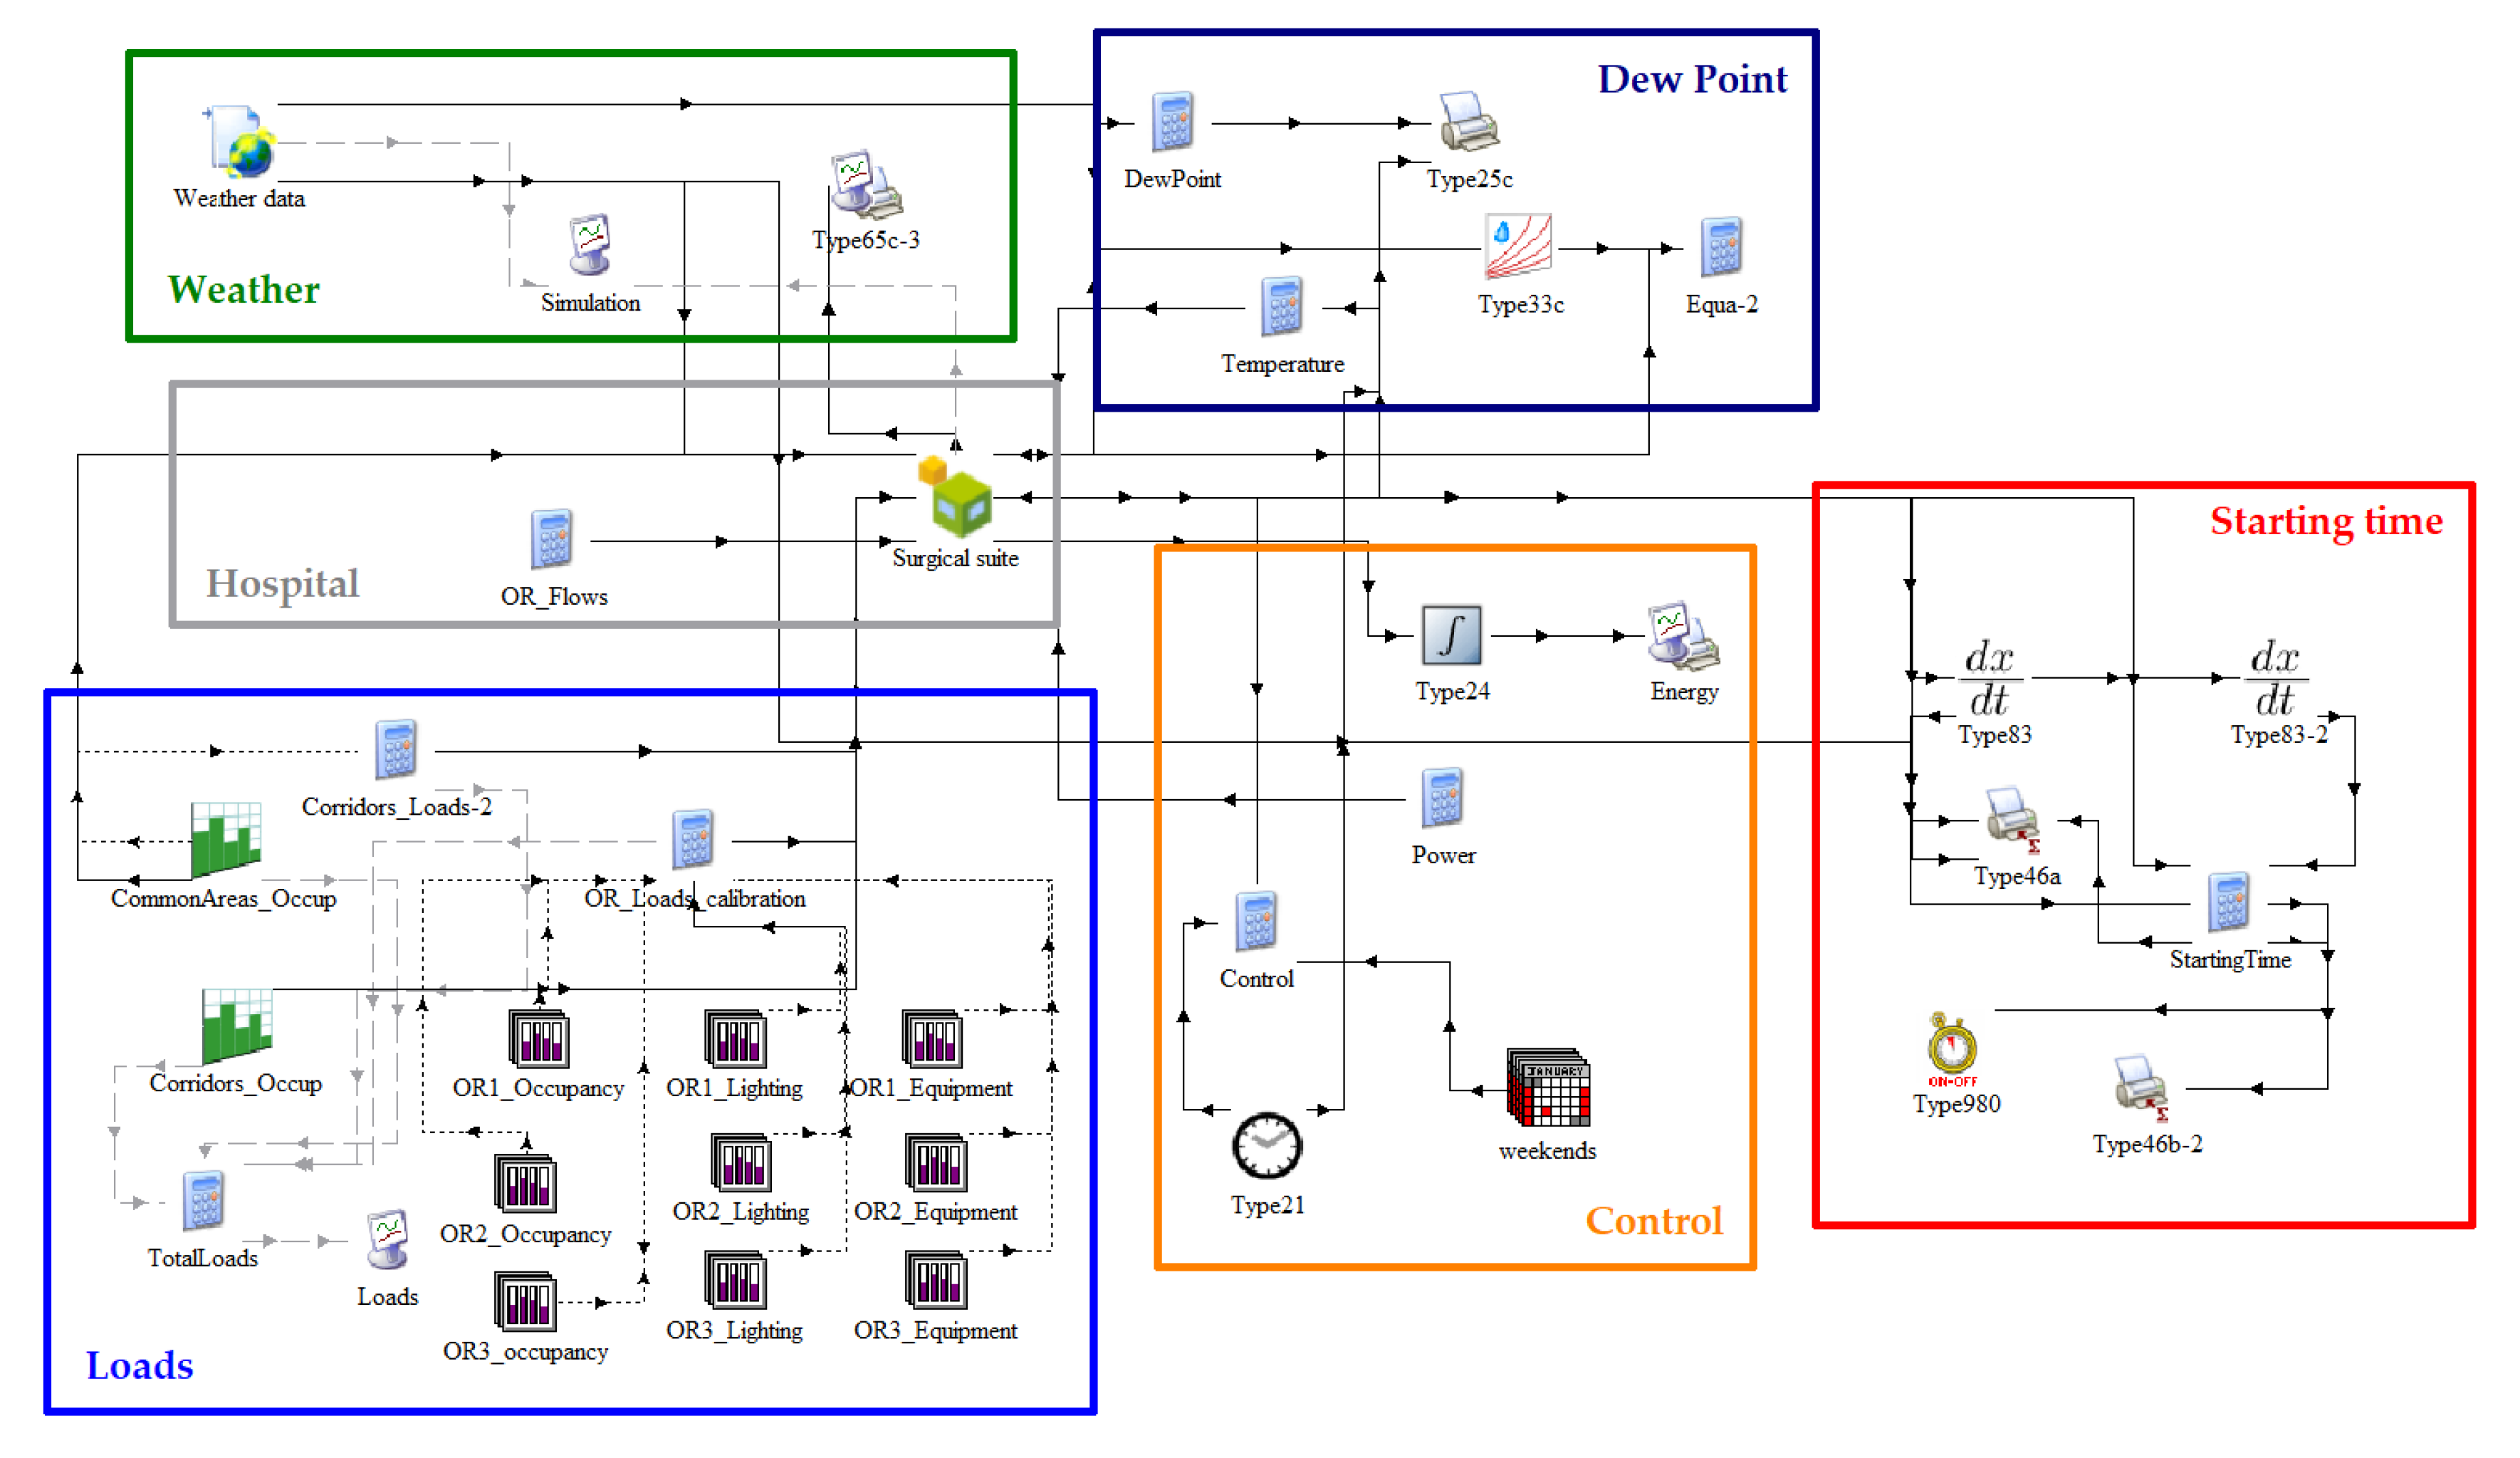
2.2.1. Dynamic Thermal Model

The geometric model of the surgical suite was defined using SketchUp and the plug-in of TRNSYS3D, as in previous works of the authors [21,38]. A 3D building energy model (BEM) with six different thermal zones was created, as observed in Figure 2. Each of these thermal zones was air-conditioned by the aforementioned AHUs. TRNBuild was used to define the constructive elements.
Then, TRNSYS [47] was used to complete the thermal model. TRNSYS enables the behavior simulation of transient systems solving complex situations with a modular structure. This model of the surgical suite predicts variables of indoor air conditions of spaces and surfaces, in addition to calculating the energy consumed by the HVAC system in the different operating conditions imposed. Figure 3 represents the TRNSYS diagram of the dynamic simulation and the different types of the tool are shown. Type 56 represents the building energy model of the surgical suite. A weather file is provided in typical meteorological year (TMY) format, downloaded from a meteorological station in the city of Lugo. The internal loads are modelled using hourly schedulers. The occupancy was defined according to the standard ISO 7730:2005 [48] corresponding to a standing and light work activity. Lighting was assumed to be completely on during occupied periods and equipment was defined according to information reported by the surgical staff. Apart from the output variables, the model calculates the deviation of the simulated results with respect to the experimental data provided.

2.2.2. Calibration and Contrasting

Reducing the gap between simulated and real behavior of the surgical suite is the main goal to obtain accurate results. In this respect, real data from the first set of experimental tests were used to calibrate the model (see Section 2.1.2). The calibration method was executed using the software GenOpt 3.0.1 [49]. The GPS Hooke–Jeeves algorithm “Hybrid Generalized Pattern Search Algorithm with Particle Swarm Optimization Algorithm” was applied. The technique consists of performing successive simulations while varying parameters within predetermined limits and looking for the minimization of a function, in this case the coefficient of variation of the root mean square error (CV(RMSE)), defined in Equation (1). The CV(RMSE) measures the bias between measured and simulated values [50].
C V ( R M S E ) = i = 1 n ( X s i m X r e a l ) 2 / n X r e a l ¯
where:
  • X r e a l ¯ mean of measured values.
  • n   number of measured data points.
  • X r e a l measured value.
  • X s i m   simulated value.

2.2.3. Simulation of Different Scenarios

Once the energy model of the surgical suite was calibrated and it behaved as in reality with the minimum discrepancies, a study of its performance was carried out in different scenarios. The objective was to determine an optimal ventilation strategy that allows reducing the annual energy demand while preserving indoor health and comfort conditions.
Scenario 0, or the current operation mode (COM), was running with outdoor fresh air as supplied as intake air to the surgical suite. A total airflow of 2400 m3/h in the case of the ORs (21.5 ACH) and 2680 m3/h in the case of auxiliary rooms (6 ACH) was used. The set point temperatures were 22 °C in the ORs, 23.5 °C for the ancillary rooms and 24.5 °C in the corridors.
The thermal zones were simulated using an ideal heating and cooling system, and the hygrothermal conditions were kept within values allowed by standards, therefore ensuring the safety of the surgical environment. During occupied periods (working days from 8 am to 3 pm) the recommendations of the Spanish standard were followed [41]. The ORs were maintained at a temperature of 22 °C and RH between 45% and 55%; the ancillary rooms were preserved at a temperature of 23.5 °C and RH between 45% and 55%; and the corridors were kept at a temperature of 24.5 °C and RH between 45% and 55%. During non-occupied periods, the wider range allowed by the French standard was assumed [46]; so the ORs and the ancillary rooms were maintained at a temperature between 15 and 30 °C, and RH boundless but avoiding condensation. Considering these hygrothermal conditions, the following ventilation scenarios were simulated and analyzed (Table 3):
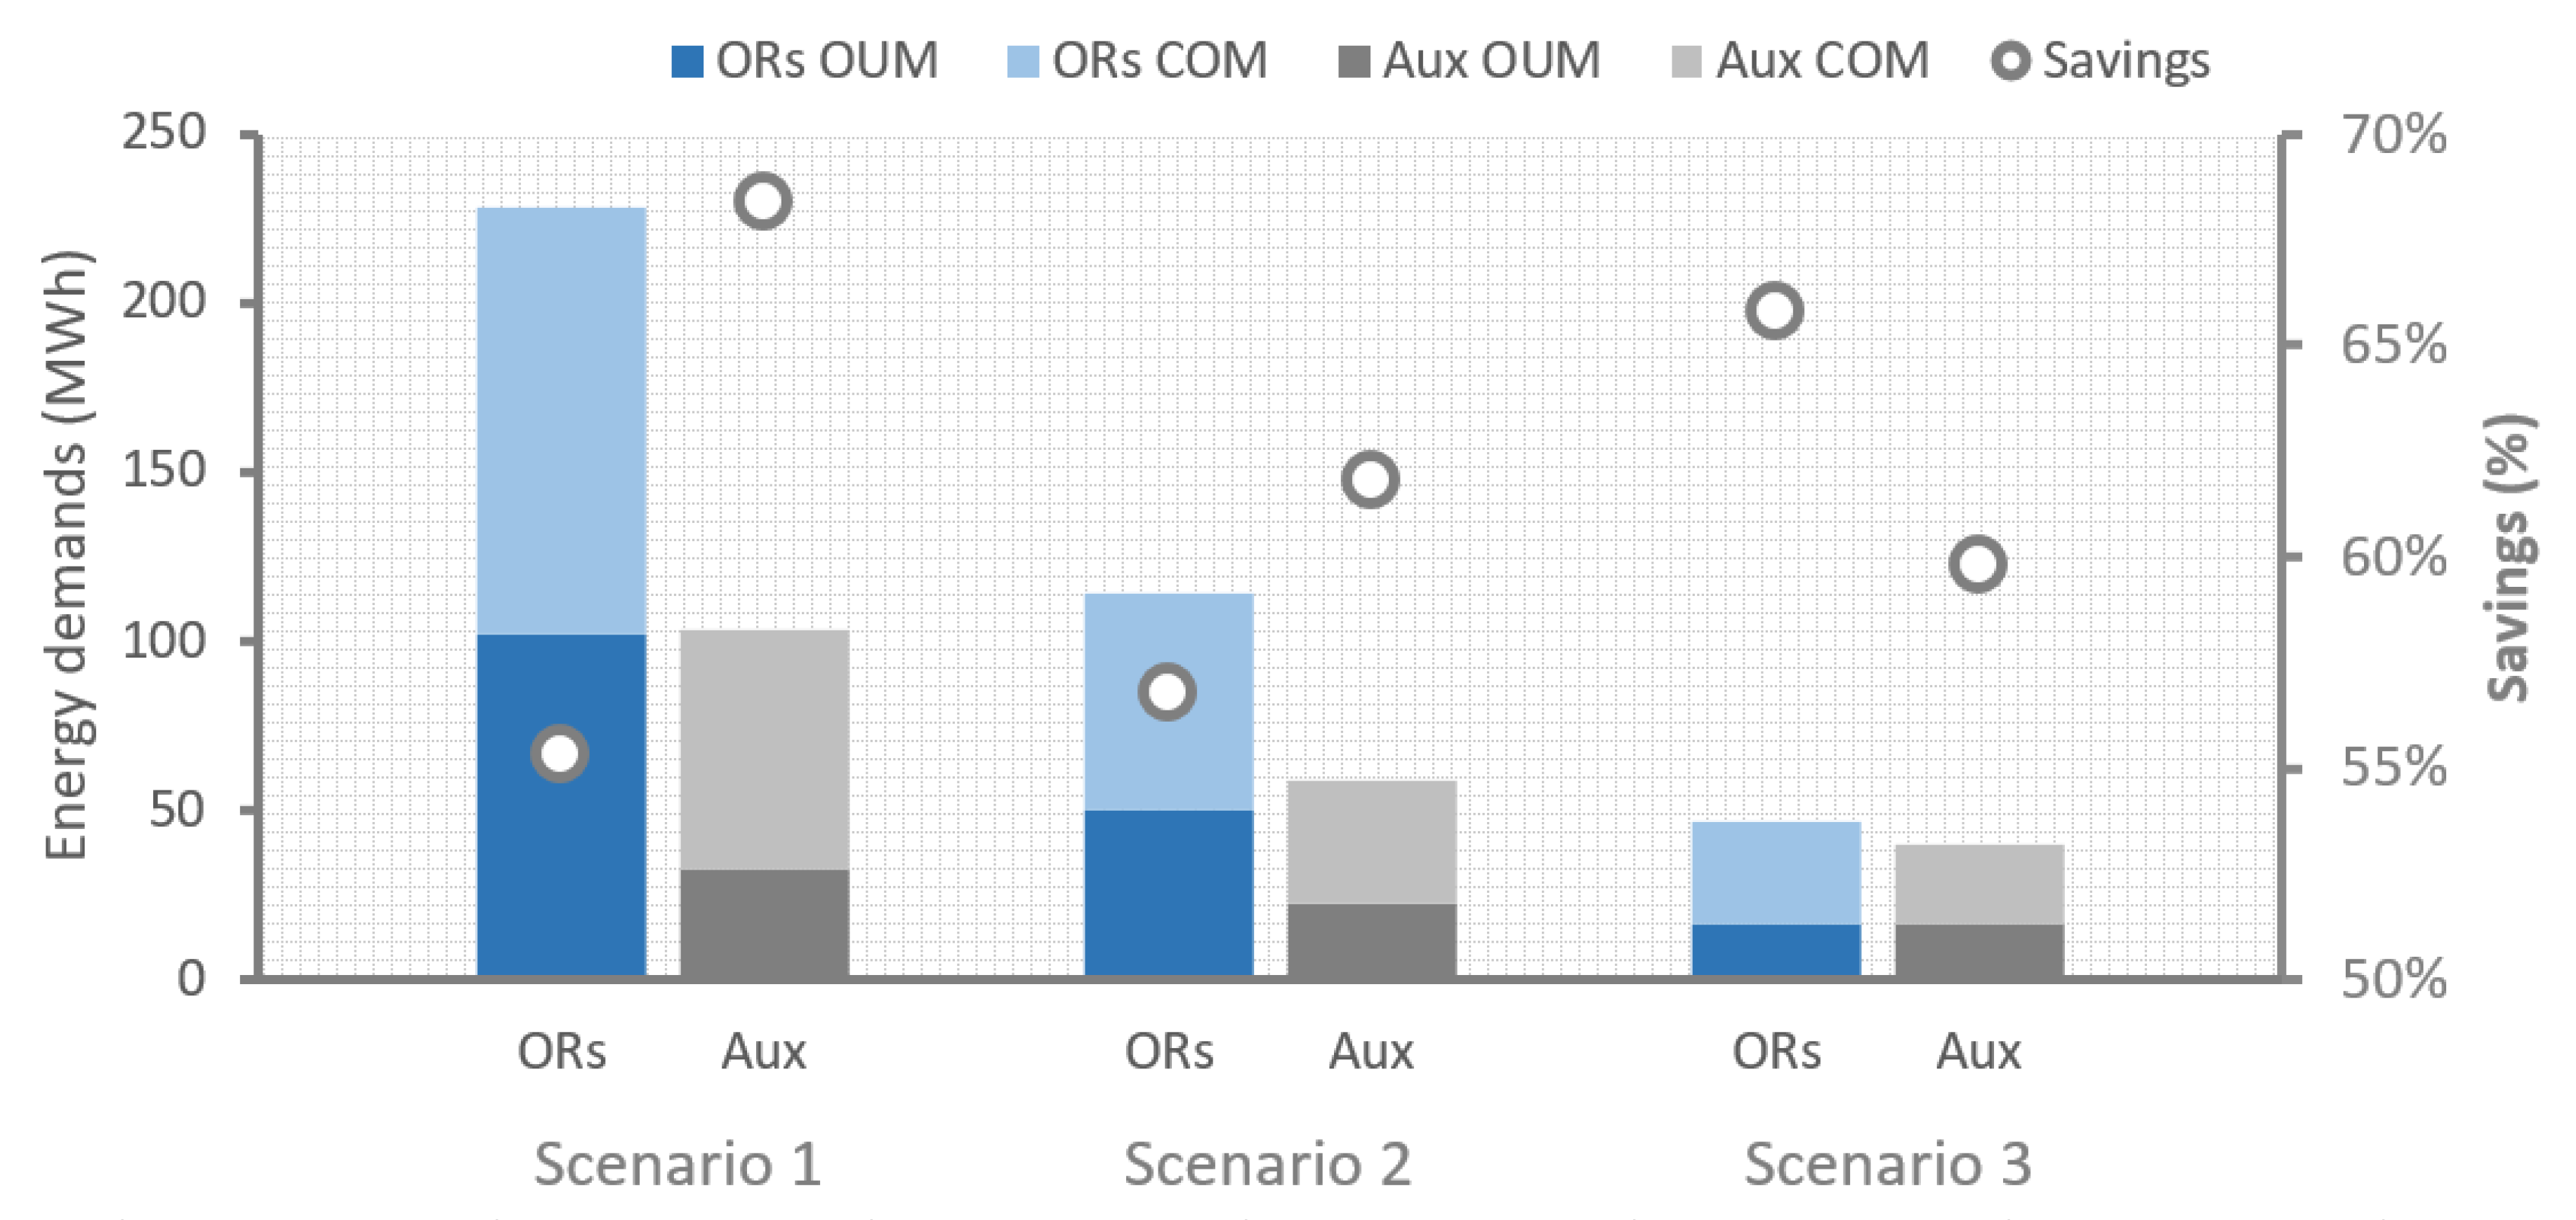
  • Scenario 1. Considering the actual design operation rates. This means 21.5 ACH in the ORs and 6 ACH in the ancillary rooms, with 100% outdoor fresh air intake in both cases.
  • Scenario 2. Considering a reduction of the 50% of outdoor fresh air. This means 21.5 ACH in the ORs, 6 ACH in the ancillary rooms, but with an air recirculation rate of 50% in both cases.
  • Scenario 3. Considering the American standard requirements for ventilation [42]. This means 20 ACH in the ORs with a total fresh air intake of 4 ACH, and 6 ACH in the ancillary rooms with 2 ACH of fresh air.

3. Results and Discussion

In this section, the main experimental and simulation results are presented. Firstly, the two experimental data campaigns during different periods of the year 2019 are analyzed. Secondly, both the simulation and the experimental results are compared. Finally, the simulation results obtained with the calibrated model are presented and discussed, including the annual thermal demand and the potential savings under different ventilation scenarios.

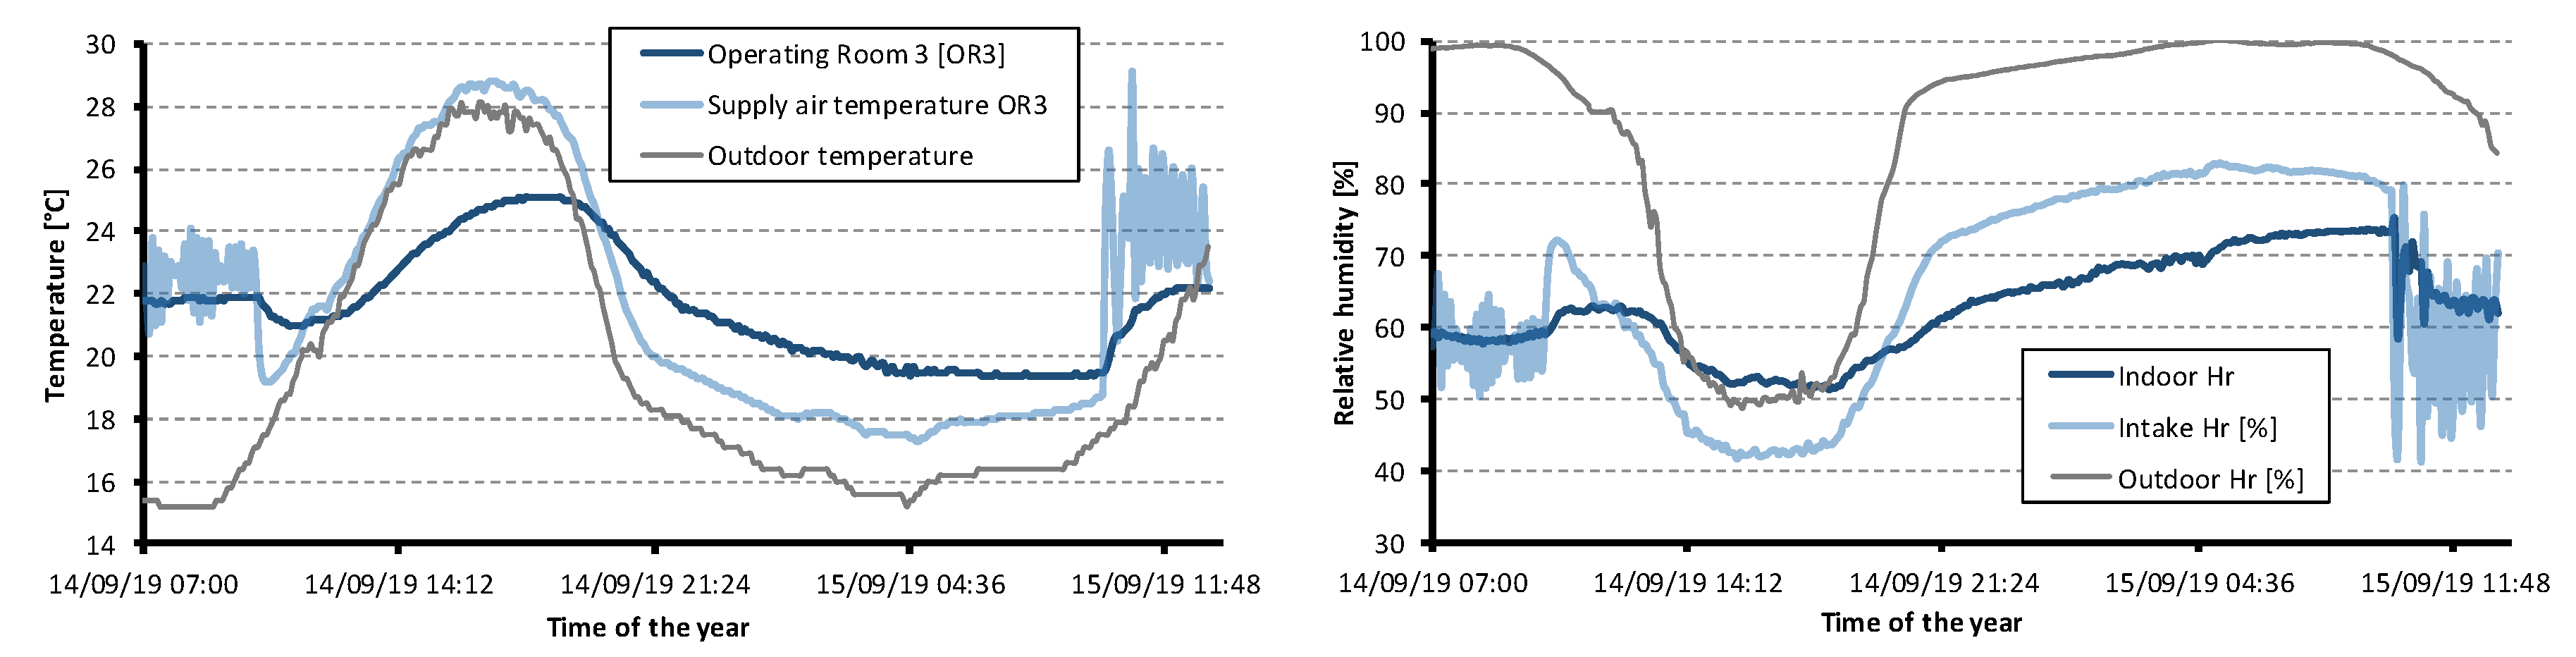
3.1. Assessment of the Experimental Results

Two data collection campaigns were undertaken in the surgical suite during the year 2019 as explained in Section 2.1.2.

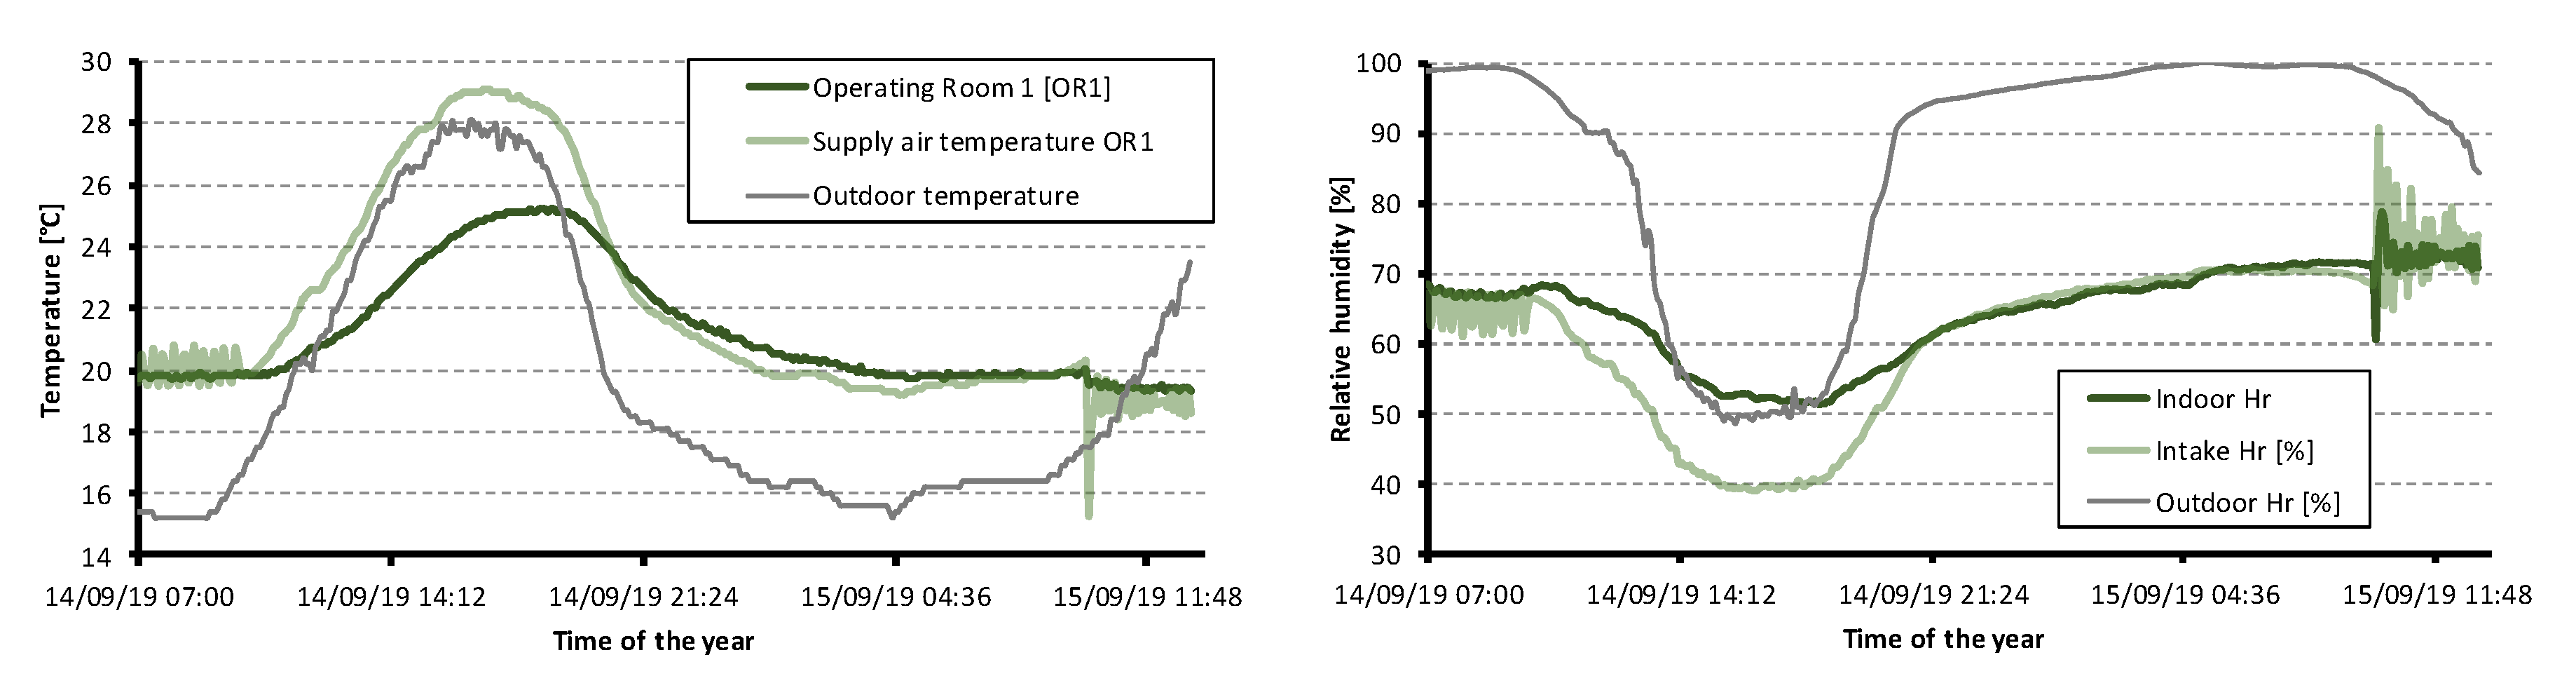
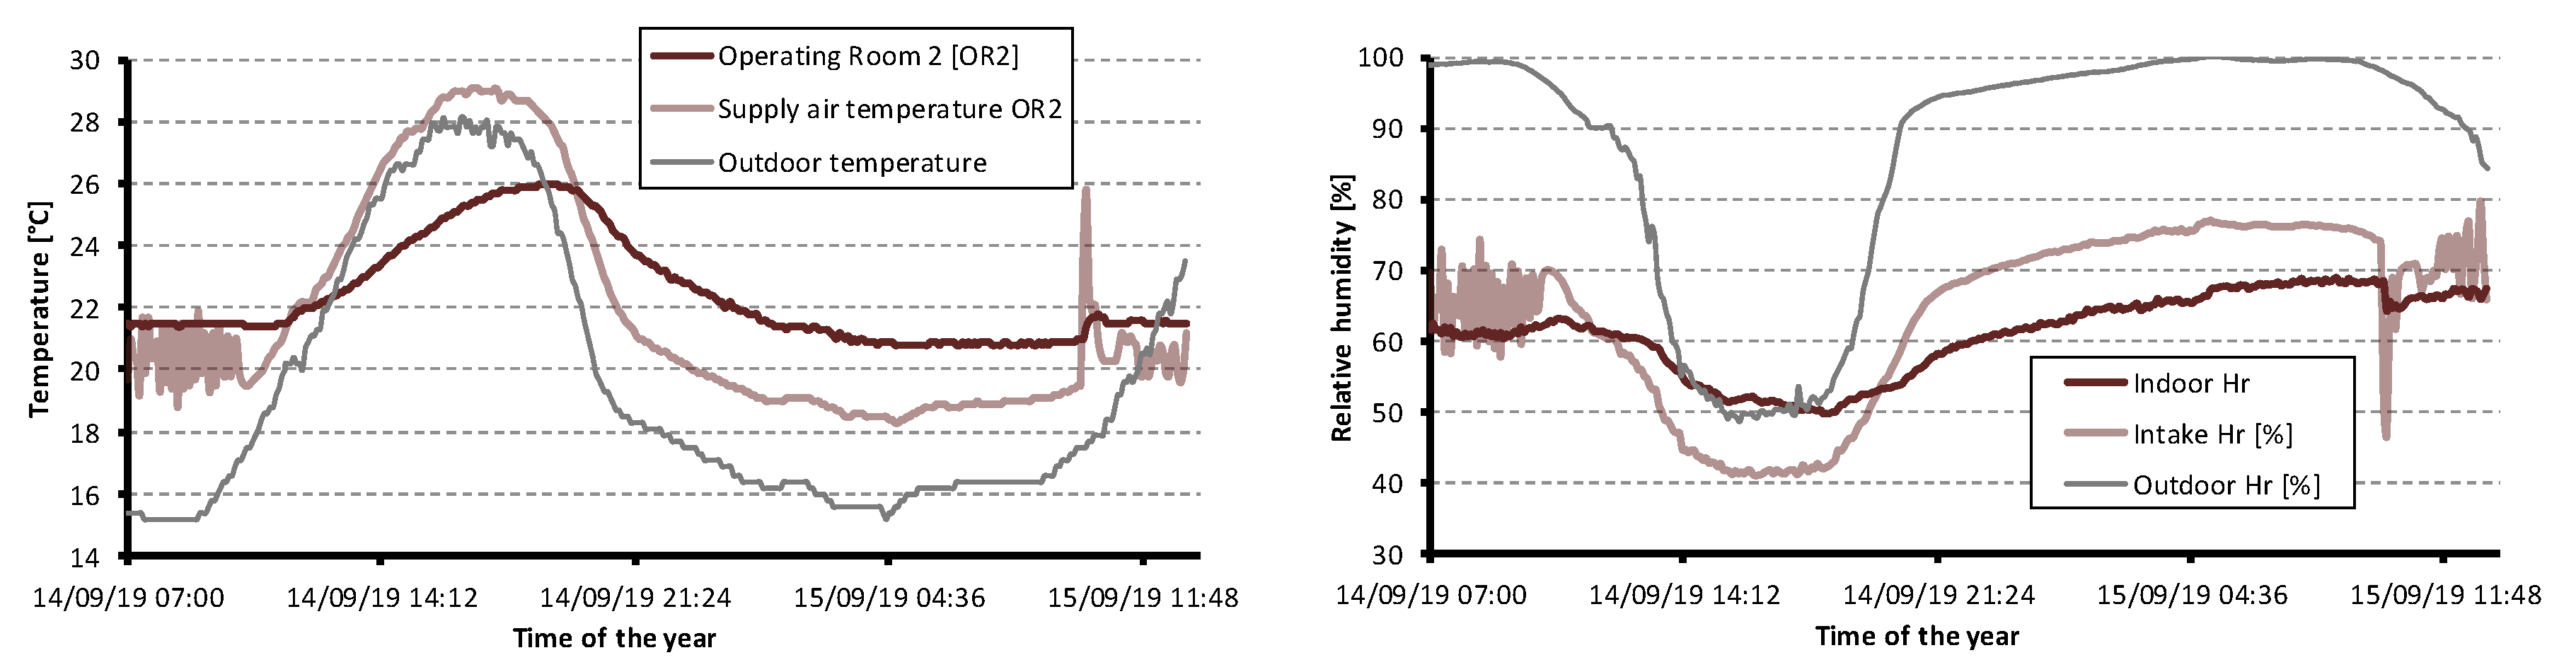
3.1.1. First Data Collection Period

Figure 4 represents the supply air temperature and the indoor temperature of OR1. During the first 13 h, the HVAC system is still working so a steady state can be observed; the OR is ventilated and conditioned. After these hours, which correspond to off-use periods, the room is ventilated without air conditioning and is left following free-floating conditions. It is shown how the capacitance of the room flattens the profile of temperature and RH of the supply air.
Figure 5 shows the temperature and RH within OR2. When the ORs are conditioned, the indoor parameters from OR2 and OR1 are different due to requirements of operations or occupants. Despite this, when the rooms are ventilated with unconditioned fresh air, the indoor temperature and RH gets very similar values to OR1 due to the similarity of the capacitances.
The behavior of OR3 is similar to the rest of the ORs and is shown in Figure 6. When the room is conditioned, the temperature evolution of the room when the set point temperature is 22 °C is similar to the temperature evolution from OR1. During the unoccupied period, the RH values in OR3 are slightly higher than in the other ORs, ranging from 19.1% to 68.9% (Table 4).
Table 4 shows the maximum and minimum values of RH and temperature measured in the different ORs. The highest fluctuation of the indoor air temperature is 7.4 °C, reached inside OR3. The maximum oscillation of RH was 27.5%, obtained between day and night hours, also in OR3. The fluctuations of temperature and RH are in general higher in the intake air reaching maximum variation values in OR3 of 15.9 °C and 47.9%, respectively.

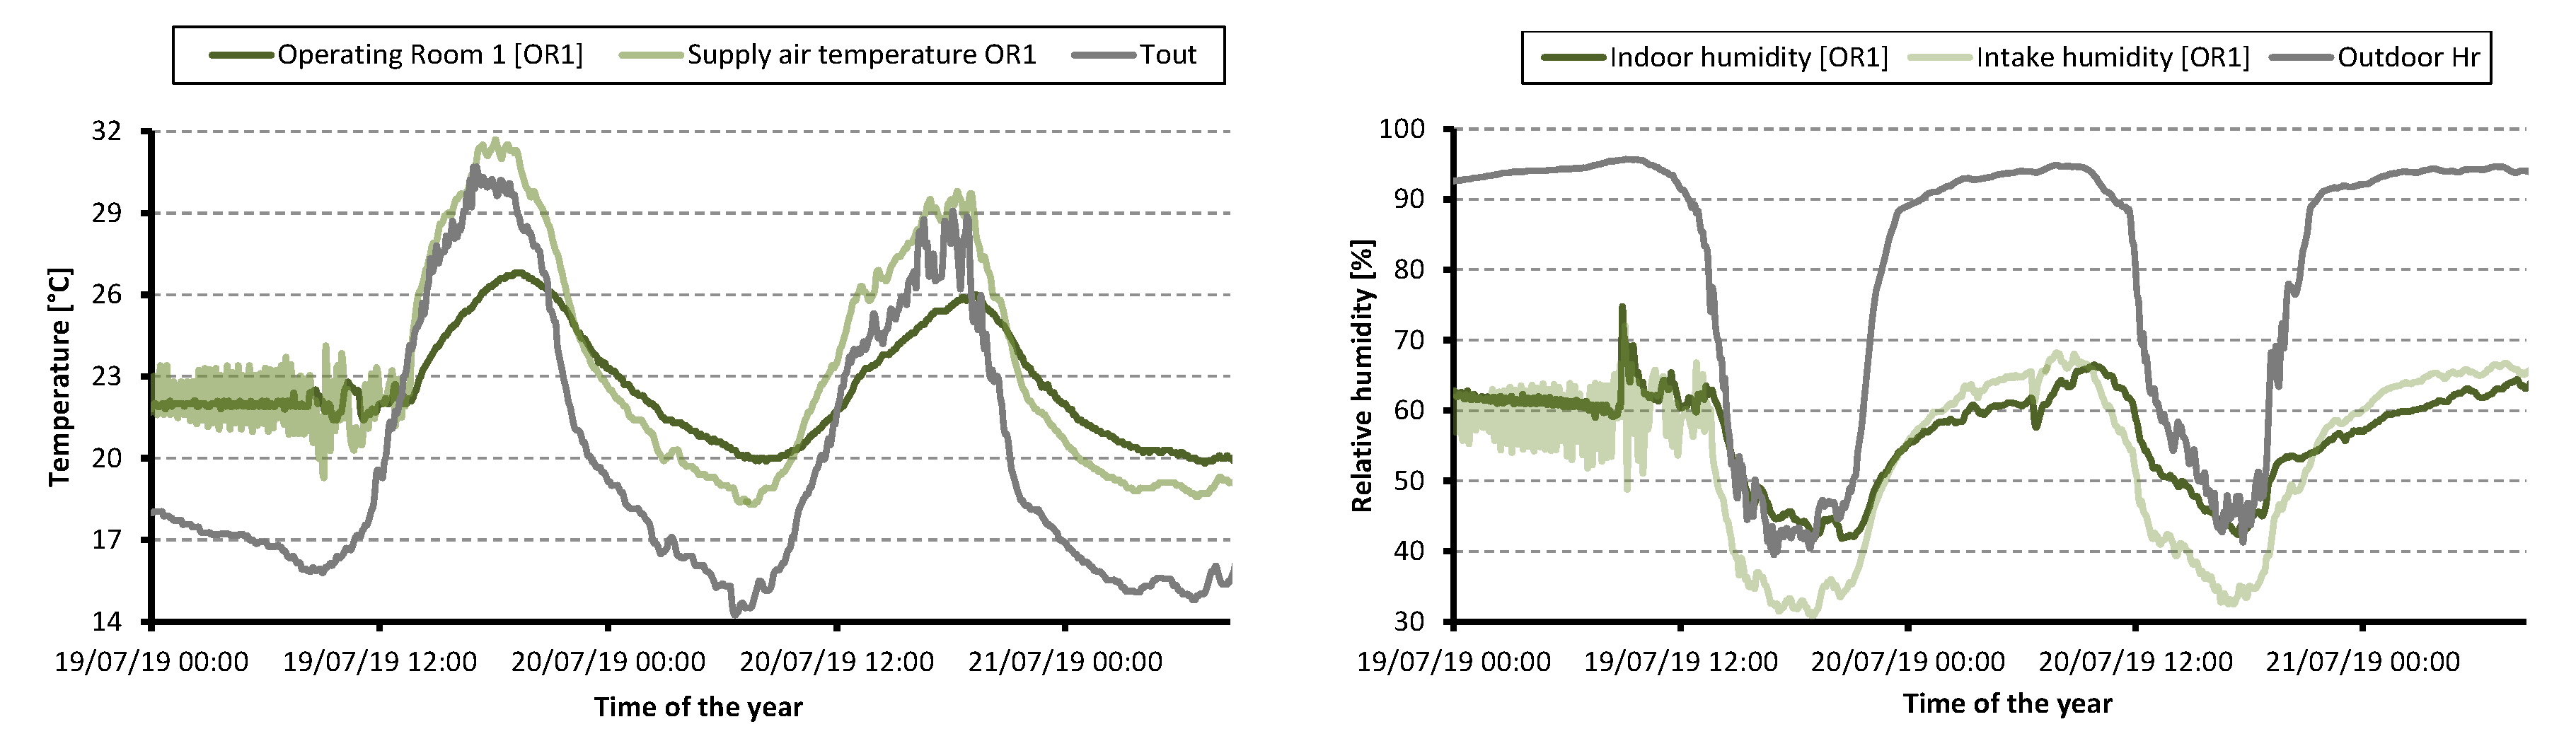
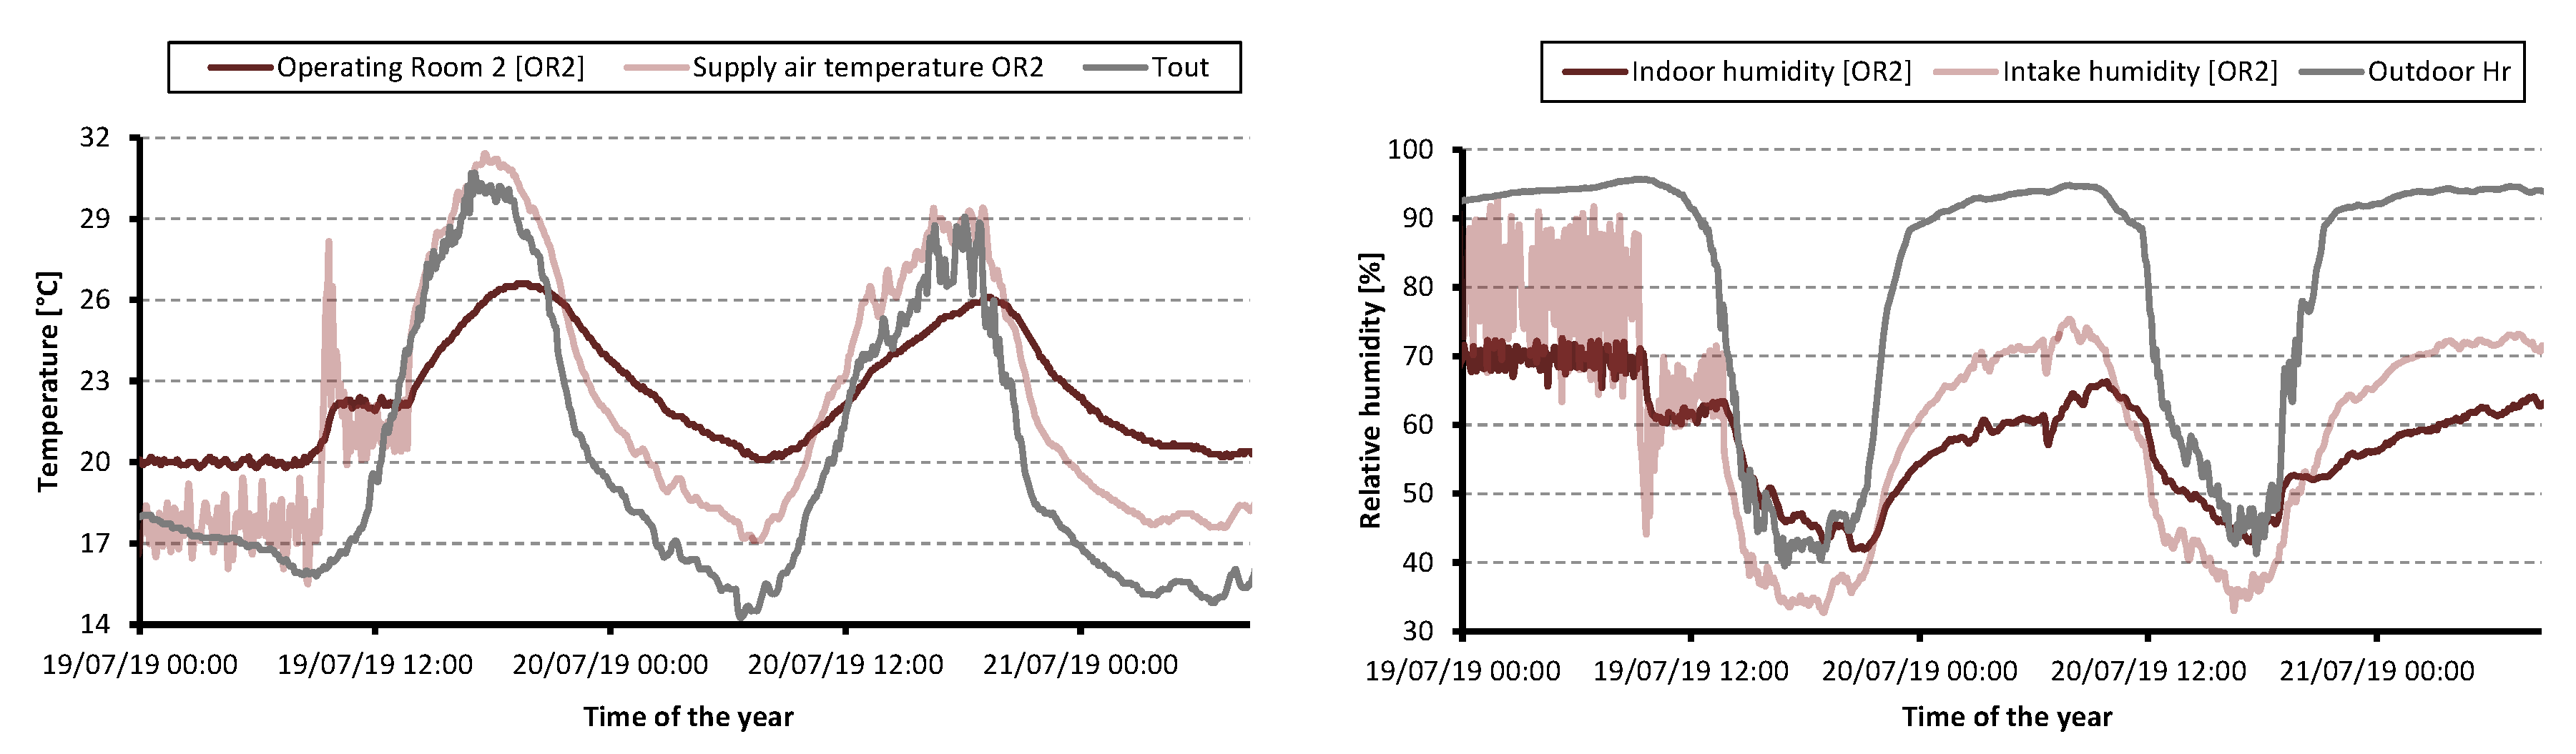
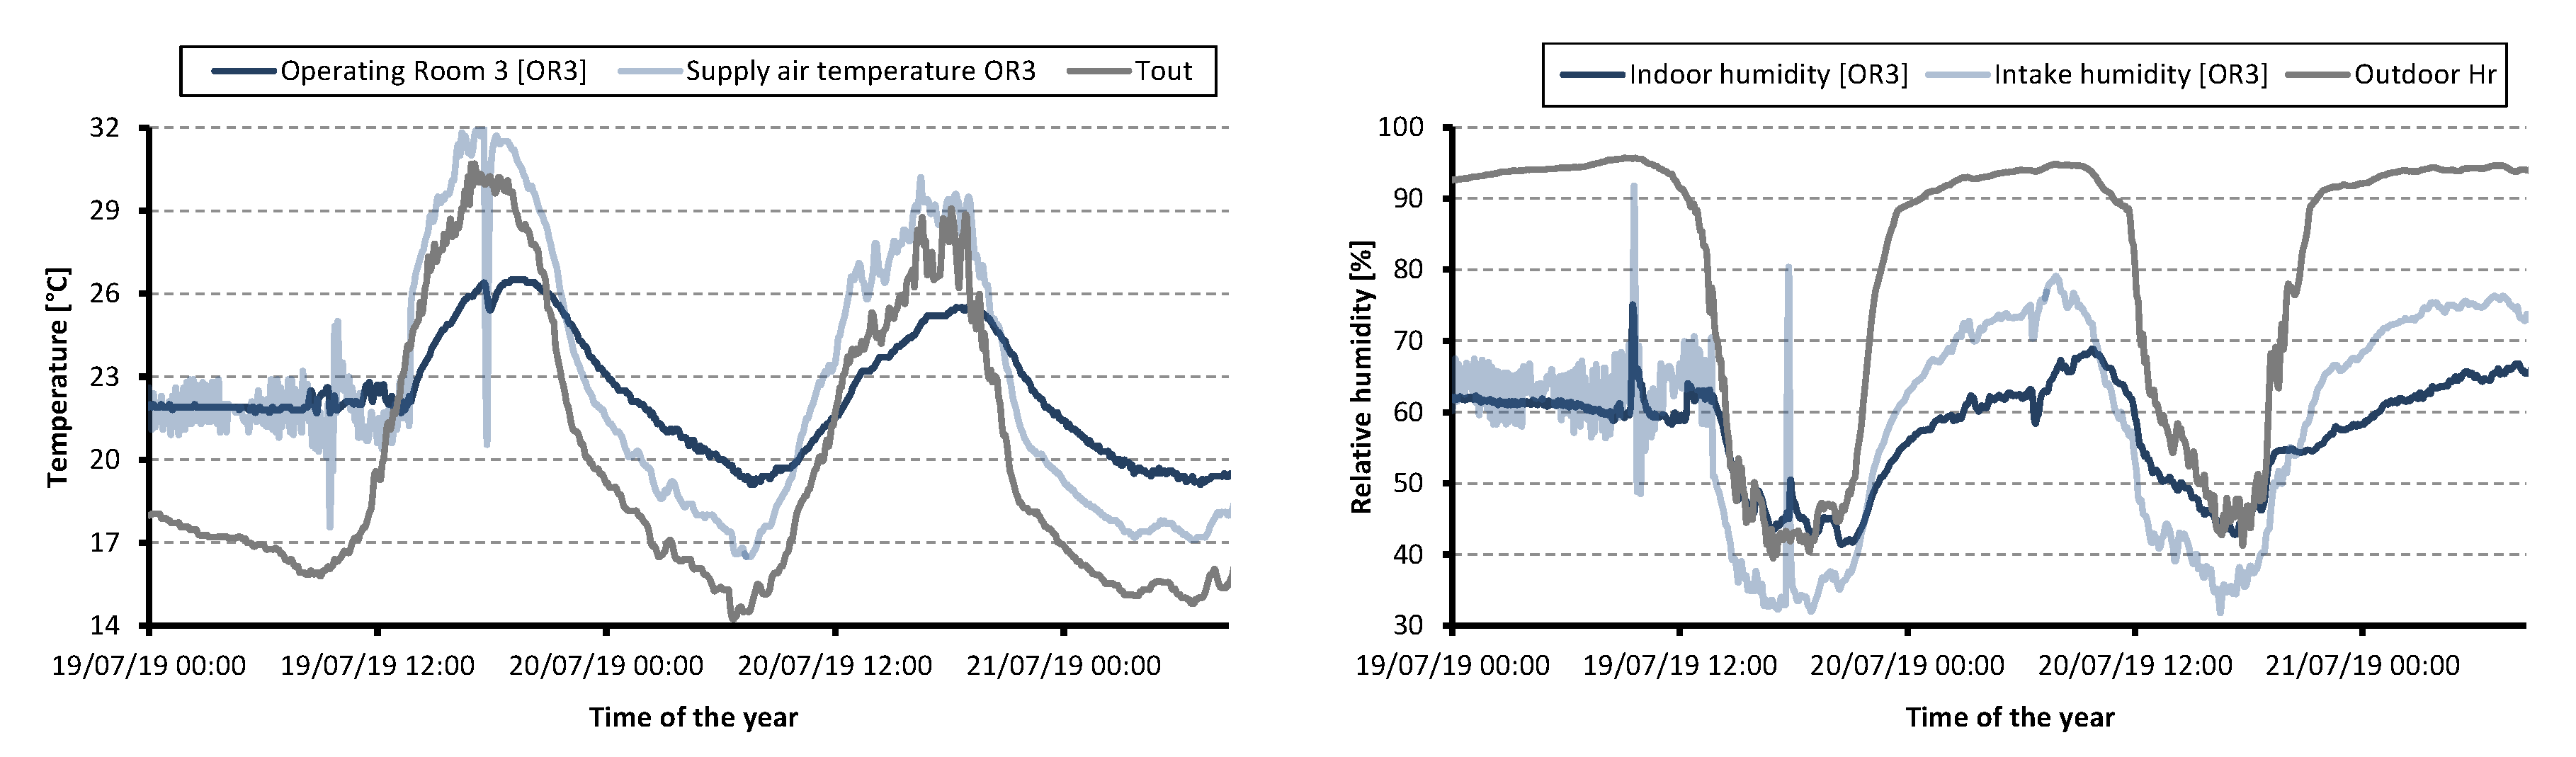
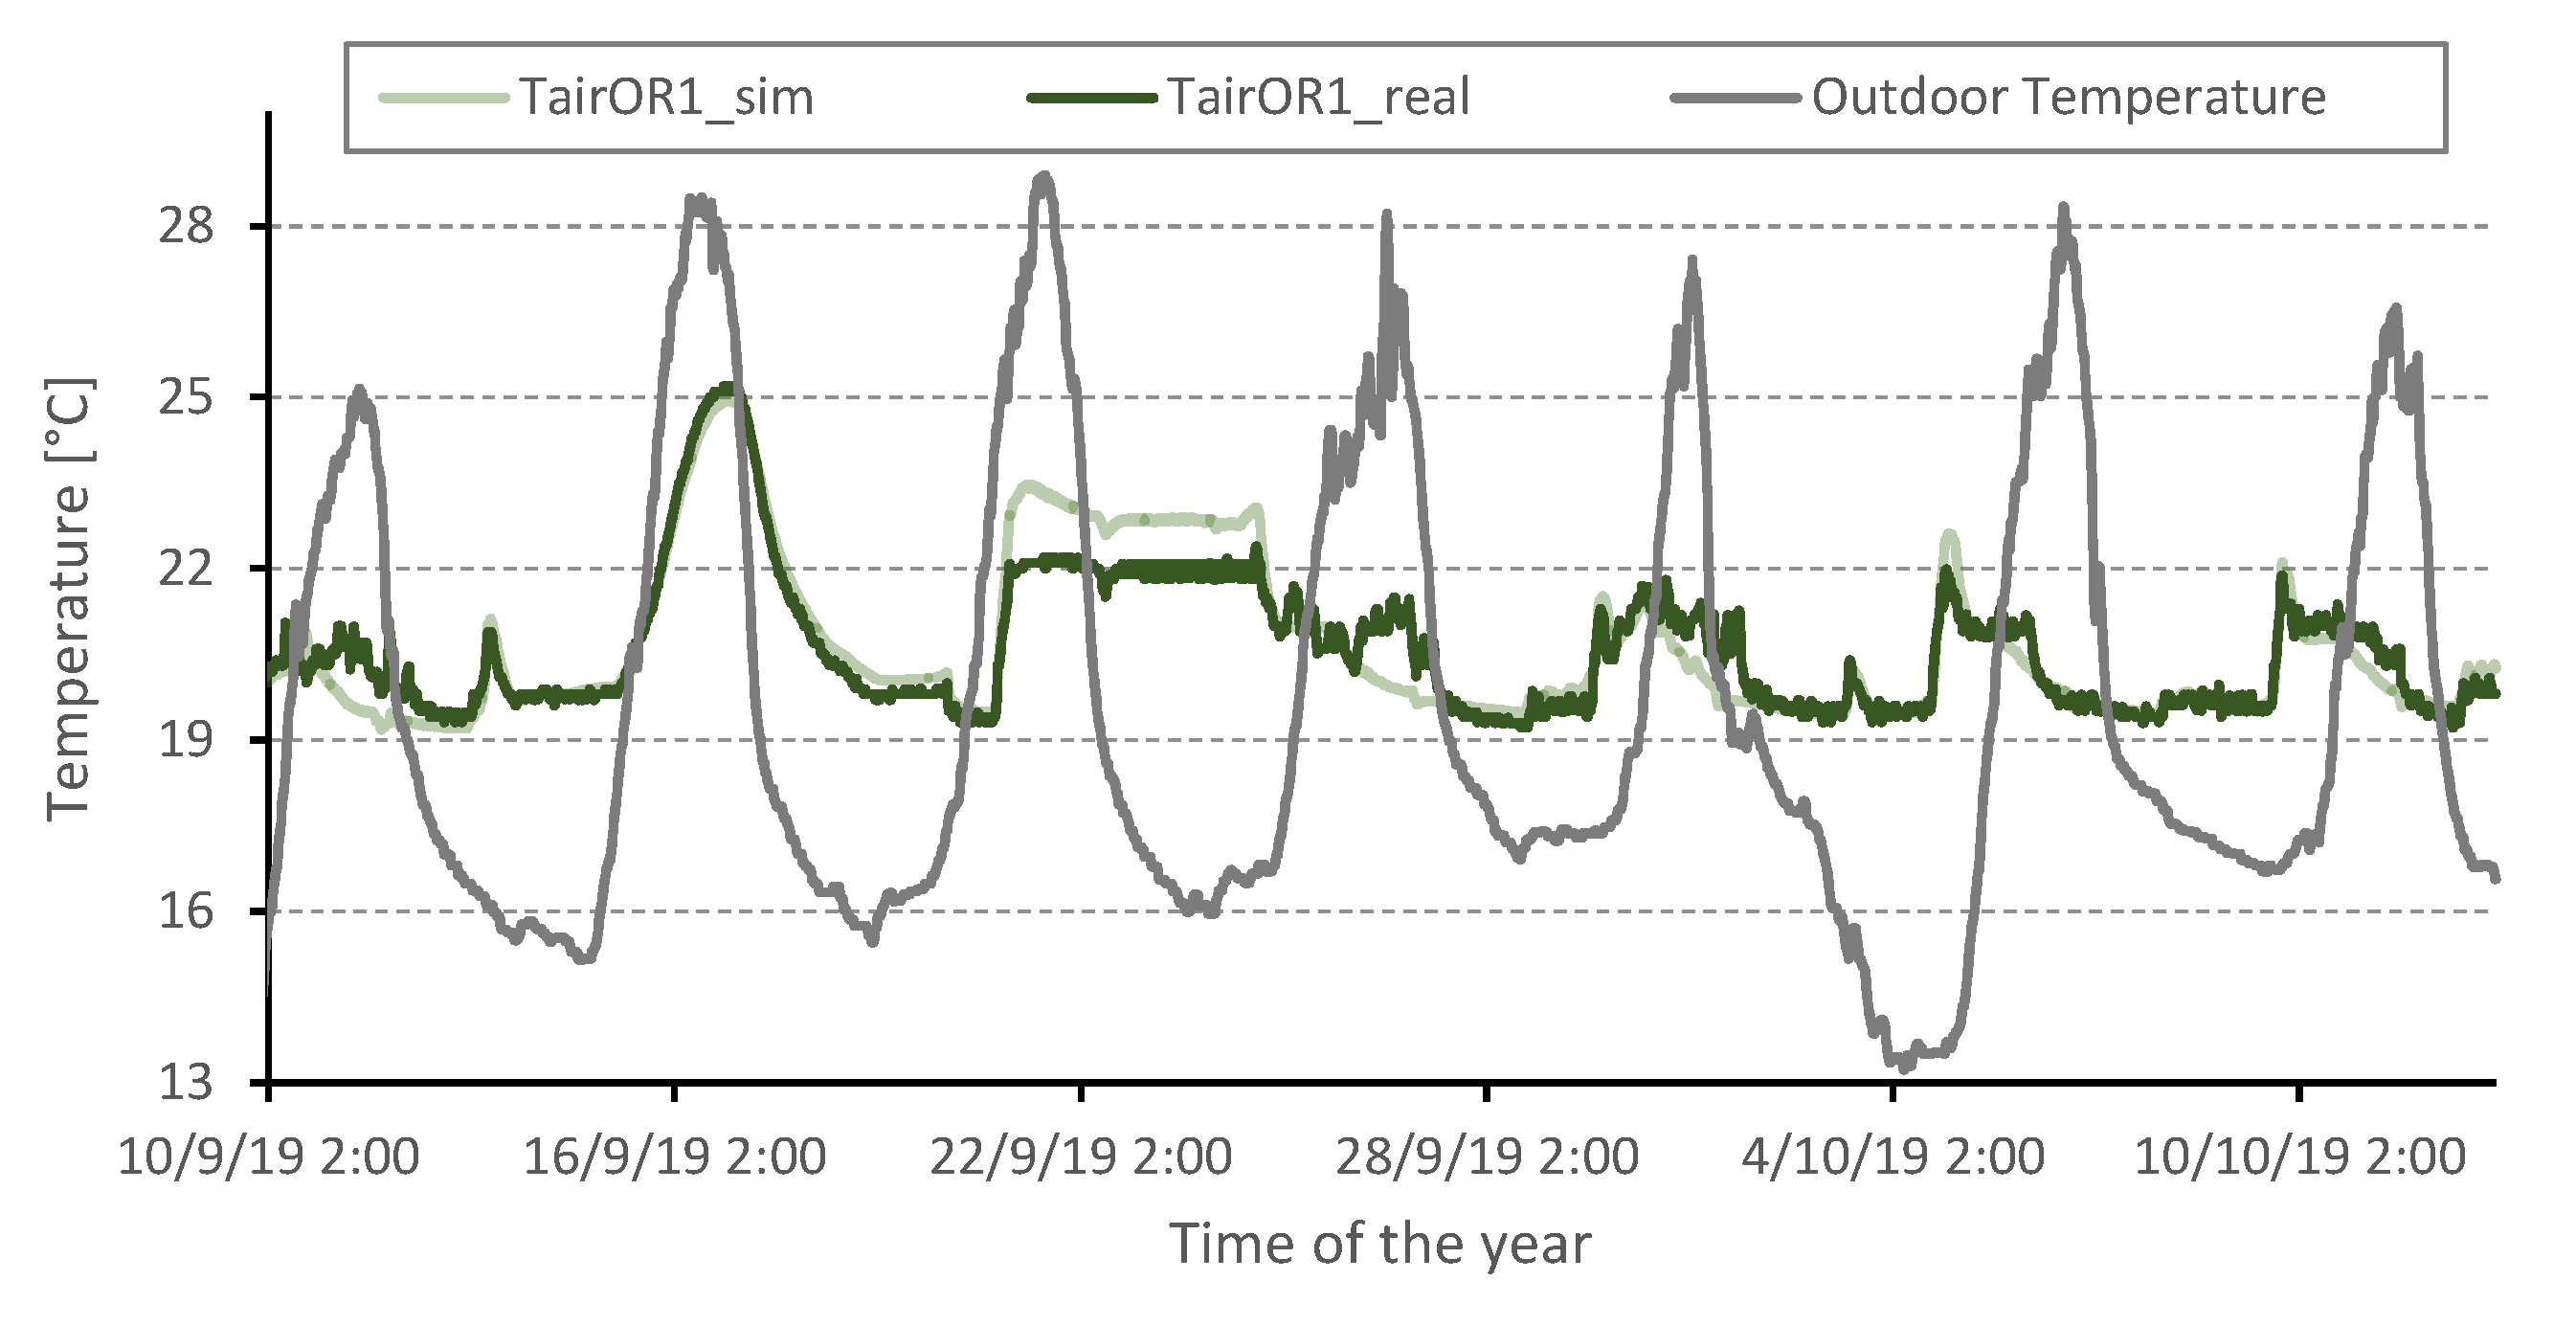
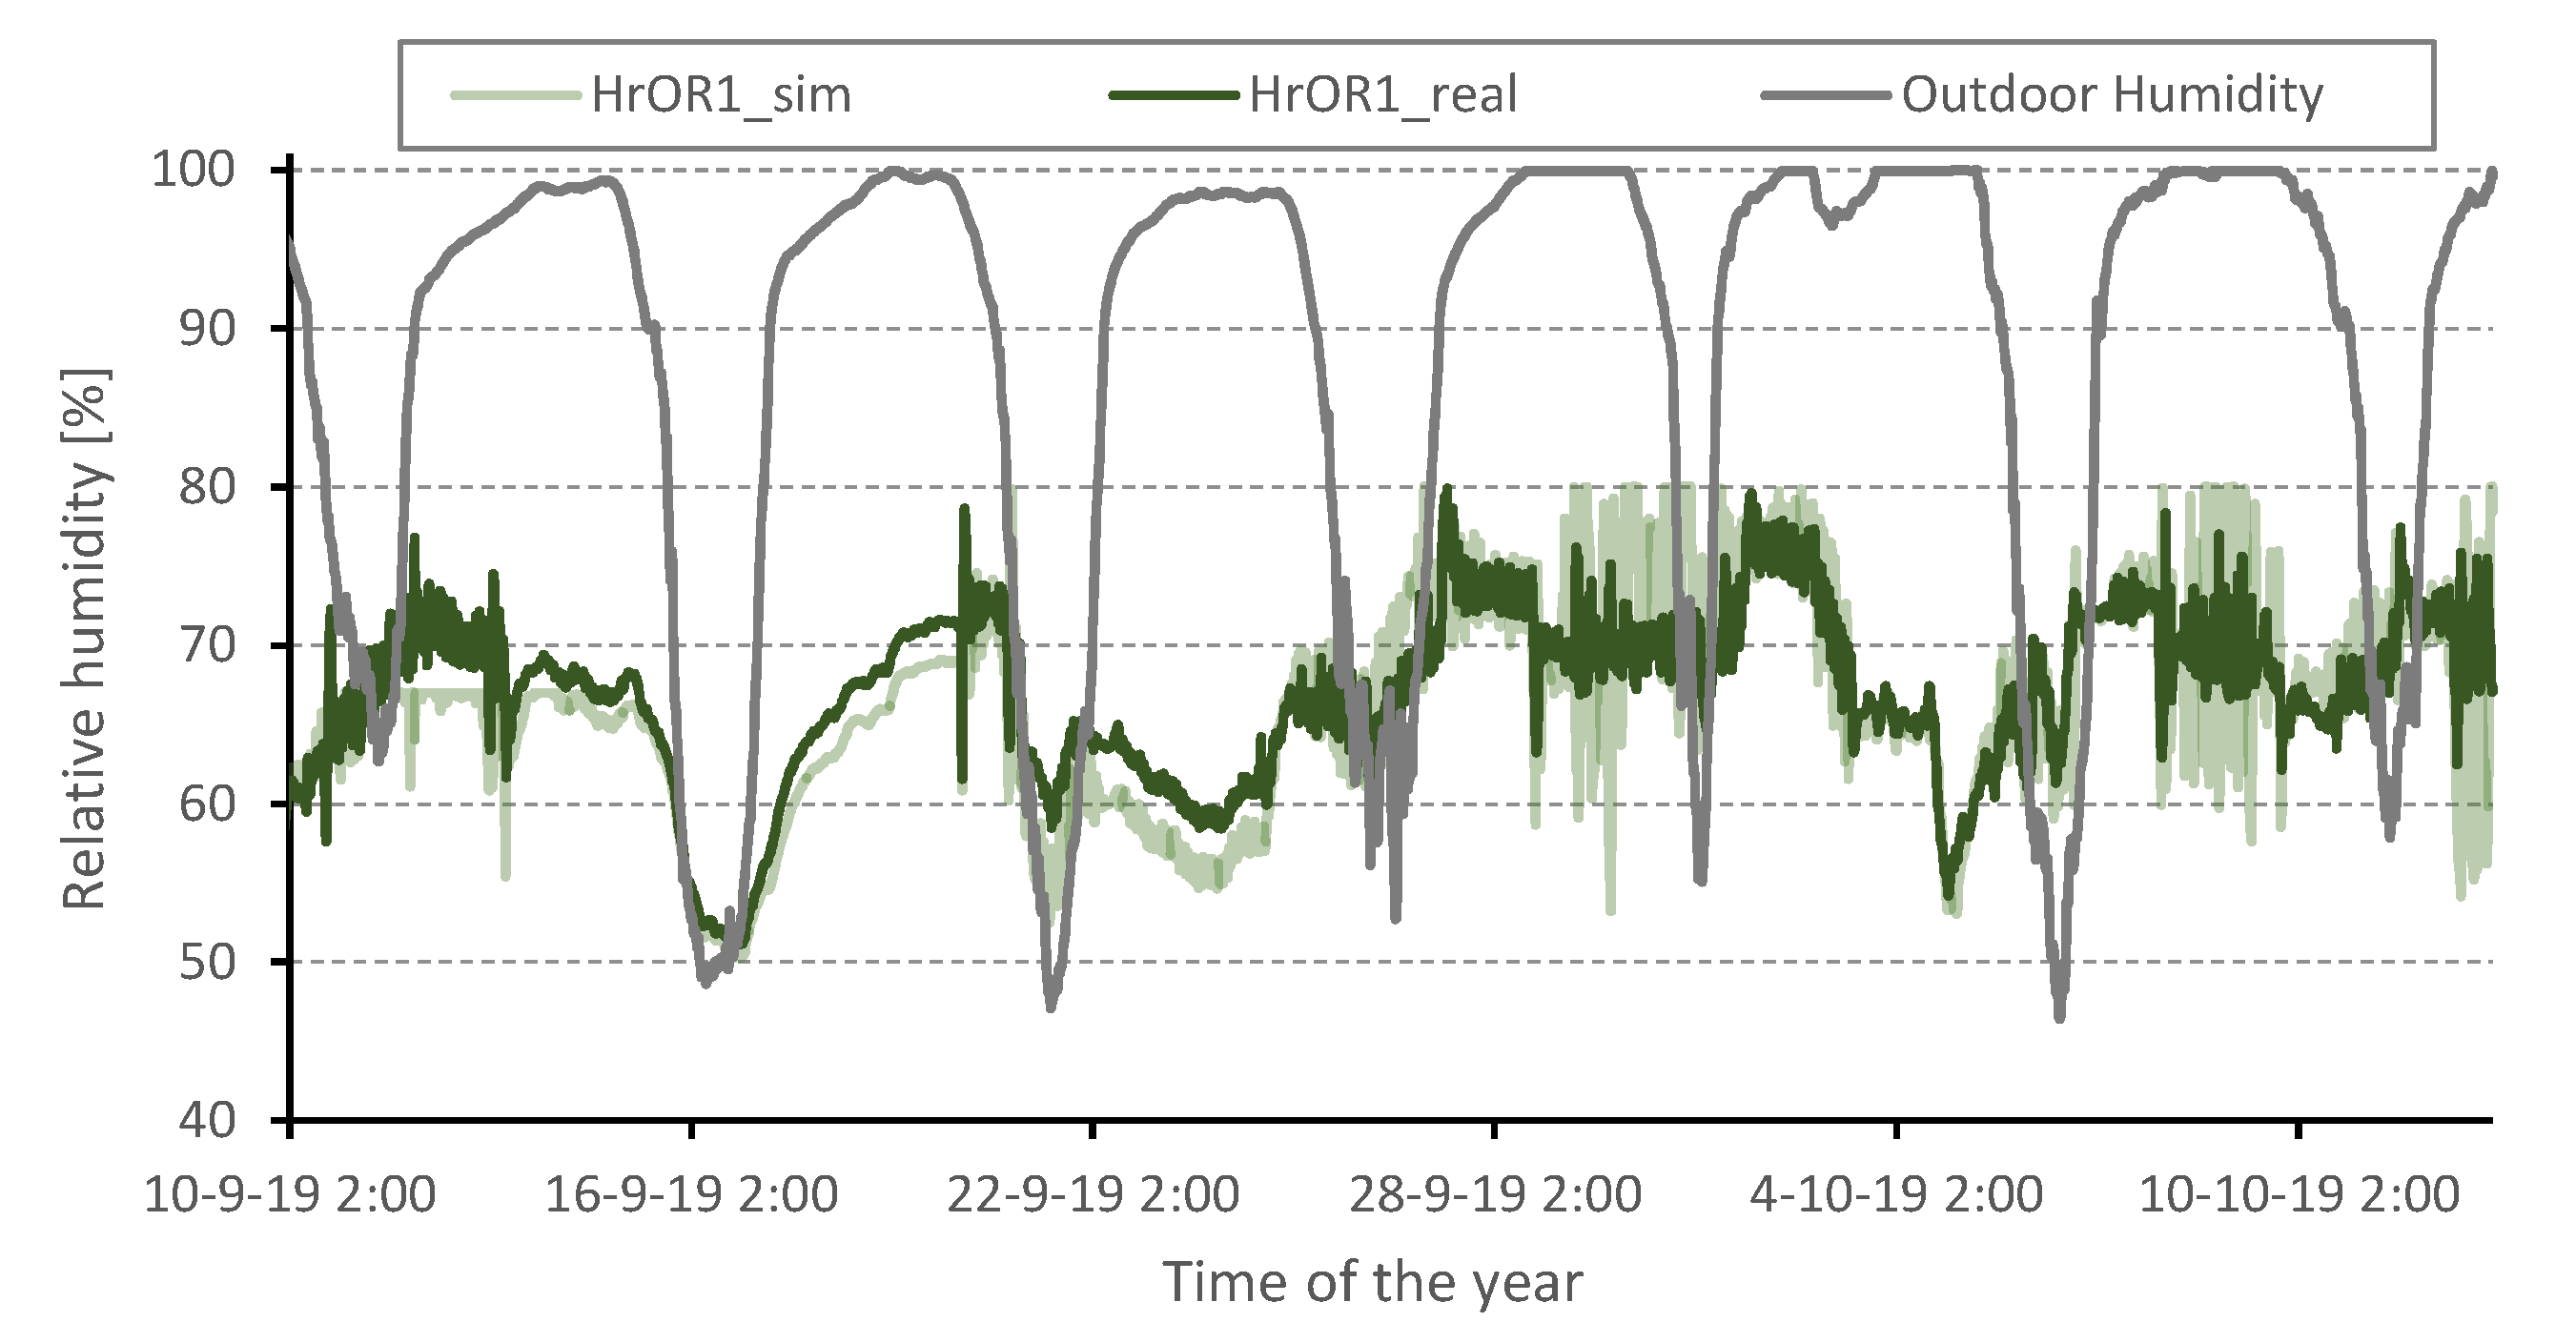
3.1.2. Second Data Collection Period

The second data collection campaign was implemented during a whole week, as explained in Section 2.1.2.; however, Figure 7, Figure 8 and Figure 9 show the hygrothermal variables measured during a 24-h period starting at 7:00 h on Saturday 14th September 2019, when the air renovations consisted of 100% unconditioned fresh air. Normal surgical activity was studied in detail in [21] and has not suffered relevant changes since then. These new collected data were recorded to validate the new simulation and calibrated model, both during occupied and unoccupied periods.
The boundary conditions are different for each OR. These enclosure characteristics have important influences in the evolution of the indoor temperature and RH inside the room when using a floating thermal model equipped with a ventilation system. In these models, the indoor conditions are not controlled with a HVAC system. For this reason, although the ventilation airflows and the ACH are similar in the three ORs, the temperatures of each OR are different, especially during the night period. During such periods, the temperature of the intake air in OR1 is similar to the room temperature. However, in OR2 and OR3, the temperature of the intake air is slightly lower than the room temperatures because of the thermal gains from the boundary thermal zones. This behavior is also observed in the moisture model because when the intake air goes into the zone, this air is tempered and the RH is reduced.

3.2. Simulation Results of the Calibrated Model

This section presents and discusses the simulation results obtained of the calibrated model. This includes an analysis of the moisture condensation risks during the off-use ventilation mode. In addition, the starting time needed for the HVAC to provide appropriate indoor conditions at the beginning of the working periods is evaluated. Finally, the different ventilation scenarios were simulated and the potential energy savings were assessed.

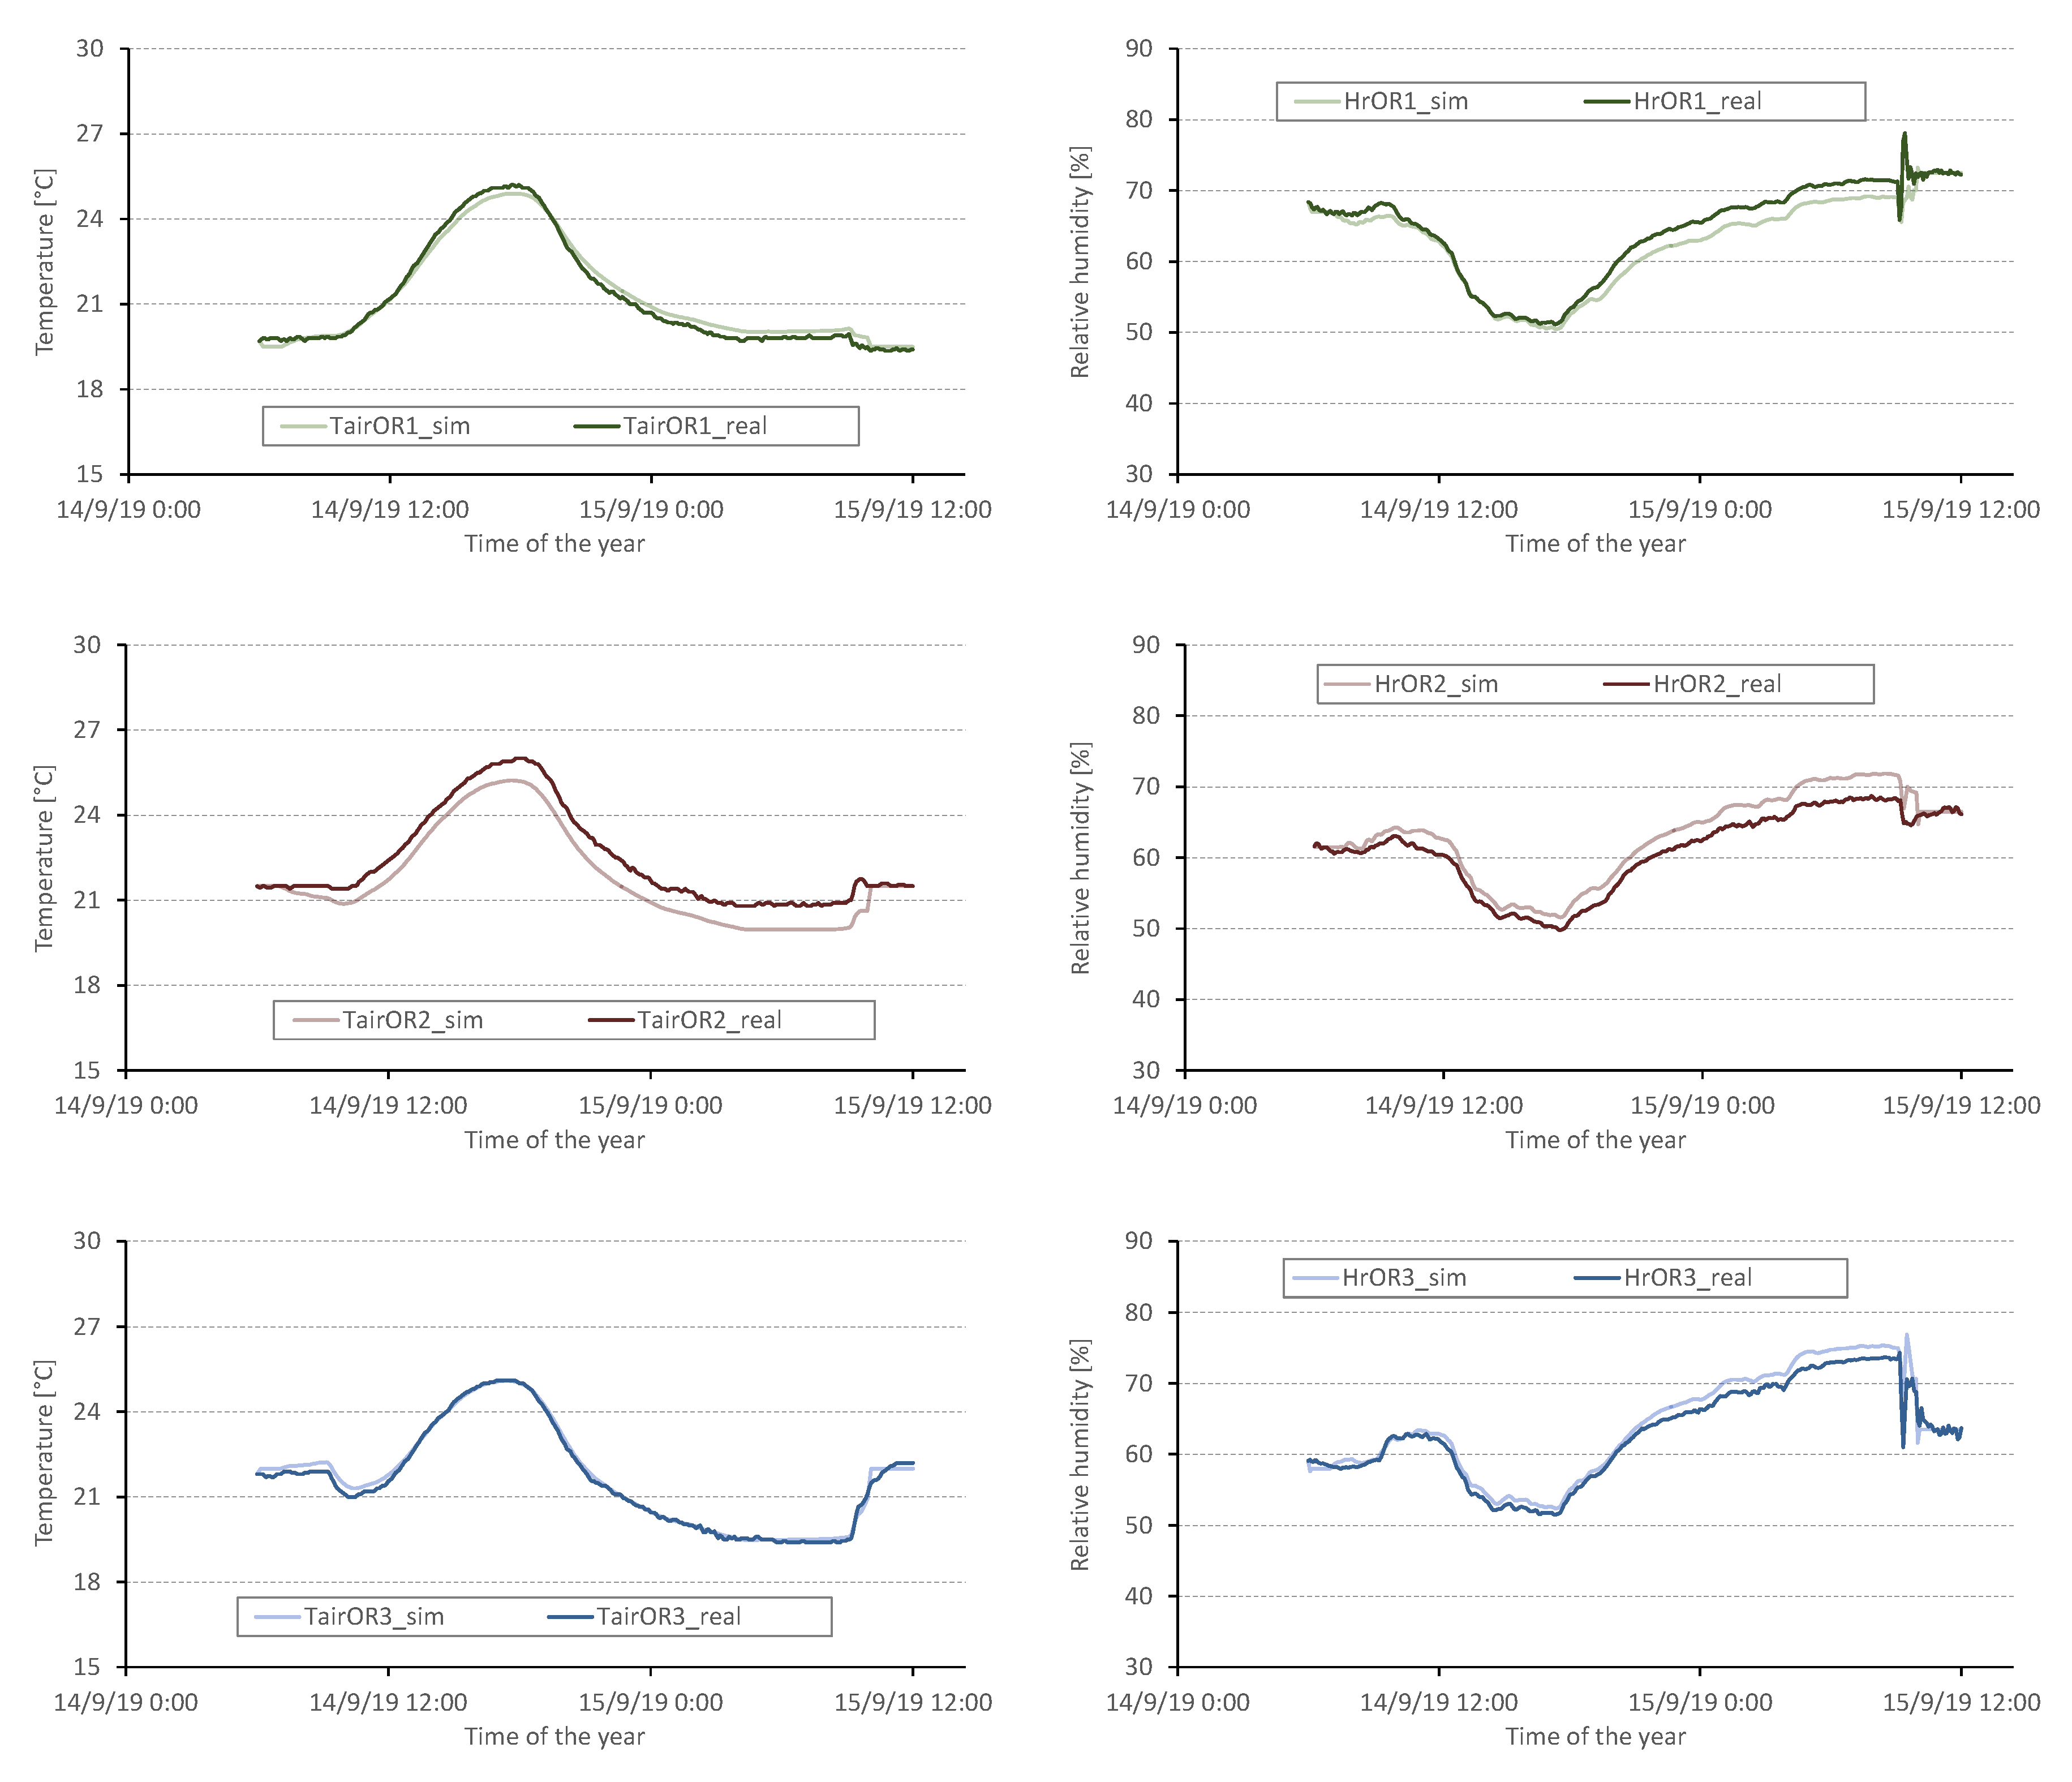
3.2.1. Validation of the Calibrated Model

In this subsection, the hygrothermal simulation results are compared against the data from both experimental campaigns. The experimental results from the first campaign were used to calibrate the model, while those from the second campaign were used to validate the model and to investigate the transition between the normal-use operation model and off-use operation mode. Figure 10 compares the experimental data and the simulation results obtained with the calibrated model for the period of the second campaign where the ventilation was performed with fresh unconditioned air. Moreover, Table 5 illustrates the CV(RMSE) values for temperatures and RH for both experimental data sets. The results show a good correlation in both parameters for the different thermal zones in the suite, with errors below 4% in all cases. This agreement is especially precise in the temperature of OR1 and OR3.
On the other hand, Figure 11 and Figure 12 display the experimental values for the indoor air temperature and the RH in OR1 compared to the simulation hygrothermal variables during an extended period where the off-use mode is combined with the normal-use mode, showing quite good agreement in both cases. The represented data are from 10:00 h on Friday 13th September (6130 h of the year) to 2:00 h on Friday 20th September (6290 h of the year). It is observed that the thermal model behaves appropriately by also adjusting the temperature and the RH in periods with surgical activity despite the model being calibrated only with data from off-use periods. Similar results were obtained for the other ORs of the surgical suite, although they are not represented herein to avoid repetition.

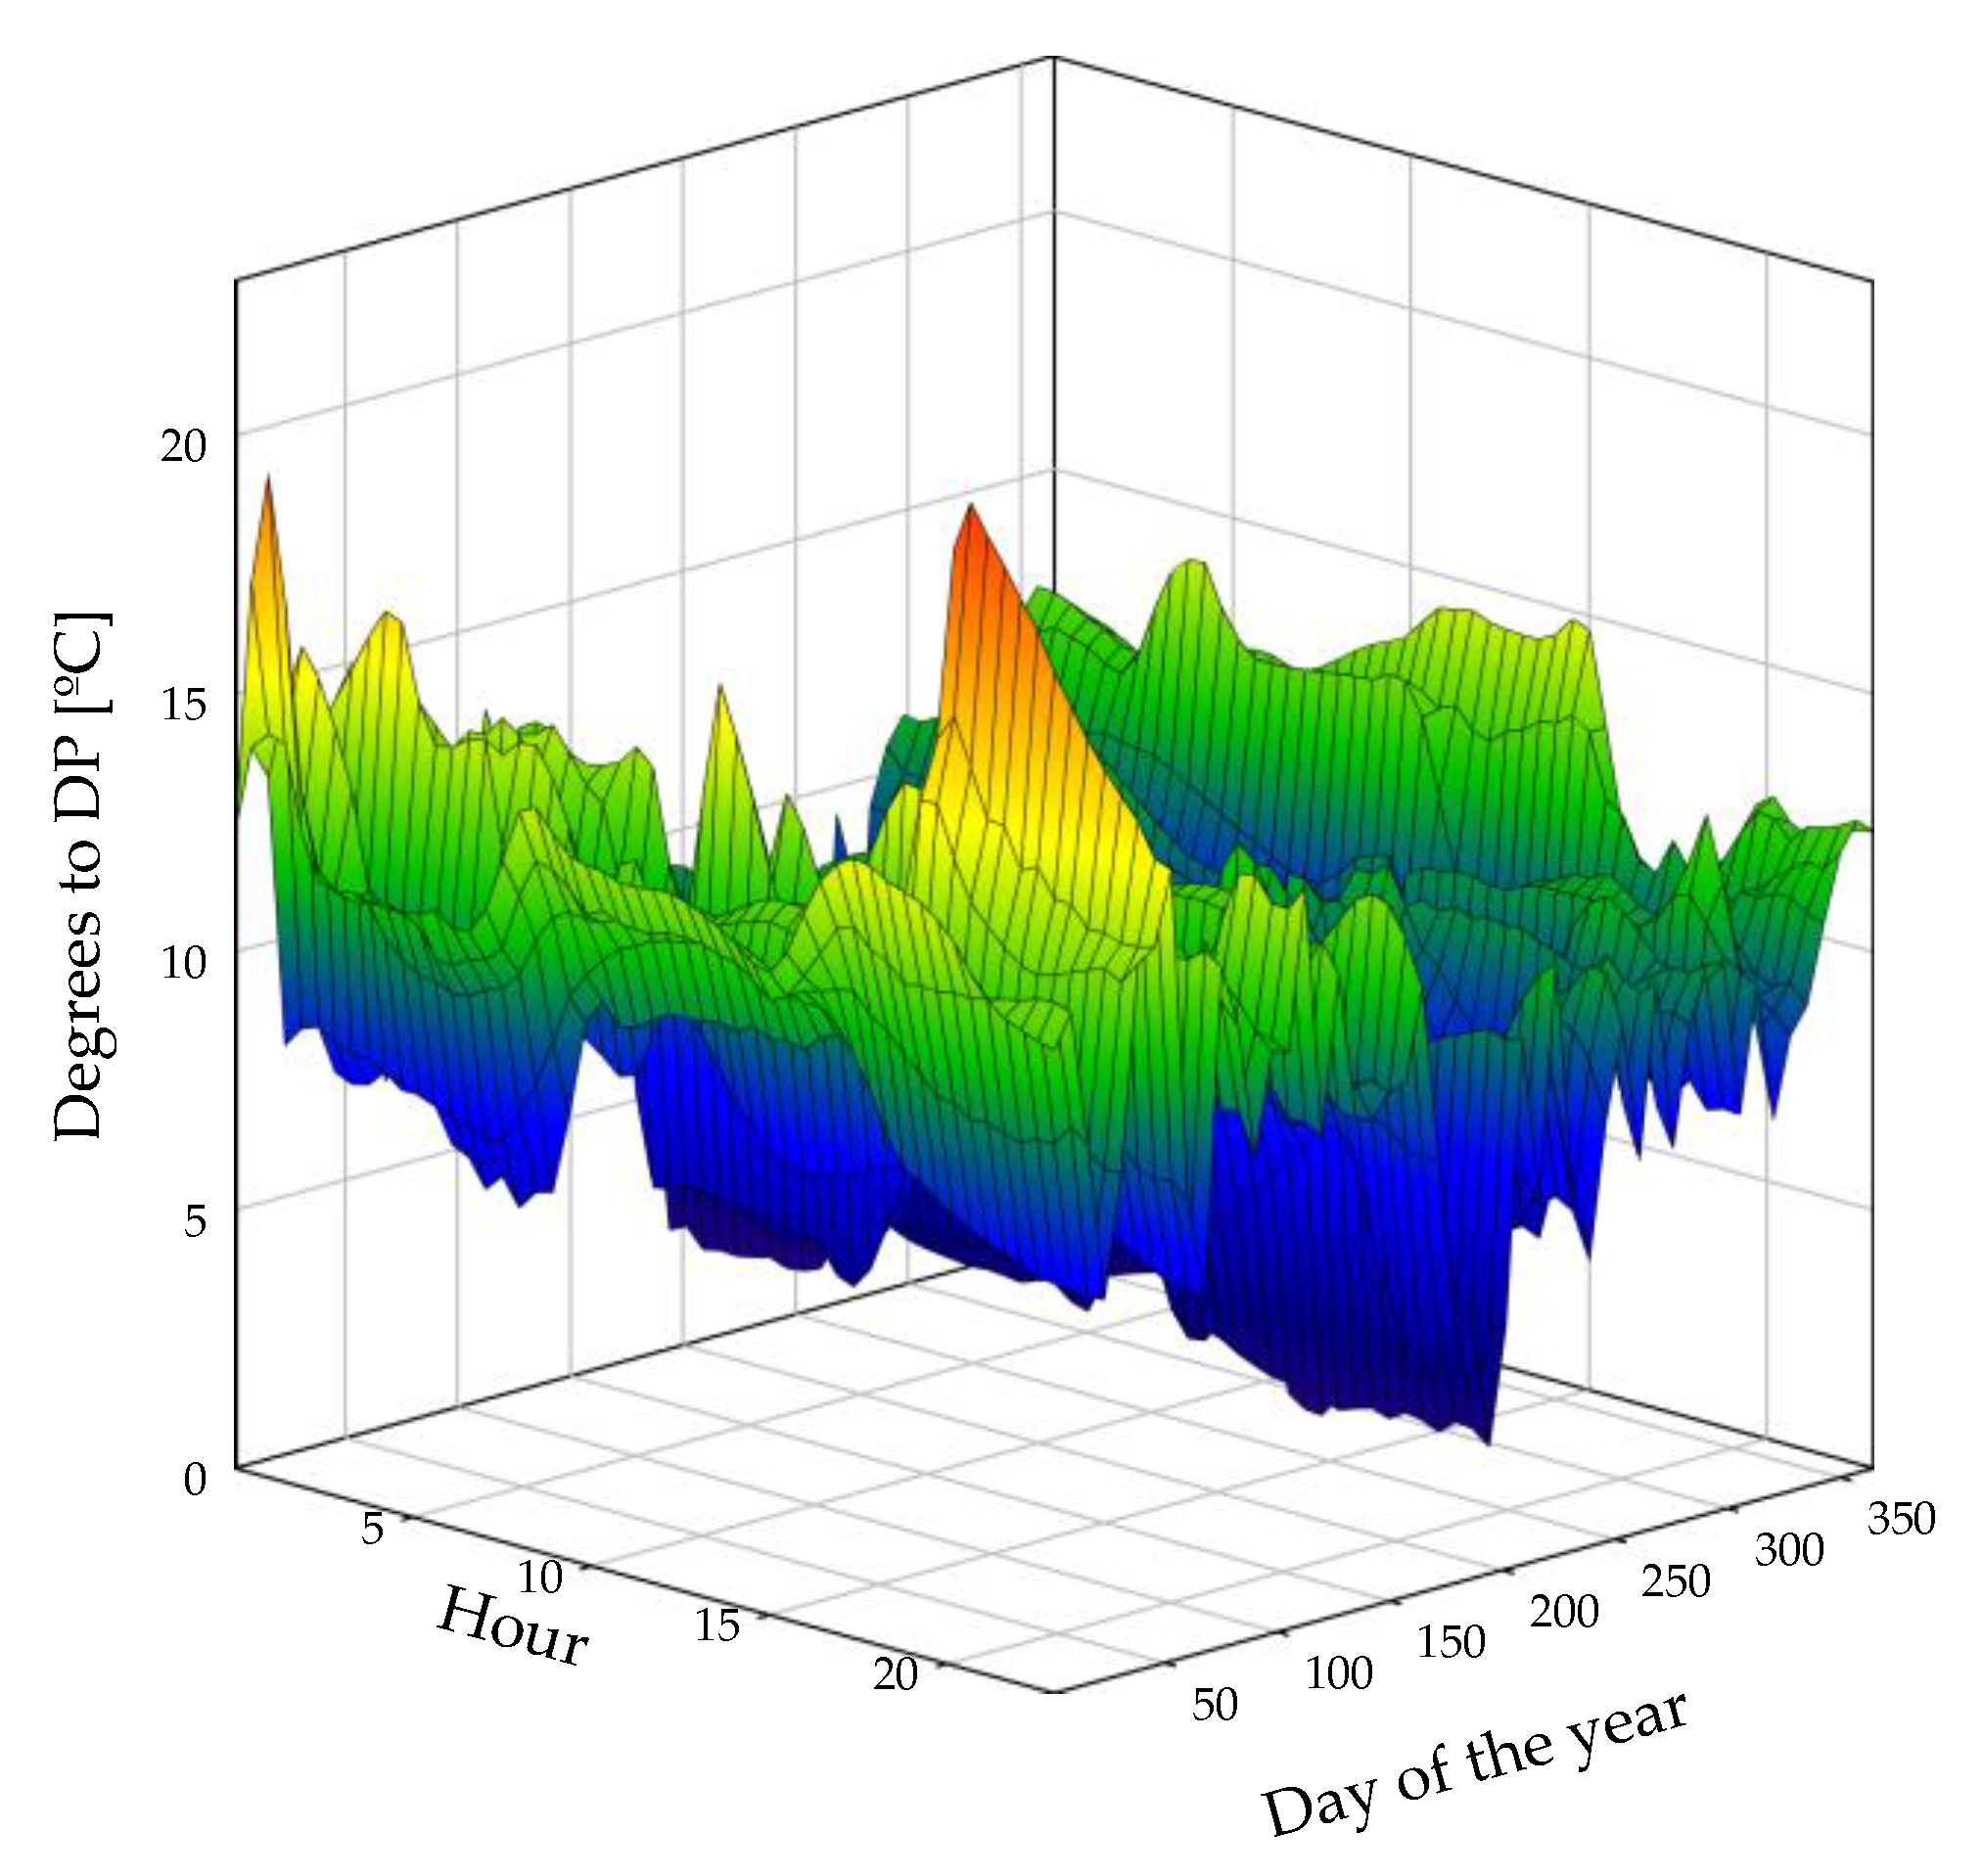
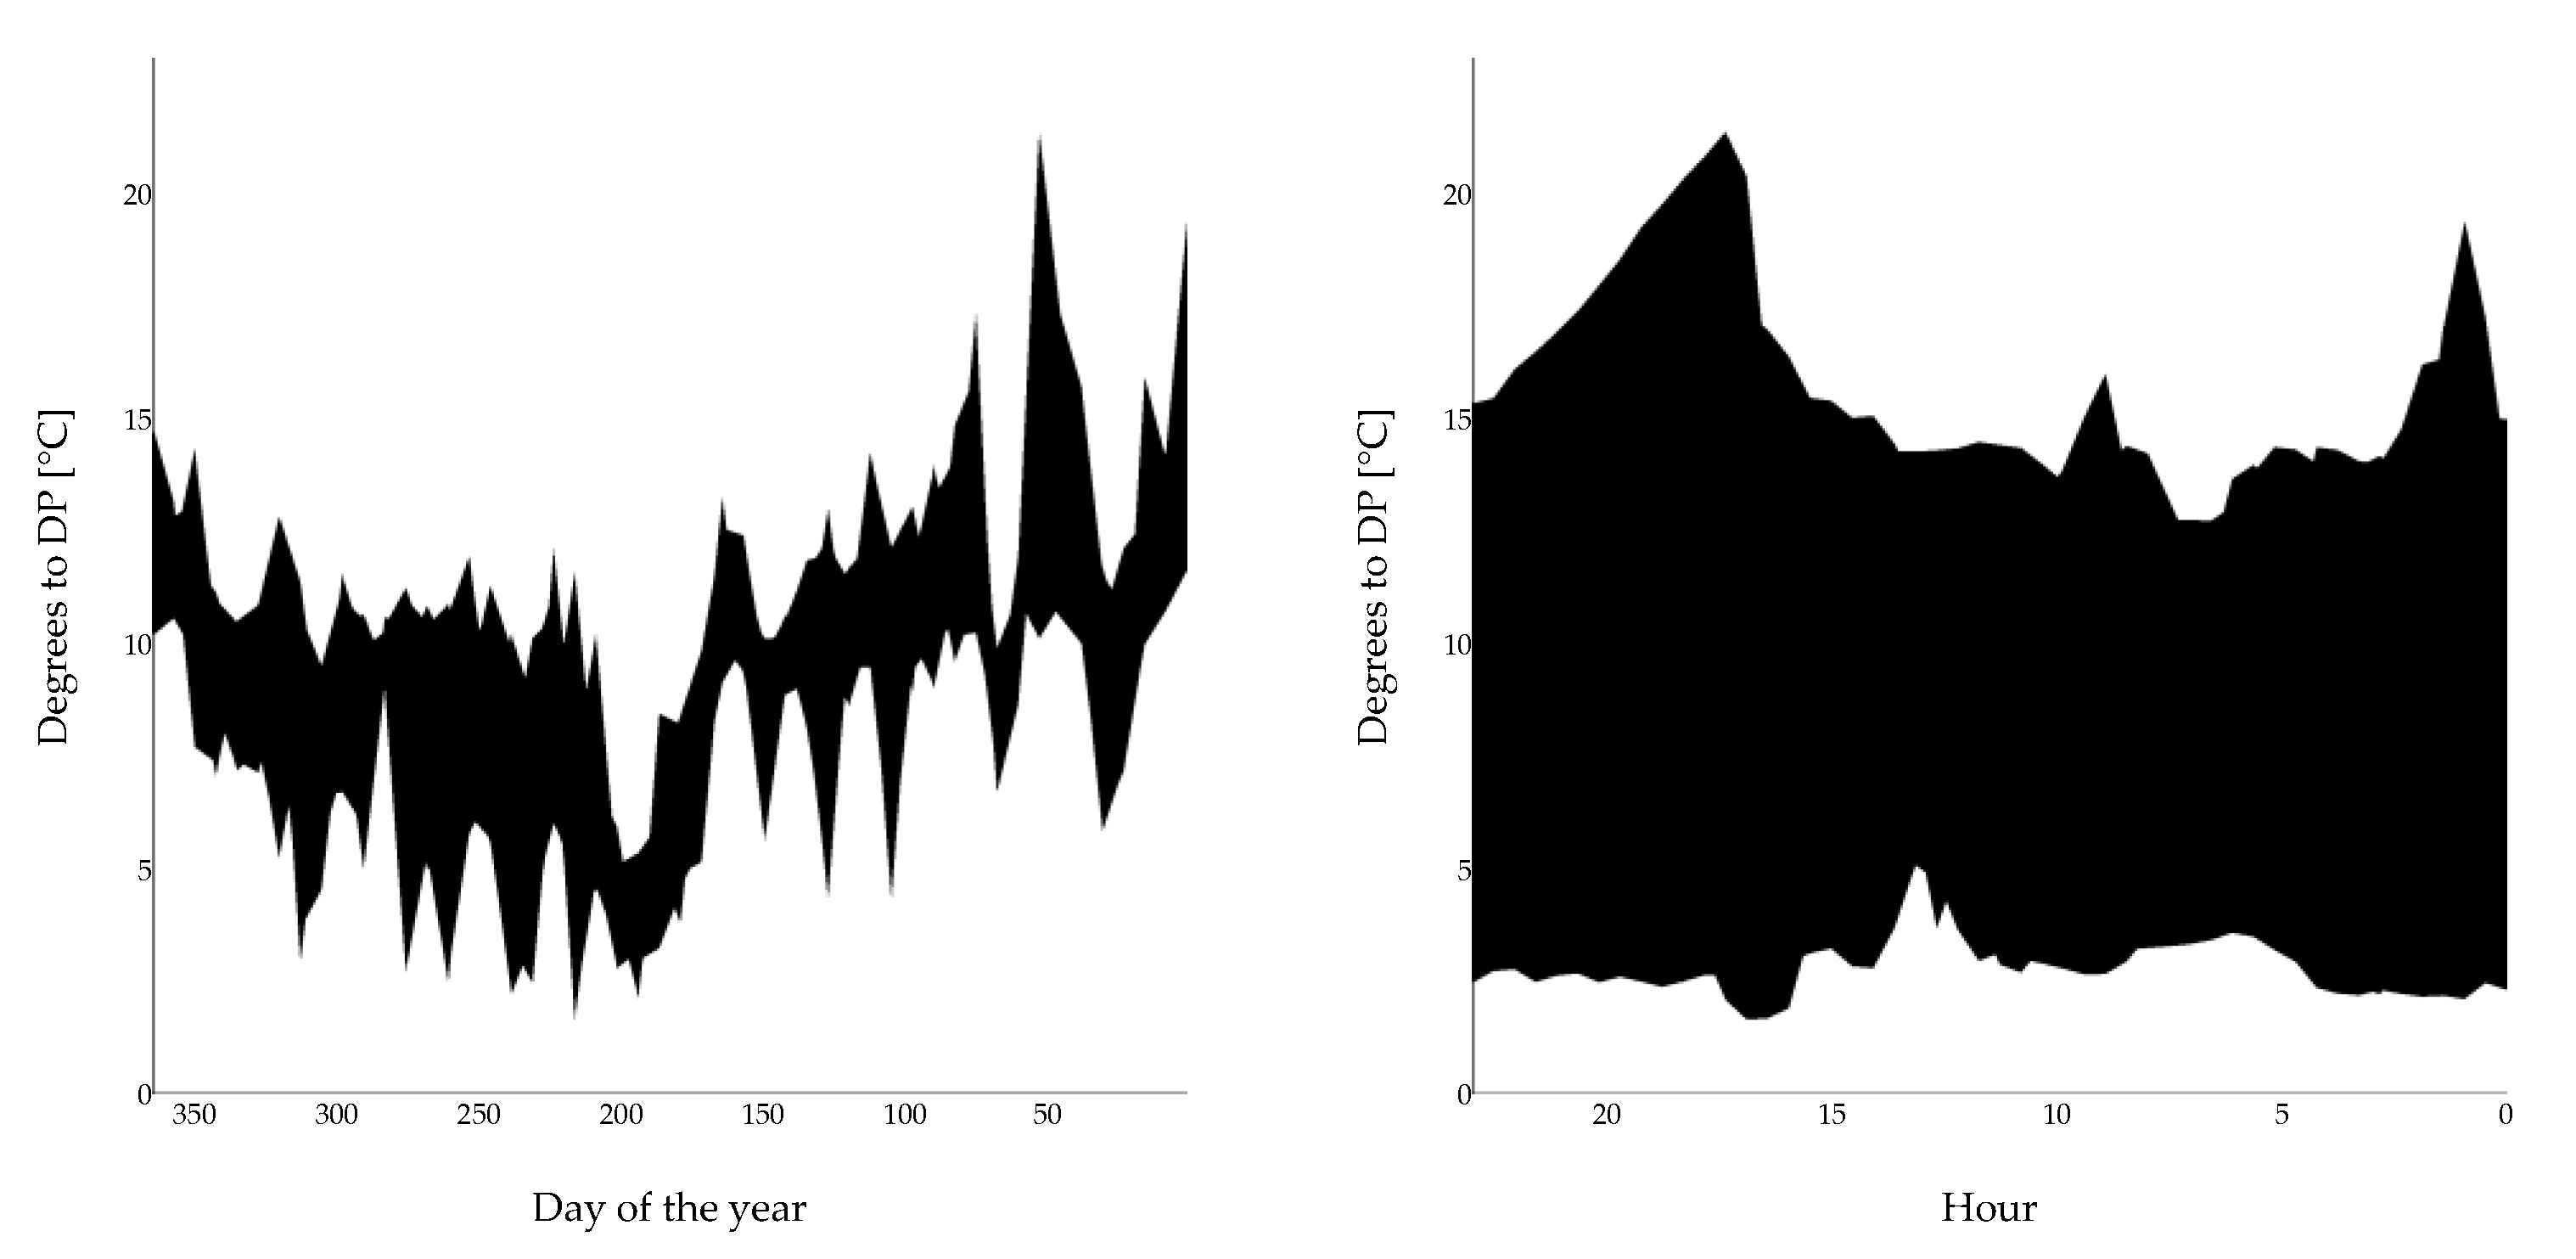
3.2.2. Analysis of the Moisture Condensation Risk

It is important to control possible condensation problems in the surgical suite, especially during off-use periods when the intake air is allowed to vary between 15 and 30 °C. When the fresh air does not go through the heat pump condenser, evaporator or dehumidifier, condensation risks are higher. This is because there is not a humidity control and the ventilation system directly uses outdoor air. Such condensation can appear during different periods of the year and over surfaces with the lowest temperatures. Based on a psychrometric diagram, normally during the summer the dew point temperature is higher than during the winter. In addition, during the winter season, the minimum temperature from the indoor surfaces is normally higher than the outdoor temperature and the condensation risks are in general lower if thermal bridges are avoided.
The temperature difference between the minimum value of the inner wall surfaces and the air dew point was investigated in OR1. This analysis was accomplished in a complete year simulating ventilation during off-use periods. If this difference was a negative value, a new minimum value for the indoor air temperature had to be set. This value will depend on the outdoor air RH and the outdoor and indoor air temperatures. Figure 13 represents the difference of temperature between the minimum temperature of the inner wall surfaces from OR1 and the dew point temperature of the air inside OR1. This analysis reveals that no condensations issues will occur during a typical year considering the hygrothermal conditions imposed. In addition, the most critical period is summer time when the minimum difference of temperature of 1.25 °C was found in the hour 6529 of the year (1:00 h on Monday 30th September 2019). Figure 14 projects the data in different planes and it can be better appreciated that the most dangerous timeframe is summer time and during the night. Similar results were obtained for the other rooms of the suite, demonstrating that no condensation takes place in the surgical suite under the studied conditions.

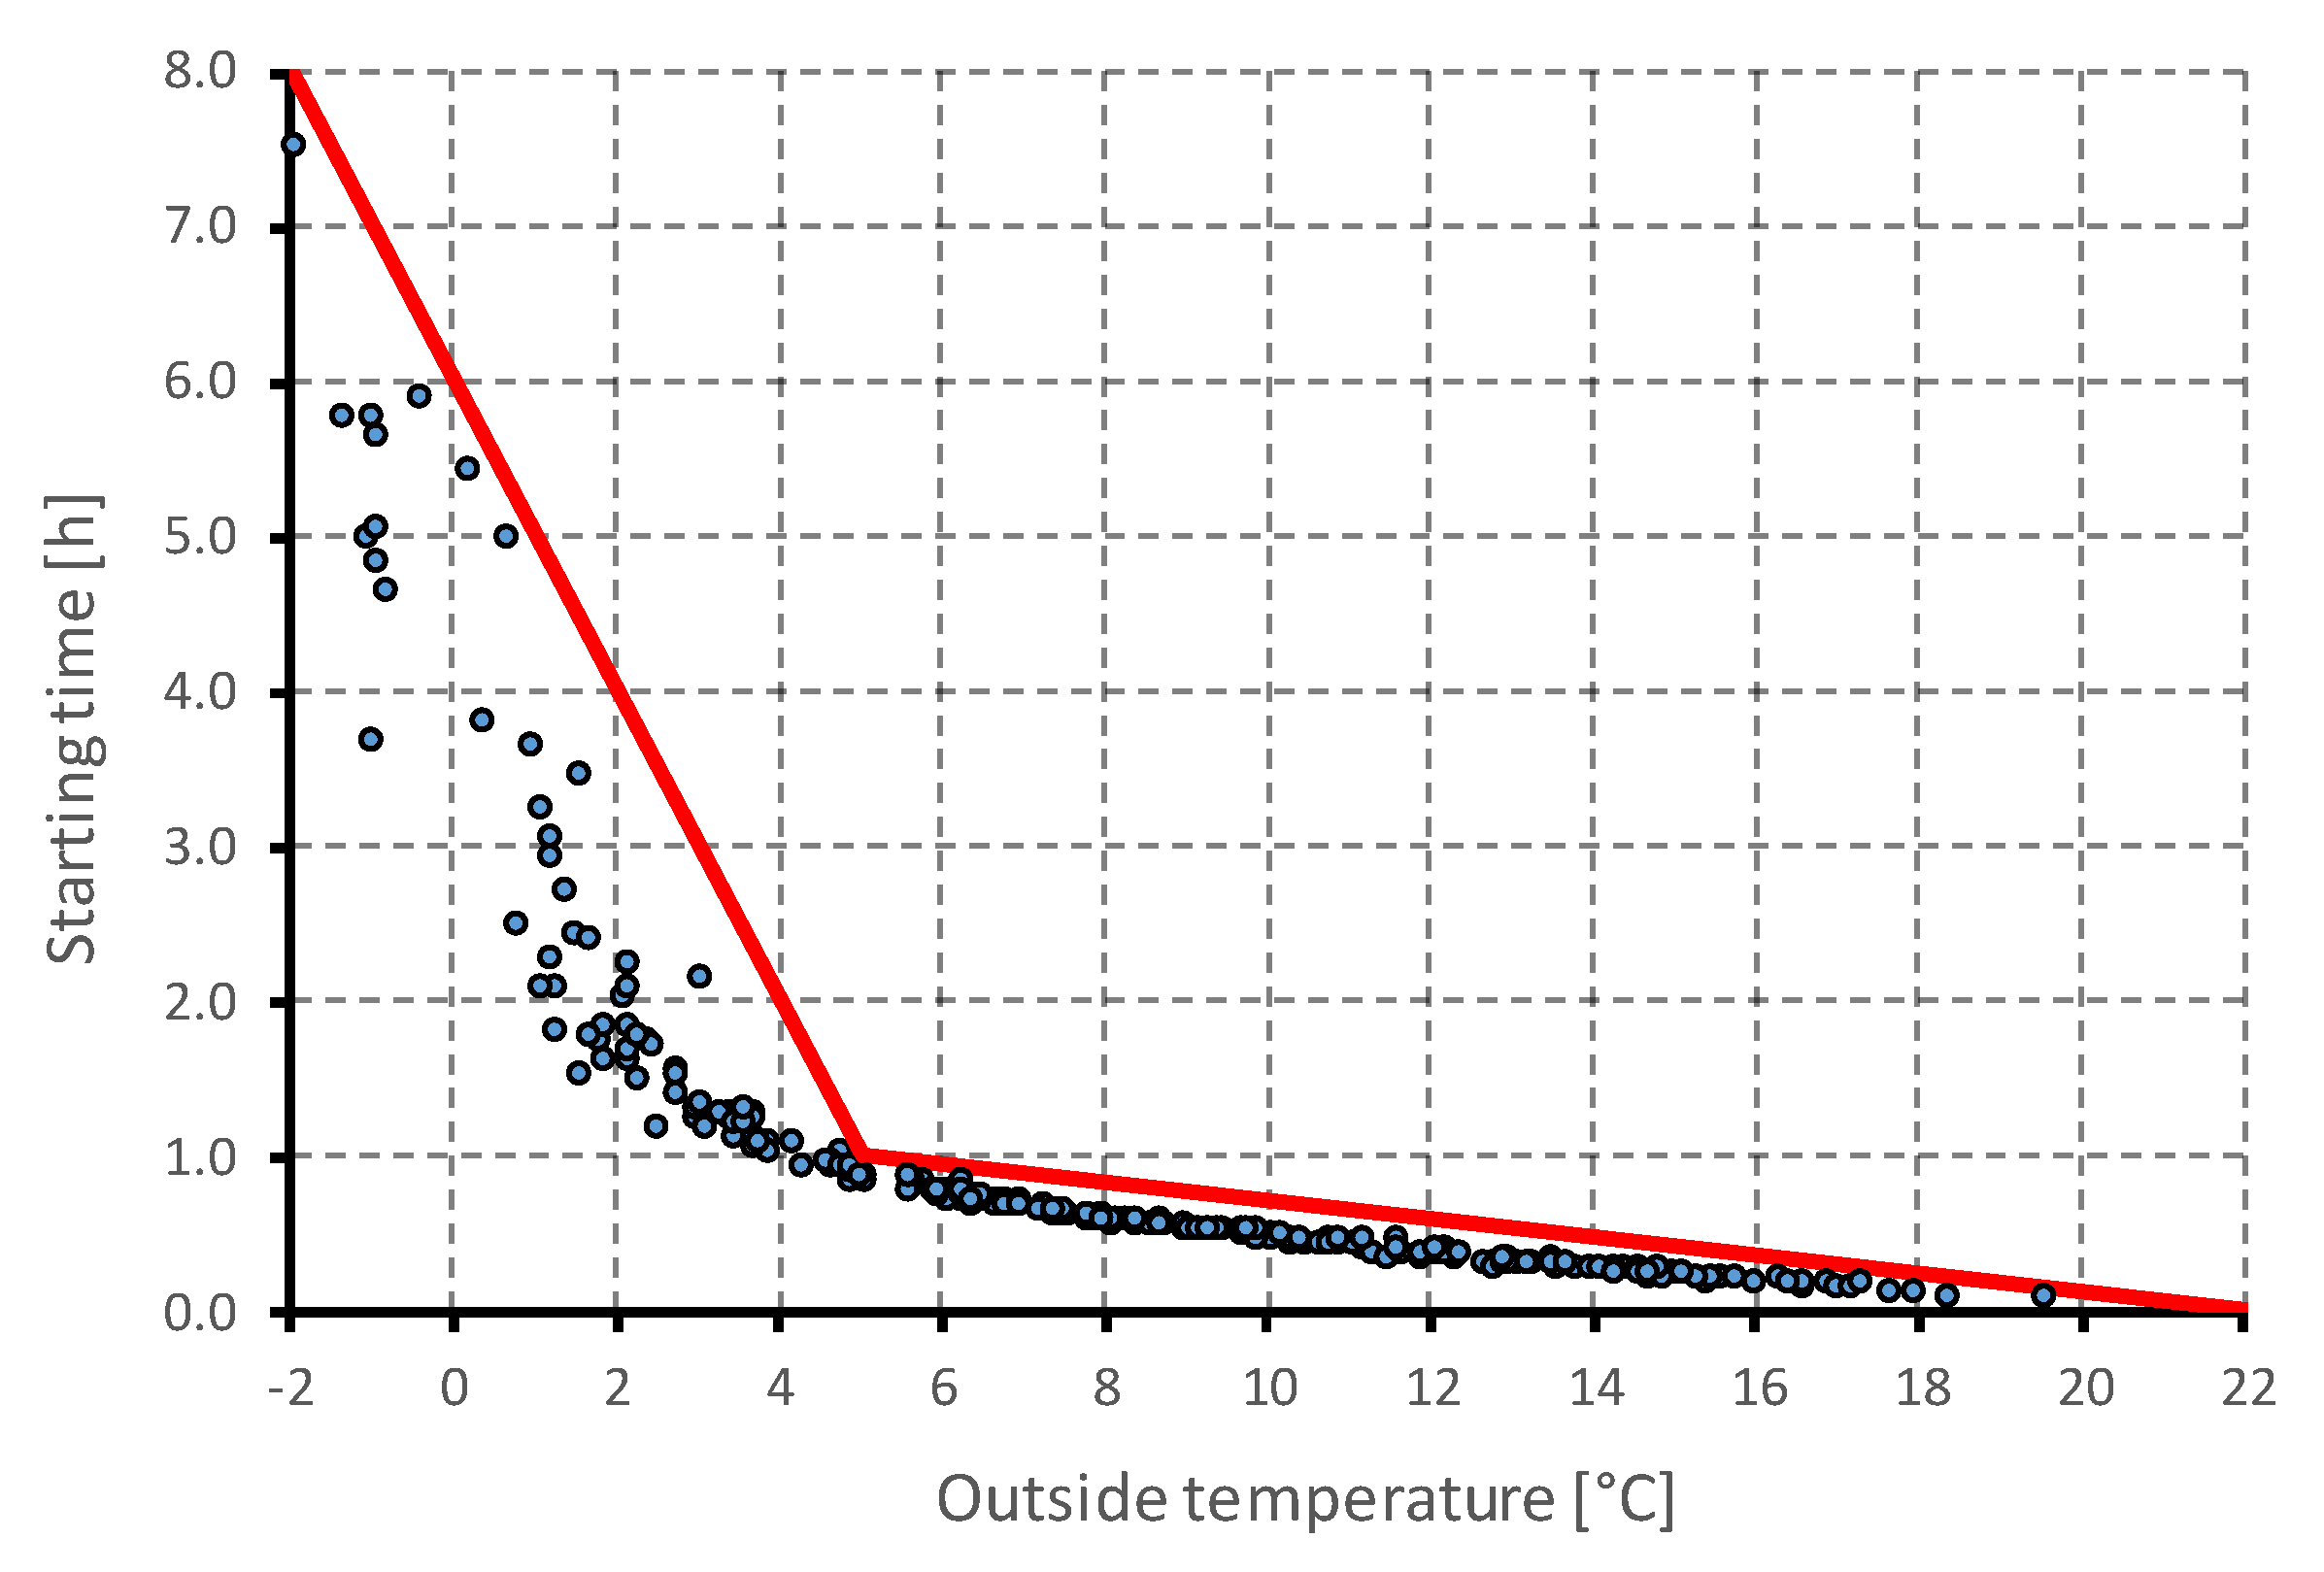
3.2.3. Study of the Air-Conditioned Starting Time

The authors studied the required time to reach the suitable hygrothermal conditions in the working periods. This starting time to achieve a setpoint temperature is a function of the room temperature and was investigated in the simulation model. The prediction of this period allows reducing the energy requirements of the ORs since the total runtime is reduced. Due to the high ACH, this time is normally lower than one hour for the investigated temperatures when the outside temperature is higher than 5 °C. The simulation results are represented in Figure 15. This behavior was reduced to two boundary equations. The obtained equations were incorporated in the model to predict the switch-on time only during the periods when heating is needed. Periods during which cooling is required are minimal since the room temperatures at the start time of a workday do not reach the set point temperature value.

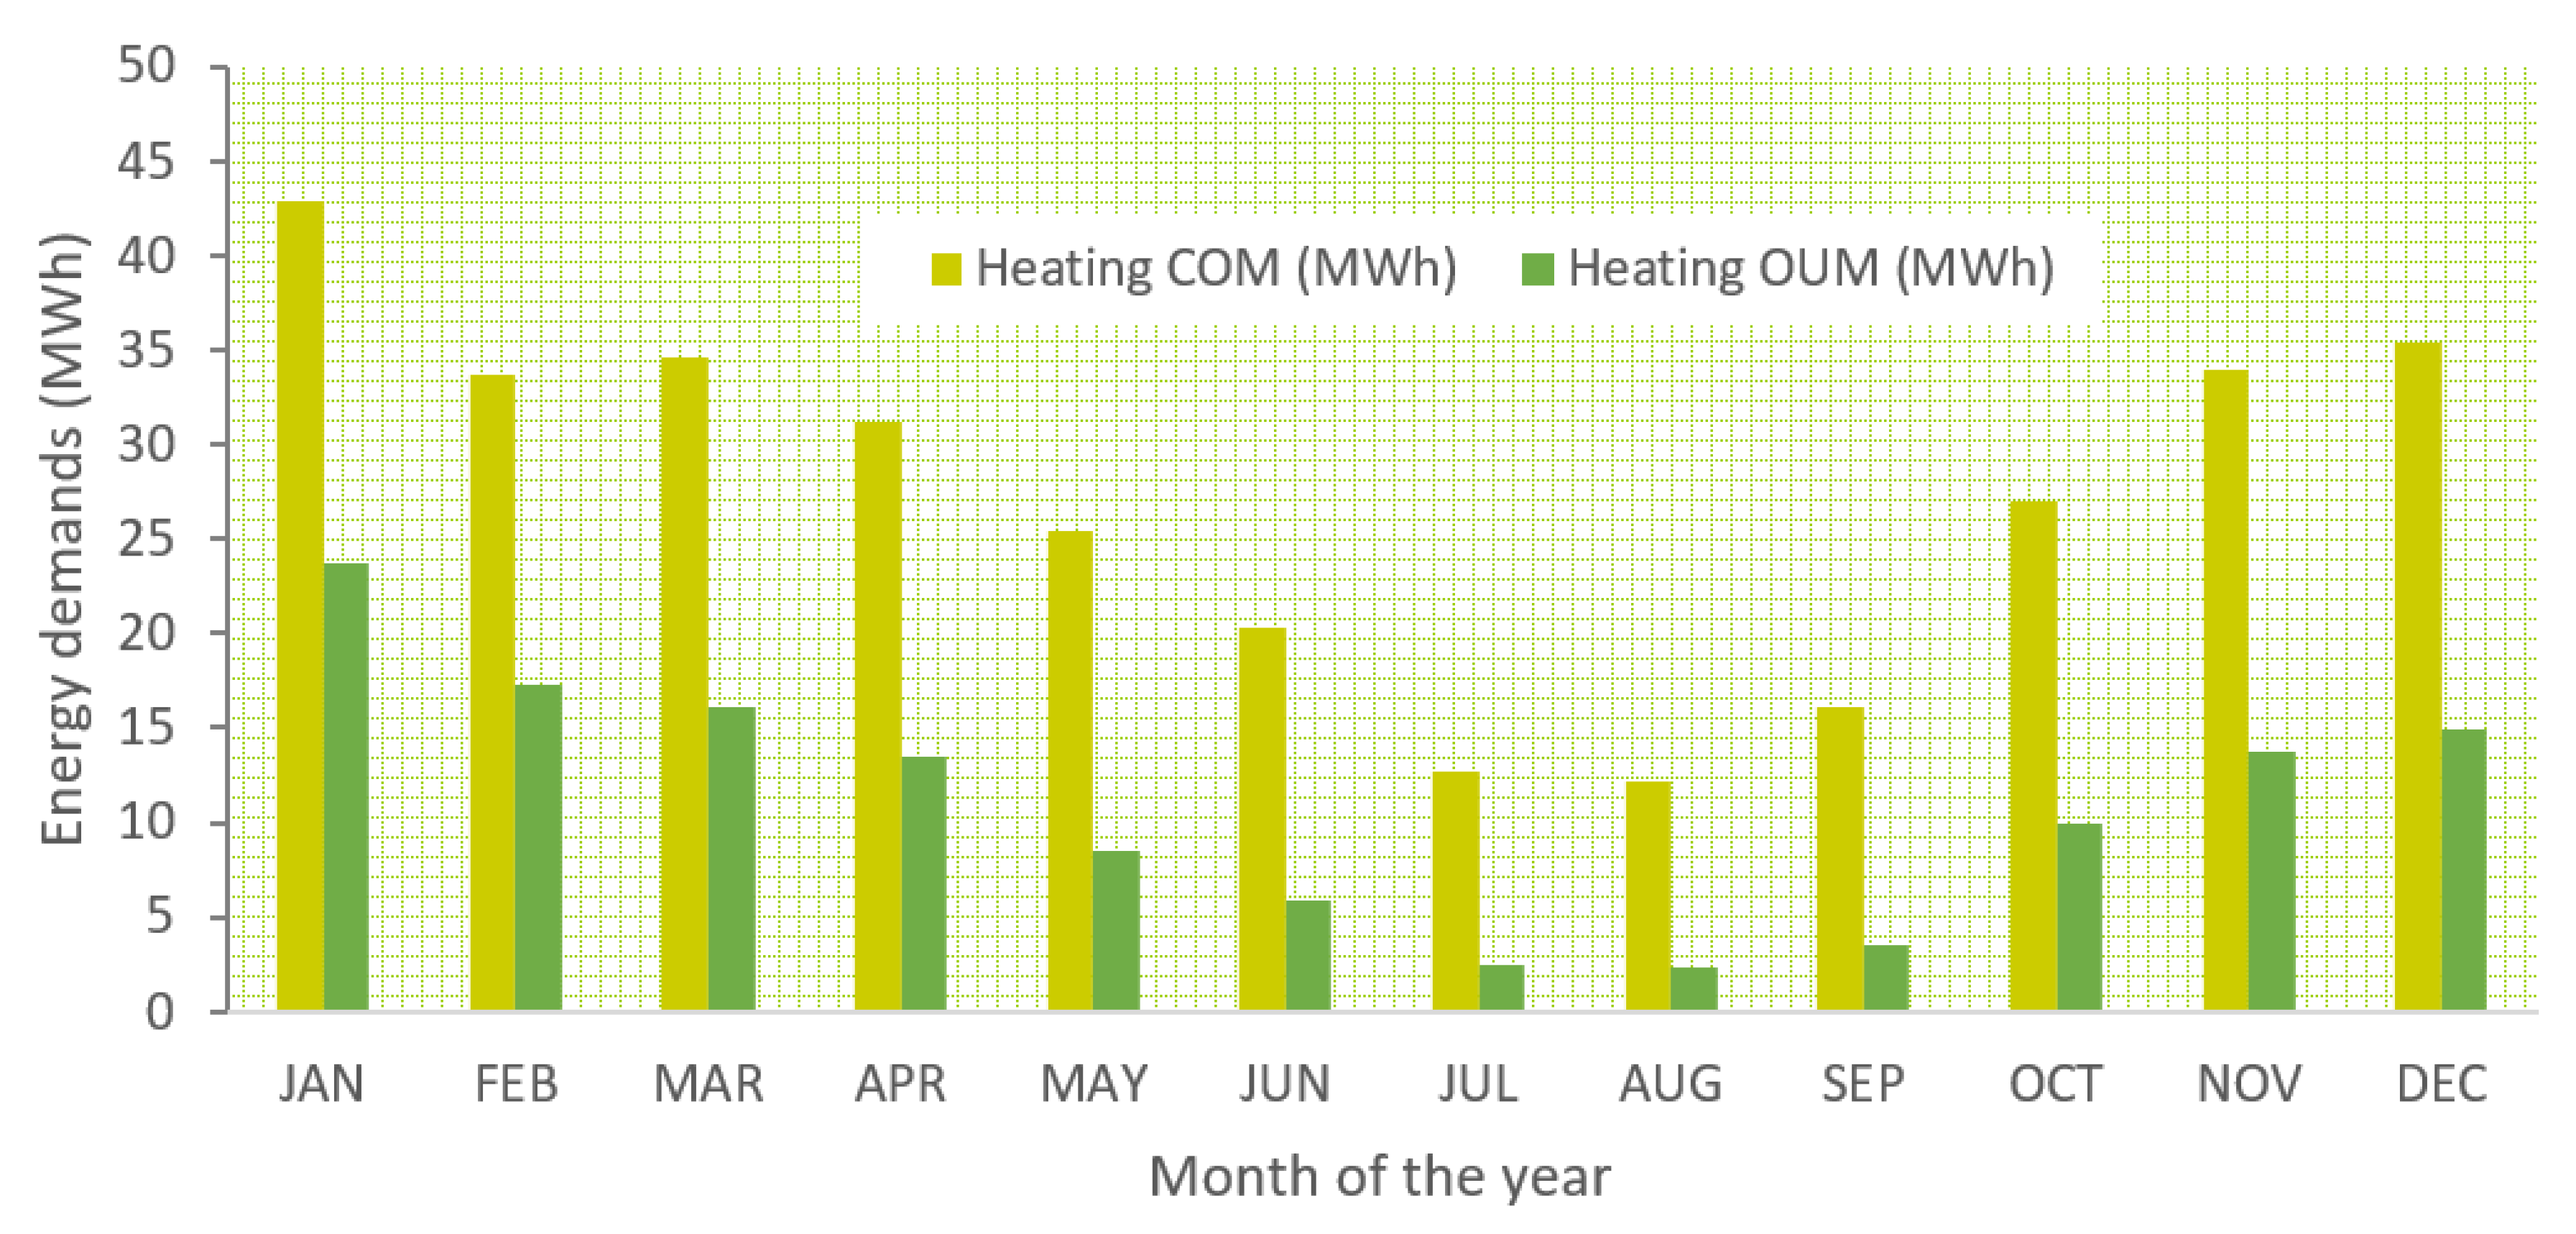
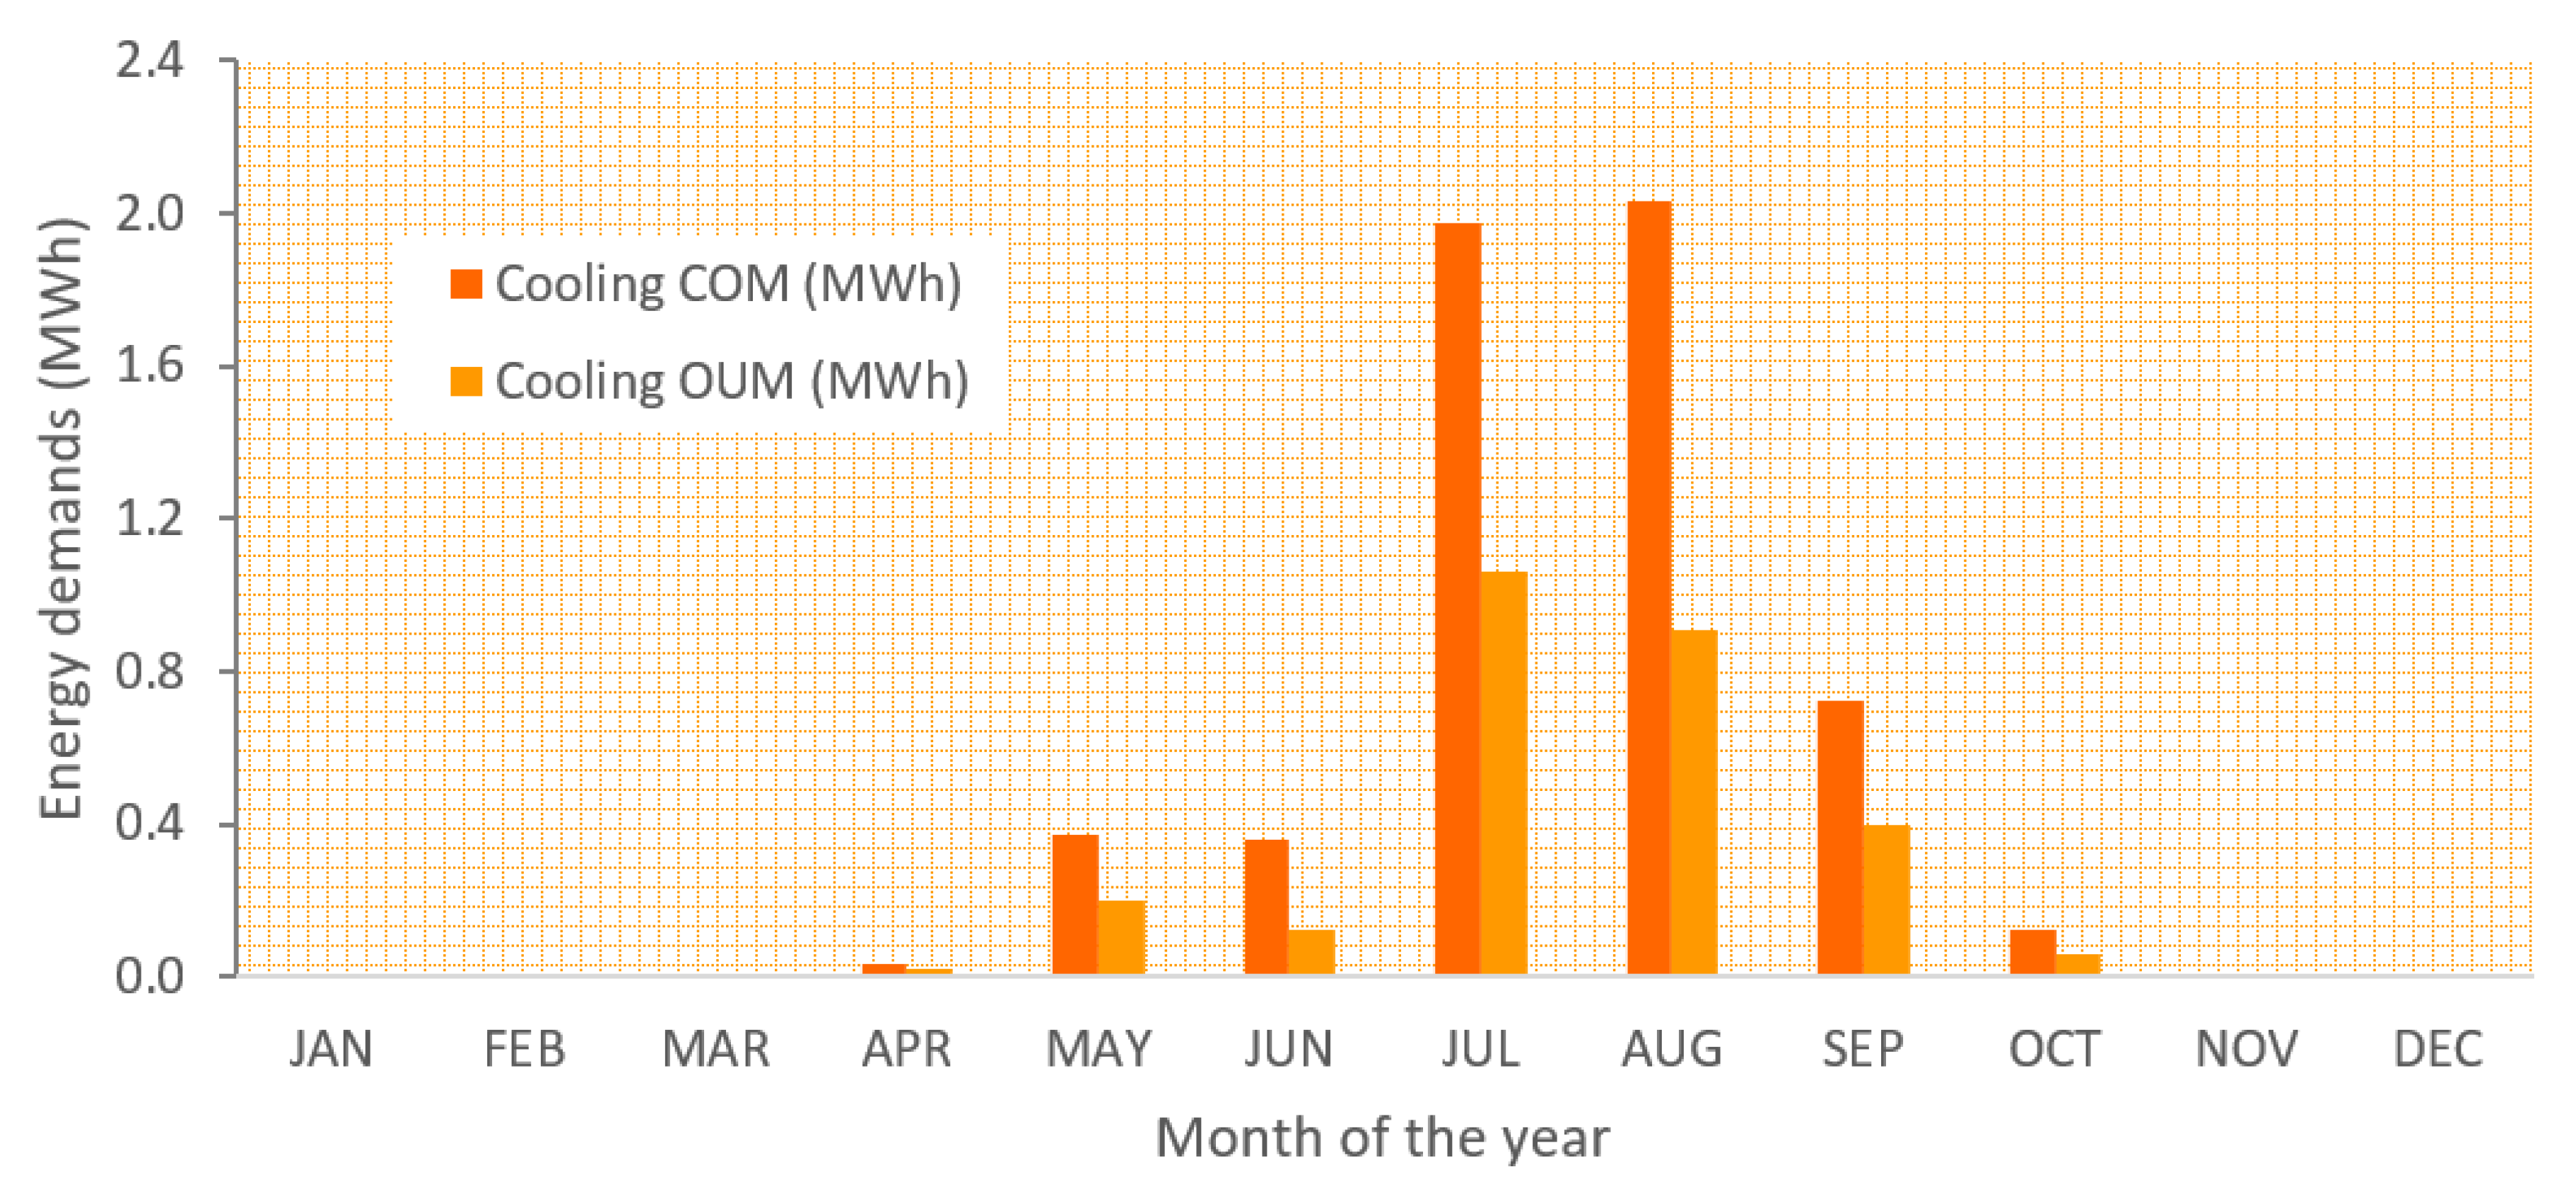
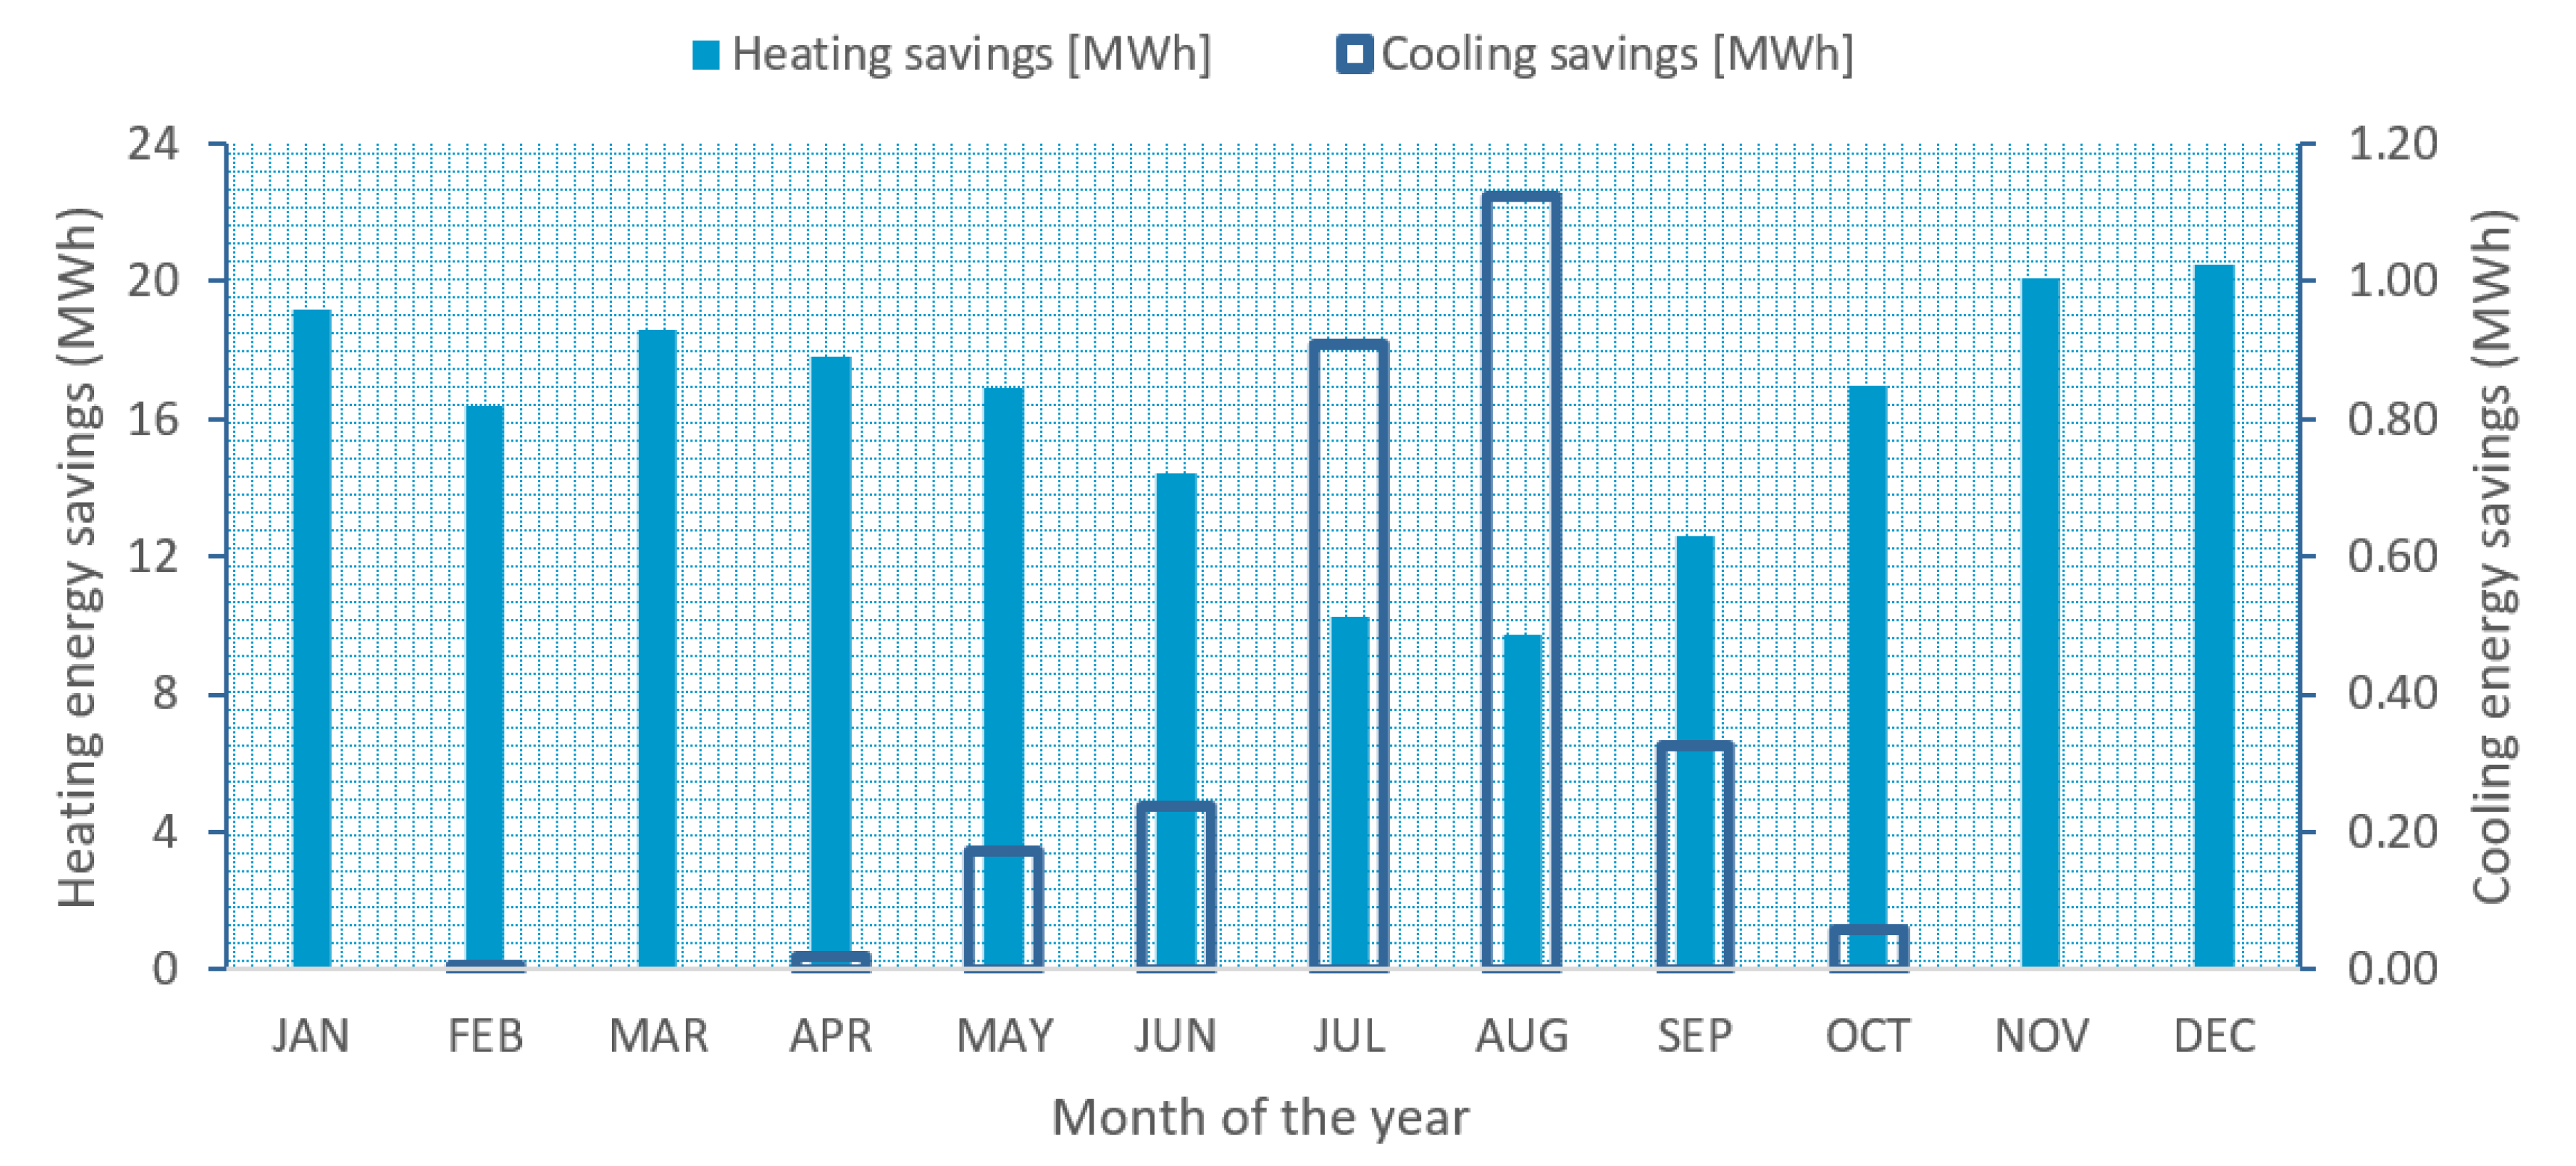
3.2.4. Potential Energy Savings of the Different Ventilation Scenarios

The calibrated model was used to simulate the energy demand of the surgical suite during the year 2019 under the different scenarios described in Section 2.2.3.
Figure 16 represents the monthly heating energy demand of the surgical suite during current operation mode (COM), which corresponds to Scenario 0 in Section 2.2.3., compared to the monthly heating energy demand during off-use operation mode (OUM), which corresponds to Scenario 1 in Section 2.2.3. This demand corresponds to energy savings always above 50%. It is worth highlighting the values obtained in the winter months where these savings are above 20 MWh per month. In summer, the savings represent a higher percentage but, in comparison, thermal energy is much lower. In a complementary way, Figure 17 represents the monthly cooling energy demand of the surgical suite during current operation mode (COM) and off-use operation mode (OUM). Although cooling savings are also important, especially during the months of July and August, the thermal values are much lower due to the meteorological conditions at the hospital location. Finally, Figure 18 gathers the total monthly heating and cooling energy savings of the surgical suite, from which the importance of the decrease in thermal heating energy during the summer months can also be appreciated.
Finally, Figure 19 represents the potential energy demands and savings of the ORs and the auxiliary rooms, according to the three ventilation scenarios described in Section 2.2.3. Obviously, energy savings depend mainly on the ACH and the percentage of the outdoor fresh air intake. In any room and with any of the new scenarios, savings are kept within the range of 50% to 70%. Specifically, in ORs the savings are greater in the third scenario, exceeding 65% of savings. This is explained because it is the scenario that allows higher recirculation rates, particularly 80%, with just 20% of fresh air intake.

4. Conclusions

This work evaluated the potential energy savings derived from applying extended set point ranges for temperature and RH during unoccupied periods in a surgical suite of a Spanish hospital. Accordingly, simulations of different ventilation scenarios were performed with a dynamic energy model of the whole suite, calibrated and validated with experimental data from two different periods in 2019. The core findings of this investigation are as follows.
The calibrated model is able to predict the thermal response of the suite with satisfactory accuracy, both during periods with surgical activity where the outdoor airflow intake is completely conditioned to maintain the current working conditions, and during off-use hours, where the range for the indoor air temperature was widened to 15–30 °C and the RH was not controlled.
Simulation results reveal that the actual annual energy demand of the surgical suite may be reduced by up to 50% by applying the aforementioned extended set point ranges and maintaining the current ventilation conditions. This is a recommendation that is not included in the Spanish standard, but in the French standard. Further, if the indoor recirculation rates were increased according to the ASHRAE (American Society of Heating, Refrigerating and Air-Conditioning Engineers) standard, that is 80% instead of the 0% currently applied, the energy savings could be increased up to 70%.
The safety of the indoor environment is not compromised under any of the studied scenarios as they are based on the recommendations given by internationally recognized standards on the design of HVAC systems for surgical areas. In addition, the simulation outcomes show that no condensation issues occur during a typical year under the studied ventilation and hygrothermal conditions.
The starting time for the HVAC system to provide the required hygrothermal conditions at the beginning of the occupied periods is found to be less than one hour when the outdoor temperature is above 5 °C. This is due to the high number of ACH considered in all scenarios.

Author Contributions

Conceptualization, J.L.L.-G., A.G.-G.; data curation, A.C.-R., J.L.L.-G., A.G.-G.; formal analysis, A.C.-R., L.F.-G.; funding acquisition, P.E.-O., E.G.-Á.; investigation, A.G.-G., L.F.-G.; methodology, A.C.-R., J.L.L.-G., A.G.-G.; project administration, P.E.-O., E.G.-Á.; resources, J.L.L.-G., E.G.-Á.; software, A.C.-R., L.F.-G.; supervision, J.L.L.-G., P.E.-O., E.G.-Á.; writing original draft, A.C.-R., A.G.-G., L.F.-G.; writing review and editing, A.C.-R., A.G.-G., L.F.-G., P.E.-O. All authors have read and agreed to the published version of the manuscript.

Funding

This research was funded by his research was funded by the project SMARTHERM (RTI2018-096296-B-C21) by the Spanish Government (Science, Innovation and Universities Ministry) and the project INMENA (IN852A 2018/59) funded by the program CONECTA PEME (FEDER-GALICIA 2014/2020).

Acknowledgments

The authors acknowledge the General Manager of the Regional Public Health Care System of Galicia (SERGAS) for authorizing this research and the publication of its results.

Conflicts of Interest

The authors declare no conflict of interest. The funders had no role in the design of the study; in the collection, analyses, or interpretation of data; in the writing of the manuscript, or in the decision to publish the results.

References

  1. Bawaneh, K.; Nezami, F.G.; Rasheduzzaman, M.; Deken, B. Energy consumption analysis and characterization of healthcare facilities in the United States. Energies 2019, 12, 3775. [Google Scholar] [CrossRef] [Green Version]
  2. Choudhary, R. Energy analysis of the non-domestic building stock of greater london. Build. Environ. 2012, 51, 243–254. [Google Scholar] [CrossRef]
  3. González, A.G.; García-Sanz-Calcedo, J.; Salgado, D.R. Evaluation of energy consumption in german hospitals: Benchmarking in the public sector. Energies 2018, 11, 2279. [Google Scholar] [CrossRef] [Green Version]
  4. González González, A.; García-Sanz-Calcedo, J.; Salgado, D.R. A quantitative analysis of final energy consumption in hospitals in spain. Sustain. Cities Soc. 2018, 36, 169–175. [Google Scholar] [CrossRef]
  5. García-Sanz-calcedo, J. Study of CO2 emissions from energy consumption in Spanish hospitals. Vibroengineering Procedia 2019, 26, 46–51. [Google Scholar] [CrossRef]
  6. Capozzoli, A.; Piscitelli, M.S.; Neri, F.; Grassi, D.; Serale, G. A novel methodology for energy performance benchmarking of buildings by means of linear mixed effect model: The case of space and dhw heating of out-patient healthcare centres. Appl. Energy 2016, 171, 592–607. [Google Scholar] [CrossRef]
  7. Teke, A.; Timur, O. Assessing the energy efficiency improvement potentials of hvac systems considering economic and environmental aspects at the hospitals. Renew. Sustain. Energy Rev. 2014, 33, 224–235. [Google Scholar] [CrossRef]
  8. Čongradac, V.; Prebiračević, B.; Jorgovanović, N.; Stanišić, D. Assessing the energy consumption for heating and cooling in hospitals. Energy Build. 2012, 48, 146–154. [Google Scholar] [CrossRef]
  9. Ahmed, T.M.F.; Rajagopalan, P.; Fuller, R. A classification of healthcare facilities: Toward the development of energy performance benchmarks for day surgery centers in australia. Health Environ. Res. Des. J. 2015, 8, 139–157. [Google Scholar] [CrossRef]
  10. Ji, R.; Qu, S. Investigation and evaluation of energy consumption performance for hospital buildings in china. Sustainability 2019, 11, 1724. [Google Scholar] [CrossRef] [Green Version]
  11. Ascione, F.; Bianco, N.; De Masi, R.F.; Vanoli, G.P. Rehabilitation of the building envelope of hospitals: Achievable energy savings and microclimatic control on varying the hvac systems in mediterranean climates. Energy Build. 2013, 60, 125–138. [Google Scholar] [CrossRef]
  12. Buonomano, A.; Calise, F.; Ferruzzi, G.; Palombo, A. Dynamic energy performance analysis: Case study for energy efficiency retrofits of hospital buildings. Energy 2014, 78, 555–572. [Google Scholar] [CrossRef]
  13. Vaziri, S.M.; Rezaee, B.; Monirian, M.A. Utilizing renewable energy sources efficiently in hospitals using demand dispatch. Renew. Energy 2019, 151, 551–562. [Google Scholar] [CrossRef]
  14. Bujak, J.W. Production of waste energy and heat in hospital facilities. Energy 2015, 91, 350–362. [Google Scholar] [CrossRef]
  15. Bakaimis, B.; Papanikolaou, I. Electrical energy saving policies, initiatives, results, challenges and lessons learned for the grevena hospital. Procedia Environ. Sci. 2017, 38, 882–889. [Google Scholar] [CrossRef]
  16. García-Sanz-Calcedo, J.; Al-Kassir, A.; Yusaf, T. Economic and environmental impact of energy saving in healthcare buildings. Appl. Sci. 2018, 8, 440. [Google Scholar] [CrossRef] [Green Version]
  17. Gaspari, J.; Fabbri, K.; Gabrielli, L. A study on parametric design application to hospital retrofitting for improving energy savings and comfort conditions. Buildings 2019, 9, 220. [Google Scholar] [CrossRef] [Green Version]
  18. Wyssusek, K.H.; Keys, M.T.; van Zundert, A.A.J. Operating room greening initiatives – the old, the new, and the way forward: A narrative review. Waste Manag. Res. 2019, 37, 3–19. [Google Scholar] [CrossRef]
  19. Wang, T.; Li, X.; Liao, P.-C.; Fang, D. Building energy efficiency for public hospitals and healthcare facilities in china: Barriers and drivers. Energy 2016, 103, 588–597. [Google Scholar] [CrossRef]
  20. Kolokotsa, D.; Tsoutsos, T.; Papantoniou, S. Energy conservation techniques for hospital buildings. Adv. Build. Energy Res. 2012, 6, 159–172. [Google Scholar] [CrossRef]
  21. González-Gil, A.; López-González, J.L.; Fernández, M.; Eguía, P.; Erkoreka, A.; Granada, E. Thermal energy demand and potential energy savings in a spanish surgical suite through calibrated simulations. Energy Build. 2018, 174, 513–526. [Google Scholar] [CrossRef]
  22. Ho, S.H.; Rosario, L.; Rahman, M.M. Three-dimensional analysis for hospital operating room thermal comfort and contaminant removal. Appl. Therm. Eng. 2009, 29, 2080–2092. [Google Scholar] [CrossRef]
  23. Chow, T.T.; Yang, X.Y. Ventilation performance in operating theatres against airborne infection: Review of research activities and practical guidance. J. Hosp. Infect. 2004, 56, 85–92. [Google Scholar] [CrossRef] [PubMed]
  24. Chow, T.T.; Yang, X.Y. Ventilation performance in the operating theatre against airborne infection: Numerical study on an ultra-clean system. J. Hosp. Infect. 2005, 59, 138–147. [Google Scholar] [CrossRef]
  25. Rui, Z.; Guangbei, T.; Jihong, L. Study on biological contaminant control strategies under different ventilation models in hospital operating room. Build. Environ. 2008, 43, 793–803. [Google Scholar] [CrossRef]
  26. Yau, Y.H.; Ding, L.C. A comprehensive computational fluid dynamics simulation on the air distribution in an operating room at university of malaya medical centre malaysia. Indoor Built Environ. 2015, 24, 355–369. [Google Scholar] [CrossRef]
  27. Mora, R.; English, M.J.M.; Athienitis, A.K. Assessment of Thermal Comfort during Surgical Operations; ASHRAE Winter Meeting CD, Technical and Symposium Papers; ASHRAE: Houston, TX, USA, 2001; pp. 65–74. [Google Scholar]
  28. Khodakarami, J.; Nasrollahi, N. Thermal comfort in hospitals—A literature review. Renew. Sustain. Energy Rev. 2012, 16, 4071–4077. [Google Scholar] [CrossRef]
  29. Van Gaever, R.; Jacobs, V.A.; Diltoer, M.; Peeters, L.; Vanlanduit, S. Thermal comfort of the surgical staff in the operating room. Build. Environ. 2014, 81, 37–41. [Google Scholar] [CrossRef]
  30. Sánchez-Barroso, G.; Sanz-Calcedo, J.G. Evaluation of hvac design parameters in high-performance hospital operating theatres. Sustainability 2019, 11, 1493. [Google Scholar] [CrossRef] [Green Version]
  31. Balaras, C.A.; Dascalaki, E.; Gaglia, A. Hvac and indoor thermal conditions in hospital operating rooms. Energy Build. 2007, 39, 454–470. [Google Scholar] [CrossRef]
  32. Melhado, M.A.; Hensen, J.; Loomans, M.G.L.C.; Forejt, L. Review of Operating Room Ventilation Standards; STP-Society of Environmental Engineering: Prague, Czech Republic, 2019. [Google Scholar]
  33. Yau, Y.H. The use of a double heat pipe heat exchanger system for reducing energy consumption of treating ventilation air in an operating theatre—A full year energy consumption model simulation. Energy Build. 2008, 40, 917–925. [Google Scholar] [CrossRef]
  34. Noie-Baghban, S.H.; Majideian, G.R. Waste heat recovery using heat pipe heat exchanger (hphe) for surgery rooms in hospitals. Appl. Therm. Eng. 2000, 20, 1271–1282. [Google Scholar] [CrossRef]
  35. Ozyogurtcu, G.; Mobedi, M.; Ozerdem, B. Economical assessment of different hvac systems for an operating room: Case study for different turkish climate regions. Energy Build. 2011, 43, 1536–1543. [Google Scholar] [CrossRef] [Green Version]
  36. Wang, C.; Holmberg, S.; Sadrizadeh, S. Numerical study of temperature-controlled airflow in comparison with turbulent mixing and laminar airflow for operating room ventilation. Build. Environ. 2018, 144, 45–56. [Google Scholar] [CrossRef]
  37. Alsved, M.; Civilis, A.; Ekolind, P.; Tammelin, A.; Andersson, A.E.; Jakobsson, J.; Svensson, T.; Ramstorp, M.; Sadrizadeh, S.; Larsson, P.A.; et al. Temperature-controlled airflow ventilation in operating rooms compared with laminar airflow and turbulent mixed airflow. J. Hosp. Infect. 2018, 98, 181–190. [Google Scholar] [CrossRef] [Green Version]
  38. Febrero Garrido, L.; López, G.; Eguía, O.; Granada, Á. Development of a calibrated simulation method for airborne particles to optimize energy consumption in operating rooms. Energies 2019, 12, 2433. [Google Scholar] [CrossRef] [Green Version]
  39. Cannistraro, G.; Cannistraro, M.; Galvagno, A.; Trovato, G. Analysis and measures for energy savings in operating theaters. Int. J. Heat Technol. 2017, 35, S422–S448. [Google Scholar] [CrossRef]
  40. Sánchez-Barroso Moreno, G.; García-Sanz Calcedo, J.; González, A.G.; Salgado, D.R. Sustainable Solutions for Thermal Energy Saving in Hospital Operating Theatres; E3S Web of Conferences; EENVIRO 2018: Cluj Napoca, Romania, 2019. [Google Scholar]
  41. AENOR. Une 100713:2005 Instalaciones de Acondicionamiento de Aire en Hospitals; AENOR: Madrid, España, 2005. [Google Scholar]
  42. ASHRAE. Ansi/Ashrae/Ashe Standard 170-2017 Ventilation of Health Care Facilities; AHSRAE: Atlanta, GA, USA, 2017. [Google Scholar]
  43. Chow, T.-T.; Yang, X.-Y. Performance of ventilation system in a non-standard operating room. Build. Environ. 2003, 38, 1401–1411. [Google Scholar] [CrossRef]
  44. Loomans, M.G.L.C.; Molenaar, P.C.A.; Kort, H.S.M.; Joosten, P.H.J. Energy demand reduction in pharmaceutical cleanrooms through optimization of ventilation. Energy Build. 2019, 202, 109346. [Google Scholar] [CrossRef]
  45. Porowski, M. Energy optimization of hvac system from a holistic perspective: Operating theater application. Energy Convers. Manag. 2019, 182, 461–496. [Google Scholar] [CrossRef]
  46. AFNOR. Nf s90-351 Établissements de Santé—Zones à Environnement Maîtrisé—Exigences Relatives à la Maîtrise de la Contamination Aéroportée; AFNOR: Paris, France, 2013. [Google Scholar]
  47. Wisconsin-Madison, S.E.L.U.O. Trnsys 17, a Transient System Simulation Program User Manual; University of Wisconsin: Madison, MI, USA, 2012. [Google Scholar]
  48. ISO. 7730:2005. Ergonomics of the Thermal Environment—Analytical Determination and Interpretation of Thermal Comfort Using Calculation of the PMV and PPD Indices and Local Thermal Comfort Criteria; ISO: Geneva, Switzerland, 2005. [Google Scholar]
  49. Laboratory, L.B.N. Genopt Generic Optimization Program; Lawrence Berkeley National Laboratory: Berkeley, CA, USA, 2016. [Google Scholar]
  50. Ruiz, G.R.; Bandera, C.F. Validation of calibrated energy models: Common errors. Energies 2017, 10, 1587. [Google Scholar] [CrossRef] [Green Version]
Figure 1. Heating, ventilation and air conditioning (HVAC) system of the surgical suite. In particular, Air Handling Units (AHUs) from OR2 and OR3.
Applsci 10 02233 g001
Figure 2. Geometric and constructive model generated with SketchUp and TRNBuild.
Applsci 10 02233 g002
Figure 3. Simulation diagram implemented in TRNSYS.
Applsci 10 02233 g003
Figure 4. Temperature and RH from OR1 during the first experimental data campaign.
Applsci 10 02233 g004
Figure 5. Temperature and RH from OR2 during the first experimental data campaign.
Applsci 10 02233 g005
Figure 6. Temperature and humidity from OR3 during the first experimental data campaign.
Applsci 10 02233 g006
Figure 7. Temperature and RH in OR1 during the second experimental data campaign.
Applsci 10 02233 g007
Figure 8. Temperature and RH in OR2 during the second experimental data campaign.
Applsci 10 02233 g008
Figure 9. Temperature and RH in OR3 during the second experimental data campaign.
Applsci 10 02233 g009
Figure 10. Comparison between simulated and experimental air temperature and RH in the ORs during the second data campaign.
Applsci 10 02233 g010
Figure 11. Comparison between measurements and simulation results for air temperature in OR1 during the second experimental campaign.
Applsci 10 02233 g011
Figure 12. Comparison between measurements and simulation results for air RH in OR1 during the second experimental campaign.
Applsci 10 02233 g012
Figure 13. Evolution of the difference of temperature along the year.
Applsci 10 02233 g013
Figure 14. Degrees Celsius needed to reach the dew point temperature.
Applsci 10 02233 g014
Figure 15. Time required to reach the setpoint temperature.
Applsci 10 02233 g015
Figure 16. Monthly heating energy demand of the surgical suite during current operation mode (COM) and off-use operation mode (OUM).
Applsci 10 02233 g016
Figure 17. Monthly cooling energy demand of the surgical suite during COM and OUM.
Applsci 10 02233 g017
Figure 18. Monthly heating and cooling energy savings of the surgical suite using OUM.
Applsci 10 02233 g018
Figure 19. Potential energy savings by applying the ventilation requirements of different scenarios.
Applsci 10 02233 g019
Table 1. Lighting and electrical equipment power in the surgical suite.
LightingElectrical Equipment
SpacePower (W)SpacePower (W)
ORs3300ORs31,500 1
Ancillary rooms1500Ancillary rooms-
Corridors1000Corridors-
Total5800Total31,500
1 All of the equipment in each of the operating rooms (ORs) accounts for approximately 10,500 W, but at no time is every piece of equipment used simultaneously.
Table 2. Temperature and relative humidity (RH) sensors.
Sensor NumberModelZoneVariableUncertainty
1Siemens QFA2060OR1Temperature±0.7 °C, at 15 °C…35 °C
±1 °C, at −35 °C…50 °C
2OR2
3OR3RH±5%, at 0%…95%
±3%, at 30%…70%
4Siemens QFM2160Ancillary roomsTemperature±0.8 °C, at 15 °C…35 °C
±1 °C, at −35 °C…50 °C
5Entrance corridor
6Exit corridorRH±5%, at 0%…95%
±3%, at 30%…70%
Table 3. Main simulated ventilation parameters in the different scenarios.
ParametersZoneSCENARIO 1SCENARIO 2SCENARIO 3
Total air intakeORs21.5 ACH21.5 ACH20 ACH
Anc. rooms6 ACH6 ACH6 ACH
Outside air intakeORs21.5 ACH10.8 ACH4 ACH
Anc. rooms6 ACH3 ACH2 ACH
Working period 1 hygrothermal conditionsORsT = 22 °C, 45–55% RH
Anc. roomsT = 23.5 °C, 45–55% RH
Off-use period hygrothermal conditionsORs15–30 °CNon-controlled RH
Anc. rooms
1 Working period: Monday to Friday, from 8 am to 3 pm.
Table 4. Maximum, minimum and average temperature and humidity from the ORs.
OR1OR2OR3
Intake AirIndoor AirIntake AirIndoor AirIntake AirIndoor Air
Maximum RH [%]68.266.575.466.379.768.9
Average RH [%]52.455.156.954.958.256.1
Minimum RH [%]30.841.832.841.931.841.4
Maximum T [°C]31.726.831.426.632.426.5
Average T [°C]23.522.822.823.022.822.4
Minimum T [°C]18.319.817.120.116.519.1
Table 5. Coefficient of variation of the root mean square error (CV(RMSE)) of temperature and RH of the ORs during the two experimental campaigns.
First Data Collection PeriodSecond Data Collection Period
ErrorOR1OR2OR3OR1OR2OR3
CV(RMSE) Temperatures1.02%2.63%0.64%1.12%3.16%0.73%
CV(RMSE) RH3.98%3.26%2.54%2.96%3.75%2.31%

