Effects of Irrigation with Desalinated Water on Lettuce Grown under Greenhouse in South Korea


Abstract
1. Introduction
2. Materials and Methods
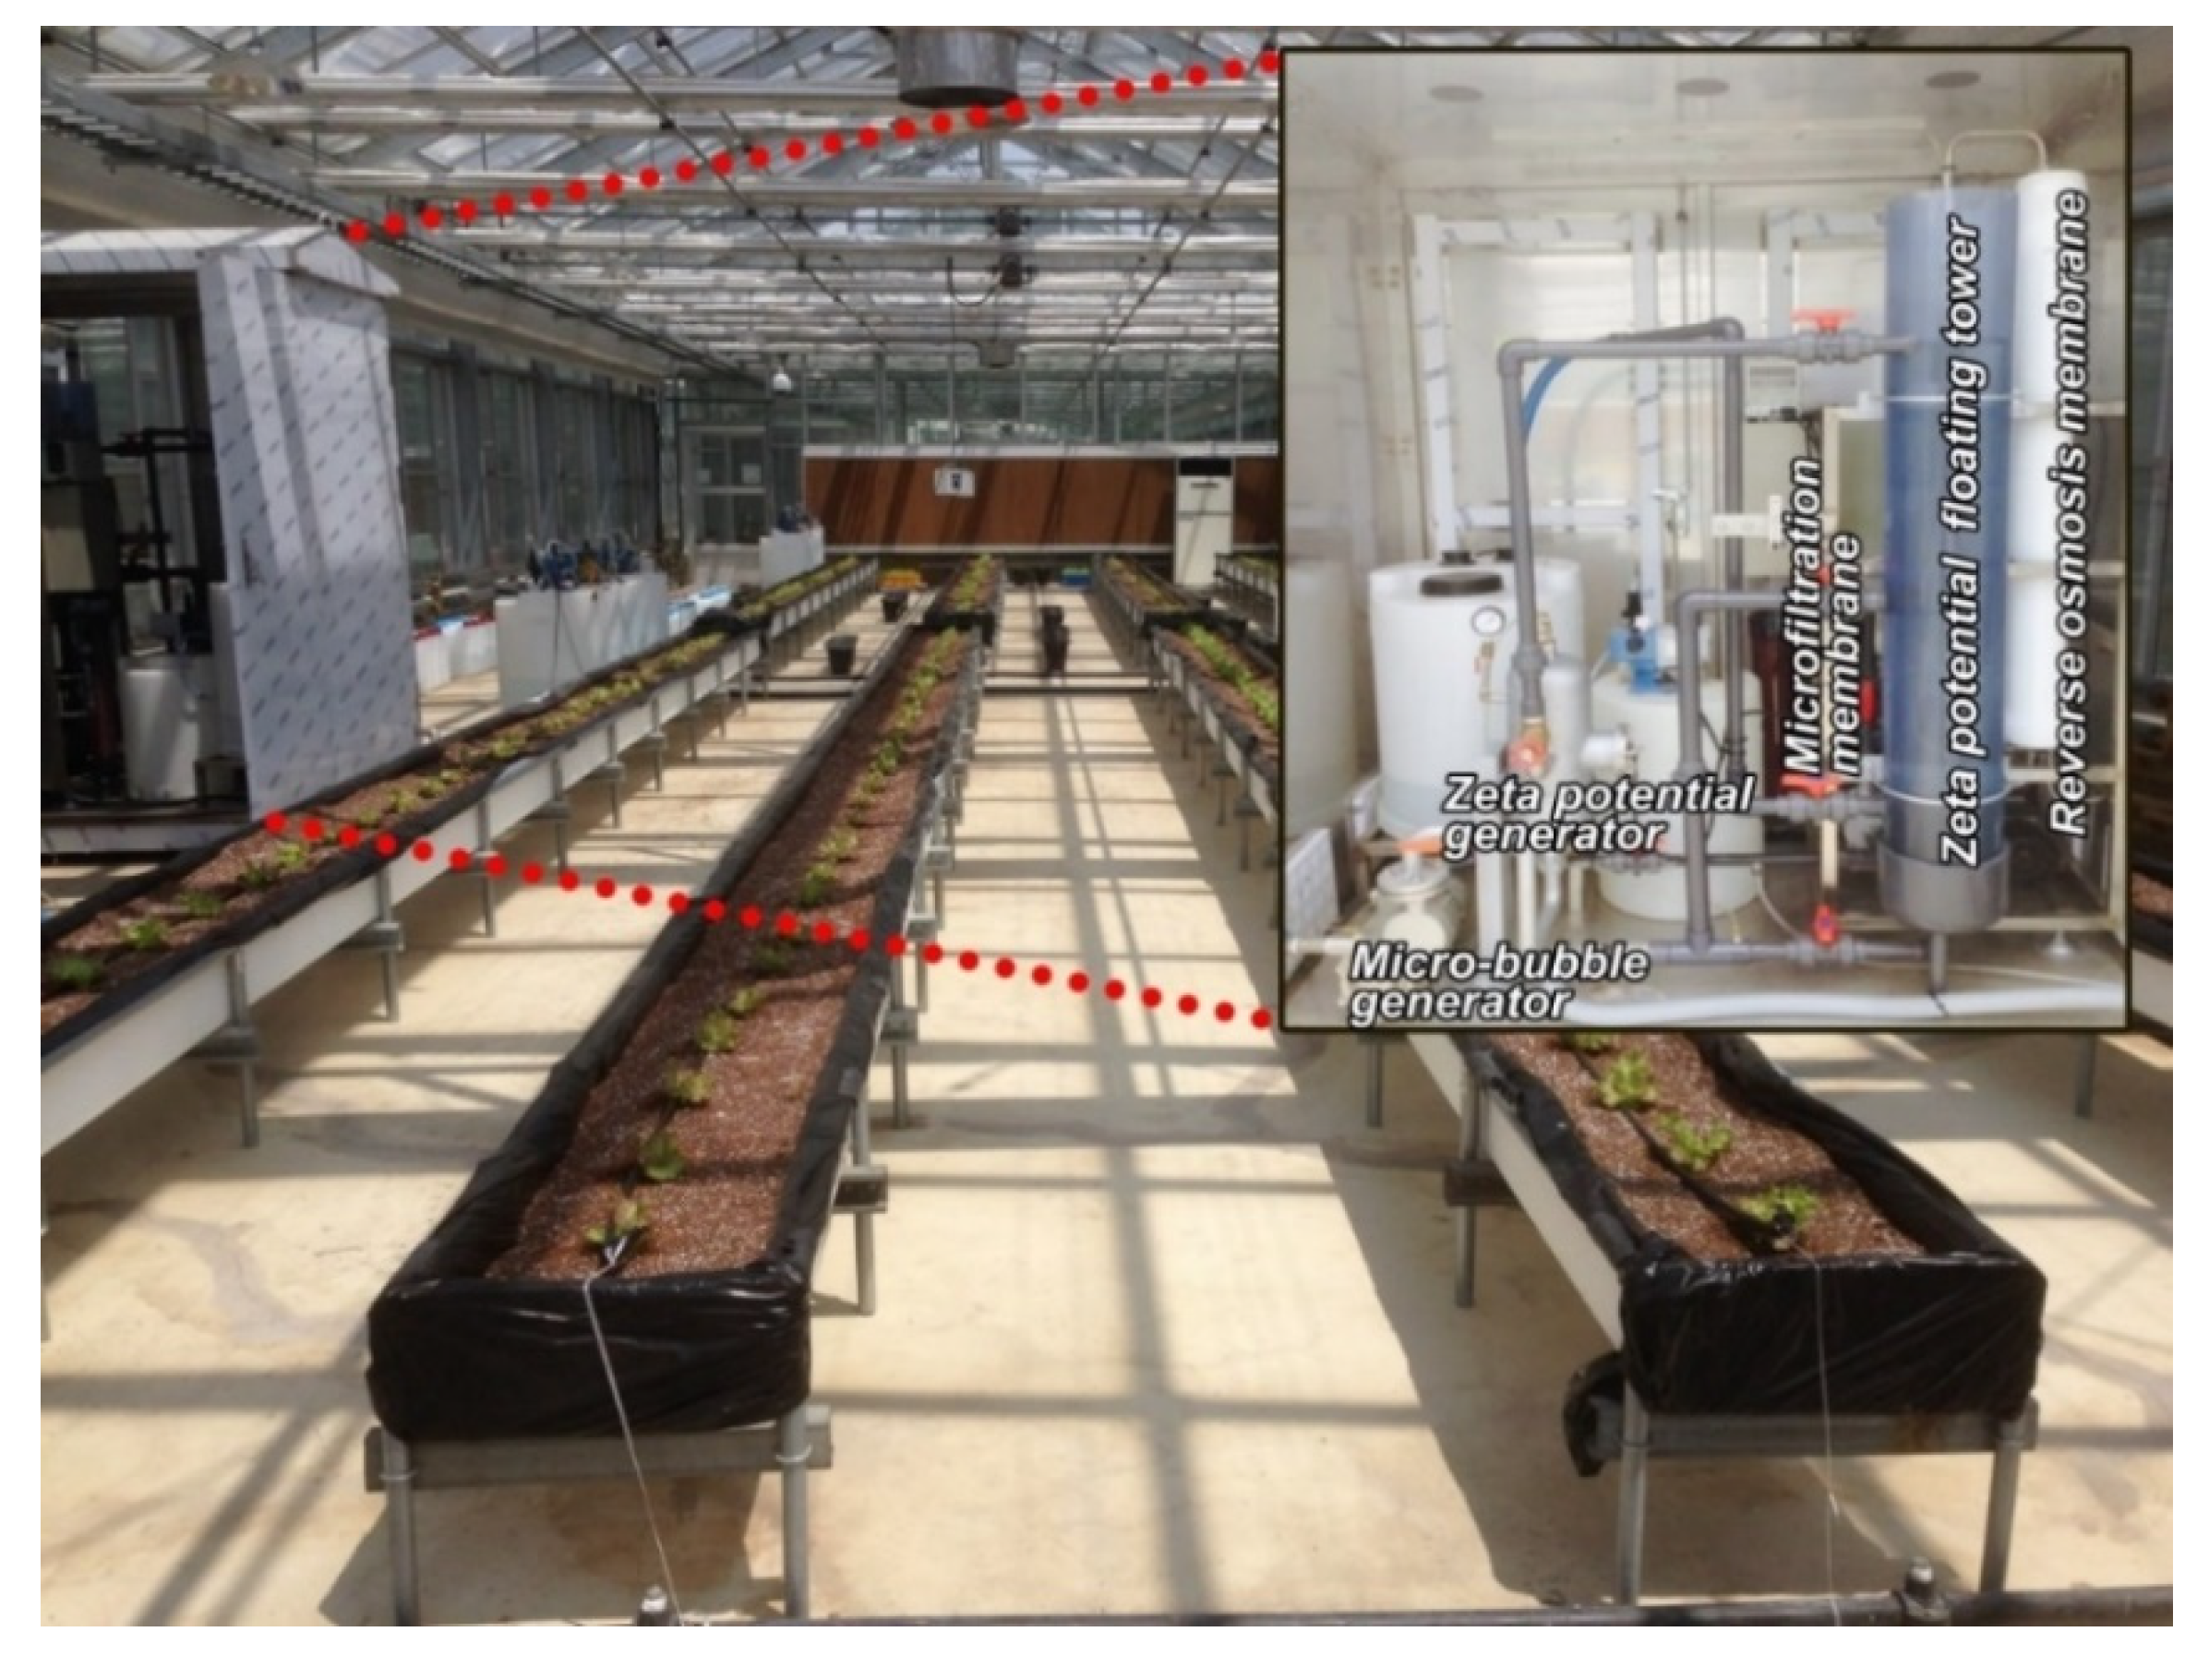
2.1. Experimental Design
2.2. Water Quality, Soil, and Plant Analyses
2.3. Statistical Analysis
3. Results and Discussion
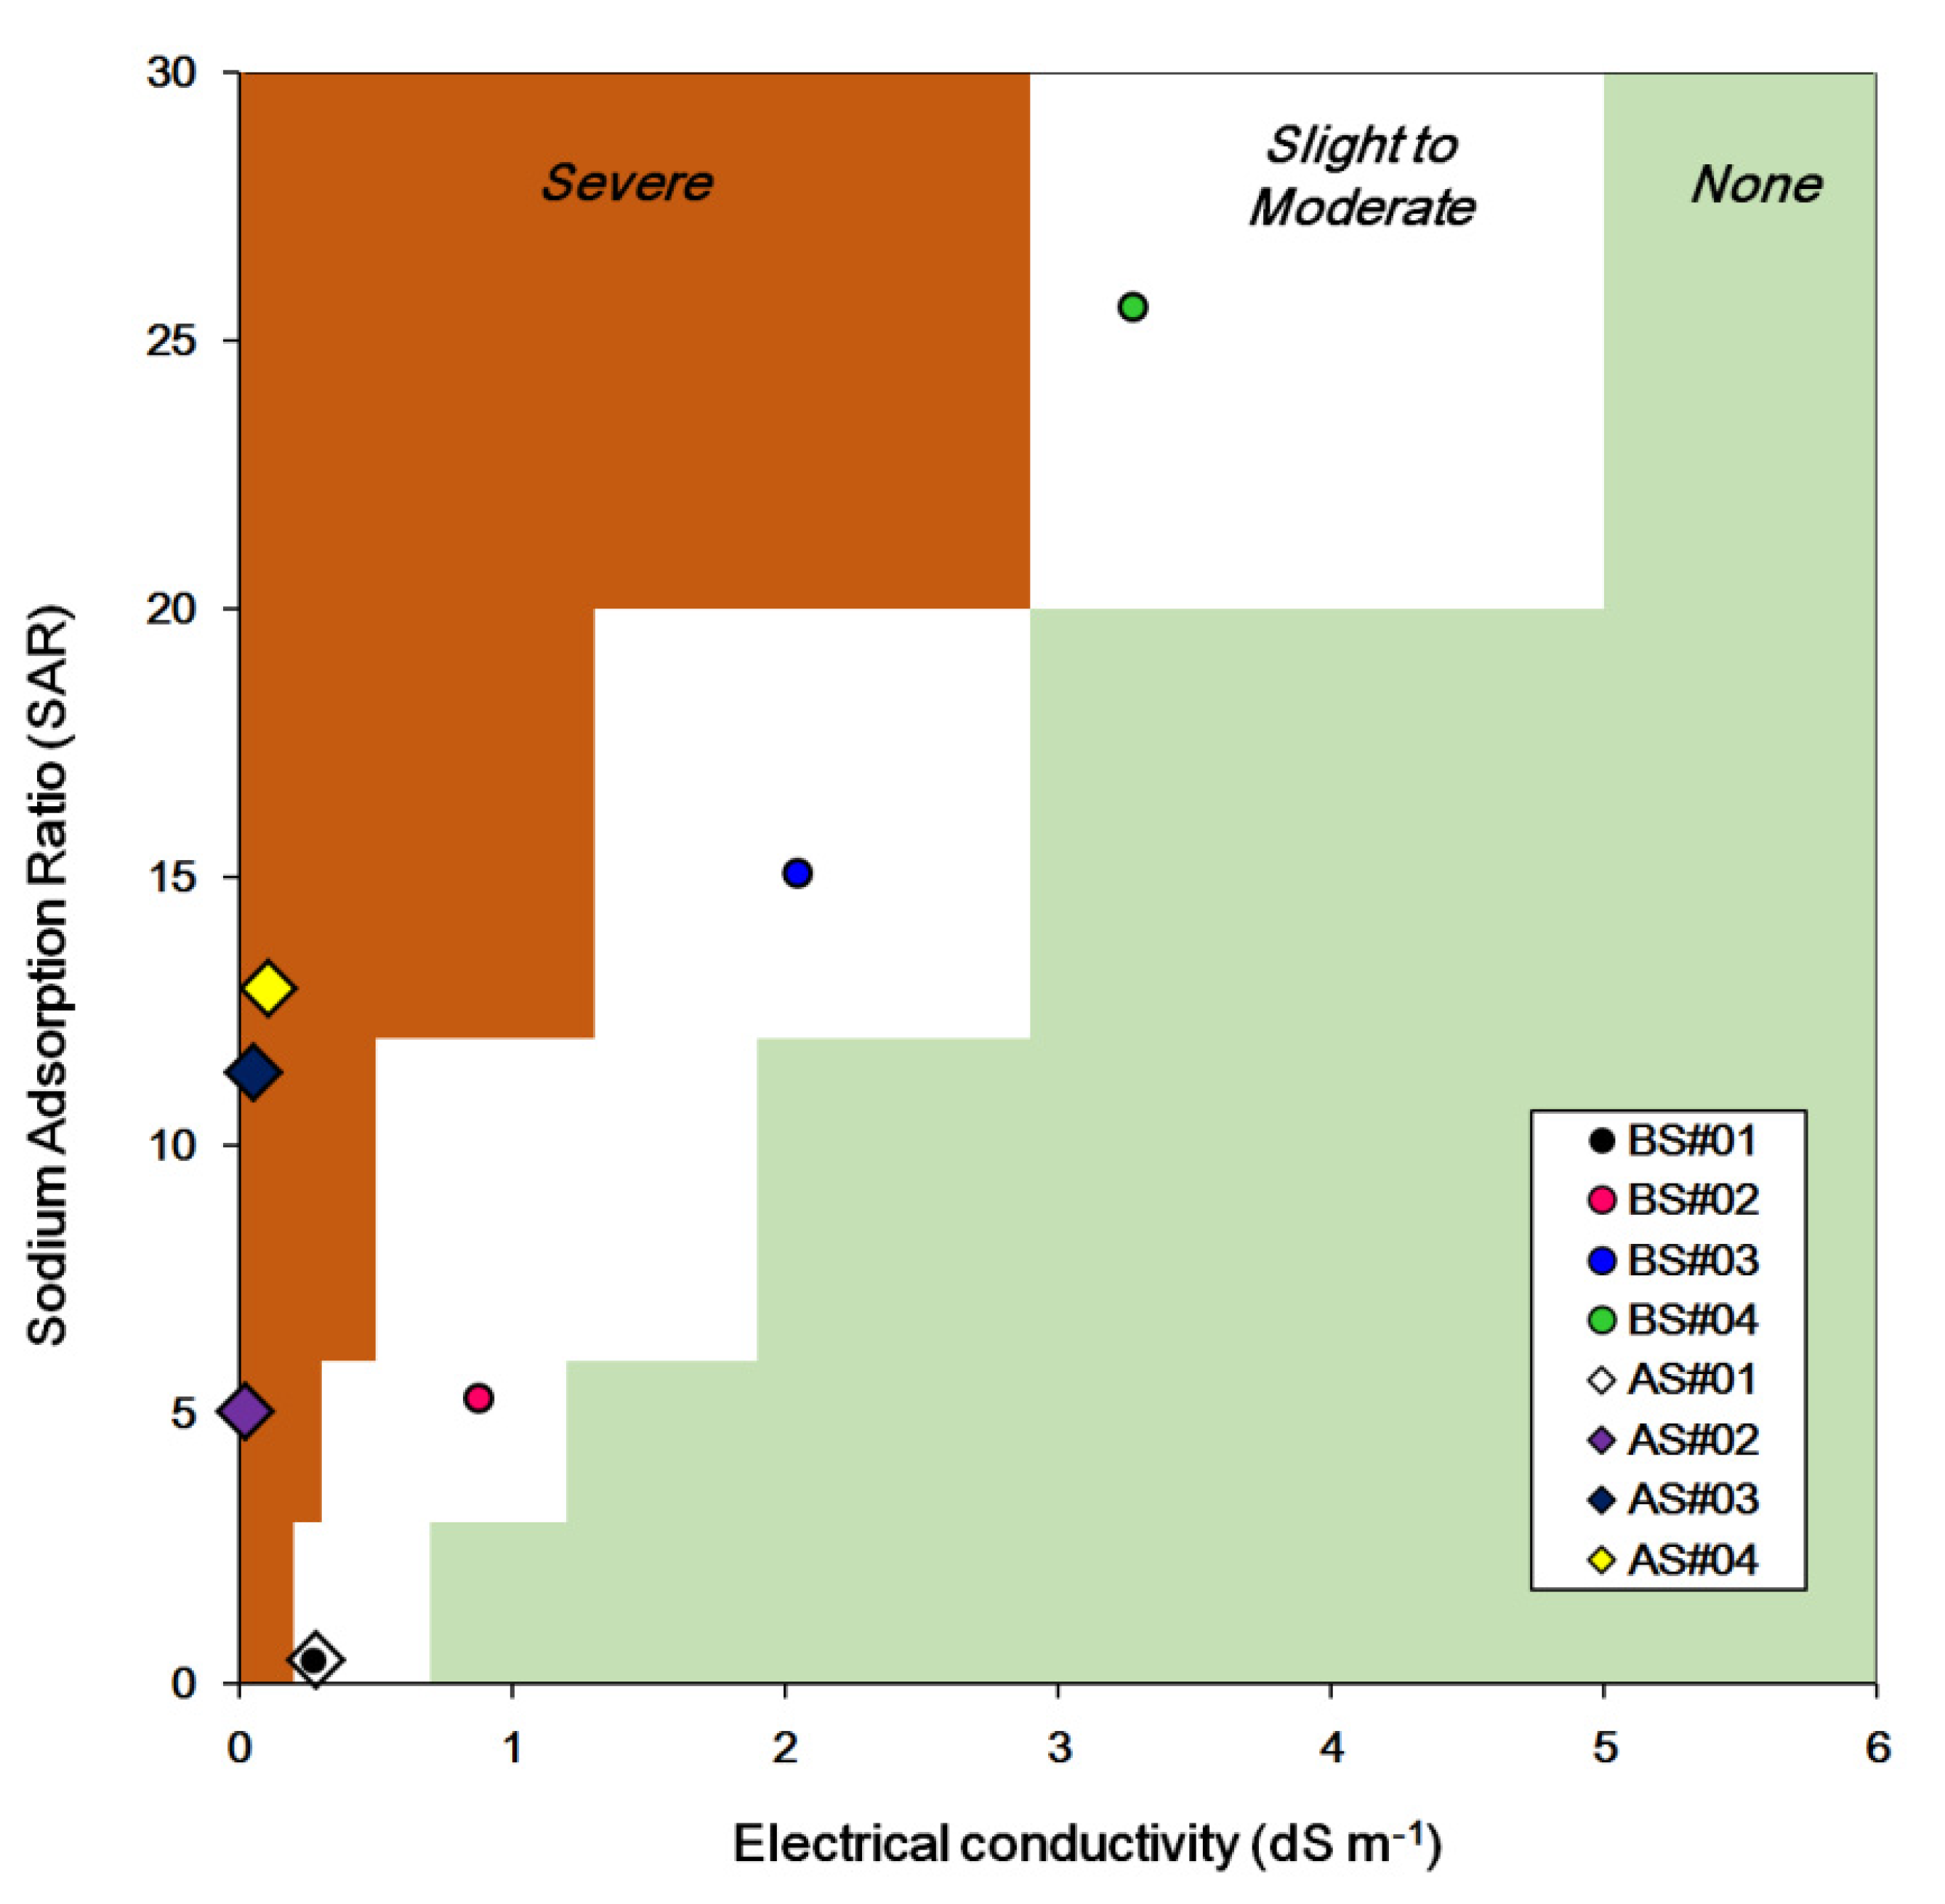
3.1. Irrigation Water
3.2. Soil
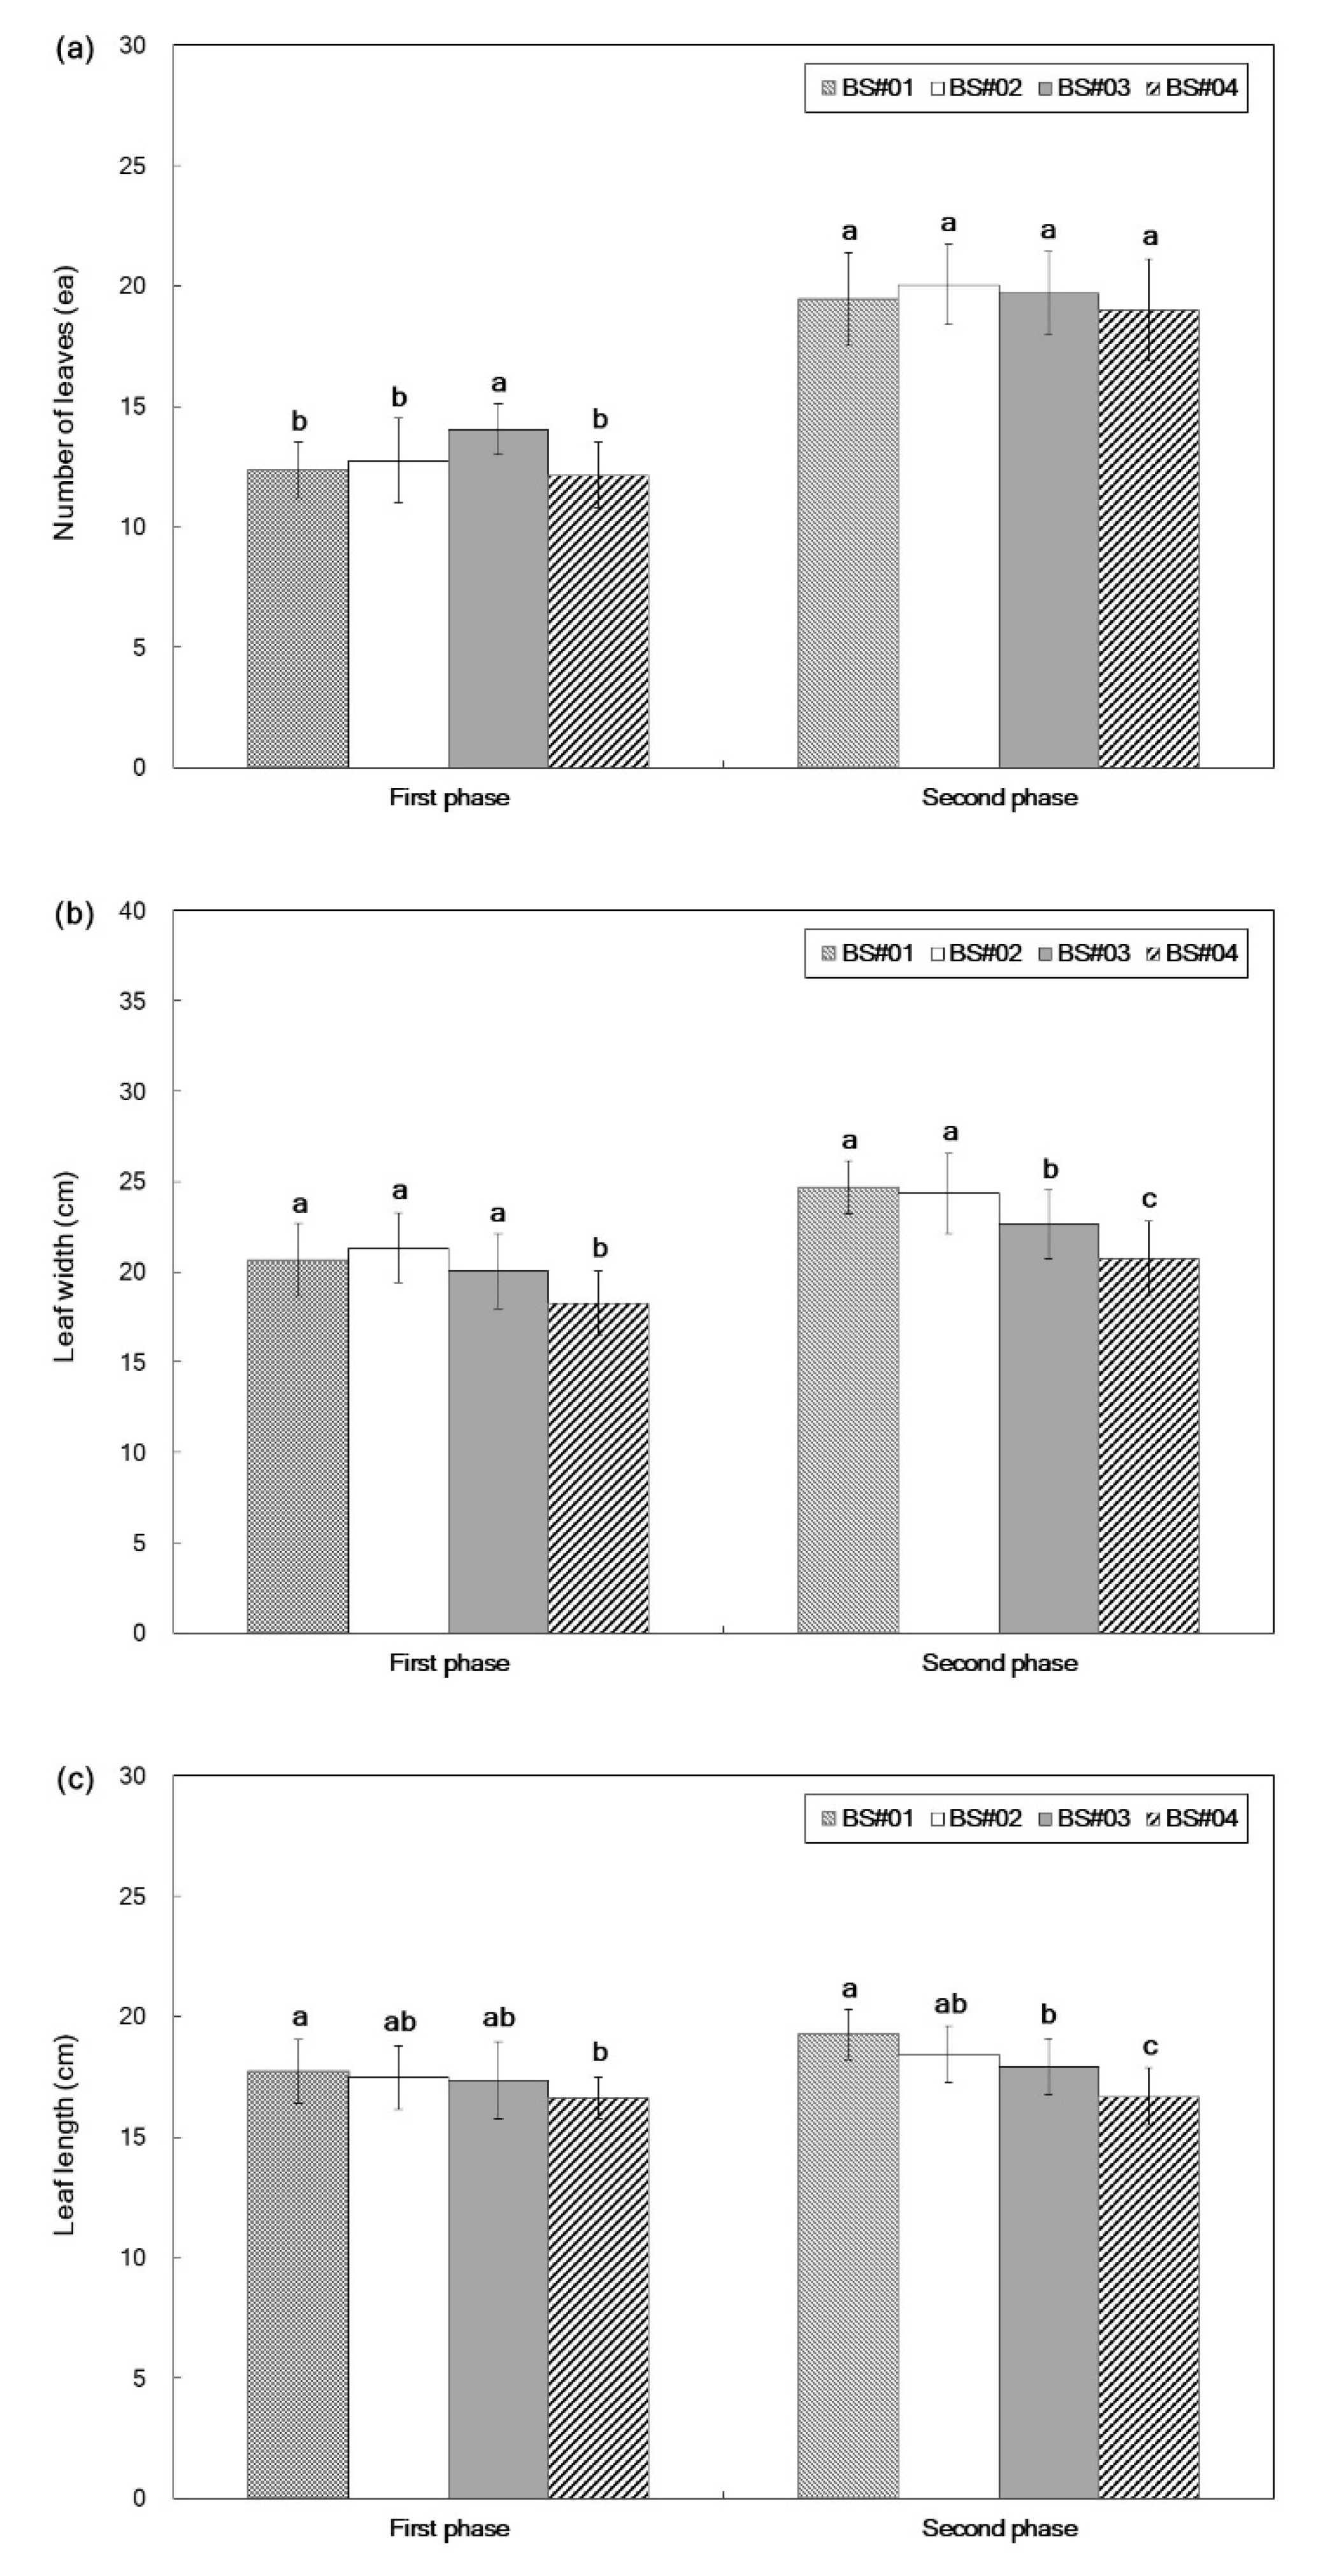
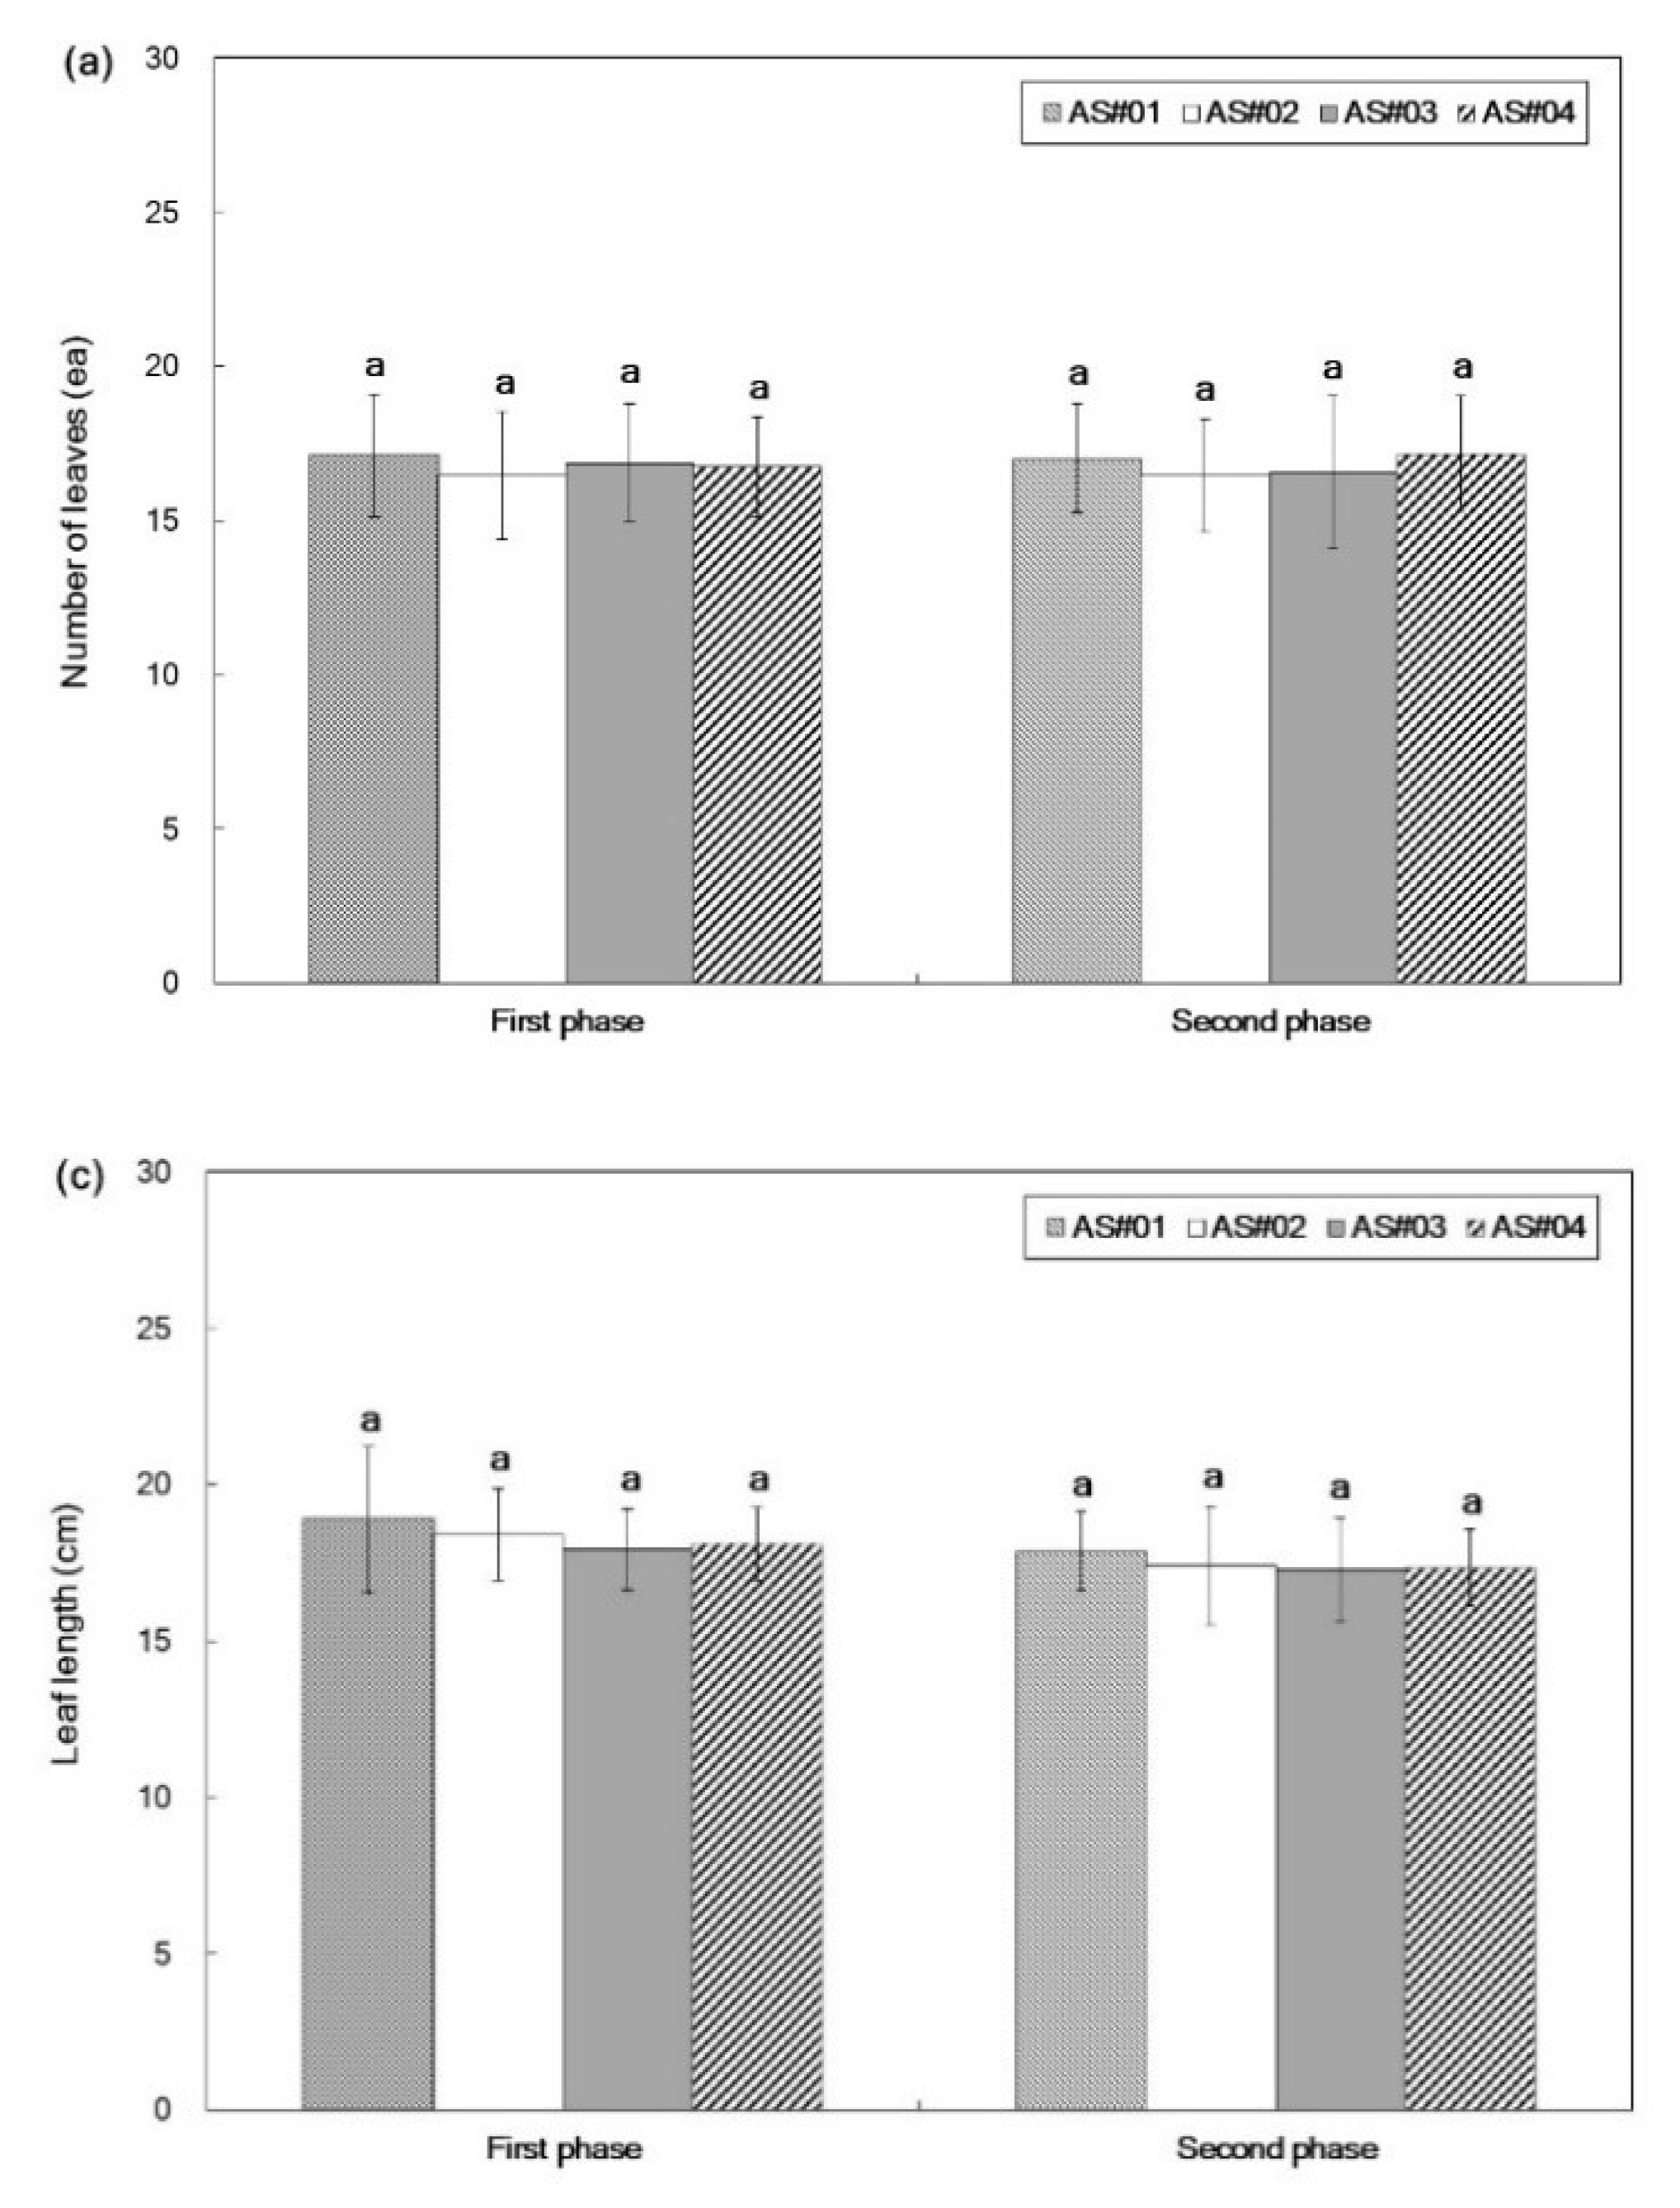
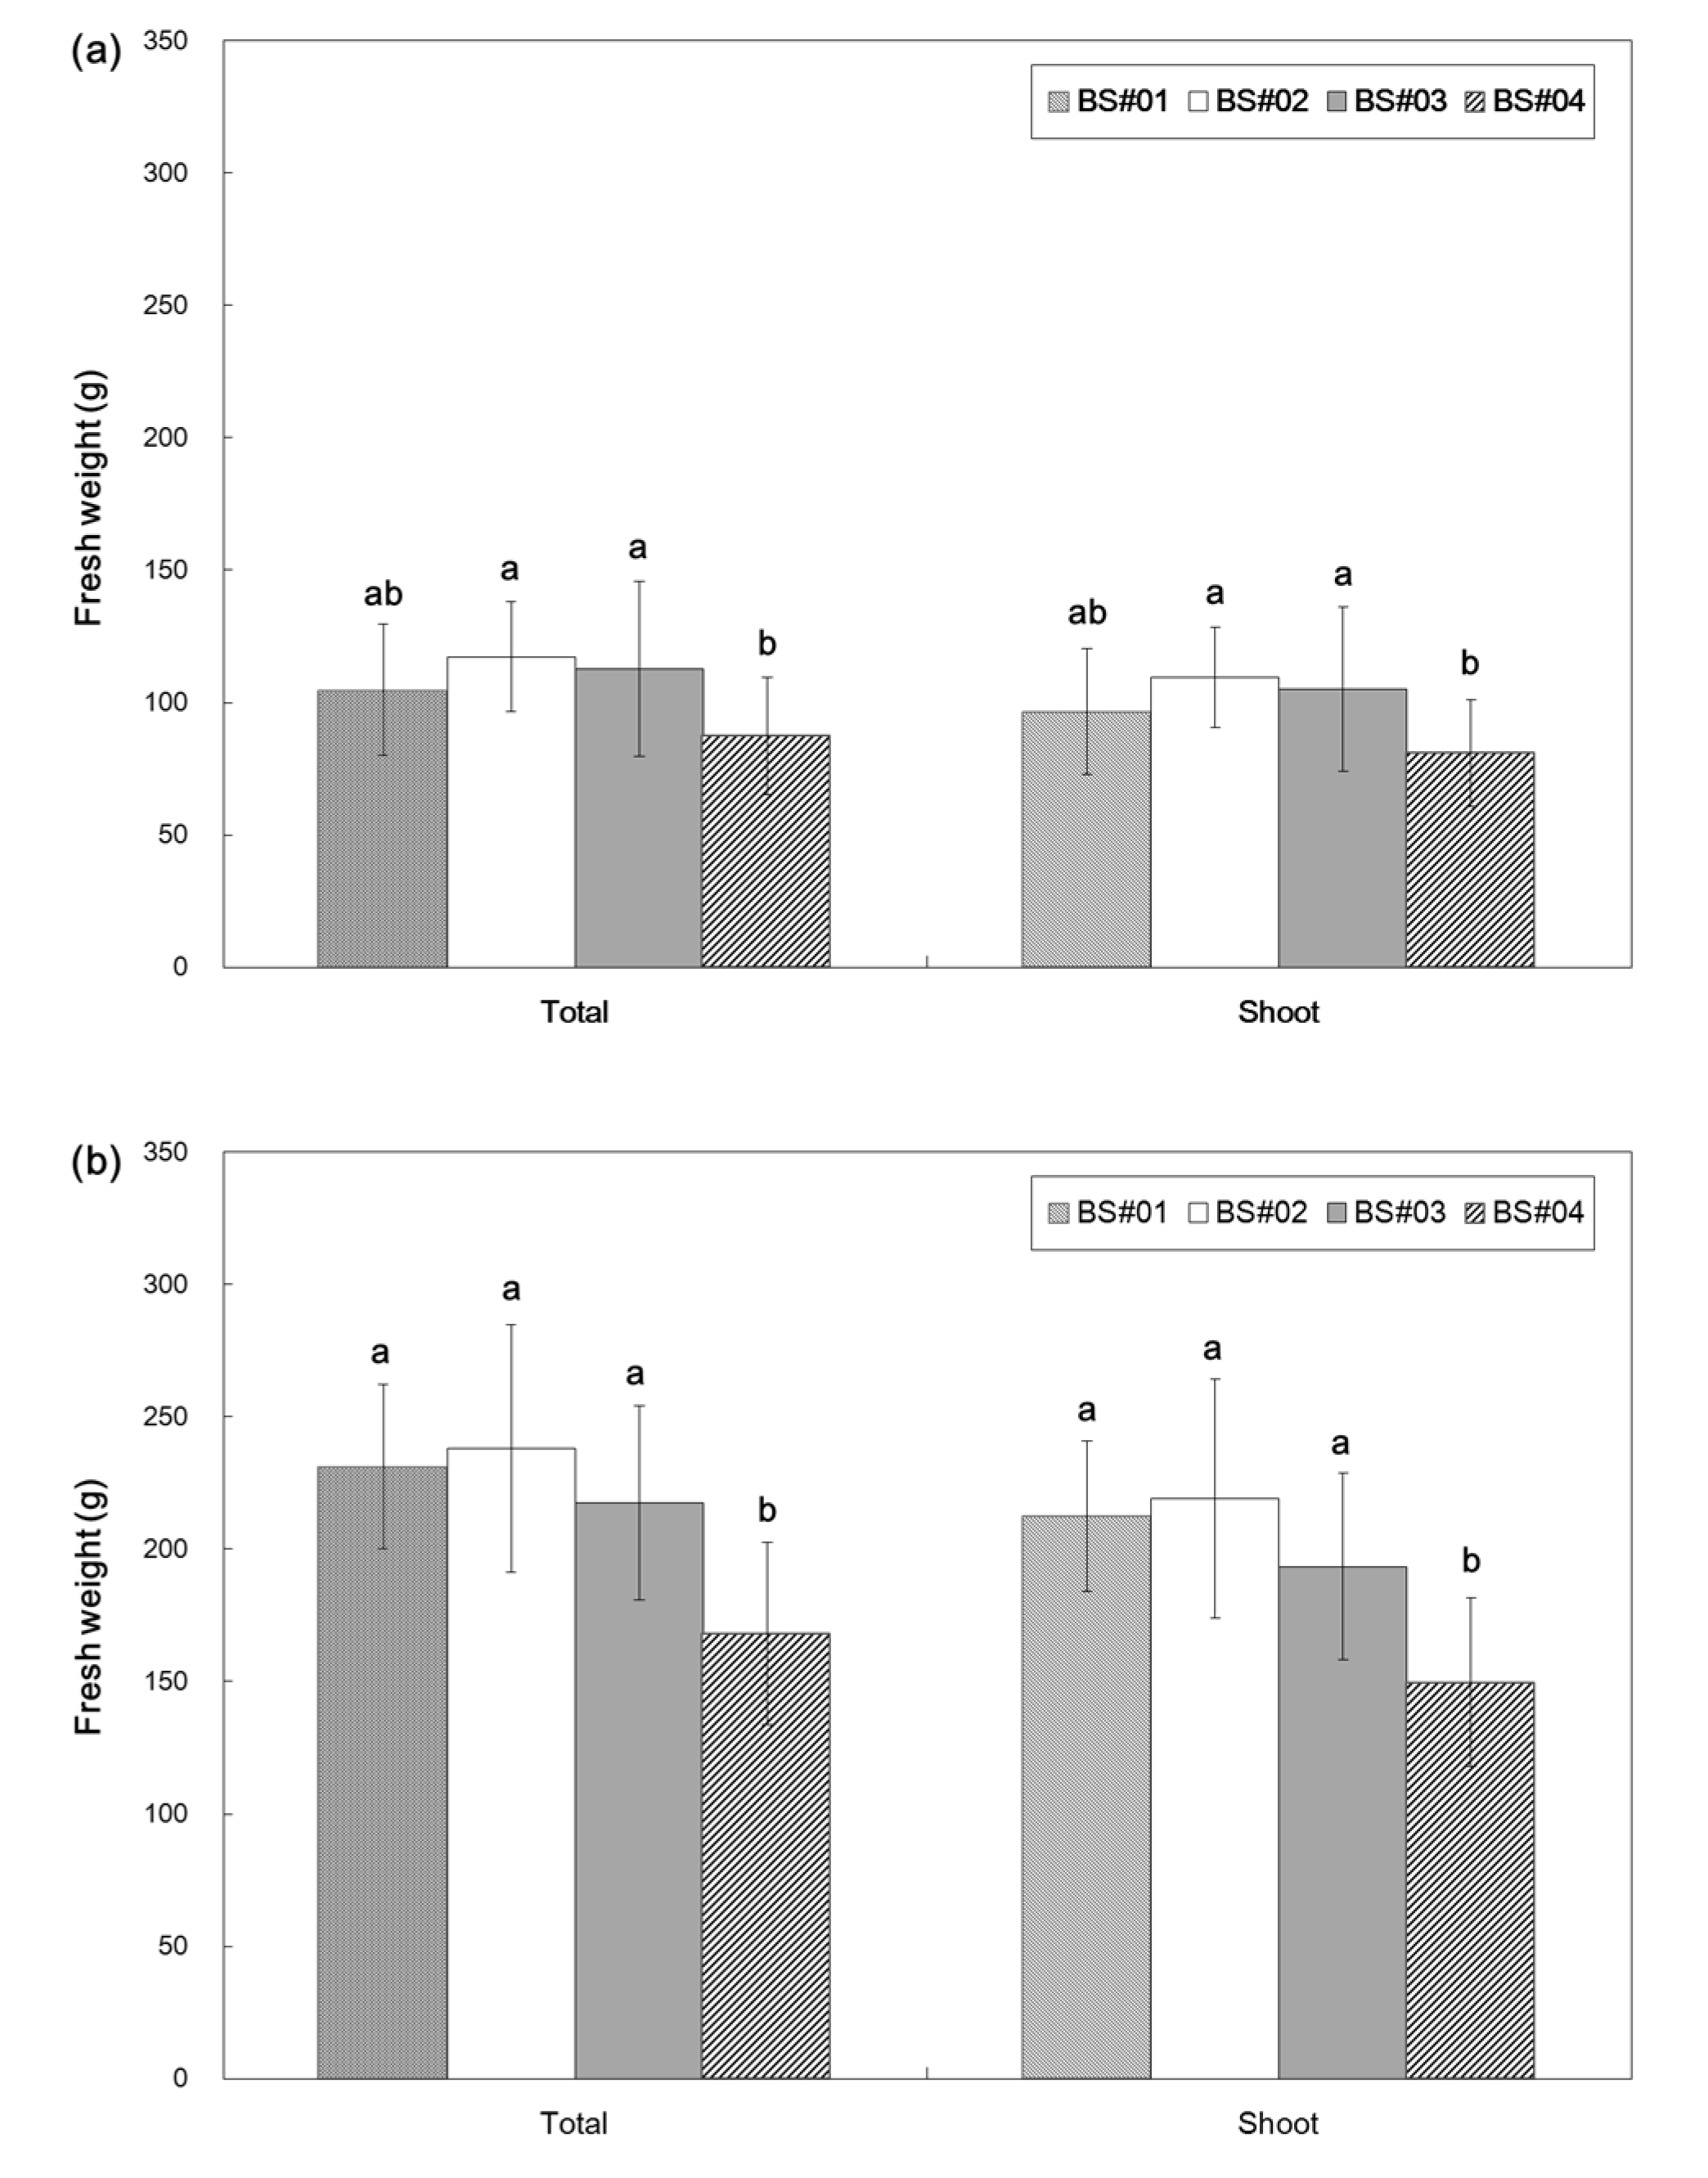
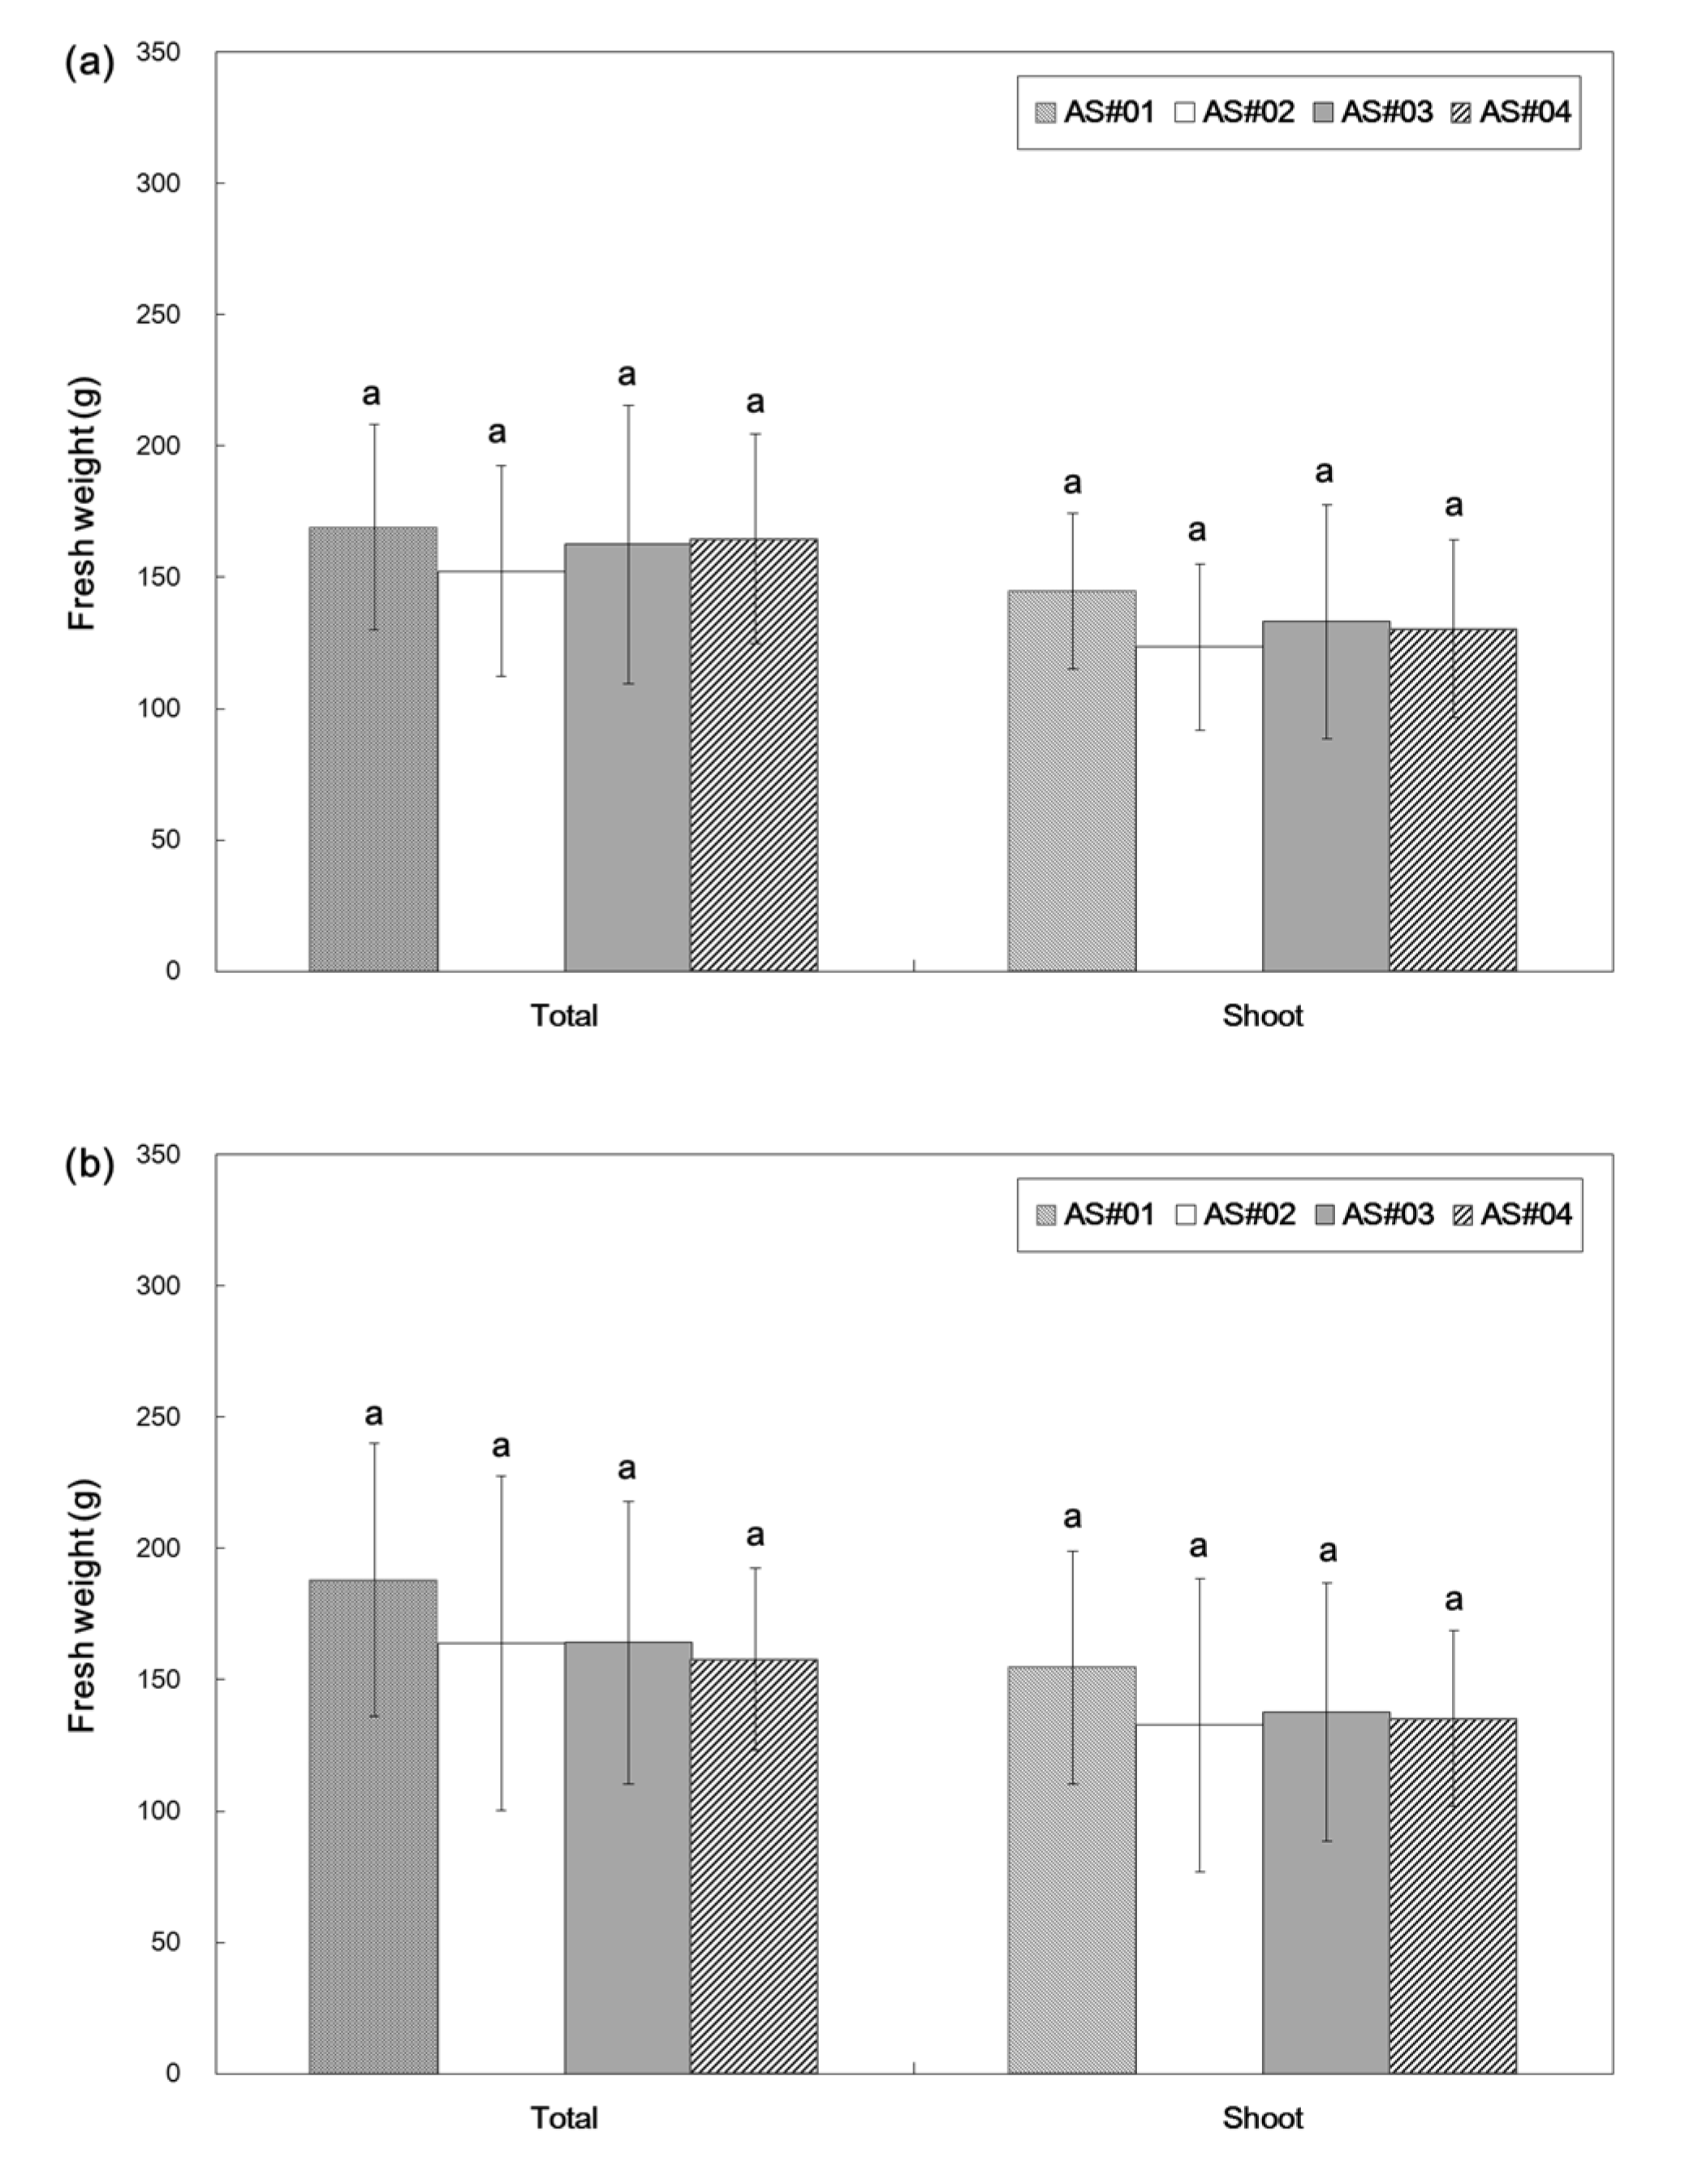
3.3. Lettuce Growth
3.4. Lettuce Yield
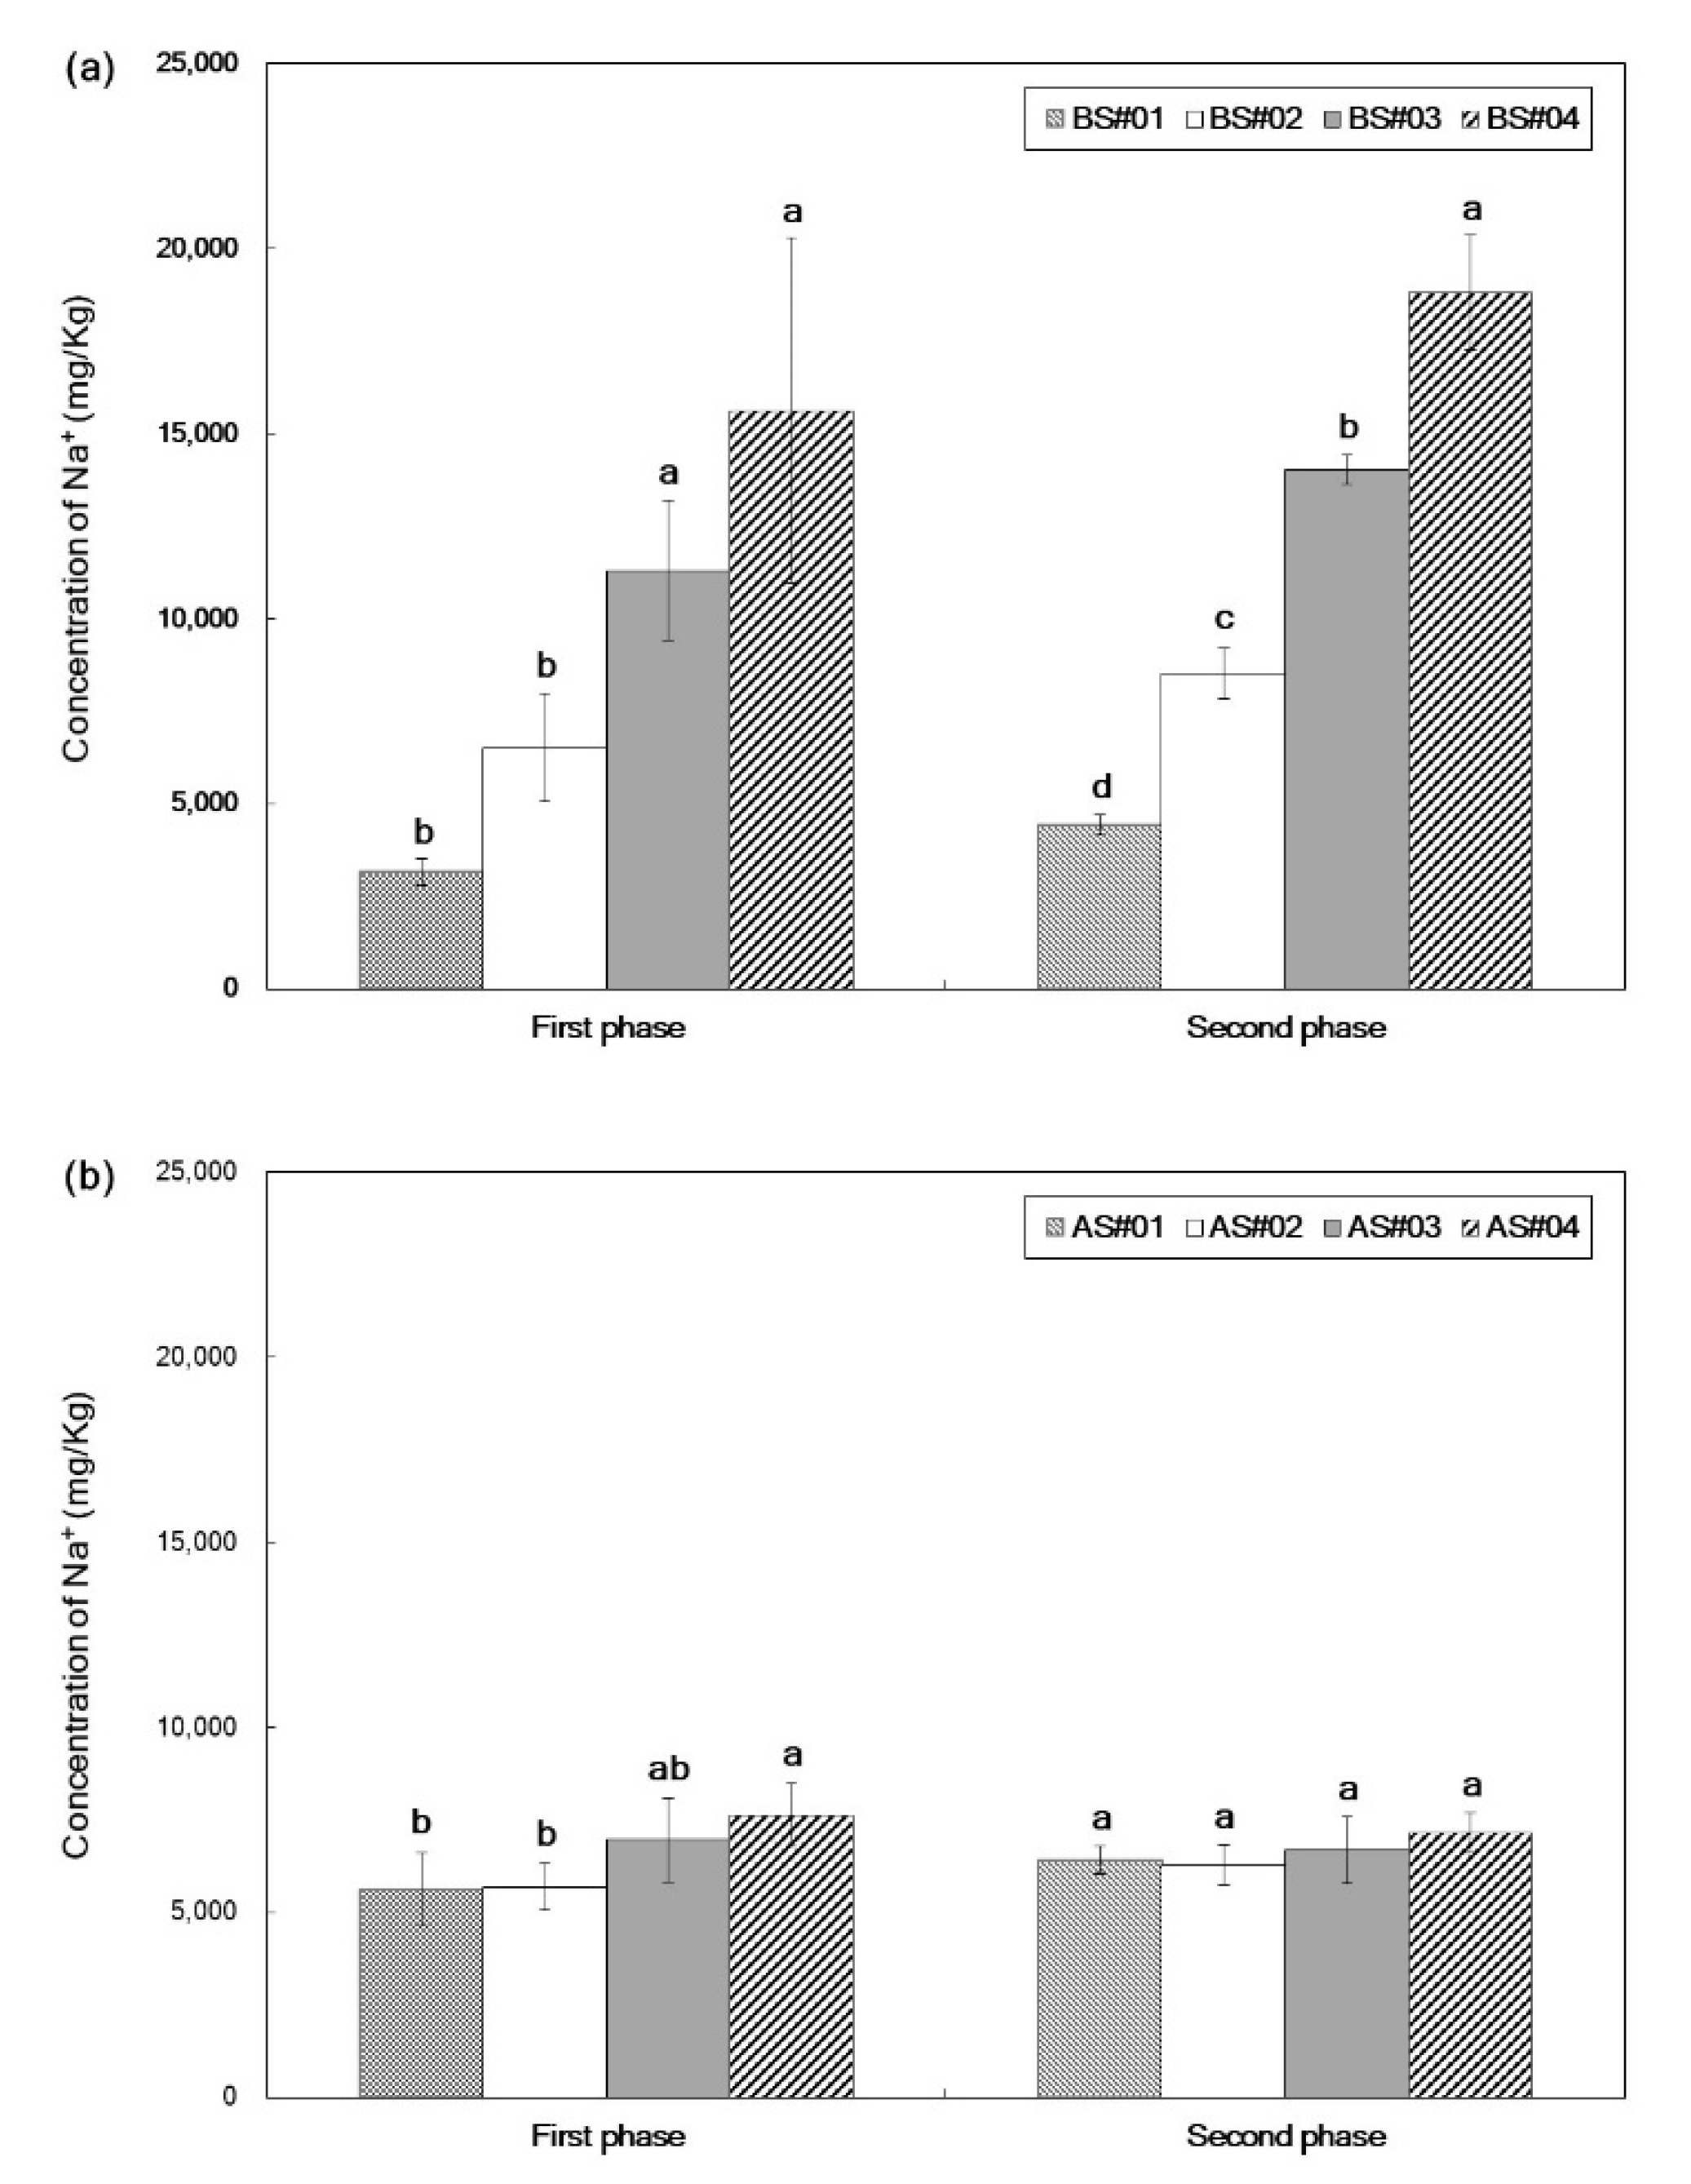
3.5. Sodium Accumulation in Lettuce Leaves
4. Conclusions
Author Contributions
Funding
Conflicts of Interest
References
- Ben-Gal, A.; Yermiyahu, U.; Cohen, S. Fertilization and blending alternatives for irrigation with desalinated water. J. Environ. Qual. 2009, 38, 529–536. [Google Scholar] [CrossRef] [PubMed]
- Birnhack, L.; Shlesinger, N.; Lahav, O. A cost effective method for improving the quality of inland desalinated brackish water destined for agricultural irrigation. Desalination 2010, 262, 152–160. [Google Scholar] [CrossRef]
- Barron, O.; Ali, R.; Hodgson, G.; Smith, D.; Qureshi, E.; McFarlane, D.; Campos, E.; Zarzo, D. Feasibility assessment of desalination application in Australian traditional agriculture. Desalination 2015, 364, 33–45. [Google Scholar] [CrossRef]
- Silber, A.; Israeli, Y.; Elingold, I.; Levi, M.; Levkovitch, I.; Russo, D.; Assouline, S. Irrigation with desalinated water: A step toward increasing water saving and crop yields. Water Resour. Res. 2015, 51, 450–464. [Google Scholar] [CrossRef]
- Yermiyahu, U.; Tal, A.; Ben-Gal, A.; Bar-Tal, A.; Tarchitzky, J.; Lahav, O. Rethinking desalinated water quality and agriculture. Science 2007, 318, 920–921. [Google Scholar] [CrossRef] [PubMed]
- Ministry of Agriculture, Food and Rural Affairs (MAFRA). Agriculture, Food, and Rural Affairs Statistics Yearbook; Ministry of Agriculture, Food and Rural Affairs: Sejong, Korea, 2015.
- Nam, W.H.; Hayes, M.J.; Svoboda, M.D.; Tadesse, T. Drought hazard assessment in the context of climate change for South Korea. Agric. Water Manag. 2015, 160, 106–117. [Google Scholar] [CrossRef]
- Ghermandi, A.; Messalem, R. The advantages of NF desalination of brackish water for sustainable irrigation: The case of the Araba Valley in Israel. Desalin. Water Treat. 2009, 10, 101–107. [Google Scholar] [CrossRef]
- Plaut, Z.; Edelstein, M.; Ben-Hur, M. Overcoming salinity barriers to crop production using traditional methods. Crit. Rev. Plant Sci. 2015, 32, 250–291. [Google Scholar] [CrossRef]
- Atzori, G.; Mancuso, S.; Masi, E. Seawater potential use in soilless culture: A review. Sci. Hortic. 2019, 249, 199–207. [Google Scholar] [CrossRef]
- Turhan, A.; Kuscu, H.; Ozmen, N.; Serbeci, M.S.; Demir, A.O. Effect of different concentrations of diluted seawater on yield and quality of lettuce. Chilean J. Agric. Res. 2014, 74, 111–116. [Google Scholar] [CrossRef]
- Urbano, V.R.; Mendonça, T.G.; Bastos, R.G.; Souza, C.F. Effects of treated wastewater irrigation on soil properties and lettuce yield. Agric. Water Manag. 2017, 181, 108–115. [Google Scholar] [CrossRef]
- Carvalho, R.S.C.; Bastos, R.G.; Souza, C.F. Influence of the use of wastewater on nutrient absorption and production of lettuce grown in a hydroponic system. Agric. Water Manag. 2018, 203, 311–321. [Google Scholar] [CrossRef]
- Maestre-Valero, J.F.; Gonzalez-Ortega, M.J.; Martínez-Álvarez, V.; Gallego-Lira, B.; Conesa-Jodar, F.J.; Martin-Gorriz, B. Revaluing the nutrition potential of reclaimed water for irrigation in southeastern Spain. Agric. Water Manag. 2019, 218, 174–181. [Google Scholar] [CrossRef]
- Kim, H.K.; Jeong, H.; Jeon, J.; Bae, S. Effects of irrigation with saline water on crop growth and yield in greenhouse cultivation. Water 2016, 8, 127. [Google Scholar] [CrossRef]
- Mass, E.V.; Grattan, S.R. Crop yields as affected by salinity. In Agricultural Drainage, Agronomy Monograph 38; Skaggs, R.W., Van Schilfgaarde, J., Eds.; American Society of Agronomy, Crop Science Society of America, Soil Science Society of America: Madison, WI, USA, 1999; pp. 55–108. [Google Scholar]
- American Public Health Association (APHA). Standard Methods for the Examination of Water and Wastewater, 19th ed.; American Public Health Association: Washington, DC, USA, 1995. [Google Scholar]
- Chapman, H.D.; Pratt, P.F. Methods of Analysis for Soils, Plants and Waters; University California, Berkeley: Berkeley, CA, USA, 1961. [Google Scholar]
- Martínez-Alvarez, V.; González-Ortega, M.J.; Martin-Gorriz, B.; Soto-García, M.; Maestre-Valero, J.F. The use of desalinated seawater for crop irrigation in the Segura River Basin (south-eastern Spain). Desalination 2017, 422, 153–164. [Google Scholar] [CrossRef]
- Ayers, R.S.; Westcot, D.W. Water Quality for Agriculture, FAO Irrigation and Drainage Paper 29; Food and Agriculture Organization of the United Nations: Rome, Italy, 1985; Available online: http://www.fao.org/docrep/003/t0234e/t0234e00.htm (accessed on 10 June 2019).
- Martínez-Alvarez, V.; Martin-Gorriz, B.; Soto-García, M. Seawater desalination for crop irrigation—A review of current experiences and revealed key issues. Desalination 2016, 381, 58–70. [Google Scholar] [CrossRef]
- Andriolo, J.L.; da Luz, G.L.; Witter, M.H.; Godori, R.S.; Barros, G.T.; Bortolotto, O.C. Growth and yield of lettuce plants under salinity. Hort. Brazil. 2005, 23, 931–934. [Google Scholar] [CrossRef]
- Ünlükara, A.; Cemek, B.; Karaman, S.; Erşahin, S. Response of lettuce (Lactuca sativa var. crispa) to salinity of irrigation water. N. Z. J. Crop Hortic. Sci. 2008, 36, 265–273. [Google Scholar] [CrossRef]


| Experiment | Planting Date | Harvest Date | Irrigation Amount (L) | Daily Temperature (°C) | Daily Relative Humidity (%) |
|---|---|---|---|---|---|
| Saline water irrigation (BS: before water treatment using the BWD system a) | |||||
| First phase | 20 March 2015 | 10 April 2015 | 100.0 | 30.8 | 18.4 |
| Second phase | 30 April 2015 | 21 May 2015 | 117.5 | 32.2 | 22.8 |
| Desalinated water irrigation (AS: after water treatment using the BWD system) | |||||
| First phase | 17 June 2015 | 8 July 2015 | 97.0 | 30.3 | 40.1 |
| Second phase | 1 September 2015 | 22 September 2015 | 124.0 | 29.8 | 46.1 |
| Experiment | Treatment | pH | ECw | T-N | T-P | Ca2+ | Mg2+ | Na+ | K+ | Cl− | SO42− | SAR | |
|---|---|---|---|---|---|---|---|---|---|---|---|---|---|
| (1:5) | (dS m−1) | (mg L−1) | |||||||||||
| Saline | First phase | BS#01 | 7.9a | 0.31d | 4.55a | 0.003a | 36.07a | 6.29a | 9.89d | 2.09a | 23.1d | 11.9a | 0.40d |
| BS#02 | 7.9a | 0.86c | 4.54a | 0.004a | 36.16a | 6.31a | 106.05c | 2.10a | 175.7c | 11.9a | 4.28c | ||
| BS#03 | 7.9a | 1.99b | 4.52a | 0.005a | 36.26a | 6.33a | 310.64b | 2.13a | 516.1b | 11.9a | 12.52b | ||
| BS#04 | 7.9a | 3.14a | 4.56a | 0.002a | 36.23a | 6.32a | 520.92a | 2.10a | 842.2a | 11.9a | 21.00a | ||
| Second phase | BS#01 | 8.2a | 0.24d | 3.80a | 0.004a | 29.54b | 5.29a | 9.68d | 2.10a | 18.8d | 10.5a | 0.43d | |
| BS#02 | 8.1a | 0.90c | 3.83a | 0.003a | 29.84a | 5.33a | 142.48c | 2.10a | 220.4c | 10.5a | 6.31c | ||
| BS#03 | 8.0a | 2.10b | 3.88a | 0.005a | 29.99a | 5.36a | 398.94b | 2.17a | 613.8b | 10.6a | 17.63b | ||
| BS#04 | 8.0a | 3.41a | 3.84a | 0.001a | 30.02a | 5.37a | 686.04a | 2.22a | 1059.0a | 10.6a | 30.29a | ||
| Desalinated | First phase | AS#01 | 7.9a | 0.28a | 2.85a | 0.004a | 31.12a | 5.55a | 8.86b | 1.83a | 15.8ab | 10.6a | 0.38b |
| AS#02 | 6.7b | 0.02d | 0.24c | 0.003a | 0.01b | 0.01b | 2.97b | 0.28b | 2.9c | ND | 5.02ab | ||
| AS#03 | 6.6b | 0.05c | 0.33bc | 0.004a | 0.05b | 0.01b | 8.49b | 0.26b | 11.0.bc | ND | 9.59a | ||
| AS#04 | 6.6b | 0.11b | 0.41b | ND | 0.14b | 0.02b | 16.88a | 0.45b | 24.3a | ND | 12.23a | ||
| Second phase | AS#01 | 8.7a | 0.28a | 2.87a | ND | 23.37a | 5.87a | 9.99b | 1.80a | 16.3ab | 10.9a | 0.47b | |
| AS#02 | 8.0a | 0.02d | 0.21b | ND | 0.01b | 0.01b | 3.03c | 0.02b | 3.5c | ND | 5.12ab | ||
| AS#03 | 8.0a | 0.06c | 0.33b | ND | 0.04b | 0.01b | 10.28b | 0.05b | 12.8b | ND | 13.18a | ||
| AS#04 | 8.1a | 0.10b | 0.36b | ND | 0.09b | 0.01b | 16.15a | 0.05b | 21.7a | ND | 13.67a | ||
| Experiment | Treatment | pH | ECe | CEC | O.M. | T-N | T-P | P2O5 | Ca2+ | Mg2+ | Na+ | K+ | SAR | |
|---|---|---|---|---|---|---|---|---|---|---|---|---|---|---|
| (1:5) | (dS m−1) | (cmol kg−1) | (%) | (%) | (mg kg−1) | |||||||||
| Initial soil | 5.6 | 8.5 | 73.20 | 66.5 | 0.60 | 1676.04 | 1521.47 | 4534.83 | 1935.54 | 1042.14 | 5478.84 | 3.26 | ||
| Saline | 1st | BS#01 | 5.4 | 15.4 | 72.02 | 38.6 | 0.52 | 1288.19 | 1275.72 | 4632.07 | 1482.61 | 1001.26 | 4402.62 | 3.28 |
| BS#02 | 5.3 | 19.1 | 76.49 | 51.9 | 0.66 | 1539.14 | 1239.64 | 5045.08 | 1478.67 | 1307.24 | 4309.38 | 4.16 | ||
| BS#03 | 5.4 | 20.6 | 72.21 | 45.6 | 0.60 | 1548.49 | 1158.85 | 4230.28 | 1255.74 | 1861.18 | 5691.48 | 6.45 | ||
| BS#04 | 5.4 | 25.0 | 69.46 | 53.0 | 0.68 | 1542.49 | 1311.66 | 4562.05 | 1382.54 | 2112.87 | 4503.81 | 7.03 | ||
| 2nd | BS#01 | 5.0 | 14.3 | 62.98 | 58.6 | 0.58 | 1269.38 | 873.23 | 5712.24 | 1562.14 | 783.95 | 2910.64 | 2.37 | |
| BS#02 | 5.2 | 15.1 | 72.31 | 64.4 | 0.63 | 1032.37 | 593.57 | 4749.03 | 1245.23 | 1434.42 | 3227.31 | 4.79 | ||
| BS#03 | 5.1 | 30.8 | 74.13 | 65.2 | 0.60 | 934.71 | 768.36 | 6078.54 | 1594.83 | 5482.92 | 3033.99 | 16.17 | ||
| BS#04 | 5.0 | 34.8 | 75.31 | 66.2 | 0.55 | 955.22 | 809.55 | 5562.00 | 1400.86 | 8225.07 | 2785.87 | 25.52 | ||
| Desalinated | 1st | AS#01 | 5.7 | 13.8 | 65.78 | 62.3 | 0.60 | 1317.75 | 958.96 | 6475.56 | 1739.61 | 1254.90 | 3465.75 | 3.57 |
| AS#02 | 5.6 | 18.3 | 67.10 | 62.3 | 0.77 | 1621.00 | 1380.52 | 6830.55 | 1945.71 | 1666.51 | 4717.29 | 4.58 | ||
| AS#03 | 5.8 | 13.7 | 77.71 | 56.9 | 0.64 | 1119.45 | 844.55 | 6737.94 | 1750.41 | 1164.33 | 3548.91 | 3.27 | ||
| AS#04 | 5.6 | 11.4 | 61.36 | 58.8 | 0.65 | 883.20 | 498.29 | 6996.66 | 1788.36 | 1176.33 | 3111.33 | 3.25 | ||
| 2nd | AS#01 | 6.0 | 9.7 | 65.83 | 65.4 | 0.71 | 907.93 | 497.39 | 8161.89 | 2163.45 | 1107.33 | 2676.24 | 2.81 | |
| AS#02 | 5.8 | 10.8 | 79.78 | 65.1 | 0.67 | 1022.57 | 668.31 | 6551.91 | 1696.20 | 869.55 | 2490.48 | 2.48 | ||
| AS#03 | 5.9 | 8.5 | 75.90 | 66.7 | 0.63 | 762.93 | 471.04 | 6363.93 | 1584.57 | 781.50 | 2528.16 | 2.27 | ||
| AS#04 | 5.8 | 11.2 | 59.59 | 65.4 | 0.69 | 891.57 | 388.81 | 6587.28 | 1899.66 | 1206.78 | 2830.80 | 3.37 | ||
© 2020 by the authors. Licensee MDPI, Basel, Switzerland. This article is an open access article distributed under the terms and conditions of the Creative Commons Attribution (CC BY) license (http://creativecommons.org/licenses/by/4.0/).
Share and Cite
Kim, H.; Kim, S.; Jeon, J.; Jeong, H. Effects of Irrigation with Desalinated Water on Lettuce Grown under Greenhouse in South Korea. Appl. Sci. 2020, 10, 2207. https://doi.org/10.3390/app10072207
Kim H, Kim S, Jeon J, Jeong H. Effects of Irrigation with Desalinated Water on Lettuce Grown under Greenhouse in South Korea. Applied Sciences. 2020; 10(7):2207. https://doi.org/10.3390/app10072207
Chicago/Turabian StyleKim, Hakkwan, Soojin Kim, Jihye Jeon, and Hanseok Jeong. 2020. "Effects of Irrigation with Desalinated Water on Lettuce Grown under Greenhouse in South Korea" Applied Sciences 10, no. 7: 2207. https://doi.org/10.3390/app10072207
APA StyleKim, H., Kim, S., Jeon, J., & Jeong, H. (2020). Effects of Irrigation with Desalinated Water on Lettuce Grown under Greenhouse in South Korea. Applied Sciences, 10(7), 2207. https://doi.org/10.3390/app10072207