Article

Behavior and Performance of BIM Users in a Collaborative Work Environment

by
Eric Forcael
1,
Alejandro Martínez-Rocamora
2,*,
Javier Sepúlveda-Morales
3,
Rodrigo García-Alvarado
4,
Alberto Nope-Bernal
5 and
Francisco Leighton
6
1
GeDIE, Department of Civil and Environmental Engineering, Faculty of Engineering, Universidad Del Bío-Bío, Av. Collao 1202, Concepción, Chile
2
ArDiTec, Department of Architectural Constructions II, IUACC, Higher Technical School of Building Engineering, Universidad de Sevilla, Av. Reina Mercedes 4-a, 41012 Sevilla, Spain
3
Integrated Project Design Lab., Department of Civil and Environmental Engineering, Faculty of Engineering, Universidad Del Bío-Bío, Av. Collao 1202, Concepción, Chile
4
GeDIE, Department of Architectural Design and Theory, Faculty of Architecture, Construction and Design, Universidad Del Bío-Bío, Av. Collao 1202, Concepción, Chile
5
GeDIE, Faculty of Architecture, Universidad La Gran Colombia, Carrera 6, Cundinamarca 12B-40, Colombia
6
Department of Civil and Environmental Engineering, Faculty of Engineering, Universidad Del Bío-Bío, Av. Collao 1202, Concepción, Chile
*
Author to whom correspondence should be addressed.
Appl. Sci. 2020, 10(6), 2199; https://doi.org/10.3390/app10062199
Submission received: 29 January 2020 / Revised: 17 February 2020 / Accepted: 3 March 2020 / Published: 24 March 2020
(This article belongs to the Special Issue BIM in the Construction Industry)

Abstract

:

Featured Application

This research has specific applications in architecture firms developing Building Information Modeling (BIM) projects where coordinators and managers are willing to analyze behavioral patterns and efficiency of their modelers and to identify further training needs and opportunities to increase their performance.

Abstract

Collaborative work in Building Information Modeling (BIM) projects is frequently understood as the interaction of modelers in an asynchronous way through modification requests or via e-mail/telephone. However, alternative work methodologies based on creating a common and synchronous environment allow solving issues instantaneously during the design process. This study aimed to analyze the behavior and performance of BIM users with different specialties who were subjected to an experimental exercise in a collaborative environment. For this purpose, a process was devised to collect, sort, and select the data from the log files generated by the BIM software. A timeline of the experiment was populated with data on the intensity and types of commands used by each specialist, which allowed determining behavioral patterns, preferred commands, indicators of their experience, further training needs, and possible strategies for improving the team’s performance. In the experiment, the mechanical designer’s performance was 49% and the rest approximately 64%, with respect to that of the architect. An average rate of 1.66 necessary or auxiliary commands for each contributory command was detected. The average performance was 200–400 commands per hour, which intensified by the end of the experiment. Further training needs were detected for the plumbing designer to reduce the use of backwards commands. Conversely, the electrical designer showed a positive evolution regarding this aspect during the experiment. The analysis methods here described become useful for the aforementioned purposes. Nevertheless, combinations with methods from existing research might improve the outcomes and therefore the specificity of recommendations.

1. Introduction

With the advance of technology, improvements in industry are generally observed as an increase in productivity. However, the architecture, engineering and construction (AEC) industry has low productivity, with fragmentation of activities, lack of added-value and weak standardization [1]. This is partly due to limited collaboration among the participants in this sector. In this context, Building Information Modeling (BIM) arises as a collaborative methodology to facilitate information transfer between the various specialties involved in the design process of a construction project, thus improving decision-making in the early stages [2]. This methodology enables users to create parametric models based on multidimensional objects, which are a tool for managing construction projects throughout their life cycle [3,4,5,6].
In recent years, the construction sector has experienced changes in its traditional work system with the introduction of BIM-based technological solutions. This phenomenon is generating a revolution in building work practices, which both poses a challenge and provides an opportunity to achieve the objectives of a given project [7]. Without forgetting BIM’s numerous advantages, it is important to point out that there are important challenges to be faced regarding the many disciplines that comprise construction companies, who must prepare to adopt the concept of BIM [8,9].
Despite the great potential that BIM presents for the improvement of collaboration between the parties involved [9,10], some difficulties have been detected in its successful implementation. For this reason, in recent years numerous studies have analyzed the gap between the construction industry and the introduction of Information and Communication Technologies (ICT). Since this problem affects the performance of the entire process, there is a need to diagnose the cause of current difficulties [11]. From previous studies, Mutai [12] associates the success of BIM with the BIM skills and training demonstrated by a project team, which are determined by their collaboration. In addition, Azhar [13] indicates that collaboration between different disciplines and users is essential for the successful implementation of BIM. Therefore, the need arises to study the collaborative behavior of BIM users in more detail.
When used properly, BIM promises to improve all the processes in the different stages of design and construction, reducing the quantity and severity of problems associated with traditional practice [13], and avoiding nearly all communication difficulties related to information transfer [14]. However, to achieve this transition process, users face various challenges, mainly derived from the collaboration required between a variety of specialists in the early stages: architects, engineers, analysts and others, in conjunction with the client, which is lacking in the current design process [15]. Furthermore, collaboration in BIM projects usually occurs in an asynchronous way, with each of the specialists working in their respective offices and communicating whether via e-mail or modification requests on the central model. This frequently causes problems between the specialists, which eventually translate into increased redesign time and costs [16]. It is important to notice that BIM is directly driven by human activities [17] and software merely generates a platform that makes this encounter possible.
Research on collaborative work in BIM has made it possible to detect the possibilities it has to offer and also the difficulties that arise from it. However, a methodology has not been established yet to evaluate the behaviors and performance of the different participants of a BIM project, which would allow developing more effective group work procedures. In order to successfully implement this methodology, it is necessary to train existing work teams in the development of collaboration skills. To that end, collaborative work environments have emerged as a suitable means to identify those skills that each specialist should improve, and therefore as a way to design personalized training.
In this research, the aim was to analyze the behavior and performance of diverse profiles of BIM modelers during an experimental exercise of BIM collaborative work. To that end, a methodology was designed and its potential application was demonstrated for their analysis based on the data generated by a BIM software in its log files. In that experiment, users worked under an architect’s leadership in the same physical environment with the aim of accelerating the design process and improving the quality of results [18,19]. This work methodology is based on the hypothesis that a better understanding of the performance and activities among participants can provide ideas on how to increase their efficiency, effectiveness, and organization [20], as well as the interactions between them that can help to identify bad practices and further training needs.
In the next section, background is provided on collaborative work environments and the study of BIM users’ behavior through the analysis of log files generated by the software. In Section 3, the design of the experiment and the case study are presented. The methodology for studying the participants’ behavior and performance is organized following a sequence of data collection, processing, and analysis. Results of the identification of relevant actions that contribute to generating a model of parameterized design and the analysis of information exchanges between the project developers are presented and discussed in Section 4, based on a comparison of the data obtained from the work carried out by the different specialists involved. These results are discussed and compared to other findings from similar studies based on BIM log mining in Section 5, where future research directions are also highlighted.

2. Background

2.1. Collaborative Work Environments

A collaborative work environment is referred to in this study as a common physical room with the optimal conditions to develop the project, where a group of various professionals work simultaneously in order to allow direct and synchronous interactions between them [18,19]. In this environment, there are two communication networks: the human network that is based on the interactions between the individuals; and the electronic network that computers use to exchange information. While virtual collaboration experiences based on cloud systems do exist and are more frequent in the development of BIM projects, physical interaction between the different agents makes it possible to increase the efficiency of the design process and results in quicker problem-solving and decision-making.
The organization of a collaborative work environment is a complex process in which diverse participants must adapt their behavior to the peculiarities of this new methodology, selectively monitor information, and continuously give feedback in order to solve problems, improve project design, and finally, decrease the associated costs. In these work environments, work is usually organized into one to three sessions per week; teams consist of a leader and engineers specialized in design sub-areas; each designer is allowed to work on their design and move freely around the room in search of the information needed to solve their problems; and when an difficulty pertains to the whole team, the session is stopped, and the entire group focuses on resolving the problem [21].
Due to its great success, in recent years, the AEC industry has adapted and modified this methodology. In this case, the sessions are divided into cycles, which should not last more than two weeks depending on the phase of the project [21]. The work teams are comprised of a leader, designers, builders, the client, and the suppliers, with some or all of the parties participating, depending on which are necessary for each cycle. Despite high interest in the use of this methodology with BIM projects, there is limited evidence regarding the behavior and performance of BIM users in these work environments.

2.2. BIM Users’ Behavior and Performance and BIM Log Files

One key factor in the study of BIM users’ behavior and performance in a collaborative work environment is the identification and development of appropriate collaboration models to improve user performance rates [22]. However, this area of research has mainly focused on using data from BIM logs to improve collaborative, design, and non-design practices [23,24,25].
Autodesk Revit is a BIM software with a set of tools to coordinate the different disciplines in a project, thus minimizing the risk of errors in execution and decreasing production times and associated costs [10]. This software automatically generates log files as a database in which all the relevant information is recorded, from the technical specifications of the computer to the commands executed by the user, including when and for how long the program was used. Due to the huge amount of data they contain, reviewing these log files is a considerably complex and time-consuming task; consequently, they are frequently only used to investigate possible failures in the software or the computer in use. However, lately, new and innovative uses are being given to these sources of valuable information.
For example, Yarmohammadi et al. [26] analyzed the content of log files from an architecture and design firm to investigate the presence of design patterns and to characterize the performance of BIM modelers. To that end, they searched the log files of different modelers, identified patterns of at least three sequential commands, and quantified the time it took these modelers to execute them, thus determining both individual work behavior and performance of those modelers.
Zhang and Ashuri [22] developed a systematic procedure for extracting data from BIM log files in order to monitor and measure productivity in the design process. They used a set of techniques known as ‘process mining’, which is usually divided into three branches according to the objective: (1) ‘process discovery’, (2) ‘process conformance’, and (3) ‘process improvement’ [27]. Of these, ‘process discovery’, which involves using saved records as an input to generate a process model, is the most widely employed [28]. In their case, Zhang and Ashuri [22] presented a novel methodology that used these records to capture and model collaboration patterns between designers and generated social networks according to their behavior. To do this, they used the social network analysis (SNA) metric-type 2, which, in a design context, measures the number of times two designers interact with each other to contribute to the same project.
In a second study, Zhang et al. [23] focused on identifying patterns in designer behavior and found that in general there are three commands of greatest use, which vary among the different designers. It was also possible to measure which patterns were the most efficient when working on a project. In this research, the pattern discovery process focused on the description of user operations as represented by executed commands.
In addition, Oraee et al. [24] developed a conceptual model of collaboration in BIM through a literature review in order to identify collective behavior. And Kouhestani and Nik-Bakht [25] studied event logs archived during the design process of building projects using IFC (Industry Foundation Classes) files, discovering different approaches to support BIM management.
Finally, Pan and Zhang [29] applied fuzzy clustering methods to explore a massive amount of BIM log files from an international architecture design firm in order to identify productivity patterns in the modelers’ behavior. They organized the process in three main stages: data preparation, clustering, and knowledge discovery. The analysis at individual level revealed specific time periods where the modelers showed better performance. The application of team-level clustering made it possible to evaluate if grouping designers with similar design productivity would provide better results for the firm.

3. Materials and Methods

3.1. Design of the Experiment

To implement this experiment for the study of collaborative behavior and performance of BIM modelers, it was first necessary to determine the technologies the different designers would use, in addition to organizing their participation in the case study. This process was based on an initial technical characterization of the project that identified the design and construction conditions for the various disciplines. This analysis is essential for the development of successful BIM-based projects since it facilitates understanding and coordination of the various roles and their roles in the design process.
The participants in this experiment included a group of three civil engineers, a building engineer, and an architect who also had a coordination role. Each participant had received previous training in Autodesk Revit and collaborative work with different roles. The participants were junior professionals aged between 25 and 35 years old with an average experience of three years, except for the architect and coordinator, who had 10 years of experience in architecture firms. As shown in Figure 1, all the designers interacted in a common work environment, supported by modeling technologies to carry out the work. The work was done using a central file shared through a local network, and a local copy for each specialist. Access was granted to the central file to save or to obtain the data of the other members in real time through Autodesk Revit´s synchronization features.
The activity was organized into 18 3-h sessions conducted over six weeks, in which the participants worked together on the modeling of a two-story building for university classrooms (see Figure 2) based on previously existing plans of the project. The participants attended to all the sessions, with the exceptions of the mechanical and the electrical specialists, who were absent in three and two entire sessions, respectively, and took several long pauses throughout the experiment. The parts of the project were first distributed among the disciplines in sub-projects (namely ‘worksets’ in the selected BIM software) in order to organize permissions to modify objects. The experiment was performed in a collaborative work environment so that the participants were able to directly compare, evaluate, and solve problems due to clashes between models—whether that be the coincidence of two elements in the same physical space or inconsistencies in the design detected by the program or the specialists themselves-by generating a continuous exchange of information between them.

3.2. Collection and Processing of Data from Log Files

Subsequently, the activities performed by each specialist were analyzed through the content of the log files, which also allowed identifying certain behavioral patterns regarding pauses in modeling activity or dependencies among the various specialties in the design process. Autodesk Revit records activities in a text file that describes how the designer uses the software [23]. Log files are generated for each session with the corresponding date and time of each action. These files include information about the project name, current user, session, commands used, and computer characteristics (see Figure 3), thus enabling the extraction of information about all the operations performed within the model.
During this experiment, the log files were collected from each computer after the end of each session and subsequently stored and organized into folders per day of work to correctly identify the data corresponding to each session. A session is defined as the set of activities carried out by a user from the moment the BIM software is loaded until the moment it is closed [30].
Data registered in the server generated a large number of files, thereby making it necessary to clean and organize the information to obtain a structured, reliable, and integrated database to study the frequency of execution of each command. These cleaning and organization processes were carried out as follows:
  • Data cleaning: In this first step, a simple program was developed to parse the information from the log files and exclude a large number of records related to the configuration and monitoring of operations, which are not relevant for the characterization of tasks. The result was a text file containing all the commands executed by each user and indicating their ID (command identification code), access route, a short description, and the date and time of execution.
  • Data organization: After the previous data cleaning process, the information was transferred to a spreadsheet and organized into tables for each designer, which made it possible to count the number of executions of each command for an initial analysis.
Additionally, each session was divided into five periods of equal duration in order to generate more data for the analysis of distributions and to better allocate isolated events that might arise related to users’ behavior. Two main categories, contributory and non-contributory commands, with three sub-categories each (described in Table 1), were created to classify the commands executed by each designer, in this way producing a more precise analysis.

3.3. Methods for Analysis

To analyze the behavior and performance of users, the relevance of the commands used by each specialist was studied. First, a preliminary analysis was conducted to detect certain behavioral patterns for each designer based on the overall quantity of executions of each sub-category of commands and the effect that these had on the development of the project. Additionally, the compliance of each designer’s contributions with the Pareto principle (also known as the 80/20 rule) was studied. The Pareto principle states that in any group of elements that contribute to the same effect, a few (~20%) are usually responsible for most of that effect (~80%). Therefore, non-contributory commands were excluded from this analysis.
Pareto charts consisting of a bar graph and a curve were created for each designer. In these charts, the commands are sorted in descending order by their total number of executions and the curve represents the relative frequency of these commands. The Pareto principle, supported by the chart, is a simple visual tool for focusing and analyzing relationships, studying results, and planning for continuous improvement, and has been proven to be valid in numerous situations [31]. Thus, in accordance with the Pareto principle, the number of contributory commands that make up 80% of the total number of executions (relative frequency) should be approximately 20% of the number of different contributory commands executed by a designer.
In order to gain a better understanding of the events occurred during the experiment and their timing, the 18 sessions were divided into five periods each, for a total of 90 periods. This made it possible to detect behavioral patterns, such as pause times, non-modeling activities, and performance metrics, such as modeling intensities-the rate of commands per hour-, as well as training priorities. As a first step, pauses longer than two minutes were quantified, considering that designers frequently stop modeling for a short time to think, to consult other documents, such as standards, books or catalogues, or to solve issues with other designers, given that BIM workflows are known to be hybrid and not solely BIM-based [32], and sometimes they take longer pauses to rest. Therefore, the rate of commands per hour (work intensity) for each specialist in each section was calculated both with respect to real time (the actual duration of the period) and to active time (subtracting pauses longer than two minutes).
Then, the distributions of real-time execution intensities of each command sub-category during the experiment were studied by generating boxplot charts for each designer, which help detecting differences between the types of commands each specialist executed, as well as identifying those modelers with higher collaborative behavior and those applying bad practices and therefore needing further training to improve their performance.
Finally, timelines of the shares of commands of each sub-category executed by the different designers were generated that allow detecting sessions without active modeling participation, excessive shares of non-contributory commands, and evolution of the modeling behavior of each specialist during the experiment, among others.

4. Results

4.1. Preliminary Analysis

In the experiment, each designer worked for approximately 54 h total. The data extracted from the log files were analyzed to evaluate the performance and collaborative behavior of each user, which can be related to the execution of commands from each sub-category in Table 1. In addition, the percentage of use of each contributory command executed was analyzed for all the designers in order to validate the Pareto principle.
The intensity of commands executed by each designer can be considered a confounding indicator in this preliminary analysis since this measurement can alternately demonstrate high efficiency in the use of commands and/or greater experience in the use of the BIM software, or on the contrary, lack of knowledge or lower experience as evidenced by the execution of commands that provide little advance to the project. Therefore, higher performance cannot be inferred from this raw data, and further analysis is required in order to identify those commands actually contributing to the model.
As can be seen in Table 2, while the total number of commands used by the architect was the highest, this designer also executed a great quantity of unnecessary commands, which were nearly all ‘Cancel’ (ESC key). In Autodesk Revit, a designer must use the ESC key twice to exit the current command, although on occasion users push this key more than twice, perhaps while thinking. Although this does not affect their performance, it must not be taken into account as productive work. Conversely, the mechanical designer executed the lowest number of commands, both total and unnecessary, which apparently could indicate a more efficient use of commands, but also lower performance.
As was expected, the architectural designer also stands out with the highest number of geometrical modeling commands, which not only reflects the need to define the building’s spaces and shape, but also the subsequent modifications to improve the design and resolve clashes between models. On the other hand, the plumbing designer executed the highest quantity of non-geometrical modeling commands. Through a deeper analysis of the specific commands executed by this specialist, it was detected that this was mainly due to the definition of numerous family types, creation of schedules, and inclusion of annotations in the model. The architectural and structural designers executed the highest number of collaborative commands, the former significantly more, which was also expected given that these two specialties provide most of the information that mechanical, electrical and plumbing (MEP) specialties require. In return, the three MEP designers supplied a similar amount of information that made it possible to detect and solve clashes between models.
Regarding non-contributory commands, all the specialists executed a large amount of necessary commands. These auxiliary commands, such as those to modify the view configuration or temporarily hide elements, are frequently needed to advance, but do not provide new information or elements to the model. While it has not still been determined what would be an appropriate rate of necessary to contributory commands, in this experiment an average rate of 1.66 necessary commands for each contributory command was detected. Therefore, the data indicate how the specialists rely on the use of auxiliary commands during their modeling process. As was mentioned previously, the architectural designer pushed the ESC key excessively, while the other specialists’ use of unnecessary commands was all similar to one another. Alternately, the architectural designer used the lowest quantity of backwards commands, whilst the plumbing designer executed a large amount of these. This may mean a greater number of corrections, less experience in BIM modeling, and/or bad modeling practices, and therefore a need for further training. However, identifying specific recommendations for improving a modeler’s modeling practices would require an analysis of command execution patterns, which is not within the scope of the present study.
Additionally, the balance between backwards and contributory commands was studied since it can be assumed that these cause opposite effects that essentially cancel each other out. Given that ‘Undo’ commands can affect commands from all the sub-categories including ‘Delete’ commands in the backwards sub-category, they were subtracted proportionally from the quantity of contributory commands. From this examination, it can be inferred that the architectural designer had the most effective modeling behavior, while the mechanical designer presented the lowest performance. These overall results show that the mechanical designer’s performance in the experiment was 49% with respect to that of the architect, while the rest of designers’ was around 64%. This means that, even though the architect used a significant number of unnecessary commands, that designer had the highest performance during the experiment by a significant difference. This excessive use of the ESC key, while considered a bad practice, did not affect his/her performance. However, it could be advisable to address it through further training focused on developing a more fluent modeling process.
In this preliminary analysis, absolute and relative frequencies were obtained for all the commands executed by each designer in order to identify those of preferential use and to check compliance with the Pareto principle. As an example, Table 3 shows the contributory commands most frequently used by the architectural designer, which account for 80% of his/her total contributory command executions. It can be seen that most of these commands are related to geometrical modeling, whether direct commands for creating objects or those for defining sketches that eventually will enable the creation of sketch-based objects. Similar tables for the other four designers are shown in Appendix A, where the close relationship between the commands executed and their corresponding specialty can be observed.
Based on this analysis, the Pareto charts in Figure 4 were produced for each designer, where the horizontal axes show the total number of different contributory commands executed, and the command (in descending order by quantity of executions) with which at least 80% of the contributory command executions is reached. By adopting a simplified assumption whereby each contributory command makes the same contribution to the final product, it can be said that the Pareto principle applies to all the specialists except for the structural designer, who showed a more balanced number of executions of a variety of commands: the 80% threshold was reached with 31.3% of the contributory commands used. Although the architectural and plumbing designers attained 80% with 22% of their contributory commands, this was considered a fair approximation to the Pareto principle. The identification of each designer’s preferred commands can be useful for detecting bad modeling practices or which actions should be given focus in further personalized training.

4.2. Session/Period-Based Analysis

A detailed analysis of the commands executed by each specialist during the different sessions/periods of time of the experiment was carried out according to the methods explained in 
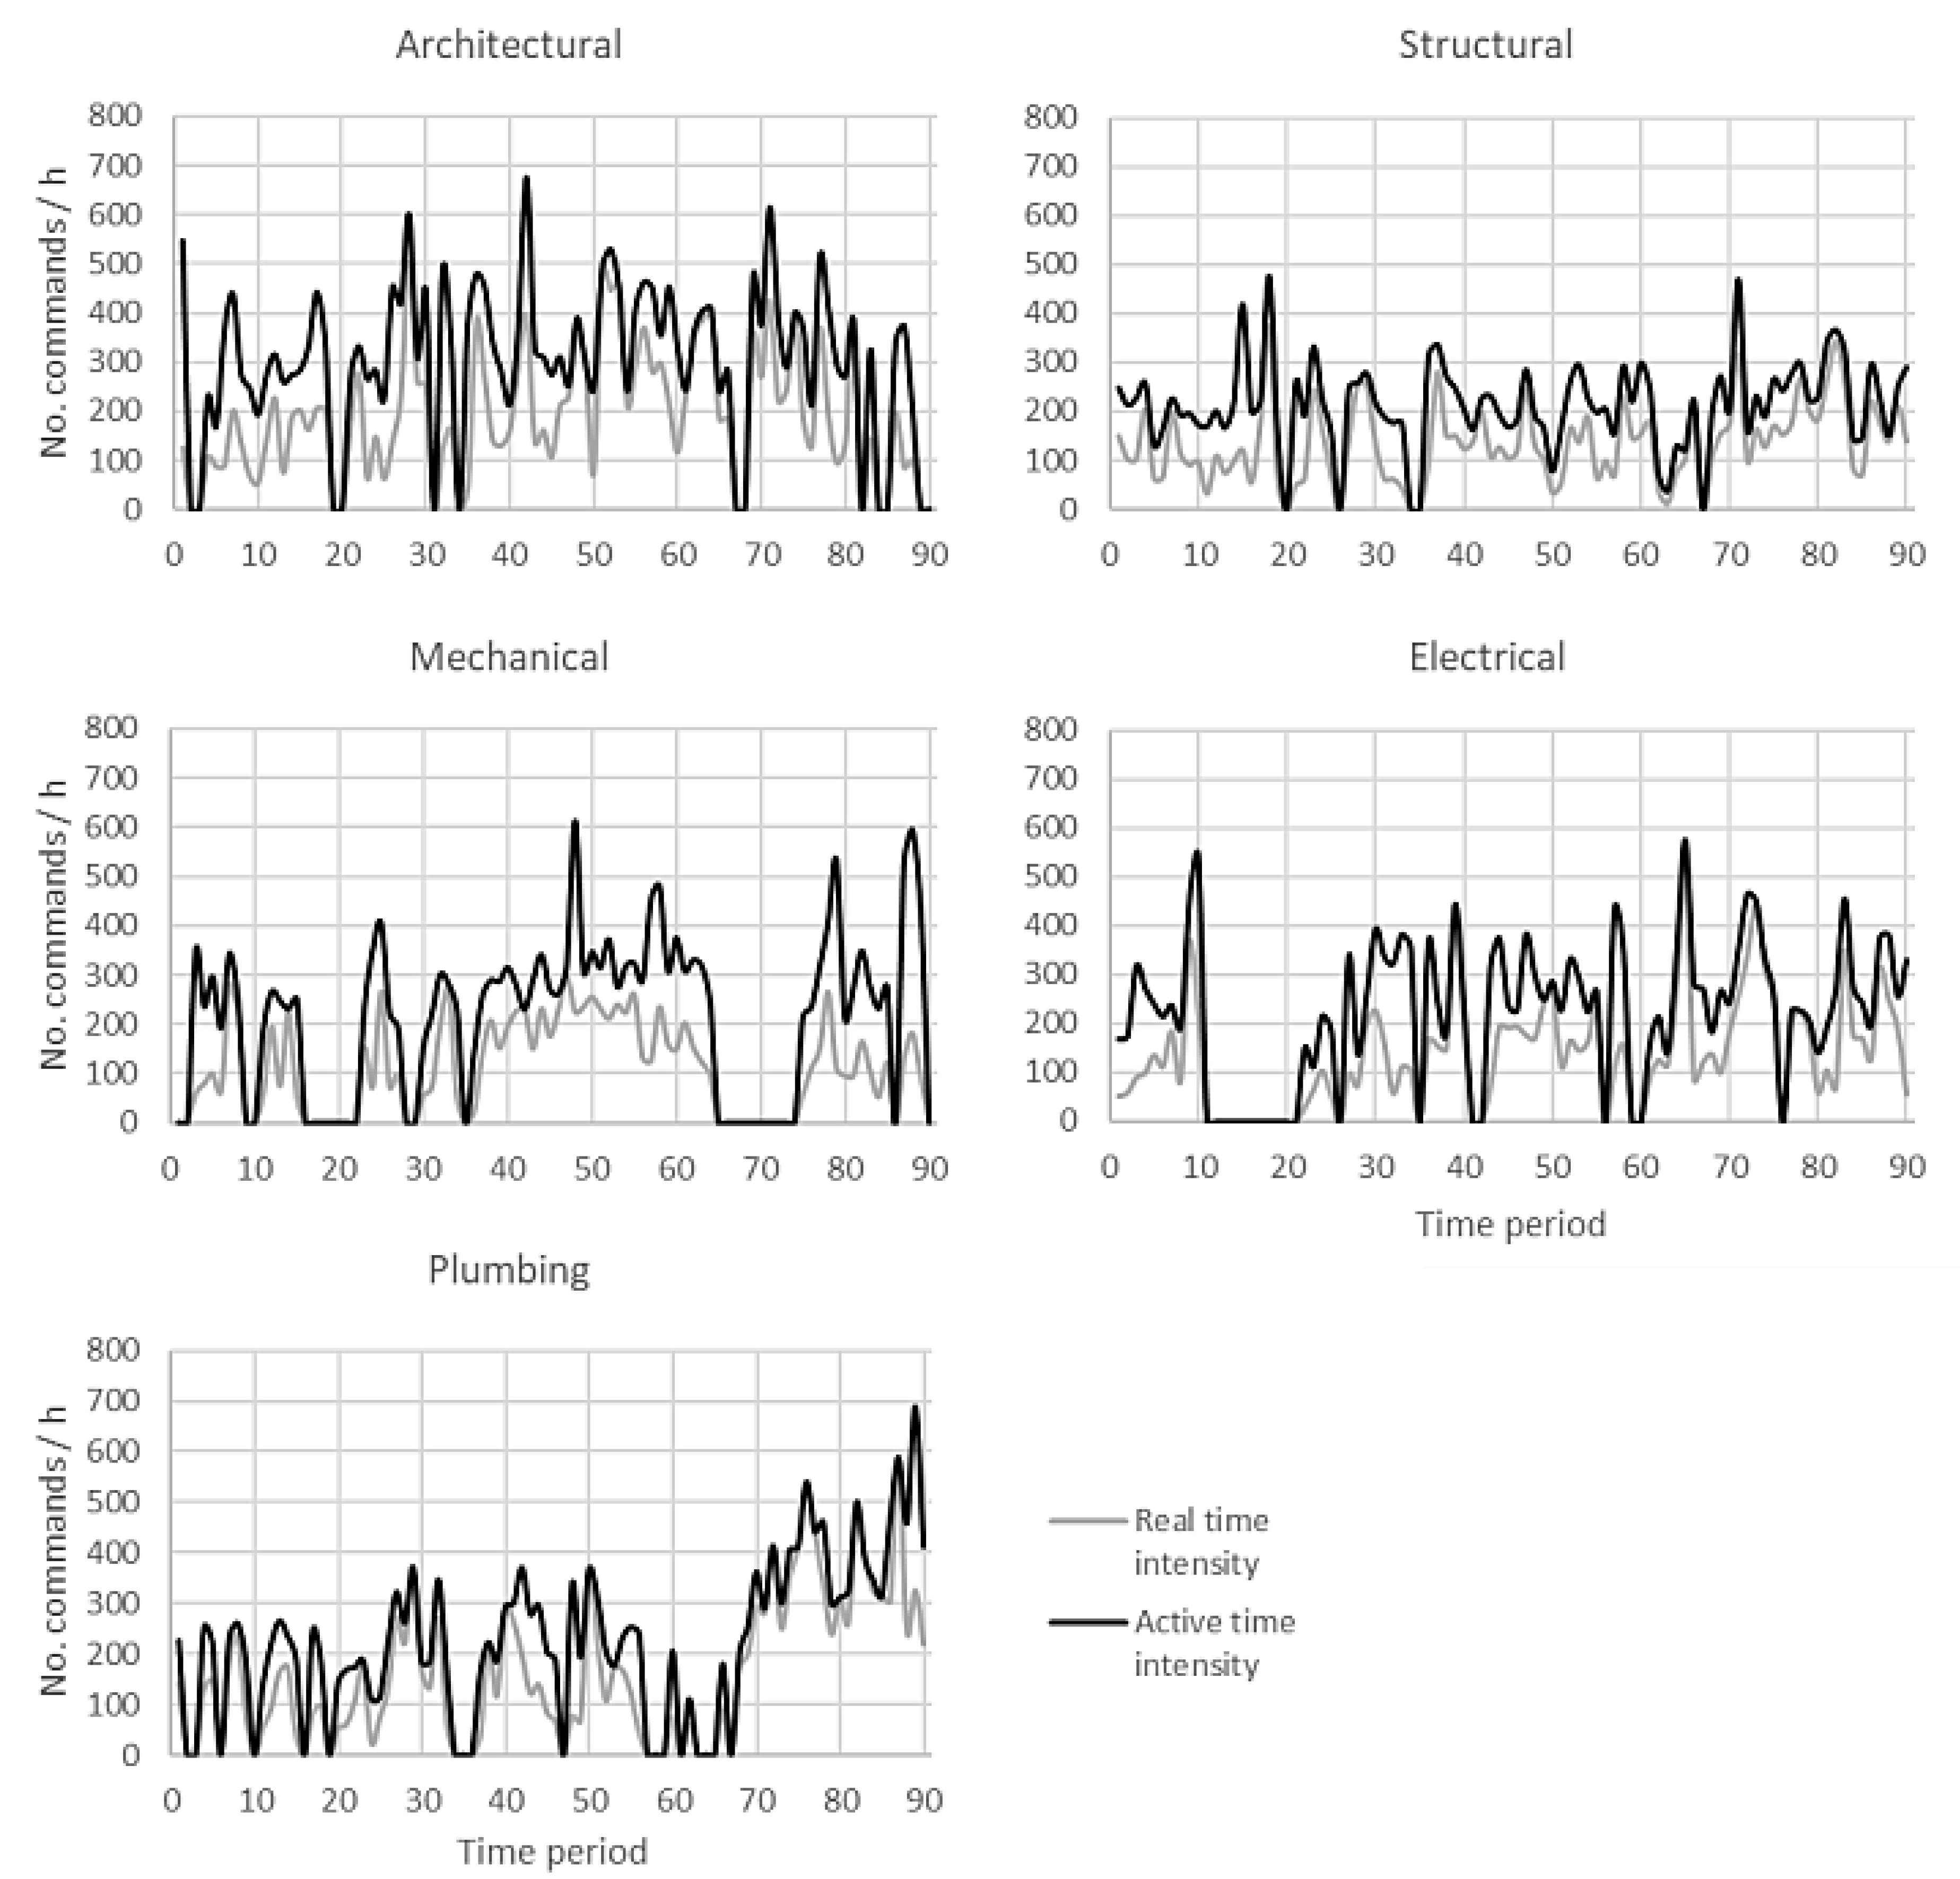
Section 3.3. Thus, as can be seen in Figure 5, real time intensities are lower than active time intensities, since the latter do not take into account pause times. The real time and active time intensity curves are slightly separate in sections where the designer took a few short pauses, while there is greater separation where the designer took a longer pause (>10 min) or a greater quantity of short pauses. In those periods where the designers did not execute any command, both curves go to zero, which represents a long pause in their work.
From this analysis, it can be observed that all the designers frequently took short and long pauses, except for the plumbing specialist, who often took long pauses that bring the curve to zero. However, while working this designer executed commands more uniformly, which is reflected in the frequent coincidence of both curves. The intensity of the architectural designer’s commands was clearly the highest, with rates of between 300 and 500 commands per hour. The rest of specialists presented rates of between 200 and 350 commands per hour, with the exception of the plumbing designer, whose work intensity increased to 300 to 600 commands per hour in the last 20 periods (i.e., four sessions). It is worth mentioning that the calculations for these intensities included non-contributory commands and consequently a deeper analysis should be carried out in order to identify anomalies. For example, given the data shown in Table 2, the architectural designer’s higher command intensity could have been triggered by the great amount of ‘Cancels’ he executed during the experiment.
During the experiment, the team worked together, but not everyone worked with the same intensity at all times mainly due to the need to generate a base model for other specialists to begin. Figure 5 shows the evolution of each specialist’s work over the 18 sessions (90 time periods), of which the first several were dedicated to preparation and to determining and creating elements and families to be used within the project. In these initial sessions, the architectural and structural designers were of great importance, since their early work determined heights and spaces where the MEP specialists could install their elements. It can also be observed how their command intensities followed a somehow paired curve, with long pauses in periods 20, 34, and 67.
As the experiment progressed, it can be observed how the MEP designers intensified their work, which was initially on standby due to required prior information to be able to advance. In the final phase of the project, all the specialists intensified their activity. This was on account of delays generated during the process that had to be compensated for to finish the project on time. In addition, the need to model construction details, solve clashes between models, and generate quantification tables had a significant influence in this final stage. While the mechanical and electrical designers had a uniform work intensity during the experiment, the plumbing designer showed a remarkable increment from period 70 until the end, whose cause would be worth studying in detail.
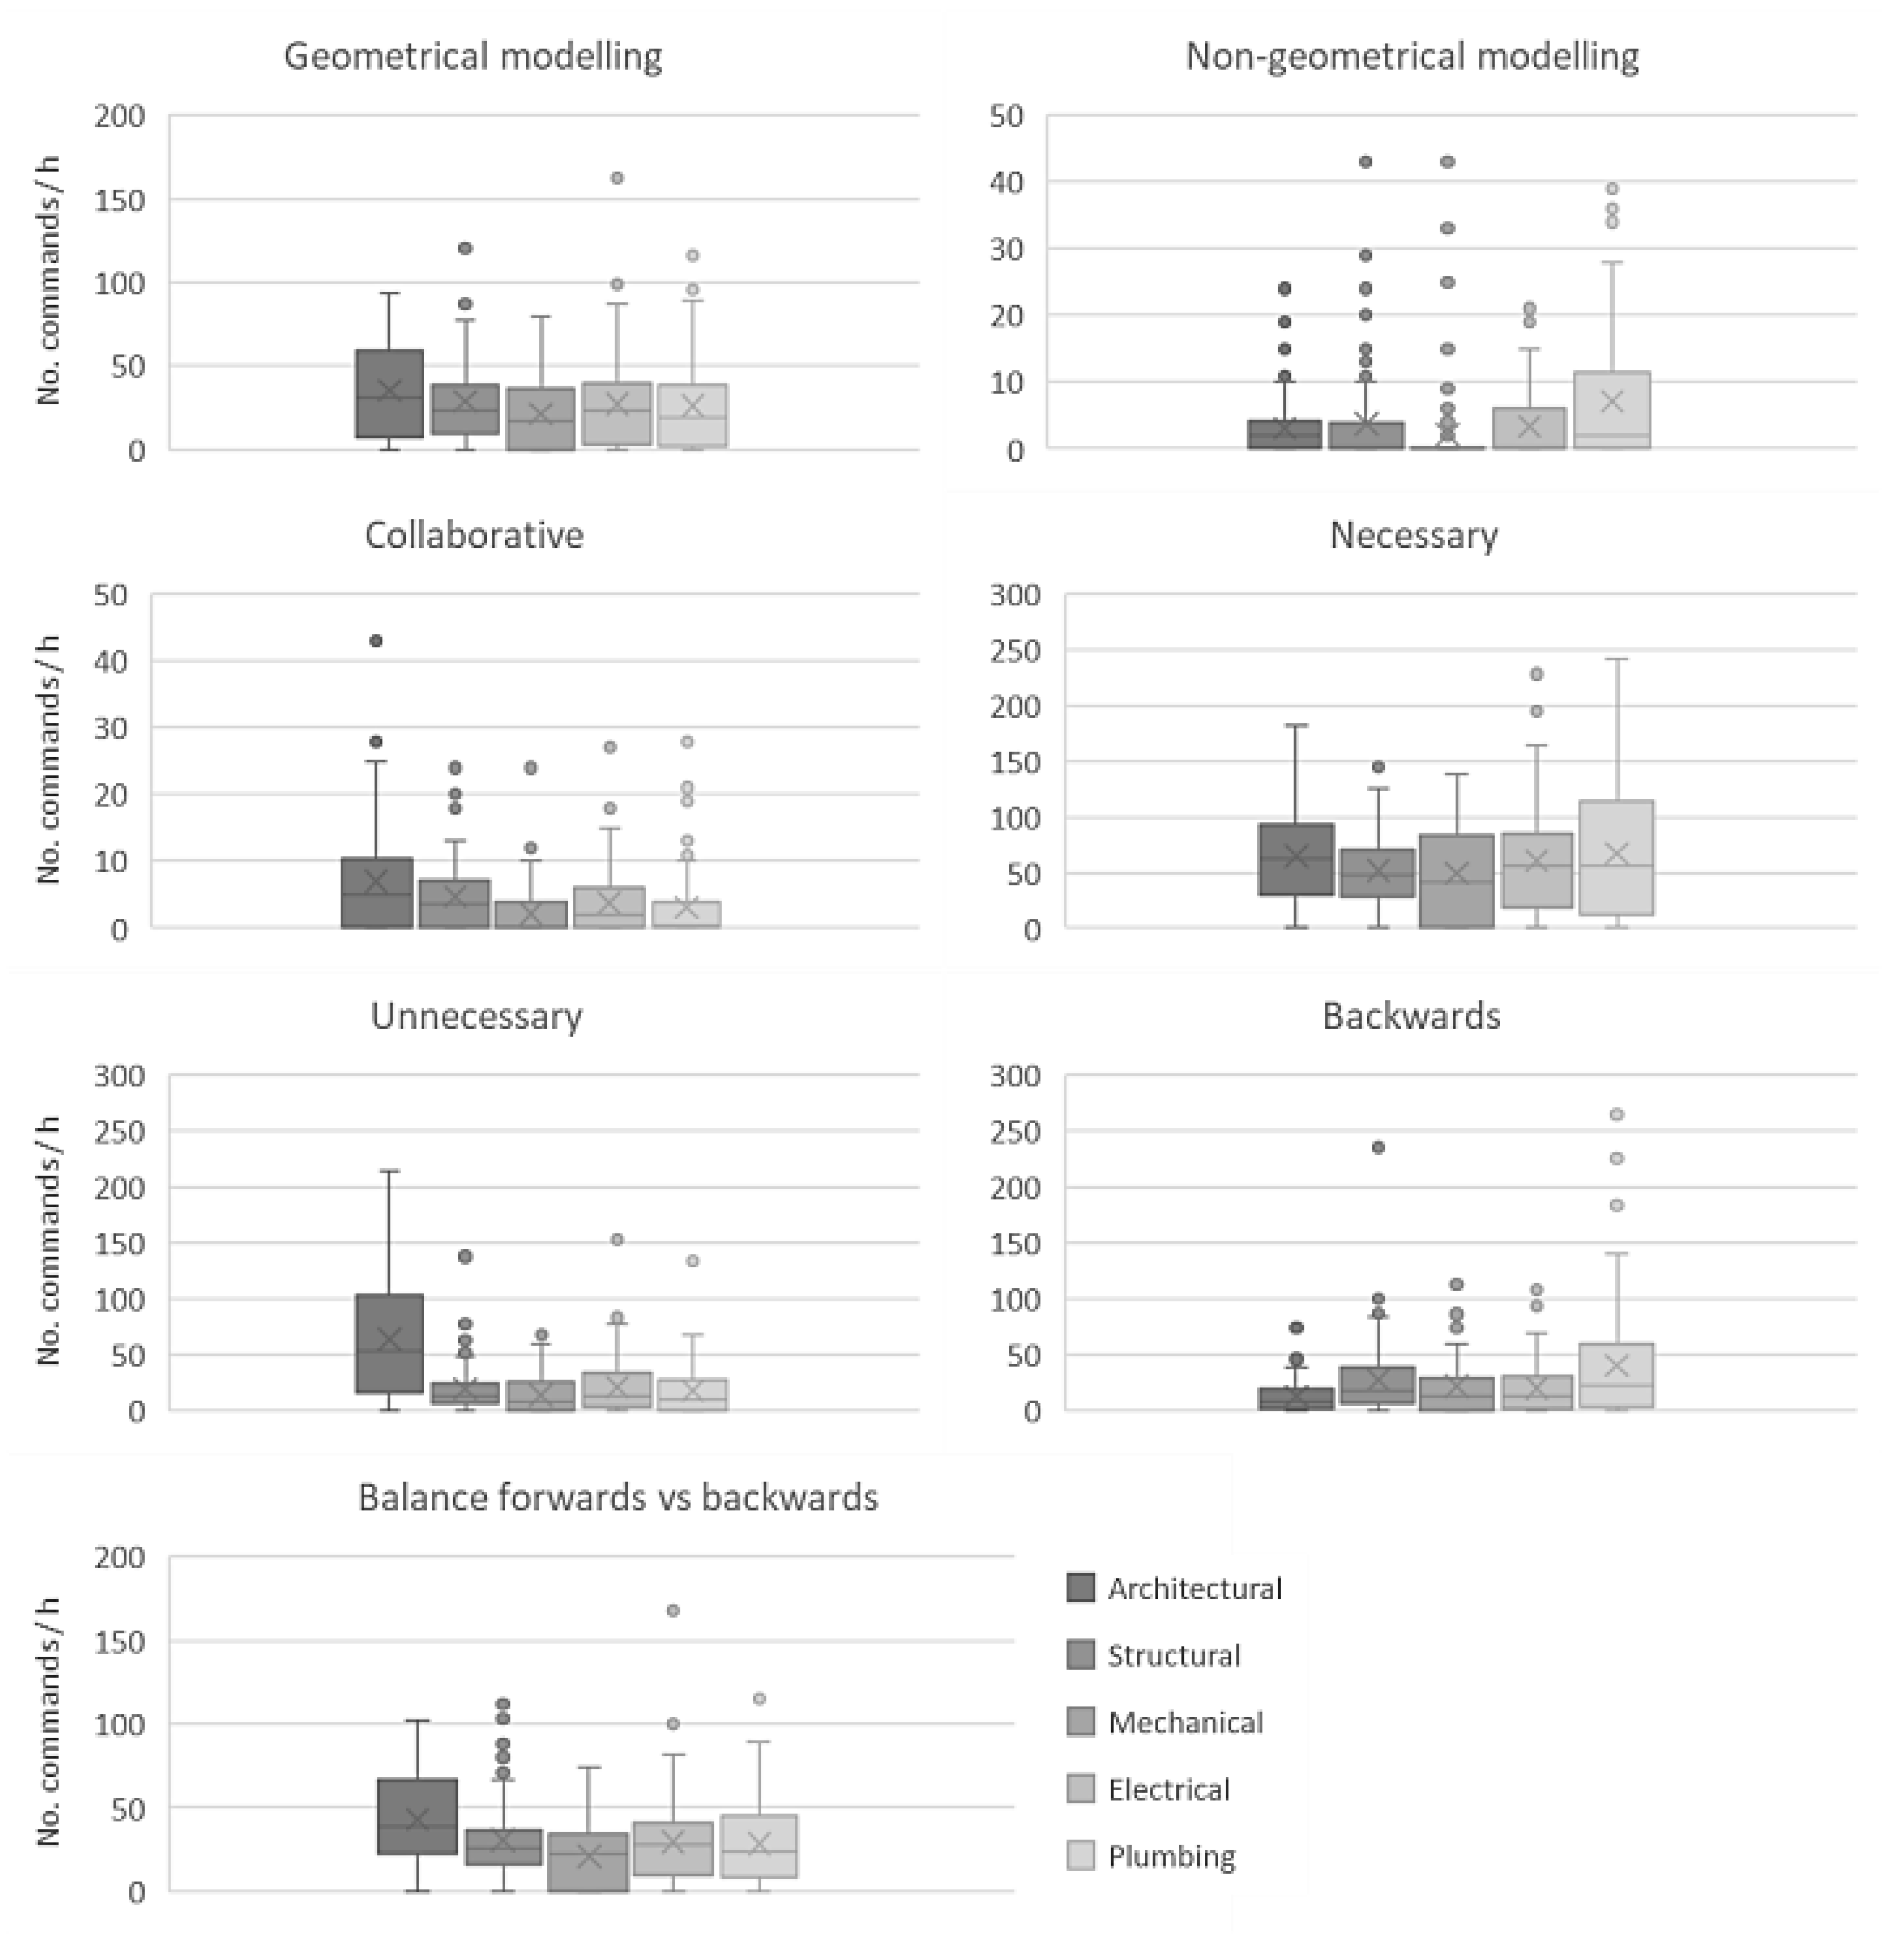
In Figure 6, the distribution of the real-time execution intensities for each sub-category of commands is presented. The architectural designer provided geometrical content for the model with the highest uniform intensity of all the specialties (~10 to ~60 commands per hour in 50% of the time periods). Alternately, the plumbing designer stands out with the highest rate of non-geometrical modeling commands (0 to ~11 commands per hour), while the mechanical designer hardly ever provided this kind of information to the model. It is worth mentioning that all the designers present numerous non-frequent values (points) in this chart, indicating frequent peaks in the provision of non-geometrical information, which is a common behavior in BIM modeling. The architectural and structural designers had a higher rate of collaborative actions, through which they updated the central model and received new information from it 0 to ~8–10 times per hour in 50% of the time periods. This was an expected behavior from these specialists, since information was frequently requested from them during the experiment. These events affected their focus, thereby generating errors in their work that involved redoing elements and delivering the information to the central file once again. A possible improvement could consist in the more precise timing of information delivery in order to achieve a better flow of activities and more equitable work. This should be organized by the coordinator previously to the design process to alleviate the pressure on the main designers to deliver information.
Regarding non-contributory commands, the mean rates of necessary commands executed by the various designers were usually similar (~30 to ~80 commands per hour), with the plumbing designer presenting a more extended interquartile range (~10 to ~120 commands per hour). As was expected from the data in Table 2, the architectural designer had the highest rate of unnecessary commands, probably triggered by the aforementioned ‘Cancels’. Again, experience in BIM modeling is reflected in the backwards commands chart, where the architectural designer had the lowest rate (~0 to ~20), while the plumbing specialist executed ~5 to ~60 backwards commands per hour. From this data and the balanced rate of forwards vs backwards commands, it can be inferred that the plumbing designer would need further training in BIM modeling. Therefore, it would be worth studying this designer’s command patterns during the experiment in more detail in order to identify bad practices that need being addressed.
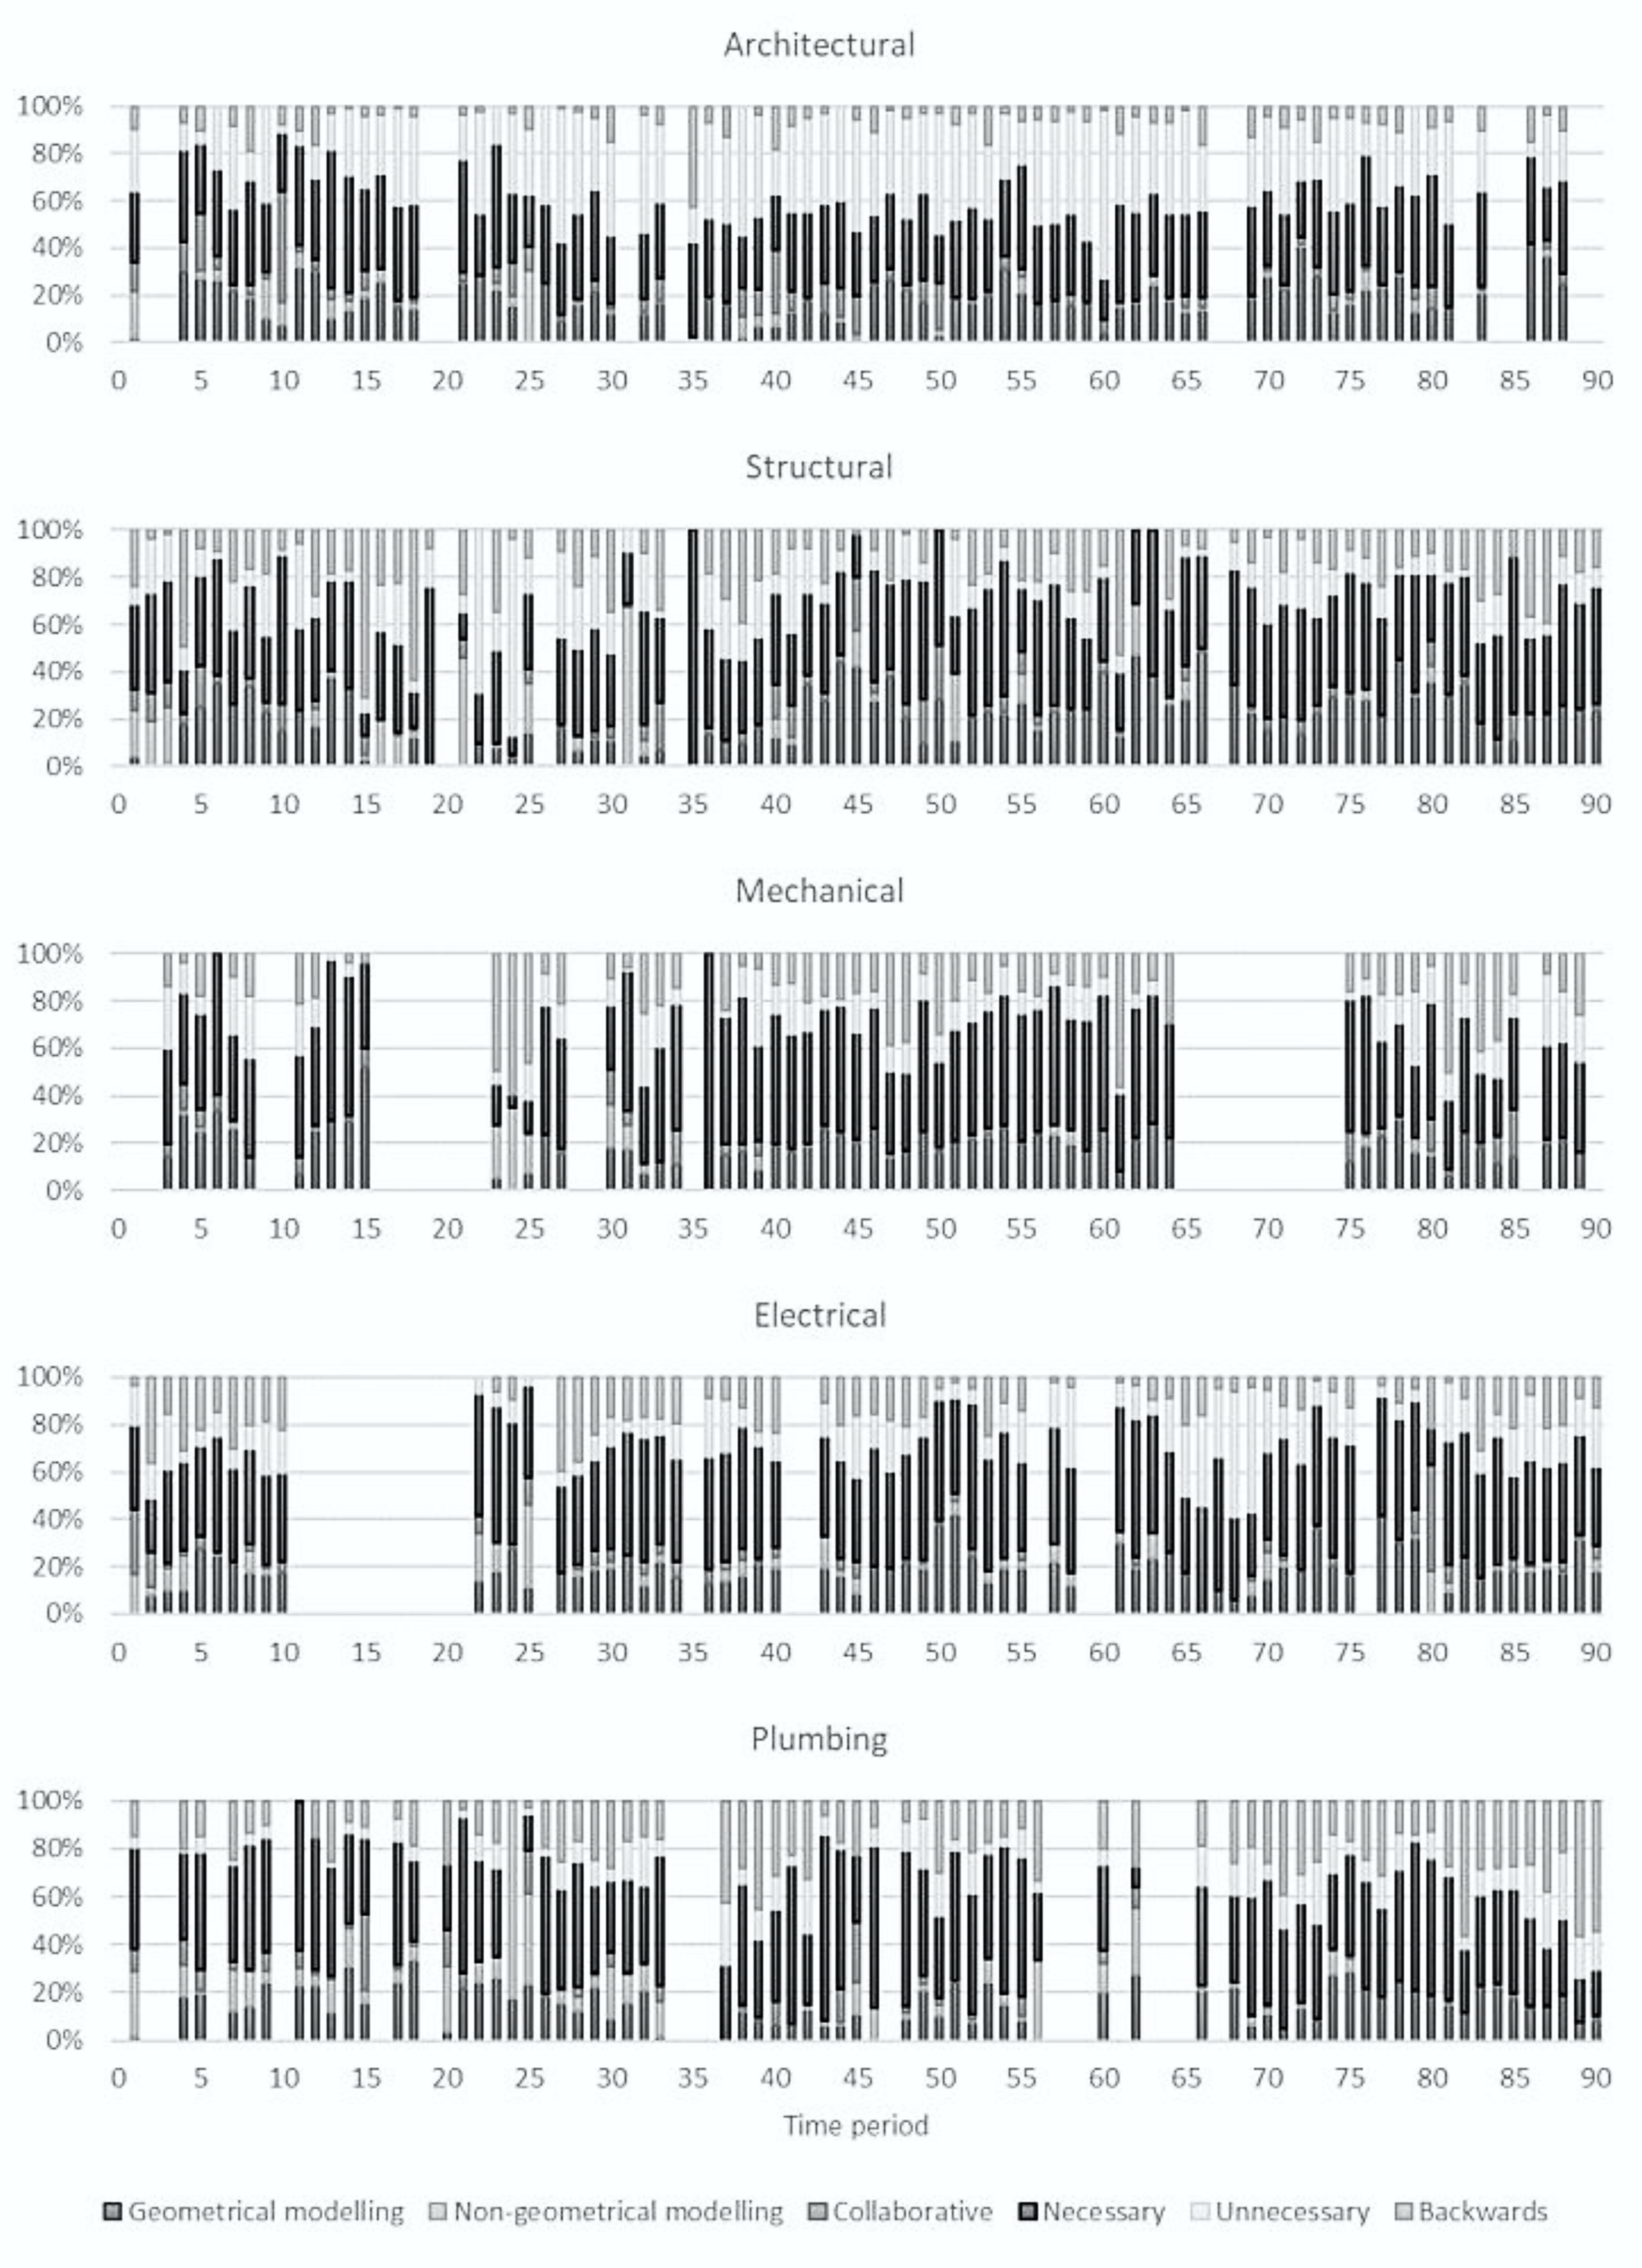
When these distributions are studied in detail for each of the experiment´s 90 time periods, the shares of each sub-category for the different designers provide new data worth analyzing. In Figure 7, the architectural designer shows a significant share of unnecessary commands throughout the experiment, with a maintained share of around 40% in the middle 30 time periods, while his share of backwards commands is the lowest of the five specialties (<10%). This confirms the aforementioned excessive use of the ESC key, as well as better skills in BIM modeling, hence requiring fewer corrections in the design process. His share of necessary commands stays nearly constant and balanced with contributory commands (~30% each). A higher share of collaborative commands can be detected during the initial time periods of the experiment (~10%), where this designer must provide basic information in the model to the other specialists, while constant interaction with the other designers can be identified throughout the rest of the process.
The structural designer shows a higher variability in the shares for each sub-category, with a high share of backwards commands in some time periods (~40–50%), which become negative contributions or massive corrections. This could indicate that a great number of mistakes had been made in previous time periods, or that the modeler was using auxiliary lines (detail lines) that were subsequently deleted. Nevertheless, both can be considered bad practices in BIM modeling that should be corrected. This designer’s share of necessary commands is balanced with that of contributory commands, as well (~20–30%). The designer presents higher shares of non-geometrical modeling in the initial sessions (~20%), when families were being defined, and a higher share of geometrical modeling for the rest of the experiment (~30%), which are considered normal behaviors for this specialist. In addition, it was expected that the structural designer would demonstrate a more constant share of collaborative commands than he in fact did (~5%), since clashes are common between this and the other disciplines’ models.
The timeline for the mechanical designer shows at least three entire sessions without participation (periods 16–20 and 65–74), and several long pauses (periods 1–2, 9–10, 27–28, 35, 86, and 90). This non-contributory behavior is to be expected at the initial stages of the project since MEP specialists are waiting for the architect and structural engineer to provide the basic elements of the building in order to model the installations. However, the initial stages should be dedicated to defining the necessary families for the project, and in more advanced stages a better planning of workflows should provide the various specialists with tasks that ensure constant contribution to the project. It can also be observed that the necessary commands executed by the mechanical designer (~40%) approximately doubled the amount of contributory commands (~20%), which could indicate that this specialist used an excessive number of auxiliary commands, such as hiding elements or modifying visualization options. This kind of modeling practices require a more detailed analysis of the command patterns executed in order to increase the designer’s performance by providing personalized training.
The electrical specialist did not participate in two entire sessions (periods 11–20) and took several long pauses throughout the experiment (periods 21, 26, 41–42, 56, 59–60, and 76). A significant share of backwards commands can be identified in the first half of the timeline (~20–40%), which decreases in the second half (~5–15%). This may indicate an improvement in the modeling skills of this designer. Again, his share of necessary commands (~40–50%) is virtually double that of contributory commands (~20–25%), while a nearly constant share of collaborative commands is evident (~3%), through which this specialist received updates from the rest of the designers.
Finally, the plumbing designer shows a large constant share of backwards commands (~20–40%), but the lowest share of unnecessary commands (~10%). Additionally, a high proportion of necessary commands with respect to contributory commands is apparent (~40–50% to ~20–25%), as well as a high provision of non-geometrical information to the model (~10%) and a variable share of collaborative commands (~5–30%).
According to this analysis, it would be advisable to train the architectural designer in order to reduce the use of unnecessary ‘Cancels’, which apparently this specialist does while thinking. The structural, mechanical and plumbing designers’ training should focus on reducing the number of backwards commands, for which a deeper analysis of the specific causes should be performed previously. This analysis should be based on detecting bad practices through the study of command patterns. All the MEP designers should receive training in order to reduce the quantity of necessary commands that they execute to produce a more effective modeling process, since necessary commands do not really contribute to the model but are only auxiliary commands that sometimes can be avoided through good modeling practices. While the plumbing specialist’s command intensity and distribution was more constant than that of the other MEP designers, the analysis indicates that this designer needs further training in BIM modeling in order to avoid using that significant share of backwards commands.
When working individually, where only information is required and not delivered to others, clashes between models are prone to occur. A greater emphasis on the delivery of information would imply a lower rate of errors and avoid the emergence of problems during the project. During this experiment, the flow of information from the MEP designers was not as regular with respect to other specialties, which is contradictory since these are usually the specialties that generate more conflicts during collaborative work. In general, this team of designers should receive training in a more comprehensive plan of interaction regarding the sharing of information through the ‘Save to master’ command to ensure better and more frequent synchronization of the local models. This would avoid unnecessary mistakes, and therefore some of the backwards commands executed, thus improving the individual performance of each designer.

5. Discussion

The increased use of BIM worldwide has created an opportunity to study the log files generated by the available software. The analysis of these files can be oriented towards analyzing the modelers’ performance and behavior in order to improve productivity, but requires a preliminary data cleaning and organization process to be able to identify problems, causes, and possible solutions. In this research, a method for studying these log files was proposed in order to identify good and bad user practices during the design phase of a building project that could subsequently be useful for elaborating personalized training proposals and to increase both individual and collaborative performance of designers. By analyzing the events occurred during the experiment’s timeline, specifically pauses in the specialists’ work, it was also possible to detect behaviors directly related to their roles in the project development workflow.
BIM log mining has been used before to analyze the commands executed by a modeler. Zhang et al. [33] presented an experience where the most repeated commands could have been common to the five designers considered in the present study, including ‘Cancel’, ‘Disallow join’, ‘Temporary hide’, ‘Delete’, ‘Align’, ‘Undo’, and ‘Reference plane’. In their analysis they noticed that some of the most used commands identified were somehow necessary or auxiliary. However, this method also allowed detecting bad modeling practices, such as an excessive use of ‘Disallow join’, which is not common and needs finding the cause for that behavior in order to correct it. The analysis applied in the present study also made it possible to detect bad practices with a general classification and overview of the executed commands. For example, it was noticed that the plumbing specialist used a significant amount of backwards commands, which made this designer’s work less efficient. In addition, a positive evolution in this aspect was detected for the electrical designer, who started using more of these commands in the initial time periods, and then reduced them by the end of the experiment. Nevertheless, a combination of both analysis methods would certainly allow generating more personalized recommendations for further training.
In this study, the performance of BIM users participating in the experiment was measured through their command execution intensities, which usually were within the range of 200 to 400 commands per hour. Modeling performance has been measured before through BIM log mining. For example, Yarmohammadi et al. [26] obtained the time it took different modelers to execute a certain command pattern. Their method required finding for all the modelers a same pattern, which was obtained from the analysis of log files from different workstations in an architecture firm. As occurred in their study, finding command patterns common to the five specialties in the experiment here described would require these to be based on basic commands, such as hiding, copying, and moving, rotating, or aligning elements. However, most of the contributory work carried out by each specialist is based on commands exclusively related to their discipline, as was shown in Table 3 and Table A1, Table A2, Table A3 and Table A4. Nevertheless, the method used in the present study does not consider that some commands take more time to complete than others. Therefore, a more complex analysis might be necessary to measure modelers’ performance, since current methods do not capture these differences between disciplines or commands.
Zhang et al. [23] also presented a command pattern discovery method based on BIM log mining, which they used to measure and analyze productivity. Their study was oriented identify command patterns associated to a certain task and to evaluate modelers’ performance executing those patterns in order to better allocate resources to different design tasks in design projects. In the present study, the main focus was put on studying the use that the various specialists showed regarding a set of general categories of commands. Those categories were created according to the contribution of commands to the design process, classifying them into geometrical modeling, non-geometrical modeling, collaborative, necessary, unnecessary, and backwards. The study of the distributions of these categories for each designer during the experiment allowed detecting bad modeling practices and further training needs. By populating a timeline of the experiment with data specific for each time period, it was possible to study the evolution of users’ behavior and performance regarding these categories, which proved useful for better planning information workflows in future projects.
As mentioned before, workflows in the development of BIM projects are hybrid and not solely BIM-based, making it necessary to use other platforms, such as sketches on paper or consulting documents online [32]. These activities cannot be detected by studying BIM log files and therefore need a more thorough observation of the designers throughout the design process. From that observation, qualitative data could arise that complements and validates the detection of certain events in the study of short and long pauses in the log files, thus allowing to review collective behavior.
The experience and method described here has clear applications in architecture firms developing BIM projects where coordinators and managers are willing to analyze behavioral patterns and efficiency of their modelers and to identify further training needs and opportunities to increase their performance. The collaborative work environment built for this experiment provided a singular means that strengthened teamwork and allowed a constant flow of information between the participants, who supported each other to find solutions to the issues that would arise during the design process. This method is useful not only to analyze users’ performance in BIM modeling, but also to better understand their behavior and identify improvement strategies. This analysis was carried out using spreadsheets in a semi-manual process. However, given the large amount of data to be managed, it would be advisable to implement the entire process in software to increase the automation of the analysis.

Author Contributions

Conceptualization, E.F. and A.M.-R.; Data curation, A.M.-R.; Formal analysis, A.M.-R. and J.S.-M.; Funding acquisition, E.F., A.M.-R. and R.G.-A.; Investigation, E.F. and R.G.-A.; Methodology, A.M.-R. and A.N.-B.; Project administration, E.F.; Resources, E.F. and R.G.-A.; Software, J.S.-M. and A.N.-B.; Supervision, E.F.; Visualization, A.N.-B. and F.L.; Writing—original draft, E.F., J.S.-M. and F.L.; Writing—review & editing, A.M.-R. All authors have read and agreed to the published version of the manuscript.

Funding

This research was funded by the National Commission for Science and Technology Research in Chile (CONICYT), grant number 1171108 and the VI Own Research and Transfer Plan of the University of Seville (VI PPIT-US). The APC was partially funded by the Universidad Del Bío-Bío.

Conflicts of Interest

The authors declare no conflict of interest. The funders had no role in the design of the study; in the collection, analyses, or interpretation of data; in the writing of the manuscript, or in the decision to publish the results.

Appendix A. Most Used Commands by Each Designer

Table A1. Contributory commands most frequently used by the structural designer.
Command IDDescriptionAbsolute FrequencyRelative Frequency
ID_OBJECTS_BEAMCreate a beam19010.7%
ID_FILE_SAVE_TO_MASTERSave the active project to the central model again18120.8%
ID_OBJECTS_CURVE_LINECreate a line13228.2%
ID_FINISH_SKETCHFinish sketch12535.2%
ID_EDIT_MOVEMove selected objects or their copies9940.8%
ID_EDIT_MOVE_COPYMove copies of selected objects8745.6%
ID_OBJECTS_PROJECT_CURVECreate a straight line or an arc8450.3%
ID_VIEW_NEW_SCHEDULECreate a schedule6954.2%
ID_OBJECTS_CURVE_RECTCreate a rectangle5257.1%
ID_TRUSS_WEB_CURVECreate a truss web4459.6%
ID_OBJECTS_LEVELCreate a level4261.9%
ID_FINISH_SWEEPFinish sweep4064.2%
ID_OBJECTS_FOOTING_SLABCreate a footing slab3766.3%
ID_END_INPLACE_FAMILYFinish the family3468.2%
ID_REVIT_FILE_SAVESave the active project3370.0%
ID_LOAD_INTO_PROJECTSLoad document into open projects3371.9%
ID_OBJECTS_TRUSSCreate a truss beam3273.7%
ID_EDIT_MIRRORMirror selected objects3175.4%
ID_EDIT_ROTATERotate selected objects3177.1%
ID_FINISH_SKETCH_PATHFinish a sketch of sweep path2978.8%
ID_SKETCH_2D_PATHCreate or edit the path through a sketch in a plane2880.3%
Table A2. Contributory commands most frequently used by the mechanical designer.
Command IDDescriptionAbsolute FrequencyRelative Frequency
IDS_RBS_CREATE_PIPECreate pipe46736.1%
ID_FILE_SAVE_TO_MASTERSave the active project to the central model again12245.5%
ID_ALIGNAlign references11854.6%
IDS_RBS_CREATE_DUCTCreate duct9161.7%
ID_RBS_MECHANICAL_DIFFUSERInsert an air diffuser5165.6%
ID_RBS_MECHANICAL_EQUIPMENTCreate mechanical equipment5069.5%
IDS_RBS_CREATE_FLEXCreate flexible duct4973.3%
ID_RBS_PIPE_PIPECreate pipes4376.6%
ID_EDIT_ROTATERotate selected elements3979.6%
ID_LOAD_INTO_PROJECTSLoad document into open projects2381.4%
Table A3. Contributory commands most frequently used by the electrical designer.
Command IDDescriptionAbsolute FrequencyRelative Frequency
ID_OBJECTS_DETAIL_CURVESCreate a detail line or arc24214.7%
ID_RBS_ELECTRICAL_DEVICEAdd electrical devices19026.3%
ID_RBS_LIGHTING_FIXTUREAdd lighting fixtures17036.6%
ID_FILE_SAVE_TO_MASTERSave the active project to the central model again16346.5%
IDS_RBS_CREATE_CONDUITCreate conduit15455.9%
ID_EDIT_ROTATERotate selected elements13063.8%
ID_EDIT_PASTE_NO_EVENTPaste element10670.2%
ID_RBS_ELECTRICAL_LIGHTING_DEVICECreate a lighting device4673.0%
ID_VIEW_NEW_SCHEDULECreate a schedule3475.1%
ID_FAMILY_LOADLoad a family into the project3177.0%
ID_EDIT_COPYCopy the selection and keep it in the clipboard2478.4%
ID_RBS_ELECTRICAL_EQUIPMENTAdd electrical equipment2279.8%
ID_RBS_PIPE_PIPECreate pipe2181.0%
Table A4. Contributory commands most frequently used by the plumbing designer.
Command IDDescriptionAbsolute FrequencyRelative Frequency
ID_RBS_PIPE_PIPECreate pipes40823.7%
ID_RBS_PLUMBING_FIXTUREInsert a plumbing fixture14532.1%
IDS_RBS_CREATE_PIPECreate a pipe10838.4%
ID_FAMILY_TYPEModify predefined types for this family10544.5%
ID_REVIT_FILE_SAVESave the active project6248.1%
ID_EDIT_ROTATERotate selected elements6151.7%
ID_RBS_ADD_PIPE_CONNECTORAdd pipe connector to the family5955.1%
ID_LOAD_INTO_PROJECTSLoad document into open projects5758.4%
ID_FILE_SAVE_TO_MASTER_SHORTCUTSave the active project to the central model again5361.5%
ID_EDIT_MOVEMove selected objects or their copies5264.5%
ID_VIEW_NEW_SCHEDULECreate a schedule4867.3%
ID_FILE_SAVE_TO_MASTERSave the active project to the central model again4770.0%
IDC_APPLY_MovePropsDialogBarApply to an object the same properties from another object4172.4%
ID_ANNOTATIONS_DIMENSION_ALIGNEDCreate aligned annotation4074.7%
ID_OBJECTS_LEVELCreate a level3676.8%
ID_OBJECTS_REFERENCE_CURVECreate a reference line3578.8%
ID_EDIT_MOVE_COPYMove copies of selected objects3280.7%

References

  1. Fulford, R.; Standing, C. Construction industry productivity and the potential for collaborative practice. Int. J. Proj. Manag. 2014, 32, 315–326. [Google Scholar] [CrossRef]
  2. Oh, M.; Lee, J.; Hong, S.W.; Jeong, Y. Integrated system for BIM-based collaborative design. Autom. Constr. 2015, 58, 196–206. [Google Scholar] [CrossRef]
  3. Hannele, K.; Reijo, M.; Tarja, M.; Sami, P.; Jenni, K.; Teija, R. Expanding uses of building information modeling in life-cycle construction projects. Work 2012, 41, 114–119. [Google Scholar] [CrossRef] [Green Version]
  4. Eadie, R.; Browne, M.; Odeyinka, H.; McKeown, C.; McNiff, S. BIM implementation throughout the UK construction project lifecycle: An analysis. Autom. Constr. 2013, 36, 145–151. [Google Scholar] [CrossRef]
  5. Xu, X.; Ma, L.; Ding, L. A framework for BIM-enabled life-cycle information management of construction project. Int. J. Adv. Robot. Syst. 2014, 11, 1–13. [Google Scholar] [CrossRef]
  6. Wong, J.K.W.; Zhou, J. Enhancing environmental sustainability over building life cycles through green BIM: A review. Autom. Constr. 2015, 57, 156–165. [Google Scholar] [CrossRef]
  7. Elmualim, A.; Gilder, J. BIM: Innovation in design management, influence and challenges of implementation. Archit. Eng. Des. Manag. 2014, 10, 183–199. [Google Scholar] [CrossRef]
  8. Sackey, E.; Tuuli, M.; Dainty, A. Sociotechnical systems approach to BIM implementation in a multidisciplinary construction context. J. Manag. Eng. 2014, 31, 1–12. [Google Scholar] [CrossRef]
  9. Paavola, S.; Miettinen, R. Dynamics of Design Collaboration: BIM Models as Intermediary Digital Objects. Comput. Support. Coop. Work CSCW An Int. J. 2018, 27, 1113–1135. [Google Scholar] [CrossRef] [Green Version]
  10. Bryde, D.; Broquetas, M.; Volm, J.M. The project benefits of building information modelling (BIM). Int. J. Proj. Manag. 2013, 31, 971–980. [Google Scholar] [CrossRef]
  11. Rezgui, Y.; Beach, T.; Rana, O. A governance approach for BIM management across lifecycle and supply chains using mixed-modes of information delivery. J. Civ. Eng. Manag. 2013, 19, 239–258. [Google Scholar] [CrossRef]
  12. Mutai, A. Factors Influencing the Use of Building Information Modeling (BIM) within Leading Construction Firms in the United States of America; Proquest, Umi Dissertation Publishing: Ann Arbor, MI, USA, 2011; ISBN 9781243709448. [Google Scholar]
  13. Azhar, S. Building Information Modeling (BIM): Trends, Benefits, Risks, and Challenges for the AEC Industry. Leadersh. Manag. Eng. 2011, 11, 241–252. [Google Scholar] [CrossRef]
  14. Navendren, D.; Manu, P.; Shelbourn, M.; Mahamadu, A.-M. Addressing Challenges to Building Information Modelling Implementation in Uk: Designers’ Perspectives. In Proceedings of the 30th Annual ARCOM Conference, Cambridge, UK, 4–6 September 2017; pp. 733–742. [Google Scholar]
  15. Succar, B. Building information modelling framework: A research and delivery foundation for industry stakeholders. Autom. Constr. 2009, 18, 357–375. [Google Scholar] [CrossRef]
  16. del Caño, A.; de la Cruz, M.P.; Solano, L. Diseño, ingeniería, fabricación y ejecución asistidos por ordenador en la construcción: Evolución y desafíos a futuro. Inf. la Construcción 2007, 59, 53–71. [Google Scholar] [CrossRef]
  17. Volk, R.; Stengel, J.; Schultmann, F. Building Information Modeling (BIM) for existing buildings—Literature review and future needs. Autom. Constr. 2014, 38, 109–127. [Google Scholar] [CrossRef] [Green Version]
  18. Fruchter, R. M3R: Transformative Impacts of Mixed Media Mixed Reality Collaborative Environment in Support of AEC Global Teamwork. In Transforming Engineering Education; ASCE: Reston, PA, USA, 2018; pp. 229–257. [Google Scholar]
  19. Muñoz-La Rivera, F.; Vielma, J.C.; Herrera, R.F.; Carvallo, J. Methodology for Building Information Modeling (BIM) Implementation in Structural Engineering Companies (SECs). Adv. Civ. Eng. 2019, 2019, 1–16. [Google Scholar] [CrossRef] [Green Version]
  20. Bonchi, F.; Castillo, C.; Gionis, A.; Jaimes, A. Social Network Analysis and Mining for Business Applications. ACM Trans. Intell. Syst. Technol. 2011, 2, 1–37. [Google Scholar] [CrossRef]
  21. Jara, C.; Alarcón, L.F.; Mourgues, C. Accelerating interactions in project design through extreme collaboration and commitment management—A case study. In Proceedings of the Annual Conference of the IGLC, Taipei, Taiwan, 15–17 July 2009; pp. 477–488. [Google Scholar]
  22. Zhang, L.; Ashuri, B. BIM log mining: Discovering social networks. Autom. Constr. 2018, 91, 31–43. [Google Scholar] [CrossRef]
  23. Zhang, L.; Wen, M.; Ashuri, B. BIM Log Mining: Measuring Design Productivity. J. Comput. Civ. Eng. 2018, 32, 04017071. [Google Scholar] [CrossRef]
  24. Oraee, M.; Hosseini, M.R.; Edwards, D.J.; Li, H.; Papadonikolaki, E.; Cao, D. Collaboration barriers in BIM-based construction networks: A conceptual model. Int. J. Proj. Manag. 2019, 37, 839–854. [Google Scholar] [CrossRef]
  25. Kouhestani, S.; Nik-Bakht, M. IFC-based process mining for design authoring. Autom. Constr. 2020, 112, 103069. [Google Scholar] [CrossRef]
  26. Yarmohammadi, S.; Pourabolghasem, R.; Castro-lacouture, D. Automation in Construction Mining implicit 3D modeling patterns from unstructured temporal BIM log text data. Autom. Constr. 2017, 81, 17–24. [Google Scholar] [CrossRef]
  27. van der Aalst, W.; Buijs, J.; van Dongen, B. Towards improving the representational bias of process mining. In Proceedings of the International Symposium on Data-Driven Process Discovery and Analysis, Campione d’Italia, Italy, 18–20 June 2012; Volume 116, pp. 39–54. [Google Scholar]
  28. Rozinat, A.; van der Aalst, W.M.P. Conformance checking of processes based on monitoring real behavior. Inf. Syst. 2008, 33, 64–95. [Google Scholar] [CrossRef]
  29. Pan, Y.; Zhang, L. BIM log mining: Exploring design productivity characteristics. Autom. Constr. 2020, 109, 102997. [Google Scholar] [CrossRef]
  30. Das, R.; Turkoglu, I. Creating meaningful data from web logs for improving the impressiveness of a website by using path analysis method. Expert Syst. Appl. 2009, 36, 6635–6644. [Google Scholar] [CrossRef]
  31. Grosfeld-Nir, A.; Ronen, B.; Kozlovsky, N. The Pareto managerial principle: When does it apply? Int. J. Prod. Res. 2007, 45, 2317–2325. [Google Scholar] [CrossRef]
  32. Harty, C.; Whyte, J. Emerging hybrid practices in construction design work: Role of mixed media. J. Constr. Eng. Manag. 2010, 136, 468–476. [Google Scholar] [CrossRef]
  33. Zhang, N.; Tian, Y.; Al-Hussein, M. A Case Study for 3D Modelling Process Analysis based on BIM Log File. In Proceedings of the MOC2019—Modular and Offsite Construction Summit, Banff, AB, Canada, 21–24 May 2019; pp. 309–313. [Google Scholar]
Figure 1. Layout and implementation of the collaborative work environment.
Applsci 10 02199 g001
Figure 2. Classroom building model in Autodesk Revit.
Applsci 10 02199 g002
Figure 3. An example of a Building Information Modeling (BIM) log file and its content.
Applsci 10 02199 g003
Figure 4. Pareto charts of contributory commands for each specialist.
Applsci 10 02199 g004
Figure 5. Real time and active time work intensities for each designer.
Applsci 10 02199 g005
Figure 6. Distribution of the command execution rates for each sub-category by specialty during the experiment´s 90 time periods.
Applsci 10 02199 g006
Figure 7. Share of commands by sub-category and time period for each designer.
Applsci 10 02199 g007
Table 1. Classification system for executed commands.
CategorySub-CategoryDescriptionExamples
ContributoryGeometrical modelingModeling commands that translate into a virtual object in the modelWall, Door, Beam, Finish sketch, Move, Align
Non-geometrical modelingCommands to modify object parameters, project configuration, or templatesEdit type, Annotations, Level, Grid, Schedule
CollaborativeCommands with an implied interaction with the other designersSave to master file, Relinquish all mine, Editing requirements
Non-contributoryBackwardsCommands that imply a step backwards in the contribution to the final productUndo, Delete, Cancel sketch
NecessaryCommands that do not contribute to the modeling process, but are necessary for software design reasonsCancel, Open file, Temporal hide, Visualization option
UnnecessaryCommands that should not have been executed, whether because they correspond to a different specialty, or are completely unnecessary for the advance of the projectMore than two ‘Cancel’ in a row
Table 2. Total number of commands executed by each designer.
DesignerTotalContributory CommandsNon-Contributory CommandsContributory Vs Backwards
GNGCNUB
Architectural94301770169372329132286572150
Structural64331353203228247092012961425
Mechanical55551032121141249672610391052
Electrical6523129616518429189949661401
Plumbing73601190366165310177617621309
G: Geometrical modeling; NG: Non-geometrical modeling; C: Collaborative; N: Necessary; U: Unnecessary; B: Backwards.
Table 3. Contributory commands most frequently used by the architectural designer.
Command IDDescriptionAbsolute FrequencyRelative Frequency
ID_EDIT_MOVEMove selected objects or their copies36916.0%
ID_FINISH_SKETCHFinish sketch33930.6%
ID_OBJECTS_WALLCreate a wall23740.9%
ID_FILE_SAVE_TO_MASTER_SHORTCUTSave the active project to the central model again18248.8%
ID_OBJECTS_CURVE_LINECreate a line16956.1%
ID_FILE_SAVE_TO_MASTERSave the active project to the central model again12561.5%
ID_EDIT_MOVE_COPYMove copies of selected objects11366.4%
ID_OBJECTS_CURVE_RECTCreate a rectangle5668.8%
ID_SPLITDivide walls and lines4570.7%
ID_REVIT_FILE_SAVESave the active project4472.7%
ID_EDIT_MATCH_TYPECopy the object type to other objects4074.4%
ID_OBJECTS_DOORCreate a door3976.1%
ID_OBJECTS_CW_GRIDCreate a grid line in a curtain wall3877.7%
ID_OBJECTS_MULLIONCreate a mullion3379.1%
ID_LOAD_INTO_PROJECTSLoad document into open projects3380.6%

