Review

Optics Based Label-Free Techniques and Applications in Brain Monitoring

1
Research Unit of Medical Imaging, Physics and Technology, Faculty of Medicine, University of Oulu, 90220 Oulu, Finland
2
Optoelectronics and Measurement Techniques Research Unit, Faculty of Information Technology and Electrical Engineering, University of Oulu, 90570 Oulu, Finland
*
Author to whom correspondence should be addressed.
Appl. Sci. 2020, 10(6), 2196; https://doi.org/10.3390/app10062196
Submission received: 6 February 2020 / Revised: 17 March 2020 / Accepted: 19 March 2020 / Published: 24 March 2020
(This article belongs to the Special Issue Optics and the Brain)

Abstract

:
Functional near-infrared spectroscopy (fNIRS) has been utilized already around three decades for monitoring the brain, in particular, oxygenation changes in the cerebral cortex. In addition, other optical techniques are currently developed for in vivo imaging and in the near future can be potentially used more in human brain research. This paper reviews the most common label-free optical technologies exploited in brain monitoring and their current and potential clinical applications. Label-free tissue monitoring techniques do not require the addition of dyes or molecular contrast agents. The following optical techniques are considered: fNIRS, diffuse correlations spectroscopy (DCS), photoacoustic imaging (PAI) and optical coherence tomography (OCT). Furthermore, wearable optical brain monitoring with the most common applications is discussed.

1. Introduction

Conducting brain studies by electroencephalography (EEG), magnetoencephalography (MEG) and functional magnetic resonance imaging (fMRI) is a common practice in modern neuroimaging. Using EEG and MEG, signals generated by the neuronal activities can be measured with a time resolution of less than one millisecond. MEG has a spatial accuracy of a few millimeters under favorable conditions, whereas EEG has a spatial resolution on the centimeter scale [1,2]. Since the discovery of the blood oxygen level dependent (BOLD) contrast by Ogawa in 1990 [3], BOLD imaging using fMRI leads neuroimaging. Moreover, new fMRI scanning techniques have enabled improvements also in fMRI time resolution, e.g., magnetic resonance encephalography (MREG), offering ten times higher time resolution than before [4,5]. However, one major weakness of fMRI and MEG is the fact that the subject has to stay unmoving inside the scanner. Consequently, there is still a strong need for methods that do not suffer from this restriction. For this, optical techniques, in addition to EEG, offer high potential due to their portability and adaptability [6]. Complementing each other, these two methods have a growing interest especially to be utilized in wearable brain monitoring applications [7].
Within the last two decades, optics based brain monitoring has grown intensively. In general, the sensing principle is based on light absorption and scattering, which are responsive to functional changes in tissue [8]. Light can also reveal information on the morphological structure of the brain, however, still very limitedly in human brain imaging, because of strong light scattering and absorption caused by human skull and scalp [9]. In functional monitoring of the human cerebral cortex, optical techniques have many advantages over other neuroimaging methods. Generally, they are safe, more cost-effective and commonly do not require a special environment, thus in this regard can be easily translated to clinical applications [10]. Importantly, it is also possible to exploit different optical modalities in parallel to gather various neuronal functions and blood flow-related parameters simultaneously.
In particular, functional near-infrared spectroscopy (fNIRS) is already becoming a common method in human neuroimaging. In contrast to fMRI BOLD, it provides a possibility to monitor cortical neural activity related dynamics of both oxy-hemoglobin (HbO) and deoxy-hemoglobin (HbR), also in wearable applications [11]. Closely related to fNIRS, diffuse correlations spectroscopy (DCS) provides a direct measure of blood flow dynamics, based on detection of scattering of photons due to red blood cells (RBCs) in blood flow [12]. However, both fNIRS and DCS still have a limited spatial resolution. Photoacoustic imaging (PAI) is a relatively new method for brain monitoring, which has both advantages of the high contrast of optical imaging and high spatial resolution of ultrasound [13]. PAI has achieved success in animal research based on an increasing amount of publications but is still rarely used in human brain imaging because of the thick skull effect. Optical coherence tomography (OCT) [14] can provide accurate spatial information as well as good temporal resolution, but because of limited penetration depth it is in practice not used in human brain studies. Even so, PAI and OCT play an essential role in translational medical research when imaging and quantifying brain morphology and brain function on a microscopic scale. These are commonly performed using rodent models, e.g., to study diseased brain.
In this paper, we review the current stage of fNIRS, DCS, PAI and OCT techniques in brain monitoring, see Table 1. We highlight the specific advantages of these techniques and review their currently most potential clinical applications for the 2020s. In addition, wearable use of optical techniques in brain monitoring are discussed.

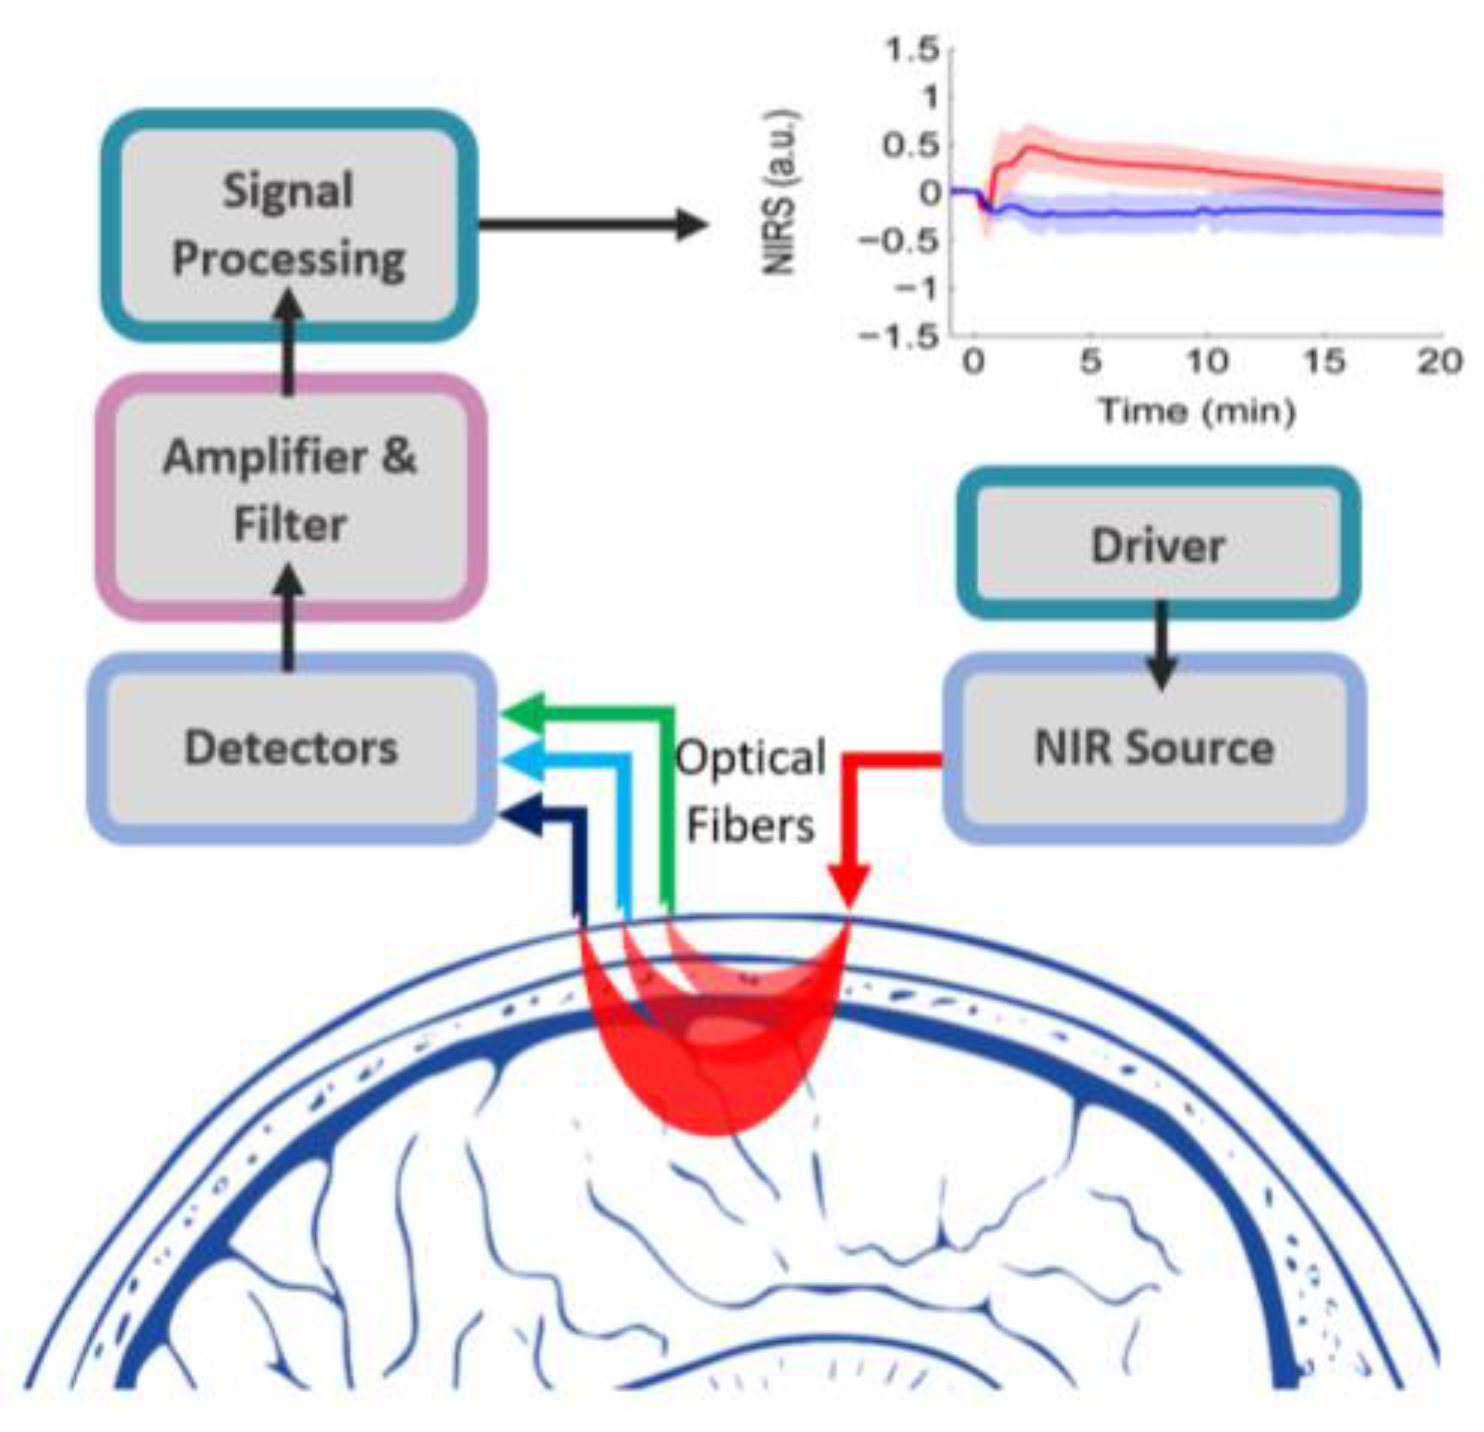
2. FNIRS in Human Brain Imaging

FNIRS, or diffuse optical spectroscopy (DOS), is mainly utilized for measuring oxygenation changes in the cerebral cortex that are linked to brain function. The principle of fNIRS is based on absorption and scattering which are wavelength-dependent. Each chromophore (a light-absorbing molecule) has a distinct absorption spectrum determined by its content and energy level structure. These spectra can be used as footprints for detecting individual compounds in tissue [8]. Most commonly the spectrum range between 660 nm and 950 nm is exploited to have sufficiently low light attenuation to enable light to penetrate in the brain. As a light source, most of these setups employ a high-power LED or laser diode (LD) and highly sensitive photodiodes (PD) to detect back-scattered light [39,40] see Figure 1.
FNIRS systems still use most commonly continuous-wave (CW) technique, where the illuminating light has a constant frequency and amplitude [41]. CW technique is relatively low cost and can be also miniaturized as a wearable system, however, it cannot provide the absolute value of HbO and HbR [42]. In CW, amplitude of each wavelength is usually modulated at frequencies of the order of few to tens in kHz range, for distinction of the wavelengths and enabling better sensitivity when using, for example lock-in amplification [40]. The time-domain (TD) technique uses a very short illuminating NIR pulse, generally with a pulse length of a few picoseconds, while the photon path-length is based on time-of-flight [43,44]. The technique is attracting increasing interest because of its recent technological developments, making it now more affordable, robust and smaller in size [45,46]. A third relatively common technique is the frequency-domain (FD) method, which is based on modulating the intensity of the illuminating light, at frequencies of the order of tens to hundreds of MHz, and detecting both the attenuation and phase delay [47]. Theoretically, TD and FD approaches can provide absolute values for hemodynamic changes because tissue absorption and reduced scattering coefficients can be determined directly [48].
Multichannel NIRS is often referred to optical brain topography [11,42,49] or tomography, when utilizing overlapping and multi-distance remarks [50]. For instance, Liao [51] developed high-density diffuse optical tomography (HD-DOT) to map functional activation of the visual cortex in healthy term-born infants. The functional images show a high contrast-to-noise ratio obtained in seven neonates. These results illustrate the potential for HD-DOT and provide a foundation for investigations of brain function in more vulnerable newborns, such as preterm infants. Shoaib et al. [52] presented an approach to optimize the 3-dimensional brain functional activation image with high resolution in order to enhance the spatial information of cortical activity. The proposed algorithm acquired significant results for 3D functional maps with high resolution, in comparison with that of 2D functional t-maps. Different NIR spectrometers and their key features and parameters have been reviewed in detail, for example, in the following publications (Ferrari et al., Wolf et al.) [11,53] and handbooks (Tuchin, Madsen et al.) [8,10].
Several commercial NIRS systems for brain monitoring are available [53] and some of them are mentioned in the following. For example, the Hamamatsu company has produced a compact and lightweight NIRS device (NIRO-200NX), aiming at clinical usage. It uses 3 wavelengths (735 nm, 810 nm and 850 nm) [54]. The OBELAB company developed NIRSIT system for prefrontal cortical sampling [55]. It is probably the first fNIRS system that can provide high spatial resolution (millimeter-level) while also providing high temporal resolution (125 ms/8 Hz). The Biopac company has a wide range of fNIRS devices, such as fNIR100, using wavelengths of 730 nm and 850 nm and, as receivers, silicon PDs (SiPD) with integrated transimpedance preamplifier [56]. NIRSPORT2 is the product of NIRx company which is completely wearable and portable. It can be combined also with EEG and fMRI for simultaneous recordings. It uses SiPD or avalanche PD (APD) in the receiver and 760 nm and 850 nm LEDs in the source [57]. The Rogue research group designed for clinical applications ’BrainSight’ which uses laser diodes (705 nm and 830 nm) and Si APD and SiPD detectors [58]. The Hitachi ETG-4100 consists of 695 nm and 830 nm laser diodes and provides 2D topographic images [59]. The TECHEN company has developed a real-time DSP-based system, namely CW6. It can monitor in real-time the entire head using up to 32 lasers and 32 detectors. Utilizing the CW6 32x32 system, it is possible to acquire data for 32x32 or 1024 individual raw signal measurements at an improved spatial resolution [60]. Another NIRS producer is Artinis with a wide range of NIRS devices [61]. It also produces fNIRS-EEG and transcranial direct electrical stimulation (tDCS) packages. Starstim fNIRS is an fNIRS-EEG-tDCS product which includes up to 24 channels for fNIRS and 32 channels for both tDCS and EEG. The wavelengths for fNIRS are 760 nm and 850 nm [62]. Imagent, the ISS company’s fNIRS product, is an MRI compatible device which has up to 512 channels. It utilizes the FD technique and up to 64 LDs emitting at 690 nm and 830 nm and up to 32 photomultipliers tubes (PMTs) as detectors [63].

2.1. Current Clinical Applications of fNIRS

FNIRS is currently developed for various clinical applications, but still in most cases in proof of principle (PoP) phase. In oncology, fNIRS has a potential usage, e.g., in preoperative localization of tumors [64] and in cancer therapy monitoring. Saxena et al. [65] studied the vascular status and pathophysiological changes that occur during tumor vascularization in an orthotopic brain tumor model. They monitored HbO, HbR and water concentration changes within the tumor region and found a direct correlation between tumor size, intratumoral microvessel density and tumor oxygenation. The relative decrease in tumor oxygenation with growth indicated that, although blood vessels infiltrate the tumor region and proliferate in it, a hypoxic trend is clearly present. Furthermore, a preclinical study on a murine model of head and neck cancer suggests that monitoring of tumor oxygenation status could be used to predict treatment outcome in solid tumors [66].
Recently, fNIRS has been utilized before neurosurgical operation to map language areas in patients suffering from tumors such as glioma [67,68] and to assess oxygen status in patients with glioblastoma [68,69]. Presurgical evaluation of language functions is of great importance in brain tumor patients to spare these areas during surgery and to reduce the risk of postsurgical language deficits [67,68]. FNIRS offers a valuable and easy tool for the identification of essential language functions, especially in children. Sato et al. [68] demonstrated that expressive and receptive language functions can be identified separately using fNIRS in presurgical glioma patients. Further, Gallagher et al. [67] showed that fNIRS permits identification of language networks in children at rest, i.e., without them needing to perform a task. They acquired fNIRS data at rest and during an expressive language task using a FD NIRS device (Imagent, ISS Inc) equipped with 8 detectors and 64 sources (32 at 690 nm and 32 at 830 nm). FNIRS fibers covered the bilateral frontal and temporal areas to measure brain activity in the anterior and posterior language-related regions, Broca’s and Wernicke’s areas and the Brodmann area. Results obtained in a resting state were compared to those of a more conventional task-based fNIRS measurement. This comparison indicated very good concordance between both approaches for language localization and hemispheric language dominance.
Rizki et al. [70] utilized 44 channels (695 nm and 830 nm) together with EEG to localize an epileptogenic zone before the presurgical evaluation of epileptic patients. Use of fNIRS solves problems in ictal single-photon emission computed tomography (SPECT), Ictal PET and EEG/fMRI, by avoiding the risk of putting patients with epilepsy in the MRI chamber. A similar study was conducted by Pouliot et al. [71], who used fNIRS-EEG to quantify nonlinear hemodynamic responses of human refractory focal epilepsy. They recommended routinely checking for nonlinearities in functional imaging of patients presenting with frequent spikes. Adorni et al. [72] proposed fNIRS application within the clinical psychology area because it has several important advantages over currently used methods such as fMRI and PET. In terms of cost, fNIRS is much more affordable and is suitable for all patients, while fMRI must consider the specific condition of the patients.
Maidan et al. [73] and Nieuwhof et al. [74] conducted a study to use fNIRS to monitor the frontal lobe and prefrontal cortical respectively in complex walking tasks among patients with Parkinson’s disease and healthy older adults. They observed a different pattern of frontal activation while walking between two groups, which may have important implication for the rehabilitation of gait in patients with Parkinson’s disease. Rea et al. [75] conducted a pilot study using fNIRS-BCI (brain-computer interface) for gait rehabilitation. They showed that fNIRS can potentially detect brain activity associated with single-trial lower limb motor preparation in stroke patients. This opens further investigations of using fNIRS for BCI application for patients’ rehabilitation with lower limb motor impairment caused by stroke.
FNIRS has been used to explore brain functional connectivity in rest and sleep states [76]. The goal was to create a network based on the correlation coefficient of the hemodynamic response among the 133 fNIRS channels. This study found that fNIRS can be used to study brain connectivity during rest and sleep states. Anesthesia monitoring can also utilize fNIRS by monitoring the changes of cerebral hemodynamic from forehead [77,78]. Using the frequency-division multiplexing principle, Liang et al. [77] showed that different brain states under propofol and sevoflurane can be spotted based on the HbO, HbR and total hemoglobin (HbT) monitored by fNIRS. Examining signals from 19 subjects, Hernandez-Meza et al. [78] found a significant reduction in a global mean of HbO, HbR and HbT as the subjects transitioned from maintenance to emergence. However, additional fNIRS biomarkers calculated from local hemodynamic changes can be used for real-time monitoring of the emergence from anesthesia with sevoflurane. In addition, fNIRS makes hemodynamic measurement more practical as it is possible to use it in operating room environment.
The use of fNIRS shows special potential for children and infants monitoring. Altvater-Mackensen et al. [79] and Vannasing et al. [80] used fNIRS to measure brain hemodynamics from the frontal cortex of infants during language stimulation. From this exploration, they found lateral activation of the cerebral cortex during stimulation. In addition, Urakawa et al. [81] and Lloyd-Fox et al. [82] found increasing activity of the medial prefrontal cortex when infants interact with their parents and other infants. Using fNIRS for infants requires special attention to the power of the light due to fragility of their skin.
Recent studies also show the potential use of fNIRS for animal models. Zaidi et al. [83] measured hemodynamic activity from the primary visual cortex in anesthetized monkeys during visual stimulation. They found a robust and reliable response to the stimulation. FNIRS can be used in animal models to study specific diseases, which is useful when similar studies are conducted in human. Roche-Labarbe et al. [84] studied hemodynamic changes associated with EEG spike-and-wave discharges in a genetic model of absence epilepsy in rats. The results were consistent with the metabolic studies, fMRI studies and some results in children with an absence of epilepsy. Abookasis et al. [85] monitored hemodynamic and morphologic response in a mouse model to study brain damage. The results confirmed the potential of using fNIRS as a valuable quantitative non-invasive tool for brain monitoring after brain damage at the bedside and/or on the field.
FNIRS recordings are possible to compare between animal and human experiments, e.g., to validate it with combined microscale measurements gathered from animals. In Biocenter Oulu, Finland, researchers are developing a scale-free monitoring concept that enables monitoring physiological signals similarly when performing experiments in mouse and human neuroimaging setups. By combining microscopic imaging, such as photo acoustic microscopy (PAM) and multi photon microscopy, with macroscopic monitoring, such as fNIRS and EEG, in mouse experiments improves possibilities to study correlations between mechanistic cellular data and clinical functional data. Furthermore, when translating new methods to clinical practice, such multiscale concepts enable to validate and optimize macroscopic sensing and imaging techniques [86].
Neurodegenerative disorders such as Alzheimer’s disease (AD) are characterized by the accumulation of proteins in the brain before cognitive decline emerges. According to recent studies, the protein accumulation is caused by a failure of the glymphatic brain clearance system and the memory decline in demented mice has been successfully treated by increasing the protein clearance [87]. In this research, fNIRS has the potential to provide information on the glymphatic activity of the brain [88].
Monitoring blood-brain barrier (BBB) opening is of great interest in terms of brain drug delivery. Although proper opening of the BBB is crucial for successful treatment, there is no clinically approved method for monitoring it. Kiviniemi et al. [89] used fNIRS combined with EEG to monitor primary central nervous system lymphoma patients during BBB opening aiding the chemotherapy. FNIRS detected a remarkable multiphasic response reflecting BBB opening and gradual closing, making the method potentially applicable for monitoring BBB opening during brain chemotherapy.

2.2. Towards Wearable Brain Monitoring Using fNIRS

A possibility to build a wearable fNIRS device and provide long-term monitoring opens tremendous new opportunities for clinical monitoring and diagnostics. In general, a wearable fNIRS system requires considering some important aspects such as portability and wearability [90], configurability [90,91,92,93,94] and real-time data processing and visualization [94]. In addition, experimental validation, low power consumption, appropriate post-processing is required to handle motion artefacts, such as, principal component analysis [95], independent component analysis [96], Kalman Filter [97], correlation-based signal improvement [98], wavelet [99] and spline interpolation [100]. On the other hand, signal processing algorithms must be relatively light for the sake of battery life. Further, to enable long term clinical monitoring, the stability of the optical contact with the scalp is of high importance [101].
Table 2 presents some important works on wearable fNIRS along with the configurations and studies/applications. Wearable fNIRS studies have been increasingly conducted. Piper et al. [19] developed a wearable multichannel fNIRS using eight channels having wavelengths of 760 nm and 850 nm. Pinti et al. [102] explored the use of a wearable fNIRS to monitor brain activity during a real-world prospective memory task. The system was covered with a black cap to avoid ambient light during outdoor experiment. Chitnis et al. [91] and Funane et al. [92] developed a wearable fNIRS with modular optodes. To enable brain hemodynamics and metabolism monitoring at different depths, Chitnis et al. [93] and Wyser et al. [94] implemented a multi-distance fNIRS. The WearLight was developed by Saikia et al. [90] as a configurable wearable fNIRS. It was a battery-operated system with CWfNIRS that can be configured up to 128 channels with 8 dual-wavelength (750 nm and 850 nm) LEDs. Commercial wearable fNIRS are also available on the market [103].
For example, a wearable fNIRS was used to evaluate mental health [104]. It reported studies on measuring inter-participant interaction using hyper scanning and practical application of evaluating the mental state of participants in a return-to-work program. During the exploration, a wearable NIRS system measured changes in cerebral blood during a performance of working memory. Further, the mood state was inferred from the NIRS signal and results were compared with a so called profile of mood states (POMS) questionnaire.
Another study used a wearable fNIRS to provide signals as biofeedback for stress management in daily hassles [105]. It measures cerebral blood flow from the rostrolateral prefrontal cortex (RLPFC) to the frontopolar cortex and heart rate as the biological signals associated with blood flow. The hypothesis was that learning to regulate the activity of the RLPFC/frontopolar cortex would help to change the negative mood and thought patterns. In addition, to enhance stress-coping skills by learning to regulate the access to internal states. They found that the biofeedback had effects on the regional gray matter variation, psychological test scores and salivary cortisol levels were associated with daily hassles.
A compact wearable system consisting of fNIRS, electrocardiography (ECG) and acceleration sensors was developed for 24 h ambulatory monitoring of cerebral hemodynamics, systemic hemodynamics, ECG and actigraphy [83]. Piper et al. [19] and Pinti et al. [102] developed a wearable multichannel fNIRS to monitor brain activity for outdoor use with normal daily activities, such as walking, cycling and meeting other people.

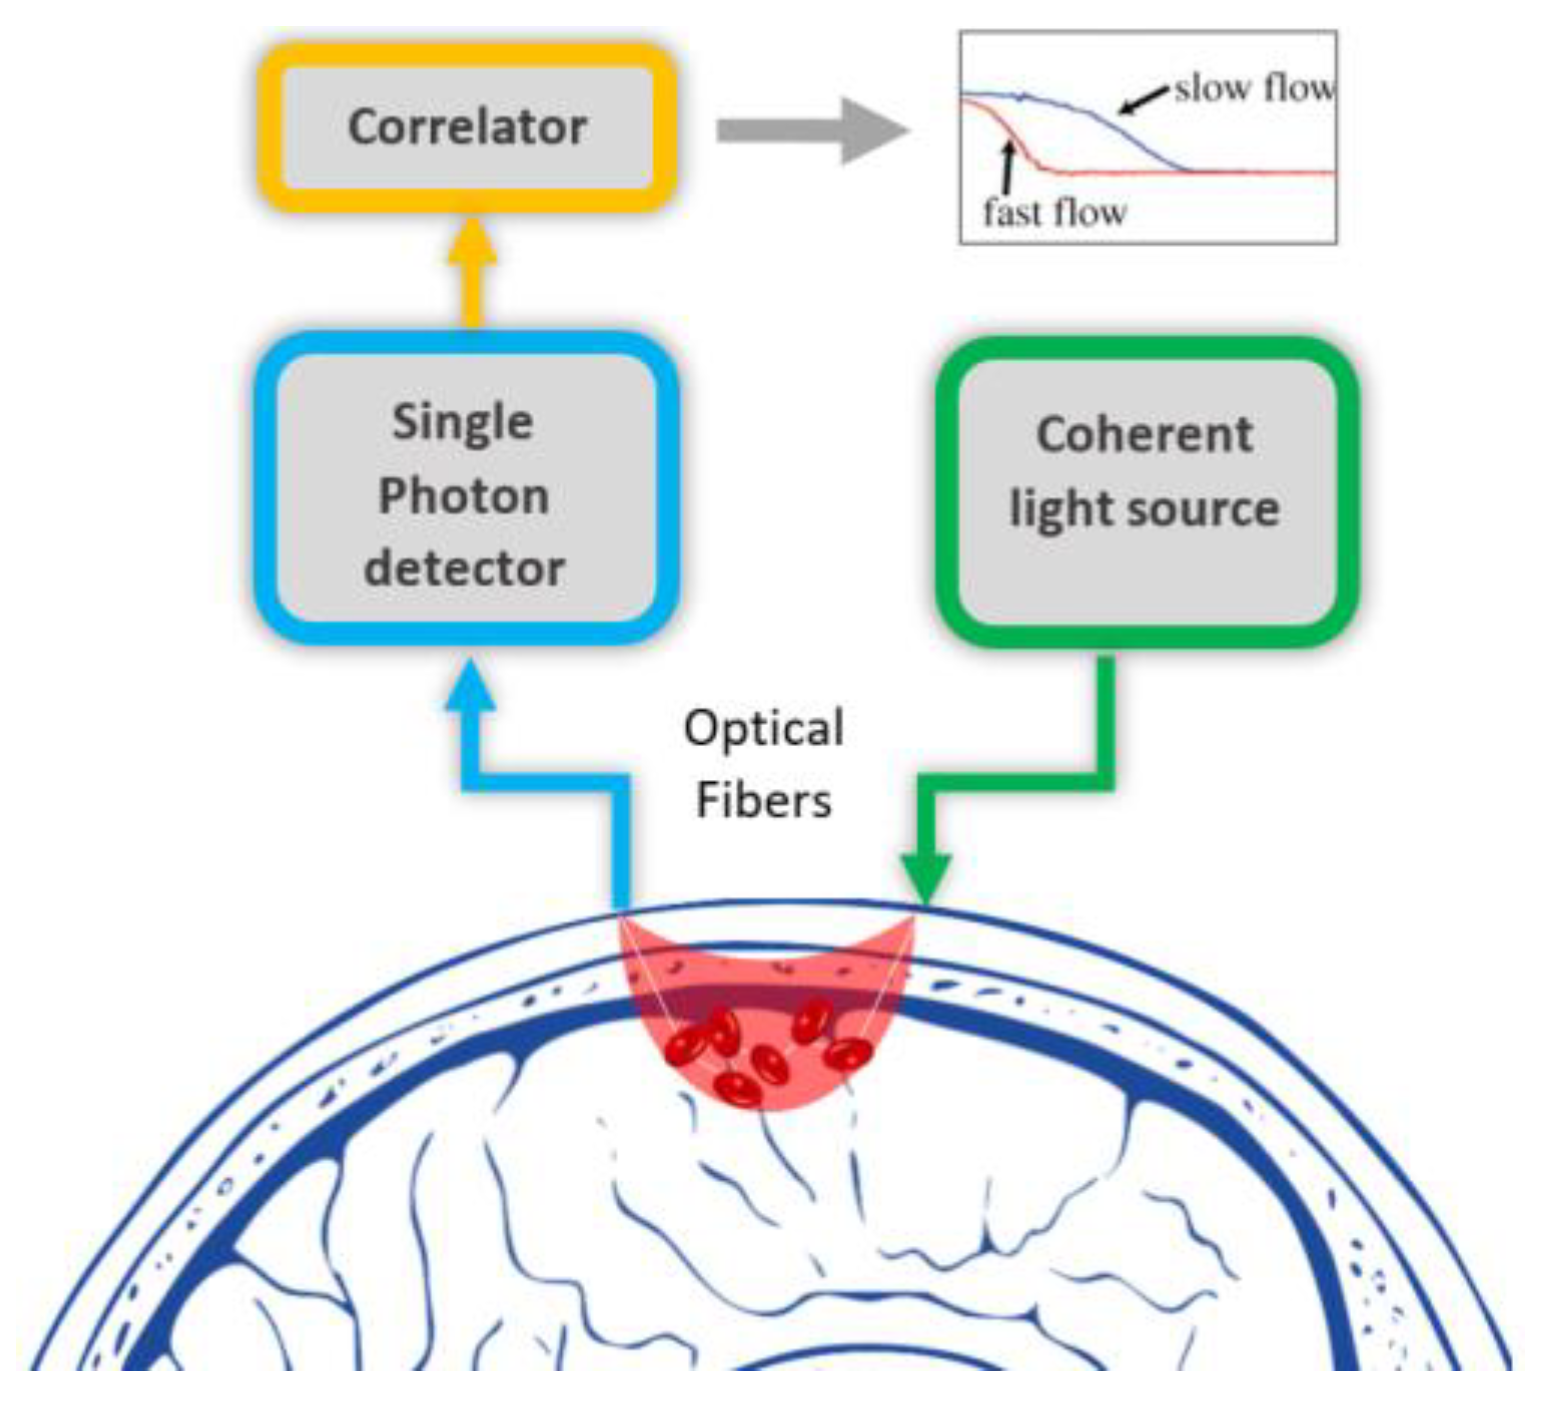
3. DCS Technology Used Currently in Human Brain Imaging

DCS technique is based on temporal speckle fluctuations of the diffused light, reflecting blood flow in the microvasculature. In several medical applications, particularly in neurology, DCS is becoming an essential tool. To measure the blood flow index (BFI), DCS needs optical properties of tissue: reduced scattering and absorption coefficients ( μ s and μ a ). The principle of DCS technique is well described in several papers, for instance by Farzam and Durduran [107]. The correlation diffusion equation is based on the well-known radiation transport equation (RTE) with some applied approximation. Basically, DCS gains the target hemodynamics by measurement of the temporal electric field autocorrelation function (G1). This important quantity relates to the percentage of moving scatterers over all scatterers (α), effective diffusion coefficient (DB), μ s and μ a . So, a typical DCS system should be able to solve the correlation diffusion equation [21]. In Figure 2, the main components of a DCS setup are shown.

3.1. Current Clinical Applications of DCS

In cancer diagnosis and therapies DCS shows high potential, because tumors, due to their extraordinary metabolic demand, have high concentration of HbR accompanied by the low oxygen saturation [108]. Thus, monitoring of tumor hemodynamics in the cancer therapy procedure is highly noteworthy since cancer therapy can modify tumor’s region metabolic status, and generally, the combination of DCS and fNIRS can be beneficial to assess tumor hemodynamics e.g., before, during and after the therapy [109,110]. Usability of DCS-NIRS has been studied for this purpose to some extent, for instance, in the detection and comparison of breast tumor blood flow between healthy and patient subjects [111,112]. Another application of DCS-NIRS is the therapy procedure monitoring in photodynamic therapy (PDT) [113]. Furthermore, for neural health straightforward assessment, cerebral oxygen metabolism (CMRO2) is a clue parameter. DCS-NIRS can provide vital information regional CBF and regional oxygen delivery, resulting regional CMRO2 [114].
DCS has been also applied to evaluate special parameters like intracranial pressure (ICP) and rate of CMRO2. ICP measurement is preferable for diagnosis of disorders like hydrocephalus and meningitis. ICP variation can affect CBF. In the methods presented in the patent [113], DCS measures specifically pulsatile CBF (PCBF). PCBF and some other biological parameters contribute in ICP calculation [113]. In 2010, Roche-Labarbe et al. [17] conducted a study on 11 premature neonates using FD-NIRS and DCS. They quantified cerebral blood volume (CBV), cerebral tissue oxygenation (StO2), CBF index (CBFi) by FD-NIRS and rate of CMRO2 by DCS. This setup of data is certainly valuable to care neonatal brains who suffer from perinatal brain injuries. Another therapeutic application, cerebral hemodynamics monitoring during mechanical thrombectomy treatment, was performed using DCS-NIRS to identify CBF changes and hemodynamics [115].
Giovannella at el. [116] employed functional DCS (fDCS) and time-resolved fNIRS (TR-fNIRS) together with EEG during stimulation. By using this setup, they have observed the increment of CBF and HbO concentration but decrement of HbR during and after active stimulation in the region. To expand the use of DCS, Mesquita et al. [117] utilized DCS to quantify blood flow and fNIRS for Hb concentrations and reported that low-frequency (1 Hz) repetitive transcranial magnetic stimulation (rTMS) affects CBF and tissue oxygenation.
In addition, it can be beneficial to imply the DCS usages for neurocritical patients. Head-of-bed manipulation is done for continuous monitoring CBF in neurocritical patients [118]. Kim et al. [119] conducted a study in seven patients during induced blood pressure changes and carbon dioxide arterial partial pressure variation. Their hypothesis was CBF/oxygenation measurement using DCS, comparing with xenon-enhanced computed tomography (XeCT) concurrently, in frontal lobes. The study showed that DCS and NIRS measurements can be successfully done in critically injured brain patients.

3.2. Wearable DCS Devices And the Commercial Ones

A wearable technique to monitor absolute blood flow is presented in the patent [120]. This patent determines absolute blood flow using DCS technique and optical data is produced in faster manner even more than pulsatile frequency of a cardiac cycle. Afterwards, pulsatile blood flow measurement, as well as absolute blood flow measurement are done. Absolute blood flow is valuable for the diagnosis and treatment of patients with a wide range of medical disorders like traumatic brain injury [120]. Plus, a research team recently developed a fiber-less diffuse speckle contrast flowmeter (DSCF), which provides a low-cost device for monitoring of blood flow variations in relative deep tissues (up to ∼8 mm depth). This depth is usually sufficient for detecting CBF in newborn infants. The setup employs a CCD chip with no lens to detect any spatial fluctuation of laser speckles due to RBCs movement [22,23,121].
As mentioned before, FD-NIRS measures the phase and frequency of modulated light [24,25] and TD-NIRS detects the time of flight of short light pulses in the tissue [26,27]. For commercial products, Carp et al. [122] introduced “MetaOx” which works based on FD-NIRS and DCS instruments. For using NIRS-DCS pair simultaneously, it is necessary to resolve the problem of two light source interference and their detection. The presented setup includes 8 light wavelengths (670, 690, 705, 730, 760, 780, 810 and 830 nm) for FD-NIRS and one 850 nm long coherent laser for DCS. In the receivers’ part, four PMTs and four APD are employed. Such a setup provides significant features: the usage of PMTs makes higher modulation depth possible and using 4 APDs for DCS allows multiple separation measurements resulting in a better signal to noise ratio (SNR).
For the future vision of wearable DCS, making probes compact, mounting the detector and source closer (lower than 1 cm), are surely necessary. According to the banana-shaped paradigm of light propagation in the tissue, when the separation is very low, the deeper traveled photons will be lost. The solution is using a time-gated DCS method based on the possibility of the switching off and on the detector (time gating) to receive the deeper traveled photons. These photon’s traveling time differs from the photons traveled only in the surface. It allows using a detector very close to the coherent light source, resulting in more compact probes for brain wearable devices [123]. In addition, the main challenge for conventional DCS is the need for the tissue’s optical properties. By using TD-DCS mode, it is possible to find the optical properties and BFI at the same time. Sutin et al. [20] fabricated a prototype of TD-DCS and used an 852 nm laser combined with an electrically pumped taper diode amplifier to increase the maximum optical power while retaining the coherence length. The employed receiver is a new single photon APD (SPAPD) which can detect the photons with high sensitivity and time resolution. Development of TD-DCS, instead of using the NIRS-DCS pair can be an alternative for simplification of the next generation of DCS brain monitoring devices.

3.3. Animal Studies

DCS based measurement of CBF is also attractive in animal studies. In 2010, Carp et al. [12] measured CBF in rat stepped during hypercapnia and validated simultaneously arterial spin labeling (ASL) MRI. The result from both methods were consistent. A similar study was done by Diop et al. whose goal was measurement of absolute CBF in piglets using DCS and time-resolved NIR (TR-NIR) techniques, also a flow tracer. TR-NIR method can extract absolute CBF from DSC data. The measured CBF changes by TR-NIR and the measured diffusion coefficient by DCS were strongly correlated [124]. This group also performed this setup to show the absolute CMRO2 changes. In addition, they determined cerebral venous blood oxygenation (SvO2) in newborn piglets [125].
In a study on sheep, DCS-DOS setup has been used to discover spinal cord ischemia in ten adult Dorset sheep. The interesting point in this complicated setup is the usage of one source fiber switched between three amplitude modulated (70 MHz) laser diodes (686, 785 and 830 nm) for NIRS and two SPAPD for DCS [126].
Another work by Zhou et al. [127] conducted on piglets simulated the following conditions of traumatic brain injury. They used two different diffuse optical techniques, DCS and diffuse reflectance spectroscopy (DRS) to quantify cerebral blood oxygenation and blood flow continuously and noninvasively before the injury and up to 6 h after the injury. The DCS rCBF results were compared to the fluorescent microsphere method successfully. In 2011, Shang et al. presented a DCS flow-oximeter for monitoring both CBF and cerebral oxygenation in mice simultaneously and validated it with laser Doppler measurement. Their aim was transient forebrain ischemia monitoring. To model the transient forebrain ischemia, some occlusions in bilateral common carotid arteries (bi-CCA) were made. It was observed that the results of the DCS flow-oximeter is highly close to the laser Doppler technique [128]. In 2018, researchers tried to combine DCS for CBF monitoring and broadband NIRS (B-NIRS) for monitoring the oxidation state of cytochrome c oxidase (oxCCO). oxCCO is the main indicator of oxidative metabolism. This study was done in a piglet model of neonatal hypoxia-ischemia (HI). The results demonstrate that simultaneous neuromonitoring of perfusion and metabolism could provide vital alerts of brain injury, especially in preterm infants born [129].

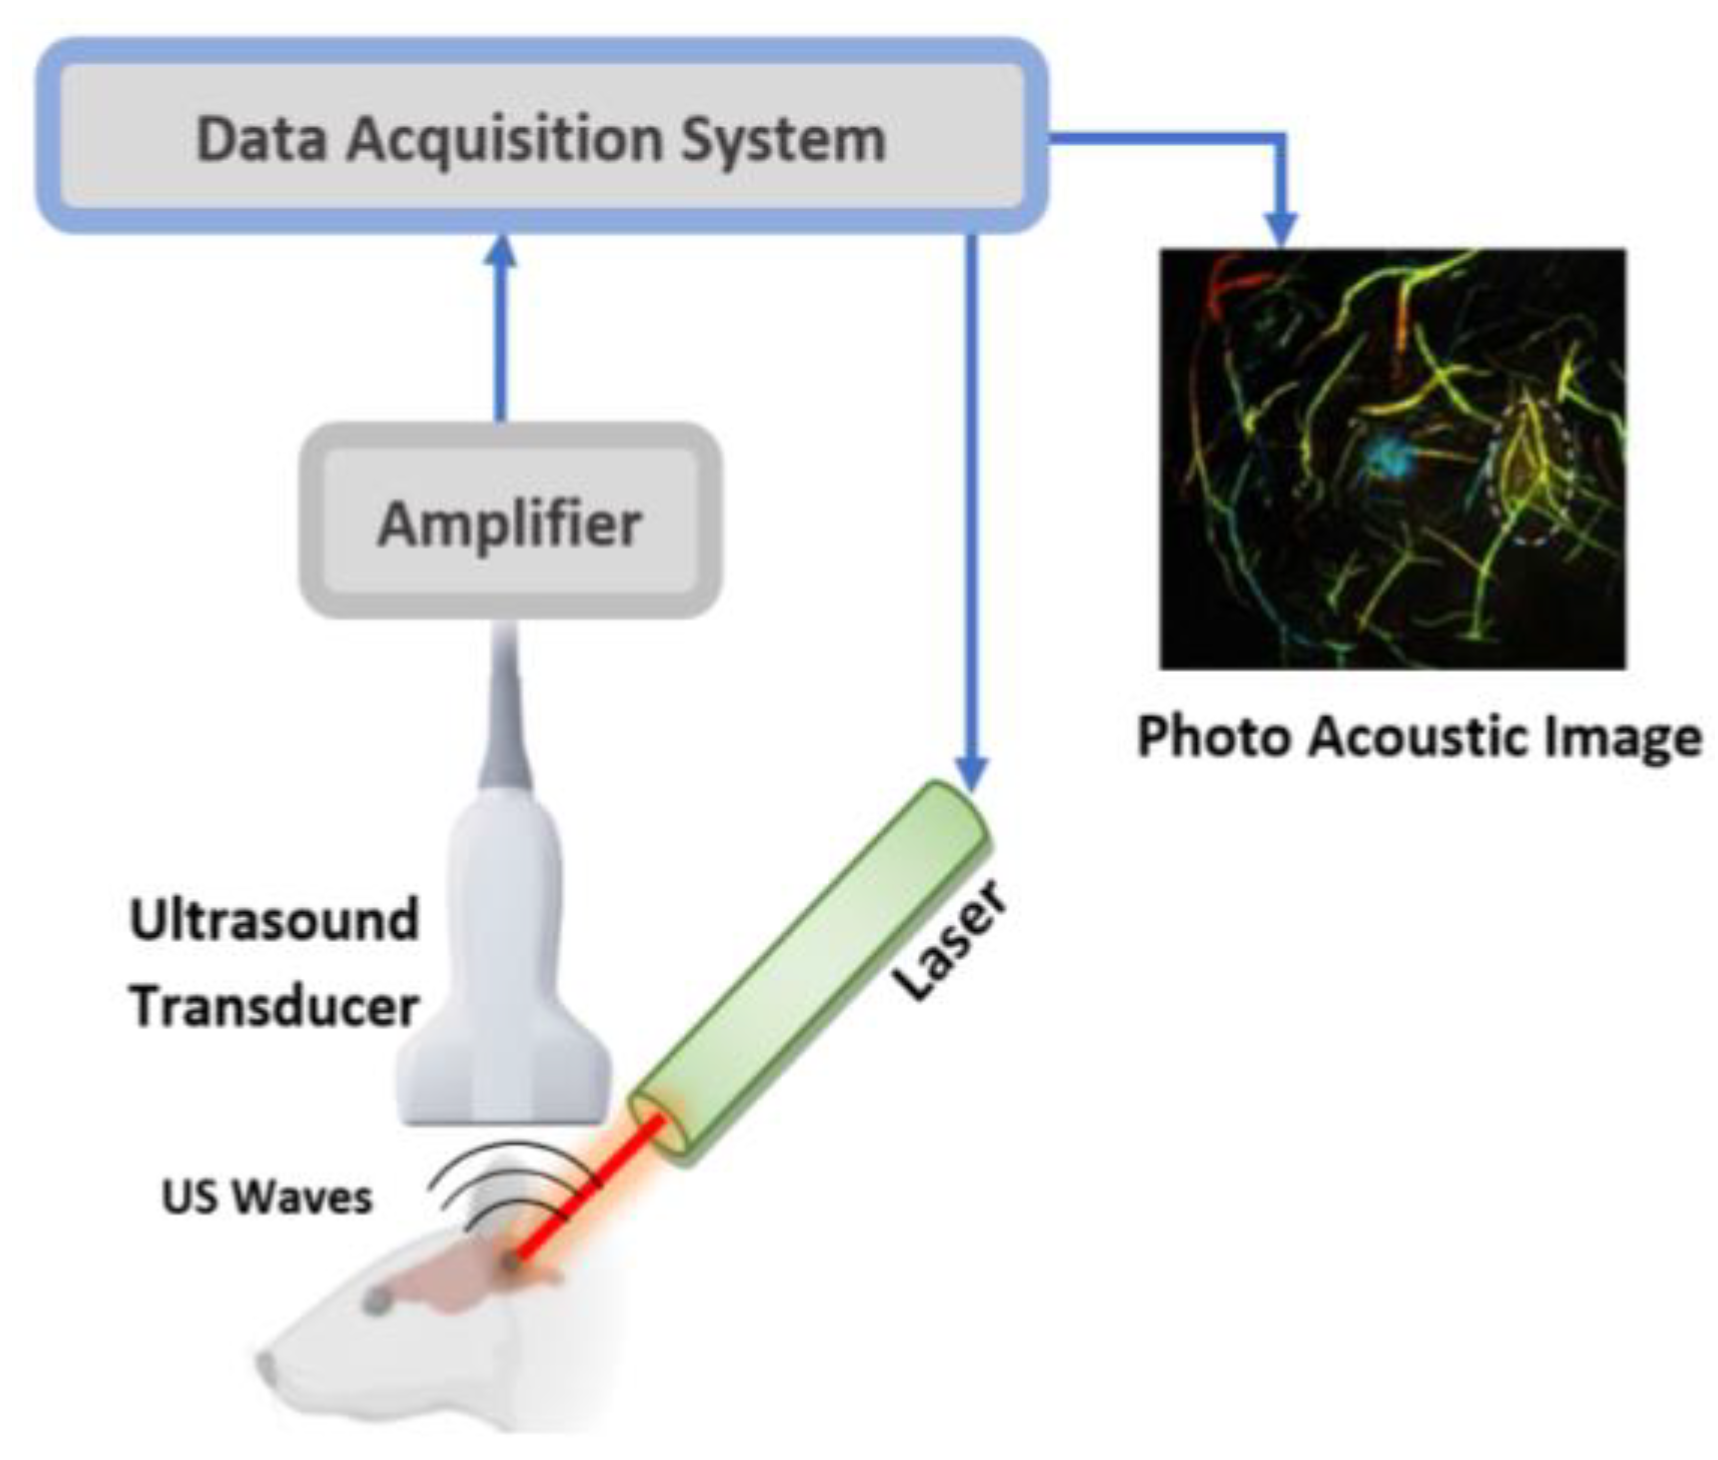
4. Current PAI Technology Used in Brain Imaging

Noninvasive imaging is highly important for the detection and management of cerebral abnormalities and neuroscience research. Imaging and monitoring of cerebral blood oxygenation are necessary for diagnostics and management of patients with traumatic brain injury, stroke and other neurological conditions. Compared with other deep imaging techniques, for example functional connectivity DOT or fNIRS, PAI has a better spatial resolution and pure absorption sensing. In addition, PAI can do molecular imaging by using a wide variety of optical biomarkers. Moreover, PAI can simultaneously sense blood oxygenation, HbT and blood flow.
There are several types of PAI techniques in development, roughly classifying as optical resolution PAM (OR-PAM, <1.5 mm imaging depth in soft tissues), acoustic-resolution PAM (AR-PAM, <5 mm depth) and photoacoustic computing tomography (PACT or PAT, <7 cm depth) with different imaging resolutions [13]. Although initial PAI was developed to image human breast cancer and tissue tumors from the 1990s, these techniques including AR-PAM, OR-PAM and PAT have successfully achieved great progresses in small animal study, such as in the fields of imaging brain (Figure 3), breast, ear, rear, abdomen or even all body, as well as internal organs such as arterial internal wall, esophagus lumen and colorectum (by so-called photoacoustic endoscopy, PAE). There is a huge amount of excellent publications in these important study fields.

Brain Studies Utilising PAI

An early-stage PAT system in structural and functional imaging mice brain vasculature was reported by Wang et al. [130]. Since then, many kinds of PA imaging systems were developed and many a great number of articles about brain imaging and monitoring are published. Recently, Nasiriavanaki et al. [30] employed PACT with a 512-element ring transducer array to perform functional analysis of resting-state functional connectivity (RSFC) on mouse. RSFC is of great importance in the study of stroke, AD, multiple sclerosis, autism, epilepsy, etc. Compared with other functional imaging techniques, functional PAT (fcPAT) provides higher resolution, and the ability of molecular imaging when combining with biomarkers. Tang et al. [31,131] described a more real-time miniature cap-like wearable PAT system, which can non-invasively image blood vessels at a depth of 5 mm. The system can be used for behavior, cognition and preclinical brain disease studies using animal models. Zhang et al. [32] developed a PACT system for non-invasive and label-free mapping of the microvascular network of the mouse brain and to study its hemodynamic activities. Spontaneous neural activities in the deep brain were studied by monitoring the concentration of Hb in blood vessels and strong inter-hemispherical correlations between several functional regions were observed during an epileptic seizure.
Deán-Ben et al. [132] developed a volumetric multispectral PAT platform for imaging neural activation deep in scattering brains. Experiments performed in immobilized and freely swimming larvae and in adult zebrafish brains expressing a genetically encoded calcium indicator. The study showed that PA has the ability to directly track neural dynamics while overcoming the longstanding penetration barrier of optical imaging in scattering brains.
PAI has a wider range of application in deep monitoring, diagnostic and therapy of brain diseases and activities by sensing injected exogenous agents such as nanoparticles and dyes. Guo et al. [133] designed and synthesized biocompatible conjugated polymer nanoparticles (CP_NPs) for highly efficient PAI of orthotopic brain tumors in the second NIR window. The CP_NPs had excellent photostability, high imaging contrast and penetration at 1064 nm. Moreover, these CP_NPs can be used in dual NIR-II fluorescence and photoacoustic imaging, which provides the possibility to noninvasively map deep microscopic brain tumors after focused ultrasound (FUS) induced BBB opening [134]. Usually, PAM has 3-mm imaging depth. To improve its imaging depth, mesoionic dye A1094 encapsulated in Arg-Gly-Asp-modified hepatitis B virus core protein (RGD-HBc) was designed and synthesized for effectively improving PAM imaging depth [135]. Nine-fold PA signal amplification in vivo was reported, and imaging depth is up to 5.9 mm with acoustic resolution. This gives a promise of A1094@RGD-HBc for diagnostic imaging and precise delineation of brain gliomas in clinical applications.
Recently, PAT is frequently used with exogenous agents in research related to BBB. Together with bone mesenchymal stem cells (BMSCs) to be labeled with modified Prussian blue, excellent near-infrared dyes and photoacoustic contrasts, PAT can improve observation and efficient therapy of traumatic brain injury (TBI) and rehabilitation [136]. The BMSCs proved to be capable of overcoming BBB with enhanced delivery of Prussian blue particles to the brain parenchyma. These labeled BMSCs were clearly observed by PAT to home to the damage region and repair the ruptured vasculature. Moreover, the wound treated by the BMSCs exhibited a much faster recovery speed than that without treatment. These potentially provide a noninvasive and high-resolution approach to image TBI, monitor recovery process. Another recent study by Kang et al. [137] used NIR voltage-sensitive dye (VSD) together with functional PAI for the transcranial recording of neural activity in the rodent brain. VSD was delivered through the BBB, opened by pharmacological modulation using adenosine receptor signaling. Normalized time-frequency analysis presented in vivo VSD response in the seizure group which was significantly distinguishable from the control groups at sub-mm spatial resolution. This gives a promising non-invasive tool for in vivo monitoring of brain activities. Finally, it is known that copper enrichment in the brain is highly related to AD pathogenesis, Wang et al. developed contrast agents with low molecular weights, which can specifically chelate with Cu2+ to form radicals with turn-on PA signals in the NIR region [118]. The agents significantly enhanced the radical stability and PA intensity in PAT. The best agent showed a fast response to Cu2+ with high selectivity and a low PA detection limit of 90.9 nm. Owing to the low molecular weight and amphiphilic structure, the agents could effectively cross BBB and thus allowed to visualize Cu2+ in vivo via PA imaging in the brains of AD mice.
Other than small animal imaging, PAI has been used in human soft tissue study, imaging from initial human breast tumors to vasculature or tissue abnormalities in arm, palm, finger and abdomen. However, photoacoustic imaging of the human adult brain is much more difficult due to much thicker human adult skull [33] which greatly attenuates incident light into and photoacoustic wave out of the brain.
It is known that human adult skull has a thickness of 7 mm to 11 mm, compared with less than 1 mm for small animals such as mouse [34]. Available research shows that, for example, in the optical tissue window near 1064 nm, there is only 2.1% light transmittance through the human skull [35]. Meanwhile, the skull produces 20 dB/cm acoustic attenuation at 1 MHz for the PA signal [138]. A so-called photon recycle was developed to increase light transmittance through skull, which improved the PA SNR by a factor of 2.4 and used to study functional activities of the human cerebral [35]. The attenuation and distortion of the skull for photoacoustic wave due to acoustic impedance mismatch between the skull and underlying tissue layers still need to further study [139].
In recent years, PAT systems have been developed for mapping cerebral blood oxygenation in human adults and neonates [36,140]. The systems provided noninvasive, transcranial PA imaging in the near-infrared tissue window. The systems measured blood oxygenation in neonates and adults at different lateral sites from the superior sagittal sinus (SSS), allowing for the mapping of cerebral blood oxygenation. Due to the skull thickness of a neonatal infant is only about 1.3 mm [37], much thinner than that of an adult, transcranial PA imaging of the human brain was therefore mainly focused on neonatal infant [37,128,141,142,143]. For example, Wang et al. [37] used PAT to image blood vessels through infant skull with 50 µm axial resolution and 420 µm lateral resolution. The imaging depth can be as deep as 21 mm or more. However, even though neonatal skull is thin, an accurate skull aberration correction algorithm [139,140,141] still needs in noninvasively PA imaging of the neonatal brain.
At last, it is worth mentioning that some researchers used big animal head to simulate child head in brain study by PAT, as both sizes are similar Yang and Wang applied PAT to image the brain cortex of monkey through the intact scalp and skull ex vivo [144]. Kang et al. [145] investigated neonatal piglets noninvasively, and to monitor HbO saturation in the cerebral SSS in vivo under varying conditions of hypoxia and ischemia.

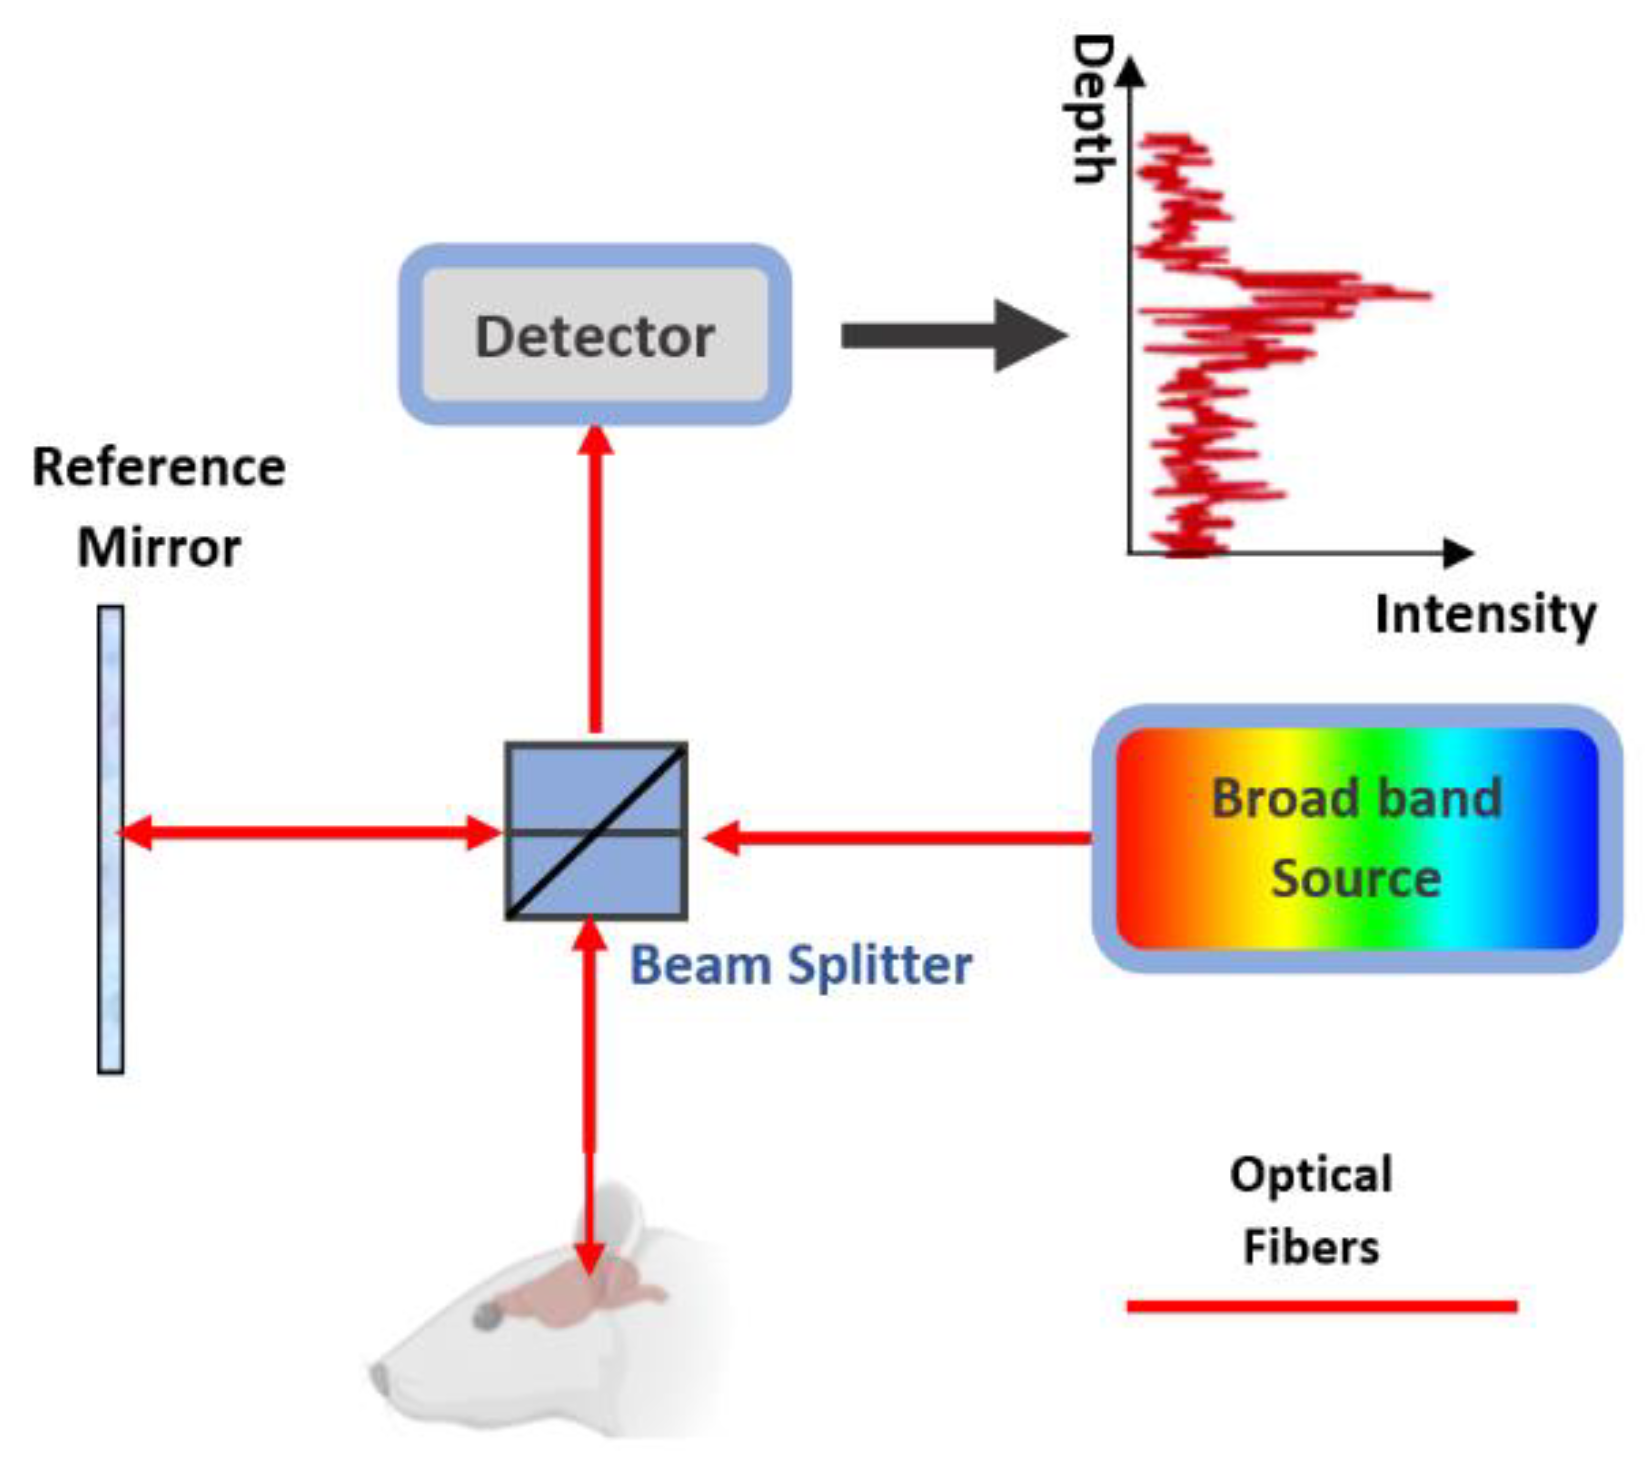
5. OCT in Brain Imaging

OCT is a micrometer-scale imaging modality for cross-sectional imaging of tissue microstructure based on light backscattering properties of tissue. Since its invention in the 1990s, OCT is widely used in several branches of neuroscience such as neuroimaging and neurosurgery. It also allows to measure rapid intrinsic optical signal (IOS) reflection of neuronal activity rather than delayed hemodynamic responses [146]. However, penetration depth of OCT is only up to 2-3 mm. Therefore, noninvasive structural imaging of the human brain is not possible, but the technique can serve as a supportive tool in experimental studies when using small animal models. However, OCT has been used in intraoperative guidance for brain surgeries in neurosurgical interventions, for example in deep brain stimulation therapy and microscope-integrated OCT, enabling surgeons real time imaging by visualizing the instrument-tissue interaction [38].
A basic OCT interferometer setup, shown in Figure 4, includes a broadband source, which is split by the beam splitter to the reference and to sample. The reference is a mirror. The backscattered light from the sample and reference are collected and allowed to interfere. The detector detects this interference pattern. The light source, sample, reference and detector are connected to the beam splitter using optical fibers [147].

5.1. OCT Studies on the Brain

Within the last few years, OCT has been used for in vivo imaging and mapping of cortical tissue in relation to evoked neural activity or peripheral sensory stimulation. Modulation of the optical refractive index by neuronal activity during activation of brain tissue coincides with changes in surface reflectivity [146].
OCT based angiography (OCTA), the first demonstration of the Fourier Domain-OCT (FD-OCT) based OCTA technique, was made in 2007 on a rodent cerebrovascular model using optical coherence tomography which was based on microangiography (OMAG) technique. With light source at 1300 nm central wavelength [148], the OMAG technique could non-invasively visualize pial vessels, but only roughly capillaries due to the sensitivity limitation. With the improvement of the system and the use of high-pass filtering of time series of OCT signals, in vivo imaging became available. Currently, longitudinal monitoring of vascular responses to stimuli in the cortex is possible [148]. In addition, changes in vessel diameters and microcirculation responses in the cerebral cortex during hypercapnia through a cranial window during hypoxia can be performed [148]. OCTA can be also used to quantify cerebral blood flow (CBF) in rat models. In addition to monitoring and measuring vasculature in the brain, OCTA techniques were able to monitor vasodynamics after stroke, detect ischemia regions, and capture the capillary response to a traumatic brain injury (TBI) in the cortex [148].
Chong et al. [149] developed a method to monitor the cerebral metabolic rate of oxygen (CMRO2) by combined Doppler and spectroscopic OCT. Measurements were performed using a single visible light spectral/Fourier domain OCT microscope, with Doppler and spectroscopic capabilities, through a thinned-skull cranial window in the mouse brain. However, the validation of the experiments does not prove the accuracy of CMRO2 measurements. Furthermore, Chong et al. [150] developed noninvasive, in vivo imaging of subcortical brain regions in mice. Imaging hippocampal tissue architecture and white matter microvasculature were demonstrated in vivo through thinned-skull, glass coverslip-reinforced cranial windows in mice. This imaging platform also includes applications to monitor disease progression and pathophysiology in rodent models of AD and subcortical dementias, including vascular dementia.
Park et al. [151] demonstrated the feasibility of non-invasive deep brain vascular imaging and reported the use of microvascular imaging in the hippocampal formation of mice using a 1.7 μm swept-source OCT system. The imaging results demonstrated that the proposed system can visualize blood flow at different locations of the hippocampus corresponding with deep brain areas.

5.2. Current Clinical Trials Using Integrated OCT in Human

Hartmann et al. [152] experimented the visualization of the human subarachnoid space and brain cortex explored using OCT as a suitable in vivo neuroimaging modality of subarachnoid space. Patients (n = 26) with front lateral craniotomy were experimented on. The temporal and frontal arachnoid mater and adjacent anatomical structures were scanned using microscope-integrated three-dimensional OCT (iOCT). Analysis revealed a detailed depiction of the subarachnoid space (SAS) (76.9%) with delineation of the internal microanatomical structures such as the arachnoid barrier cell membrane (ABCM; 96.2%), trabecular system (50.2%), internal blood vessels (96.2%), pia mater (26.9%) and the brain cortex (96.2%). Orthogonal distance measuring was possible. The SAS showed a mean depth of 570 µm frontotemporal. The ABCM showed a mean depth of 74 µm frontotemporal. These results indicate that OCT provides a dynamic, non-invasive tool for real-time imaging of the SAS and adjacent anatomical structures at micrometer spatial resolution.
In addition, Hartmann et al. [153] conducted an in vivo study to explore the value of a 3-dimensional microscope-integrated extravascular OCT as the first suitable intraoperative imaging modality of a cerebral aneurysm (CA) and parent vessel wall morphology. Incidental CAs (Patients number = 16) of the anterior circulation with an indication for microsurgical clipping were scanned. The analysis revealed that intraoperative OCT achieved to delineate the microstructural composition of the parent vessel in all cases and the CA wall in 68.8%. Clinical relevant characteristics such as thickness, calcification, residual tunica media and atherosclerotic plaque of CA wall could be demonstrated with high image quality approaching the spatial resolution of histopathology.

6. Summary

The use of fNIRS is currently common practice in human neuroimaging and PoP clinical are studies increasingly conducted, which will potentially lead to new clinical fNIRS application in the near future. Dual wavelength fNIRS systems using high-power LEDs are still the most popular mainly because of their simplicity in design and the increasing interest in wearable applications. CBF measurement using the DCS technique is still quite rare, but increasingly used and its wearable prototype is tested combined with particularly with fNIRS as a complementary method. Moreover, DCS has recently stepped into the commercial world and there are ongoing researches to make more progress in DCS technology.
PAI provides the unique contrast of optical absorption and the superb scalability of spatial resolution and penetration. The potential clinical application will be monitoring of endogenous absorber-encoded functional information such as the concentration of hemoglobin, the oxygen saturation of hemoglobin, blood flow, oxygen metabolism and water accumulation. By applying exogenous nanoparticles and probe-labeled molecular targets, PAI can monitor neural activity, glucose uptake, aberrant protein aggregation, malignancy, drug delivery in blood-brain barrier disruption (BBBD) and targeted therapy with nanoparticles. However, human brain imaging by applying PAI technology is still in its infant phase; the skull (especially the side skull) effect is still a big challenge for imaging of the deep brain. A potential solution for this challenge includes integrating PAT with X-ray CT, which provides data for accurate 3D modeling of the skull for acoustic correction, and further studying the skull to better compensate its effect on PA signal propagating through it.
As a micrometer-scale imaging system with a high speed and low cost, OCT already gained huge popularity and has shown its applications in neuroimaging and neurosurgery. Intraoperative OCT may hold promise as an additional imaging tool during neurovascular procedures. Combining OCT with non-invasive stimulation or perturbation of biological systems would make an attractive research platform.

Author Contributions

All authors contributed to the writing process, where the main focus of P.K. was on OCT, S.M. focused on DCS, H.F. on fNIRS, Z.Z. on PAI and T.M. on fNIRS and overall content of the review. All authors have read and agreed to the published version of the manuscript.

Funding

The work was supported by the Academy of Finland (grants 314502 and 318347) and Suomen Aivosäätiö.

Conflicts of Interest

The authors declare no conflict of interest.

Abbreviation

APDAvalanche Photodiode
AR-PAM Acoustic-resolution PA microscopy
B-NIRS Broadband NIRS
BBBBlood-brain barrier
BBBDBlood-brain barrier disruption
BCIBrain-computer interface
BFIBlood flow index
BMSCs bone mesenchymal stem cells
CACerebral aneurysm
CBFCerebral blood flow
CBFiCerebral blood flow index
CBV Cerebral blood volume
CCDClosed-caption device
CMRO2Cerebral oxygen metabolism
CP_NPsconjugated polymer nanoparticles
DCSDiffuse correlations spectroscopy
EEGElectro encephalography
fcPAT functional PAT
FD-OCTFourier-domain Optical coherence tomography
fDCS functional DCS
FF-OCTfull-field Optical coherence tomography
fMRIfunctional magnetic resonance imaging
fNIRSfunctional near-infrared spectroscopy
FUS focused ultrasound
HbOOxy-hemoglobin
HbRDeoxy-hemoglobin
HbTTotal hemoglobin
ICP Intracranial pressure
iOCTIntegrated optical coherence tomography
IRInfrared
LDLaser diode
LEDLight emitting diode
MEGmagnetic encephalography
NIRSNear-infrared spectroscopy
OCTOptical coherence tomography
OCTAOptical Coherence Tomography based Angiography
OMAGOptical Coherence Tomography based Microangiography
OR-PAMOptical resolution PA microscopy
oxCCO Oxidation state of cytochrome c oxidase
PACT Photoacoustic computing tomography
PAIPhotoacoustic imaging
PDPhoto diode
PETpositron emission tomography
PMTs photomultiplier tubes
PoCproof of concept
PZTPiezoelectric Transducer
SASSubarachnoid space
SD-OCTSpectral-domain Optical coherence tomography
SiPDSilicon PD
SPECTSingle-photon emission computed tomography
SS-OCTSwept-source Optical coherence tomography
StO2Cerebral tissue oxygenation
TBITraumatic Brain Injury
TD-OCTTime Domain Optical coherence tomography
tDCS transcranial direct electrical stimulation
TMSTranscranial magnetic stimulation
TR-fNIRSTime-resolved fNIRS
VSD voltage-sensitive dye

References

  1. Myllylä, T.; Zacharias, N.; Korhonen, V.; Zienkiewicz, A.; Hinrichs, H.; Kiviniemi, V.; Walter, M. Multimodal brain imaging with magnetoencephalography: A method for measuring blood pressure and cardiorespiratory oscillations. Sci. Rep. 2017, 7, 1–9. [Google Scholar] [CrossRef] [PubMed]
  2. Hämäläinen, M.; Hari, R.; Ilmoniemi, R.J.; Knuutila, J.; Lounasmaa, O.V. Magnetoencephalography theory, instrumentation, and applications to noninvasive studies of the working human brain. Rev. Mod. Phys. 1993, 65, 413–497. [Google Scholar] [CrossRef] [Green Version]
  3. Ogawa, S.; Lee, T.M.; Kay, A.R.; Tank, D.W. Brain magnetic resonance imaging with contrast dependent on blood oxygenation. Proc. Natl. Acad. Sci. USA 1990, 87, 9868–9872. [Google Scholar] [CrossRef] [PubMed] [Green Version]
  4. Hugger, T.; Zahneisen, B.; LeVan, P.; Lee, K.J.; Lee, H.-L.; Zaitsev, M.; Hennig, J. Fast Undersampled Functional Magnetic Resonance Imaging Using Nonlinear Regularized Parallel Image Reconstruction. PLoS ONE 2011, 6, e28822. [Google Scholar] [CrossRef] [Green Version]
  5. Assländer, J.; Zahneisen, B.; Hugger, T.; Reisert, M.; Lee, H.L.; LeVan, P.; Hennig, J. Single shot whole brain imaging using spherical stack of spirals trajectories. Neuroimage 2013, 73, 59–70. [Google Scholar] [CrossRef]
  6. Tuchin, V. Tissue Optics and Photonics: Light-Tissue Interaction II. J. Biomed. Photonics Eng. 2016, 2, 30201. [Google Scholar] [CrossRef] [Green Version]
  7. Lareau, E.; Lesage, F.; Pouliot, P.; Nguyen, D.; Le Lan, J.; Sawan, M. Multichannel wearable system dedicated for simultaneous electroencephalography/near-infrared spectroscopy real-time data acquisitions. J. Biomed. Opt. 2011, 16, 96014. [Google Scholar] [CrossRef]
  8. Tuchin, V. Tissue Optics: Light Scattering Methods and Instruments for Medical Diagnosis, 3rd ed.; SPIE Press: Bellingham, WA, USA, 2015. [Google Scholar]
  9. Korhonen, V.O.; Myllylä, T.S.; Kirillin, M.Y.; Popov, A.P.; Bykov, A.V.; Gorshkov, A.V.; Sergeeva, E.A.; Kinnunen, M.; Kiviniemi, V. Light propagation in NIR spectroscopy of the human brain. IEEE J. Sel. Top. Quantum Electron. 2014, 20, 289–298. [Google Scholar] [CrossRef]
  10. Madsen, S.J.; Wilson, B.C. Optical Methods and Instrumentation in Brain Imaging and Therapy; Springer: New York, NY, USA, 2013. [Google Scholar]
  11. Ferrari, M.; Quaresima, V. A brief review on the history of human functional near-infrared spectroscopy (fNIRS) development and fields of application. Neuroimage 2012, 63, 921–935. [Google Scholar] [CrossRef]
  12. Carp, S.A.; Dai, G.P.; Boas, D.A.; Franceschini, M.A.; Kim, Y.R. Validation of diffuse correlation spectroscopy measurements of rodent cerebral blood flow with simultaneous arterial spin labeling MRI; towards MRI-optical continuous cerebral metabolic monitoring. Biomed. Opt. Express 2010, 1, 553–565. [Google Scholar] [CrossRef] [Green Version]
  13. Wang, L.V.; Yao, J. A practical guide to photoacoustic tomography in the life sciences. Nat. Methods 2016, 13, 627–638. [Google Scholar] [CrossRef] [PubMed]
  14. Schmitt, J.M. Optical Coherence Tomography (OCT): A review. IEEE J. Sel. Top. Quantum Electron. 1999, 5, 1205–1215. [Google Scholar] [CrossRef] [Green Version]
  15. Durduran, T. Noninvasive Measurements of Tissue Hemodynamics with Hybrid Diffuse Optical Methods. Ph.D. Thesis, University of Pennsylvania, Philadelphia, PA, USA, 2004. [Google Scholar]
  16. Li, J.; Dietsche, G.; Iftime, D.; Skipetrov, S.E.; Maret, G.; Elbert, T.; Rockstroh, B.; Gisler, T. Noninvasive detection of functional brain activity with near-infrared diffusing-wave spectroscopy. J. Biomed. Opt. 2005, 10, 44002. [Google Scholar] [CrossRef] [PubMed] [Green Version]
  17. Roche-Labarbe, N.; Carp, S.A.; Surova, A.; Patel, M.; Boas, D.A.; Grant, P.E.; Franceschini, M.A. Noninvasive optical measures of CBV, StO2, CBF index, and rCMRO2 in human premature neonates’ brains in the first six weeks of life. Hum. Brain Mapp. 2010, 31, 341–352. [Google Scholar] [CrossRef] [PubMed] [Green Version]
  18. Johnson, A.; Roskosky, M.; Freedman, B.; Schuler, M.S. Depth Penetration of Near Infrared Spectroscopy in the Obese. J. Trauma Treat. 2014, 4, 2167-1222. [Google Scholar]
  19. Piper, S.K.; Krueger, A.; Koch, S.P.; Mehnert, J.; Habermehl, C.; Steinbrink, J.; Obrig, H.; Schmitz, C.H. A wearable multi-channel fNIRS system for brain imaging in freely moving subjects. Neuroimage 2014, 85, 64–71. [Google Scholar] [CrossRef] [PubMed] [Green Version]
  20. Sutin, J.; Zimmerman, B.; Tyulmankov, D.; Tamborini, D.; Wu, K.C.; Selb, J.; Gulinatti, A.; Rech, I.; Tosi, A.; Boas, D.A.; et al. Time-domain diffuse correlation spectroscopy. Optica 2016, 3, 1006. [Google Scholar] [CrossRef] [Green Version]
  21. Durduran, T.; Choe, R.; Baker, W.B.; Yodh, A.G. Diffuse optics for tissue monitoring and tomography. Rep. Prog. Phys. 2010, 73, 76701. [Google Scholar] [CrossRef] [Green Version]
  22. Huang, C.; Seong, M.; Morgan, J.P.; Mazdeyasna, S.; Kim, J.G.; Hastings, J.T.; Yu, G. Low-cost compact diffuse speckle contrast flowmeter using small laser diode and bare charge-coupled-device. J. Biomed. Opt. 2016, 21, 80501. [Google Scholar] [CrossRef] [Green Version]
  23. Huang, C.; Gu, Y.; Chen, J.; Bahrani, A.A.; Jawdeh, E.G.A.; Bada, H.S.; Saatman, K.; Yu, G.; Chen, L. A Wearable Fiberless Optical Sensor for Continuous Monitoring of Cerebral Blood Flow in Mice. IEEE J. Sel. Top. Quantum Electron. 2019, 25, 6900108. [Google Scholar] [CrossRef]
  24. Fantini, S.; Franceschini, M.A.; Fishkin, J.B.; Barbieri, B.; Gratton, E. Quantitative determination of the absorption spectra of chromophores in strongly scattering media: A light-emitting-diode based technique. Appl. Opt. 1994, 33, 5204–5213. [Google Scholar] [CrossRef] [PubMed] [Green Version]
  25. Tromberg, B.J.; Coquoz, O.; Fishkin, J.B.; Pham, T.; Anderson, E.R.; Butler, J.; Cahn, M.; Gross, J.D.; Venugopalan, V.; Pham, D. Non-invasive measurements of breast tissue optical properties using frequency-domain photon migration. Philos. Trans. R. Soc. B Biol. Sci. 1997, 352, 661–668. [Google Scholar] [CrossRef] [PubMed] [Green Version]
  26. Delpy, D.T.; Cope, M.; Van Der Zee, P.; Arridge, S.; Wray, S.; Wyatt, J. Estimation of optical pathlength through tissue from direct time of flight measurement. Phys. Med. Biol. 1988, 33, 1433–1442. [Google Scholar] [CrossRef] [PubMed] [Green Version]
  27. Patterson, M.S.; Chance, B.; Wilson, B.C. Time resolved reflectance and transmittance for the noninvasive measurement of tissue optical properties. Appl. Opt. 1989, 28, 2331–2336. [Google Scholar] [CrossRef]
  28. Yul, G.; Durduran, T.; Zhou, C.; Zhu, T.C.; Finlay, J.C.; Busch, T.M.; Malkowicz, S.B.; Hahn, S.M.; Yodh, A.G. Real-time ln Situ Monitoring of Human Prostate Photodynamic Therapy with Diffuse Light. Photochem. Photobiol. 2006, 82, 1279–1280. [Google Scholar]
  29. Yu, G. Diffuse Correlation Spectroscopy (DCS): A Diagnostic Tool for Assessing Tissue Blood Flow in Vascular-Related Diseases and Therapies. Curr. Med. Imaging Rev. 2012, 8, 194–210. [Google Scholar] [CrossRef]
  30. Nasiriavanaki, M.; Xia, J.; Wan, H.; Bauer, A.Q.; Culver, J.P.; Wang, L.V. High-resolution photoacoustic tomography of resting-state functional connectivity in the mouse brain. Proc. Natl. Acad. Sci. USA 2014, 111, 21–26. [Google Scholar] [CrossRef] [Green Version]
  31. Tang, J.; Dai, X.; Jiang, H. Wearable scanning photoacoustic brain imaging in behaving rats. J. Biophotonics 2016, 9, 570–575. [Google Scholar] [CrossRef]
  32. Zhang, P.; Li, L.; Lin, L.; Hu, P.; Shi, J.; He, Y.; Zhu, L.; Zhou, Y.; Wang, L.V. High-resolution deep functional imaging of the whole mouse brain by photoacoustic computed tomography in vivo. J. Biophotonics 2018, 11, e201700024. [Google Scholar] [CrossRef] [Green Version]
  33. Hu, S. Listening to the Brain With Photoacoustics. IEEE J. Sel. Top. Quantum Electron. 2016, 22, 117–126. [Google Scholar] [CrossRef]
  34. Yao, J.; Wang, L.V. Photoacoustic brain imaging: From microscopic to macroscopic scales. Neurophotonics 2014, 1, 11003. [Google Scholar] [CrossRef] [PubMed] [Green Version]
  35. Nie, L.; Cai, X.; Maslov, K.; Garcia-Uribe, A.; Anastasio, M.A.; Wang, L. V Photoacoustic tomography through a whole adult human skull with a photon recycler. J. Biomed. Opt. 2012, 17, 110506. [Google Scholar] [CrossRef] [PubMed] [Green Version]
  36. Petrov, I.Y.; Petrov, Y.; Prough, D.S.; Richardson, C.J.; Fonseca, R.A.; Robertson, C.S.; Asokan, C.V.; Agbor, A.; Esenaliev, R.O. Transmission (forward) mode, transcranial, noninvasive optoacoustic measurements for brain monitoring, imaging, and sensing. In Photons Plus Ultrasound: Imaging and Sensing 2016; Oraevsky, A.A., Wang, L.V., Eds.; International Society for Optics and Photonics: Bellingham, WA, USA, 2016; p. 97084P. [Google Scholar]
  37. Wang, X.; Chamberland, D.L.; Xi, G. Noninvasive reflection mode photoacoustic imaging through infant skull toward imaging of neonatal brains. J. Neurosci. Methods 2008, 168, 412–421. [Google Scholar] [CrossRef]
  38. Ibne Mokbul, M. Optical Coherence Tomography: Basic Concepts and Applications in Neuroscience Research. J. Med. Eng. 2017, 2017, 3409327. [Google Scholar] [CrossRef] [PubMed] [Green Version]
  39. Myllylä, T.; Korhonen, V.; Kiviniemi, V.; Tuchin, V. Experimental studies with selected light sources for NIRS of brain tissue: Quantifying tissue chromophore concentration. In Proceedings of the Optical Techniques in Neurosurgery, Neurophotonics, and Optogenetics II, San Francisco, CA, USA, 7–10 February 2015; SPIE: Bellingham, WA, USA, 2015; Volume 9305, p. 93051S. [Google Scholar]
  40. Myllylä, T.; Korhonen, V.; Suraźynski, Ł.; Zienkiewicz, A.; Sorvoja, H.; Myllylä, R. Measurement of cerebral blood flow and metabolism using high power light-emitting diodes. Measurement 2014, 58, 387–393. [Google Scholar] [CrossRef]
  41. Dean Kurth, C.; Thayer, W.S. A multiwavelength frequency-domain near-infrared cerebral oximeter. Phys. Med. Biol. 1999, 44, 727–740. [Google Scholar] [CrossRef] [PubMed]
  42. Scholkmann, F.; Kleiser, S.; Metz, A.J.; Zimmermann, R.; Mata Pavia, J.; Wolf, U.; Wolf, M. A review on continuous wave functional near-infrared spectroscopy and imaging instrumentation and methodology. Neuroimage 2014, 85, 6–27. [Google Scholar] [CrossRef]
  43. Re, R.; Contini, D.; Turola, M.; Spinelli, L.; Zucchelli, L.; Caffini, M.; Cubeddu, R.; Torricelli, A. Multi-channel medical device for time domain functional near infrared spectroscopy based on wavelength space multiplexing. Biomed. Opt. Express 2013, 4, 2231. [Google Scholar] [CrossRef] [Green Version]
  44. Pifferi, A.; Contini, D.; Mora, A.D.; Farina, A.; Spinelli, L.; Torricelli, A. New frontiers in time-domain diffuse optics, a review. J. Biomed. Opt. 2016, 21, 91310. [Google Scholar] [CrossRef] [Green Version]
  45. Di Sieno, L.; Nissinen, J.; Hallman, L.; Martinenghi, E.; Contini, D.; Pifferi, A.; Kostamovaara, J.; Mora, A.D. Miniaturized pulsed laser source for time-domain diffuse optics routes to wearable devices. J. Biomed. Opt. 2017, 22, 85004. [Google Scholar] [CrossRef] [Green Version]
  46. Re, R.; Martinenghi, E.; Mora, A.D.; Contini, D.; Pifferi, A.; Torricelli, A. Probe-hosted silicon photomultipliers for time-domain functional near-infrared spectroscopy: Phantom and in vivo tests. Neurophotonics 2016, 3, 45004. [Google Scholar] [CrossRef] [PubMed] [Green Version]
  47. Gatto, R.; Hoffman, W.; Mueller, M.; Flores, A.; Valyi-Nagy, T.; Charbel, F.T. Frequency domain near-infrared spectroscopy technique in the assessment of brain oxygenation: A validation study in live subjects and cadavers. J. Neurosci. Methods 2006, 157, 274–277. [Google Scholar] [CrossRef] [PubMed]
  48. Giacalone, G.; Zanoletti, M.; Contini, D.; Re, R.; Spinelli, L.; Roveri, L.; Torricelli, A. Cerebral time domain-NIRS: Reproducibility analysis, optical properties, hemoglobin species and tissue oxygen saturation in a cohort of adult subjects. Biomed. Opt. Express 2017, 8, 4987. [Google Scholar] [CrossRef] [PubMed] [Green Version]
  49. Tachtsidis, I.; Papaioannou, A. Investigation of frontal lobe activation with fNIRS and systemic changes during video gaming. In Advances in Experimental Medicine and Biology; Springer: New York, NY, USA, 2013; Volume 789, pp. 89–95. [Google Scholar]
  50. Lee, C.W.; Cooper, R.J.; Austin, T. Diffuse optical tomography to investigate the newborn brain. Pediatr. Res. 2017, 82, 376–386. [Google Scholar] [CrossRef] [Green Version]
  51. Liao, S.M. High-density diffuse optical tomography of term infant visual cortex in the nursery. J. Biomed. Opt. 2012, 17, 81414. [Google Scholar] [CrossRef] [Green Version]
  52. Shoaib, Z.; Ahmad Kamran, M.; Mannan, M.M.N.; Jeong, M.Y. Approach to optimize 3-dimensional brain functional activation image with high resolution: A study on functional near-infrared spectroscopy. Biomed. Opt. Express 2019, 10, 4684. [Google Scholar] [CrossRef]
  53. Wolf, M.; Ferrari, M.; Quaresima, V. Progress of near-infrared spectroscopy and topography for brain and muscle clinical applications. J. Biomed. Opt. 2007, 12, 62104. [Google Scholar]
  54. Hamamatsu photonics K.K Near infrared oxygenation monitor C10448-20. Available online: https://www.hamamatsu.com/eu/en/product/type/C10448-20/index.html (accessed on 8 December 2019).
  55. Zhao, H.; Cooper, R.J. Review of recent progress toward a fiberless, whole-scalp diffuse optical tomography system. Neurophotonics 2017, 5, 11012. [Google Scholar] [CrossRef]
  56. Biopac fNIR Funcitonal Near Infrared Optical Brain Imaging System 2019. Available online: https://www.biopac.com/product-category/education/fnir-optical-brain-imaging-education/ (accessed on 15 January 2020).
  57. NIRx NIRSport 2 | fNIRS Systems | NIRS Devices | NIRx. Available online: https://nirx.net/nirsport (accessed on 15 January 2020).
  58. Rogue Research Inc. NIRS Specifications | Rogue Research. Available online: https://www.rogue-research.com/nirs/specifications/ (accessed on 15 January 2020).
  59. ETG 4100—Hitachi Medical Systems. Available online: http://www.hitachi-medical-systems.eu/products-and-services/optical-topography/etg-4100.html (accessed on 16 January 2020).
  60. CW6 | NIRSOptix by TechEn, Inc. Available online: https://www.nirsoptix.com/CW6.html (accessed on 24 February 2020).
  61. Artinis Medical Systems | fNIRS devices | NIRS devices-Home. Available online: https://www.artinis.com/ (accessed on 4 March 2020).
  62. Silverlineresearch Starstim fNIRS. Available online: https://static1.squarespace.com/static/54ddd9b0e4b0e11f3685f546/t/5c8269d8b208fc7a2f962f12/1552050649366/Starstim+fNIRS+leafet.pdf (accessed on 24 February 2020).
  63. ISS Functional Brain Imaging System. Available online: http://www.iss.com/biomedical/instruments/imagent.html (accessed on 10 March 2020).
  64. Obrig, H. NIRS in clinical neurology—A “promising” tool? Neuroimage 2014, 85, 535–546. [Google Scholar] [CrossRef]
  65. Saxena, V.; Gonzalez-Gomez, I.; Laug, W.E. A noninvasive multimodal technique to monitor brain tumor vascularization. Phys. Med. Biol. 2007, 52, 5295–5308. [Google Scholar] [CrossRef]
  66. Vishwanath, K.; Klein, D.; Chang, K.; Schroeder, T.; Dewhirst, M.W.; Ramanujam, N. Quantitative optical spectroscopy can identify long-term local tumor control in irradiated murine head and neck xenografts. J. Biomed. Opt. 2009, 14, 54051. [Google Scholar] [CrossRef] [PubMed]
  67. Gallagher, A.; Tremblay, J.; Vannasing, P. Language mapping in children using resting-state functional connectivity: Comparison with a task-based approach. J. Biomed. Opt. 2016, 21, 125006. [Google Scholar] [CrossRef] [PubMed] [Green Version]
  68. Sato, Y.; Uzuka, T.; Aoki, H.; Natsumeda, M.; Oishi, M.; Fukuda, M.; Fujii, Y. Near-infrared spectroscopic study and the Wada test for presurgical evaluation of expressive and receptive language functions in glioma patients: With a case report of dissociated language functions. Neurosci. Lett. 2012, 510, 104–109. [Google Scholar] [CrossRef] [PubMed]
  69. Sunar, U.; Quon, H.; Durduran, T.; Zhang, J.; Du, J.; Zhou, C.; Yu, G.; Choe, R.; Kilger, A.; Lustig, R.; et al. Noninvasive diffuse optical measurement of blood flow and blood oxygenation for monitoring radiation therapy in patients with head and neck tumors: A pilot study. J. Biomed. Opt. 2006, 11, 64021. [Google Scholar] [CrossRef] [PubMed]
  70. Rizki, E.E.; Uga, M.; Dan, I.; Dan, H.; Tsuzuki, D.; Yokota, H.; Oguro, K.; Watanabe, E. Determination of epileptic focus side in mesial temporal lobe epilepsy using long-term noninvasive fNIRS/EEG monitoring for presurgical evaluation. Neurophotonics 2015, 2, 25003. [Google Scholar] [CrossRef] [PubMed] [Green Version]
  71. Pouliot, P.; Tremblay, J.; Robert, M.; Vannasing, P.; Lepore, F.; Lassonde, M.; Sawan, M.; Nguyen, D.K.; Lesage, F. Nonlinear hemodynamic responses in human epilepsy: A multimodal analysis with fNIRS-EEG and fMRI-EEG. J. Neurosci. Methods 2012, 204, 326–340. [Google Scholar] [CrossRef]
  72. Adorni, R.; Gatti, A.; Brugnera, A.; Sakatani, K.; Compare, A. Could fNIRS Promote Neuroscience Approach in Clinical Psychology? Front. Psychol. 2016, 7, 456. [Google Scholar] [CrossRef] [Green Version]
  73. Maidan, I.; Nieuwhof, F.; Bernad-Elazari, H.; Reelick, M.F.; Bloem, B.R.; Giladi, N.; Deutsch, J.E.; Hausdorff, J.M.; Claassen, J.A.H.; Mirelman, A. The Role of the Frontal Lobe in Complex Walking Among Patients With Parkinson’s Disease and Healthy Older Maidan, I., Nieuwhof, F., Bernad-Elazari, H., Reelick, M.F., Bloem, B.R., Giladi, N., … Mirelman, A. (2016). The Role of the Frontal Lobe in Comple. Neurorehabil. Neural Repair 2016, 30, 963–971. [Google Scholar] [CrossRef] [Green Version]
  74. Nieuwhof, F.; Reelick, M.F.; Maidan, I.; Mirelman, A.; Hausdorff, J.M.; Olde Rikkert, M.G.M.; Bloem, B.R.; Muthalib, M.; Claassen, J.A.H.R. Measuring prefrontal cortical activity during dual task walking in patients with Parkinson’s disease: Feasibility of using a new portable fNIRS device. Pilot Feasibility Stud. 2016, 2, 59. [Google Scholar] [CrossRef] [Green Version]
  75. Rea, M.; Rana, M.; Lugato, N.; Terekhin, P.; Gizzi, L.; Brötz, D.; Fallgatter, A.; Birbaumer, N.; Sitaram, R.; Caria, A. Lower Limb Movement Preparation in Chronic Stroke: A Pilot Study Toward an fNIRS-BCI for Gait Rehabilitation. Neurorehabil. Neural Repair 2014, 28, 564–575. [Google Scholar] [CrossRef]
  76. Nguyen, T.; Babawale, O.; Kim, T.; Jo, H.J.; Liu, H.; Kim, J.G. Exploring brain functional connectivity in rest and sleep states: A fNIRS study. Sci. Rep. 2018, 8, 16144. [Google Scholar] [CrossRef] [PubMed]
  77. Liang, Z.; Gu, Y.; Duan, X.; Cheng, L.; Liang, S.; Tong, Y.; Li, X. Design of multichannel functional near-infrared spectroscopy system with application to propofol and sevoflurane anesthesia monitoring. Neurophotonics 2016, 3, 45001. [Google Scholar] [CrossRef] [PubMed] [Green Version]
  78. Hernandez-Meza, G.; Izzetoglu, M.; Osbakken, M.; Green, M.; Abubakar, H.; Izzetoglu, K. Investigation of optical neuro-monitoring technique for detection of maintenance and emergence states during general anesthesia. J. Clin. Monit. Comput. 2018, 32, 147–163. [Google Scholar] [CrossRef] [PubMed]
  79. Altvater-Mackensen, N.; Grossmann, T. The role of left inferior frontal cortex during audiovisual speech perception in infants. Neuroimage 2016, 133, 14–20. [Google Scholar] [CrossRef]
  80. Vannasing, P.; Florea, O.; González-Frankenberger, B.; Tremblay, J.; Paquette, N.; Safi, D.; Wallois, F.; Lepore, F.; Béland, R.; Lassonde, M.; et al. Distinct hemispheric specializations for native and non-native languages in one-day-old newborns identified by fNIRS. Neuropsychologia 2016, 84, 63–69. [Google Scholar] [CrossRef] [Green Version]
  81. Urakawa, S.; Takamoto, K.; Ishikawa, A.; Ono, T.; Nishijo, H. Selective Medial Prefrontal Cortex Responses During Live Mutual Gaze Interactions in Human Infants: An fNIRS Study. Brain Topogr. 2015, 28, 691–701. [Google Scholar] [CrossRef]
  82. Lloyd-Fox, S.; Széplaki-Köllod, B.; Yin, J.; Csibra, G. Are you talking to me? Neural activations in 6-month-old infants in response to being addressed during natural interactions. Cortex 2015, 70, 35–48. [Google Scholar] [CrossRef] [Green Version]
  83. Zaidi, A.D.; Munk, M.H.J.; Schmidt, A.; Risueno-Segovia, C.; Bernard, R.; Fetz, E.; Logothetis, N.; Birbaumer, N.; Sitaram, R. Simultaneous epidural functional near-infrared spectroscopy and cortical electrophysiology as a tool for studying local neurovascular coupling in primates. Neuroimage 2015, 120, 394–399. [Google Scholar] [CrossRef]
  84. Roche-Labarbe, N.; Zaaimi, B.; Mahmoudzadeh, M.; Osharina, V.; Wallois, A.; Nehlig, A.; Grebe, R.; Wallois, F. NIRS-measured oxy- and deoxyhemoglobin changes associated with EEG spike-and-wave discharges in a genetic model of absence epilepsy: The GAERS. Epilepsia 2010, 51, 1374–1384. [Google Scholar] [CrossRef] [PubMed]
  85. Abookasis, D.; Shochat, A.; Mathews, M.S. Monitoring hemodynamic and morphologic responses to closed head injury in a mouse model using orthogonal diffuse near-infrared light reflectance spectroscopy. J. Biomed. Opt. 2013, 18, 45003. [Google Scholar] [CrossRef]
  86. Myllylä, T.S.; Kaakinen, M.; Zienkiewicz, A.; Vihriala, E.; Korhonen, V.; Kuittinen, O.; Eklund, L.; Kiviniemi, V.; Jukkola, J. Cardiovascular effects of mannitol infusion: A comparison study performed on mouse and human. Biophotonics Photonic Solut. Better Heal. Care VI 2018, 10685, 106854A. [Google Scholar]
  87. Jessen, N.A.; Munk, A.S.F.; Lundgaard, I.; Nedergaard, M. The Glymphatic System: A Beginner’s Guide. Neurochem. Res. 2015, 40, 2583–2599. [Google Scholar] [CrossRef] [PubMed] [Green Version]
  88. Myllylä, T.; Harju, M.; Korhonen, V.; Bykov, A.; Kiviniemi, V.; Meglinski, I. Assessment of the dynamics of human glymphatic system by near-infrared spectroscopy. J. Biophotonics 2018, 11, e201700123. [Google Scholar] [CrossRef] [PubMed]
  89. Kiviniemi, V.; Korhonen, V.; Kortelainen, J.; Rytky, S.; Keinänen, T.; Tuovinen, T.; Isokangas, M.; Sonkajärvi, E.; Siniluoto, T.; Nikkinen, J.; et al. Real-time monitoring of human blood-brain barrier disruption. PLoS ONE 2017, 12, e0174072. [Google Scholar] [CrossRef]
  90. Saikia, M.J.; Besio, W.G.; Mankodiya, K. WearLight: Toward a Wearable, Configurable Functional NIR Spectroscopy System for Noninvasive Neuroimaging. IEEE Trans. Biomed. Circuits Syst. 2019, 13, 91–102. [Google Scholar] [CrossRef]
  91. Chitnis, D.; Cooper, R.J.; Dempsey, L.; Powell, S.; Quaggia, S.; Highton, D.; Elwell, C.; Hebden, J.C.; Everdell, N.L. Functional imaging of the human brain using a modular, fibre-less, high-density diffuse optical tomography system. Biomed. Opt. Express 2016, 7, 4275–4288. [Google Scholar] [CrossRef]
  92. Funane, T.; Numata, T.; Sato, H.; Hiraizumi, S.; Hasegawa, Y.; Kuwabara, H.; Hasegawa, K.; Kiguchi, M. Rearrangeable and exchangeable optical module with system-on-chip for wearable functional near-infrared spectroscopy system. Neurophotonics 2017, 5, 11007. [Google Scholar] [CrossRef] [Green Version]
  93. Chitnis, D.; Airantzis, D.; Highton, D.; Williams, R.; Phan, P.; Giagka, V.; Powell, S.; Cooper, R.J.; Tachtsidis, I.; Smith, M.; et al. Towards a wearable near infrared spectroscopic probe for monitoring concentrations of multiple chromophores in biological tissue in vivo. Rev. Sci. Instrum. 2016, 87, 65112. [Google Scholar] [CrossRef]
  94. Wyser, D.; Lambercy, O.; Scholkmann, F.; Wolf, M.; Gassert, R. Wearable and modular functional near-infrared spectroscopy instrument with multidistance measurements at four wavelengths. Neurophotonics 2017, 4, 41413. [Google Scholar] [CrossRef]
  95. Zhang, Y.; Brooks, D.H.; Franceschini, M.A.; Boas, D.A. Eigenvector-based spatial filtering for reduction of physiological interference in diffuse optical imaging. J. Biomed. Opt. 2005, 10, 11014. [Google Scholar] [CrossRef] [Green Version]
  96. Santosa, H.; Jiyoun Hong, M.; Kim, S.P.; Hong, K.S. Noise reduction in functional near-infrared spectroscopy signals by independent component analysis. Rev. Sci. Instrum. 2013, 84, 73106. [Google Scholar] [CrossRef] [PubMed]
  97. Izzetoglu, M.; Chitrapu, P.; Bunce, S.; Onaral, B. Motion artifact cancellation in NIR spectroscopy using discrete Kalman filtering. Biomed. Eng. Online 2010, 9, 16. [Google Scholar] [CrossRef] [PubMed] [Green Version]
  98. Cui, X.; Bray, S.; Reiss, A.L. Functional near infrared spectroscopy (NIRS) signal improvement based on negative correlation between oxygenated and deoxygenated hemoglobin dynamics. Neuroimage 2010, 49, 3039–3046. [Google Scholar] [CrossRef] [PubMed] [Green Version]
  99. Molavi, B.; Dumont, G.A. Wavelet-based motion artifact removal for functional near-infrared spectroscopy. Physiol. Meas. 2012, 33, 259–270. [Google Scholar] [CrossRef] [PubMed]
  100. Scholkmann, F.; Spichtig, S.; Muehlemann, T.; Wolf, M. How to detect and reduce movement artifacts in near-infrared imaging using moving standard deviation and spline interpolation. Physiol. Meas. 2010, 31, 649–662. [Google Scholar] [CrossRef] [Green Version]
  101. Kassab, A.; Le Lan, J.; Tremblay, J.; Vannasing, P.; Dehbozorgi, M.; Pouliot, P.; Gallagher, A.; Lesage, F.; Sawan, M.; Nguyen, D.K. Multichannel wearable fNIRS-EEG system for long-term clinical monitoring. Hum. Brain Mapp. 2018, 39, 7–23. [Google Scholar] [CrossRef] [Green Version]
  102. Pinti, P.; Aichelburg, C.; Lind, F.; Power, S.; Swingler, E.; Merla, A.; Hamilton, A.; Gilber, S.; Burgess, P.; Tachtsidis, I. Using fiberless, wearable fnirs to monitor brain activity in real-world cognitive tasks. J. Vis. Exp. 2015, 2015, e53336. [Google Scholar] [CrossRef] [Green Version]
  103. Quaresima, V.; Ferrari, M. Functional Near-Infrared Spectroscopy (fNIRS) for Assessing Cerebral Cortex Function During Human Behavior in Natural/Social Situations: A Concise Review. Organ. Res. Methods 2019, 22, 46–68. [Google Scholar] [CrossRef]
  104. Funane, T. Wearable near-infrared spectroscopy neuroimaging and its applications. In Proceedings of the 2015 37th Annual International Conference of the IEEE Engineering in Medicine and Biology Society (EMBC), Milan, Italy, 25–29 August 2015; pp. 4025–4028. [Google Scholar]
  105. Kotozaki, Y.; Takeuchi, H.; Sekiguchi, A.; Yamamoto, Y.; Shinada, T.; Araki, T.; Takahashi, K.; Taki, Y.; Ogino, T.; Kiguchi, M.; et al. Biofeedback-based training for stress management in daily hassles: An intervention study. Brain Behav. 2014, 4, 566–579. [Google Scholar] [CrossRef]
  106. Zhang, Q.; Ivkovic, V.; Hu, G.; Strangman, G.E. Twenty-four-hour ambulatory recording of cerebral hemodynamics, systemic hemodynamics, electrocardiography, and actigraphy during people’s daily activities. J. Biomed. Opt. 2014, 19, 47003. [Google Scholar] [CrossRef]
  107. Farzam, P.; Durduran, T. Multidistance diffuse correlation spectroscopy for simultaneous estimation of blood flow index and optical properties. J. Biomed. Opt. 2015, 20, 55001. [Google Scholar] [CrossRef] [Green Version]
  108. Yu, G. Near-infrared diffuse correlation spectroscopy in cancer diagnosis and therapy monitoring. J. Biomed. Opt. 2012, 17, 10901. [Google Scholar] [CrossRef] [PubMed]
  109. Kondepati, V.R.; Heise, H.M.; Backhaus, J. Recent applications of near-infrared spectroscopy in cancer diagnosis and therapy. Anal. Bioanal. Chem. 2008, 390, 125–139. [Google Scholar] [CrossRef] [PubMed]
  110. Yu, G.; Durduran, T.; Zhou, C.; Wang, H.W.; Putt, M.E.; Saunders, H.M.; Sehgal, C.M.; Glatstein, E.; Yodh, A.G.; Busch, T.M. Noninvasive monitoring of murine tumor blood flow during and after photodynamic therapy provides early assessment of therapeutic efficacy. Clin. Cancer Res. 2005, 11, 3543–3552. [Google Scholar] [CrossRef] [PubMed] [Green Version]
  111. Durduran, T.; Choe, R.; Yu, G.; Zhou, C.; Tchou, J.C.; Czerniecki, B.J.; Yodh, A.G. Diffuse optical measurement of blood flow in breast tumors. Opt. Lett. 2005, 30, 2915. [Google Scholar] [CrossRef]
  112. Zhou, C.; Choe, R.; Shah, N.; Durduran, T.; Yu, G.; Durkin, A.; Hsiang, D.; Mehta, R.; Butler, J.; Cerussi, A.; et al. Diffuse optical monitoring of blood flow and oxygenation in human breast cancer during early stages of neoadjuvant chemotherapy. J. Biomed. Opt. 2007, 12, 51903. [Google Scholar] [CrossRef]
  113. Boas, D.; Sutin, J.; Franceschini, M.A. System and Method for Non-Invasively Monitoring Intracranial Pressure 2016. International Application No. PCT/US2016/026920, 11 April 2016. [Google Scholar]
  114. Boas, D.A.; Franceschini, M.A. Haemoglobin oxygen saturation as a biomarker: The problem and a solution. Philos. Trans. R. Soc. A Math. Phys. Eng. Sci. 2011, 369, 4407–4424. [Google Scholar] [CrossRef] [Green Version]
  115. Forti, R.M.; Favilla, C.G.; Cochran, J.M.; Baker, W.B.; Detre, J.A.; Kasner, S.E.; Mullen, M.T.; Messé, S.R.; Kofke, W.A.; Balu, R.; et al. Transcranial Optical Monitoring of Cerebral Hemodynamics in Acute Stroke Patients during Mechanical Thrombectomy. J. Stroke Cerebrovasc. Dis. 2019, 28, 1483–1494. [Google Scholar] [CrossRef]
  116. Giovannella, M.; Ibañez, D.; Gregori-Pla, C.; Kacprzak, M. Concurrent measurement of cerebral hemodynamics and electroencephalography during transcranial direct current stimulation. Neurophotonics 2018, 5, 15001. [Google Scholar] [CrossRef] [Green Version]
  117. Mesquita, R.C.; Faseyitan, O.K.; Turkeltaub, P.E.; Buckley, E.M.; Thomas, A.; Kim, M.N.; Durduran, T.; Greenberg, J.H.; Detre, J.A.; Yodh, A.G.; et al. Blood flow and oxygenation changes due to low-frequency repetitive transcranial magnetic stimulation of the cerebral cortex. J. Biomed. Opt. 2013, 18, 67006. [Google Scholar] [CrossRef] [Green Version]
  118. Kim, M.N.; Edlow, B.L.; Durduran, T.; Frangos, S.; Mesquita, R.C.; Levine, J.M.; Greenberg, J.H.; Yodh, A.G.; Detre, J.A. Continuous optical monitoring of cerebral hemodynamics during head-of-bed manipulation in brain-injured adults. Neurocrit. Care 2014, 20, 443–453. [Google Scholar] [CrossRef] [Green Version]
  119. Kim, M.N.; Durduran, T.; Frangos, S.; Edlow, B.L.; Buckley, E.M.; Moss, H.E.; Zhou, C.; Yu, G.; Choe, R.; Maloney-Wilensky, E.; et al. Noninvasive measurement of cerebral blood flow and blood oxygenation using near-infrared and diffuse correlation spectroscopies in critically brain-injured adults. Neurocrit. Care 2010, 12, 173–180. [Google Scholar] [CrossRef] [PubMed] [Green Version]
  120. Sutin, J.; Franceschini, M.A.; Boas, D. System and Method for Monitoring Absolute Blood Flow 2016. International Application No. PCT/US2016/026925, 11 April 2016. [Google Scholar]
  121. Yu, G.; Huang, C.; Hastings, J.T. Compact Low-Cost Fiberless Diffuse Speckle Contrast Flow-Oximeter 2018. U.S. Patent Application No. 15/655,988, 25 January 2018. [Google Scholar]
  122. Carp, S.A.; Farzam, P.; Redes, N.; Hueber, D.M.; Franceschini, M.A. Combined multi-distance frequency domain and diffuse correlation spectroscopy system with simultaneous data acquisition and real-time analysis. Biomed. Opt. Express 2017, 8, 39934006. [Google Scholar] [CrossRef] [PubMed] [Green Version]
  123. Cheng, X.; Tamborini, D.; Carp, S.A.; Shatrovoy, O.; Zimmerman, B.; Tyulmankov, D.; Siegel, A.; Blackwell, M.; Franceschini, M.A.; Boas, D.A. Time domain diffuse correlation spectroscopy: Modeling the effects of laser coherence length and instrument response function. Opt. Lett. 2018, 43, 2756–2759. [Google Scholar] [CrossRef] [PubMed]
  124. Diop, M.; Verdecchia, K.; Lee, T.-Y.; Lawrence, K.S. Calibration of diffuse correlation spectroscopy with a time-resolved near-infrared technique to yield absolute cerebral blood flow measurements. Biomed. Opt. Express 2011, 2, 2068–2081. [Google Scholar] [CrossRef] [PubMed] [Green Version]
  125. Verdecchia, K.; Diop, M.; Lee, T.-Y.; St. Lawrence, K. Quantifying the cerebral metabolic rate of oxygen by combining diffuse correlation spectroscopy and time-resolved near-infrared spectroscopy. J. Biomed. Opt. 2013, 18, 27007. [Google Scholar] [CrossRef]
  126. Mesquita, R.C.; D’Souza, A.; Bilfinger, T.V.; Galler, R.M.; Emanuel, A.; Schenkel, S.S.; Yodh, A.G.; Floyd, T.F. Optical monitoring and detection of spinal cord ischemia. PLoS ONE 2013, 8, e83370. [Google Scholar] [CrossRef]
  127. Zhou, C.; Eucker, S.A.; Durduran, T.; Yu, G.; Ralston, J.; Friess, S.H.; Ichord, R.N.; Margulies, S.S.; Yodh, A.G. Diffuse optical monitoring of hemodynamic changes in piglet brain with closed head injury. J. Biomed. Opt. 2009, 14, 34015. [Google Scholar] [CrossRef]
  128. Herrmann, S.; Petrov, I.Y.; Petrov, Y.; Richardson, C.J.; Fonseca, R.A.; Prough, D.S.; Esenaliev, R.O. Cerebral blood oxygenation measurements in neonates with optoacoustic technique. In Photons Plus Ultrasound: Imaging and Sensing 2017; Oraevsky, A.A., Wang, L.V., Eds.; International Society for Optics and Photonics: Bellingham, WA, USA, 2017; p. 100640Q. [Google Scholar]
  129. Rajaram, A.; Bale, G.; Kewin, M.; Morrison, L.B.; Tachtsidis, I.; Lawrence, K.S.; Diop, M. Simultaneous monitoring of cerebral perfusion and cytochrome c oxidase by combining broadband near-infrared spectroscopy and diffuse correlation spectroscopy. Biomed. Opt. Express 2018, 9, 2588–2603. [Google Scholar] [CrossRef]
  130. Wang, X.; Pang, Y.; Ku, G.; Xie, X.; Stoica, G.; Wang, L. V Noninvasive laser-induced photoacoustic tomography for structural and functional in vivo imaging of the brain. Nat. Biotechnol. 2003, 21, 803–806. [Google Scholar] [CrossRef]
  131. Tang, J.; Zhou, J.; Carney, P.R.; Jiang, H. Non-Invasive Real-time Photoacoustic Tomography of Hemodynamics in Freely Moving Rats. In Biomedical Optics; The Optical Society: Washington, DC, USA, 2014; p. BS4A.4. [Google Scholar]
  132. Deán-Ben, X.L.; Sela, G.; Lauri, A.; Kneipp, M.; Ntziachristos, V.; Westmeyer, G.G.; Shoham, S.; Razansky, D. Functional optoacoustic neuro-tomography for scalable whole-brain monitoring of calcium indicators. Light Sci. Appl. 2016, 5, e16201. [Google Scholar] [CrossRef] [PubMed] [Green Version]
  133. Guo, B.; Sheng, Z.; Hu, D.; Lin, X.; Xu, S.; Liu, C.; Zheng, H.; Liu, B. Biocompatible conjugated polymer nanoparticles for highly efficient photoacoustic imaging of orthotopic brain tumors in the second near-infrared window. Mater. Horiz. 2017, 4, 1151–1156. [Google Scholar] [CrossRef]
  134. Guo, B.; Feng, Z.; Hu, D.; Xu, S.; Middha, E.; Pan, Y.; Liu, C.; Zheng, H.; Qian, J.; Sheng, Z.; et al. Precise Deciphering of Brain Vasculatures and Microscopic Tumors with Dual NIR-II Fluorescence and Photoacoustic Imaging. Adv. Mater. 2019, 31, 1902504. [Google Scholar] [CrossRef] [PubMed]
  135. Liu, Y.; Liu, H.; Yan, H.; Liu, Y.; Zhang, J.; Shan, W.; Lai, P.; Li, H.; Ren, L.; Li, Z.; et al. Aggregation-Induced Absorption Enhancement for Deep Near-Infrared II Photoacoustic Imaging of Brain Gliomas In Vivo. Adv. Sci. 2019, 6, 1801615. [Google Scholar] [CrossRef]
  136. Li, W.; Chen, R.; Lv, J.; Wang, H.; Liu, Y.; Peng, Y.; Qian, Z.; Fu, G.; Nie, L. In Vivo Photoacoustic Imaging of Brain Injury and Rehabilitation by High-Efficient Near-Infrared Dye Labeled Mesenchymal Stem Cells with Enhanced Brain Barrier Permeability. Adv. Sci. 2018, 5, 1700277. [Google Scholar] [CrossRef]
  137. Kang, J.; Zhang, H.K.; Kadam, S.D.; Fedorko, J.; Valentine, H.; Malla, A.P.; Yan, P.; Harraz, M.M.; Kang, J.U.; Rahmim, A.; et al. Transcranial Recording of Electrophysiological Neural Activity in the Rodent Brain in vivo Using Functional Photoacoustic Imaging of Near-Infrared Voltage-Sensitive Dye. Front. Neurosci. 2019, 13, 579. [Google Scholar] [CrossRef] [Green Version]
  138. Fry, F.J.; Barger, J.E. Acoustical properties of the human skull. J. Acoust. Soc. Am. 1978, 63, 1576–1590. [Google Scholar] [CrossRef]
  139. Mohammadi, L.; Manwar, R.; Behnam, H.; Tavakkoli, J.; Nasiri Avanaki, M.R. Skull’s aberration modeling: Towards photoacoustic human brain imaging. In Photons Plus Ultrasound: Imaging and Sensing 2019; International Society for Optics and Photonics: Bellingham, WA, USA, 2019; p. 215. [Google Scholar]
  140. Petrov, Y.; Prough, D.S.; Petrov, I.Y.; Richardson, C.J.; Fonseca, R.A.; Robertson, C.S.; Esenaliev, R.O. Optoacoustic mapping of cerebral blood oxygenation in humans. In Photons Plus Ultrasound: Imaging and Sensing 2017; Oraevsky, A.A., Wang, L.V., Eds.; International Society for Optics and Photonics: Bellingham, WA, USA, 2017; p. 100640A. [Google Scholar]
  141. Tavakolian, P. Potential for Photoacoustic Imaging of Neonatal Brain. Master’s Thesis, The University of Western Ontario, London, ON, Canada, 2014. [Google Scholar]
  142. Hariri, A.; Tavakoli, E.; Adabi, S.; Gelovani, J.; Avanaki, M.R.N. Functional photoacoustic tomography for neonatal brain imaging: Developments and challenges. In Photons Plus Ultrasound: Imaging and Sensing 2017; Oraevsky, A.A., Wang, L.V., Eds.; International Society for Optics and Photonics: Bellingham, WA, USA, 2017; p. 100642Z. [Google Scholar]
  143. Wang, X.; Fowlkes, J.B.; Chamberland, D.L.; Xi, G.; Carson, P.L. Reflection mode photoacoustic imaging through infant skull toward noninvasive imaging of neonatal brains. In Photons Plus Ultrasound: Imaging and Sensing 2009; Oraevsky, A.A., Wang, L.V., Eds.; International Society for Optics and Photonics: Bellingham, WA, USA, 2009; p. 717709. [Google Scholar]
  144. Yang, X.; Wang, L.V. Monkey brain cortex imaging by photoacoustic tomography. J. Biomed. Opt. 2008, 13, 44009. [Google Scholar] [CrossRef]
  145. Kang, J.; Boctor, E.M.; Adams, S.; Kulikowicz, E.; Zhang, H.K.; Koehler, R.C.; Graham, E.M. Validation of noninvasive photoacoustic measurements of sagittal sinus oxyhemoglobin saturation in hypoxic neonatal piglets. J. Appl. Physiol. 2018, 125, 983–989. [Google Scholar] [CrossRef]
  146. Chen, Y.; Kateb, B. Neurophotonics and Brain Mapping, 1st ed.; CRC Press: Boca Raton, FL, USA, 2017; ISBN 9781482236859. [Google Scholar]
  147. Rao, Y.; Sarwade, N.P.; Makkar, R. Modeling and simulation of Optical Coherence Tomography on Virtual OCT. Procedia Comput. Sci. 2015, 45, 644–650. [Google Scholar] [CrossRef] [Green Version]
  148. Chen, C.-L.; Wang, R.K. Optical coherence tomography based angiography [Invited]. Biomed. Opt. Express 2017, 8, 1056. [Google Scholar] [CrossRef] [PubMed] [Green Version]
  149. Chong, S.P.; Merkle, C.W.; Leahy, C.; Srinivasan, V.J. Cerebral metabolic rate of oxygen (CMRO_2) assessed by combined Doppler and spectroscopic OCT. Biomed. Opt. Express 2015, 6, 3941. [Google Scholar] [CrossRef] [PubMed] [Green Version]
  150. Chong, S.P.; Merkle, C.W.; Cooke, D.F.; Zhang, T.; Radhakrishnan, H.; Krubitzer, L.; Srinivasan, V.J. Noninvasive, in vivo imaging of subcortical mouse brain regions with 17 μm optical coherence tomography. Opt. Lett. 2015, 40, 4911. [Google Scholar] [CrossRef] [PubMed]
  151. Park, K.S.; Shin, J.G.; Qureshi, M.M.; Chung, E.; Eom, T.J. Deep brain optical coherence tomography angiography in mice: In vivo, noninvasive imaging of hippocampal formation. Sci. Rep. 2018, 8, 11614. [Google Scholar] [CrossRef] [PubMed] [Green Version]
  152. Hartmann, K.; Stein, K.P.; Neyazi, B.; Sandalcioglu, I.E. First in vivo visualization of the human subarachnoid space and brain cortex via optical coherence tomography. Ther. Adv. Neurol. Disord. 2019, 12, 1756286419843040. [Google Scholar] [CrossRef] [Green Version]
  153. Hartmann, K.; Stein, K.P.; Neyazi, B.; Erol Sandalcioglu, I. Aneurysm Architecture: First in vivo Imaging of Human Cerebral Aneurysms with Extravascular Optical Coherence Tomography. Cerebrovasc. Dis. 2019, 48, 26–31. [Google Scholar] [CrossRef]
Figure 1. The basic principle of the functional near-infrared spectroscopy (fNIRS) technique. Penetrations depth is dependent on the distance between source and detector [9].
Applsci 10 02196 g001
Figure 2. A typical diffuse correlations spectroscopy (DCS) setup uses a long coherent laser, single photon detectors and correlator.
Applsci 10 02196 g002
Figure 3. The basic setup of photoacoustic imaging (PAI) includes a pulse laser, ultrasound transducer and data acquisition system.
Applsci 10 02196 g003
Figure 4. Basic optical coherence tomography (OCT) setup based on Michelson interferometer.
Applsci 10 02196 g004
Table 1. Comparison between most common optical techniques that are non-invasive, label-free and can provide information on brain function.
TechnologyMeasurement PrincipleMeasuring ParametersWavelength (nm)SourceCommon Detectorpenetration DepthSpatial Resolution Used as WearableSpeedLabel FreeCost
fNIRSScattering + absorptionCMRO2, HbT660–950LED, LD, LaserPDA few cm~1 cm/FastYesHighYesLow
Publications [15,16,17,18,19]
DCSSpeckle fluctuationBFI, CMRO2660–950Laser (coherent) APD9up to ~1.5 cm~1 cm/ fastYesHighYesLow
Publications [20,21,22,23,24,25,26,27,28,29]
PAIPA effectCMRO2, optical absorbers500–1300LD, LaserPZT or arrayup to 7 cm in soft tissuesUp to 1 μmYesDepend on image size,
Slow
YesHigh
Publications [13,30,31,32,33,34,35,36,37]
OCTLight coherence propertiesCBF, CMRO2Visible +IRWide band sourcePD6up to 2 mmUp to 1 μm NoDepend on image size,
high
YesLow
Publication [38]
Table 2. List of selected wearable fNIRS studies.
ReferenceRemarkStudy/ApplicationPhase
Piper et al. [19]2-wavelength LED, frequency-encoded illumination, time-multiplexing detector, fixed number of channelsSelf-paced left-hand gripping during outdoor bicycle riding, indoor pedaling on a training bicycle and sitting stillPoC
Pinti et al. [102] 2-wavelength LED, 16 channelsSocial daily life activities with cognitive tasksPoC
Chitnis et al. [91]2-wavelength LED, time division, modular up to 128 channelsclassic motor cortex stimulation experiments: movement of dominant hands and thumb-to-finger extension taskPoC
Funane et al. [92]2-wavelength LED, time division, modular up to 128 individual modules source or detectorhuman brain activity in the left prefrontal area of an adult male participant during a verbal fluency taskPoC
Chitnis et al. [93]8-wavelength LED, time division, modular, multidistancevisual stimulation paradigm designed to elicit a functional response in the primary visual cortexPoC
Wyser et al. [94] 4-wavelength LED, time division, modular, multidistanceArterial occlusion and Task-evoked brain activityPoC
Saikia et al. [90]2-wavelength LED, continuous wave, configurable up to 128 channelsArterial occlusion and Prefrontal Cortex with various breathing task PoC
Funane [104]Continuous wave, 22 channelsMental healthPoC in clinical use
Kotozaki et al. [105] 1 channel, 810 nmStress management in daily hasslesPoC
Zhang et al. [106] 2-wavelength laser diode, continuous wave, with ECG and acceleration sensorNormal daily activities, e.g., walking, playingPoC in clinical use

