Article

Classification of Tactile and Motor Velocity-Evoked Hemodynamic Response in Primary Somatosensory and Motor Cortices as Measured by Functional Near-Infrared Spectroscopy

1
Department of Biological Systems Engineering, University of Nebraska-Lincoln, Lincoln, NE 68583, USA
2
Center for Brain, Biology, and Behavior, University of Nebraska-Lincoln, Lincoln, NE 68583, USA
3
Department of Special Education and Communication Disorders, University of Nebraska-Lincoln, Lincoln, NE 68583, USA
*
Author to whom correspondence should be addressed.
Appl. Sci. 2020, 10(10), 3381; https://doi.org/10.3390/app10103381
Submission received: 31 January 2020 / Revised: 29 April 2020 / Accepted: 11 May 2020 / Published: 14 May 2020
(This article belongs to the Special Issue Optics and the Brain)

Abstract

:
Functional near-infrared spectroscopy (fNIRS) is an emerging technique in studying cerebral hemodynamics; however, consensus on the analysis methods and the clinical applications has yet to be established. In this study, we demonstrate the results of a pilot fNIRS study of cerebral hemodynamic response (HR) evoked by pneumotactile and sensorimotor stimuli on the dominant hand. Our goal is to find the optimal stimulus parameters to maximally evoke HR in the primary somatosensory and motor cortices. We use a pulsatile pneumatic array of 14 tactile cells that were attached to the glabrous surface of the dominant hand, with a patterned stimulus that resembles saltation at three distinct traverse velocities [10, 25, and 45 cm/s]. NIRS optodes (16 sources; 20 detectors) are bilaterally and symmetrically placed over the pre-and post-central gyri (M1 and S1). Our objective is to identify the extent to which cerebral HR can encode the velocity of the somatosensory and/or motor stimuli. We use common spatial pattern for feature extraction and regularized-discriminant analysis for classifying the fNIRS time series into velocity classes. The classification results demonstrate discriminatory features of the fNIRS signal from each distinct stimulus velocity. The results are inconclusive regarding the velocity which evokes the highest intensity of hemodynamic response.

1. Introduction

Understanding the quantifiable effects of peripheral somatosensory stimulation in the brain is crucial, particularly in rehabilitative and therapeutic interventions designed to mitigate movement disorders that are associated with cerebrovascular stroke, traumatic brain injury, and progressive neuromotor brain diseases, which degrade locomotion, digital manipulation, speech, gesture, and deglutition [1,2,3]. Numerous clinical studies have shown beneficial effects of somatosensory stimulation in the treatment of movement disorders in subacute and chronic stroke patients [4,5,6,7]; however, the results are far from conclusive [8,9,10], as the improvements can be rather subjective or extremely difficult to quantify. Another approach gaining traction in animal models involves the use of sensorimotor interventions to promote blood circulation to the infarcted areas of the brain [11,12].
The limitations or lack of neurotechnological tools and brain imaging techniques is an impeding factor in the advancement of neurotherapeutics for sensorimotor impairments. Noninvasiveness, ease of use, portability, accessibility, affordability, personalization of care, and robust data analytics are all important factors when any potential imaging or therapeutic technique is being considered. Near-Infrared Spectroscopy (NIRS) is an emerging example of a simple yet powerful tool that can be used both as a neuroimaging modality for indirect monitoring of cortical blood oxygenation, or as a therapeutic tool when employed in brain-computer interfaces or neurofeedback applications [13,14,15,16].
Since the early 1990s [17,18], functional near-infrared spectroscopy (fNIRS) has become an increasingly appealing neuroimaging tool that is used by researchers to study the functional activation of the human brain [19,20], particularly the cortical hemodynamic response (HR). The signals of interest in human fNIRS are derived from the photon absorption rates of two Hemoglobin (Hb) chromophores in the bloodstream, i.e., oxygenated-Hb (HbO) and deoxygenated-Hb (HbR). fNIRS is particularly suitable for studying superficial layers (2–3 cm deep) of cortex in human adults, e.g., in somatosensory and motor research, due to theoretical and practical constraints in imaging deeper layers of the adult brain imposed by the photon path, scattering and absorption [21,22,23,24].
The human tactile somatosensory network is localized to the parietal and frontal cerebral cortices and it shares reciprocal connectivity with tactile-velocity representations in the cerebellum and thalamus [25]. Recent fMRI studies have demonstrated a best-velocity sensitivity to saltatory pneumotactile stimuli traversing the hand [26] and face [27] ranging from 5 to 65 cm/s. Thus, reproducible and quantitative stimulus delivery is crucial in sensorimotor rehabilitation, training, and research. Additionally, noninvasiveness, versatility, and multimodal compatibility of the applicable techniques are especially important. The pneumatic tactile stimulation array used in this study [26,28] is compatible with all imaging modalities and it enables us to systematically deliver programmable tactile stimuli in distinct patterns and salient velocities [29,30,31].
Methodological differences in the analysis of fNIRS data [32,33] can potentially lead to inconsistent interpretations. Machine learning algorithms are being increasingly utilized for fNIRS analysis in order to minimize such disparities and improve reproducibility [34,35,36]. The initial objective of this paper is to validate the existence of any form of encoding of stimulus velocity in HR, and to ultimately design stimulus protocols, e.g., for post-stroke sensorimotor rehabilitation of upper extremities, which would maximally evoke HR in S1 and M1. As a first step toward this goal, we use an automated algorithm based on regularized discriminant analysis (RDA) [37] for supervised classification of fNIRS time series into their corresponding velocities based on time-domain features, where common spatial pattern (CSP) [38] is used for feature extraction. Linear discriminant analyses are commonly used in brain-computer interfaces (BCIs), when dealing with many feature vectors that are correlated, e.g., in fNIRS, electroencephalography (EEG), or other high-dimensional datasets. RDA is particularly useful, as it takes advantage of a tuning parameter that automatically determines the degree to which the covariances should be pooled. Additionally, RDA works well with dimensionality reduction algorithms, such as CSP, as they both use the same covariance matrix. Moreover, we showcase the objectivity advantage of using automated algorithms in fNIRS analysis.

2. Materials and Methods

2.1. Participants

Eleven right-handed neurotypical adults (six males) between the ages of 19 and 35 years (μ = 25.1 years, S.D. = 5.3) were recruited and enrolled in the study. The participants had no history of neurological incidents or disorder. Prior to each experiment, the participants provided written informed consent, and their hand and head dimensions were measured. This study was approved by University of Nebraska Institutional Review Board (IRB# 20180218036EP).

2.2. Experiment Design

We designed two experiments, including passive (somatosensory only) and active (motor plus somatosensory), in order to investigate the most effective stimulation parameters in evoking HR. Continuous wave fNIRS data was recorded at a sampling frequency of 7.8 Hz via a NIRX NIRScout™ [39] system. Figure 1a shows the optode probe layout based on the standard 10–20 system which consists of 16 dual-tip LED sources and 20 detectors that were configured over both hemispheres for a total of 104 channels (52 HbO and 52 HbR links). The associated wavelengths with HbR and HbO in the absorption spectra were 760 nm and 850 nm, respectively. The sources and detectors were bilaterally placed over the primary somatosensory (S1, postcentral gyrus) and primary motor (M1, precentral gyrus) cortices.
For both passive and active experiments, the Galileo™ pneumatic tactile stimulator [40], shown in Figure 1b, was programmed to deliver the different velocities of saltation on the glabrous skin of the dominant hand propagated through an array consisting of 14 TAC-Cell nodes. The saltatory wave consisted of pneumatic pulses (60 ms duration, 10 ms rise/fall) that were delivered directionally, as shown by the arrows in Figure 1c, starting from four distal fingertip phalangeal nodes (D2–D5), traversing over the corresponding four proximal phalangeal nodes, and terminating at the distal phalynx of the thumb (D1). The velocity of the saltatory pneumotactile wave was presented in a random-balanced design at 10, 25, and 45 cm/s. During the active task, the participants were instructed to mimic the saltatory pattern immediately upon the detection of the pulsed stimuli at their D2–D5 fingertips, by flexing their fingers at a matching velocity, and remain still otherwise. During the passive task, the participants were instructed to relax and remain still throughout the experiment.
The participants had 10 minutes of rest between the active and passive tasks. Every recording session began with 60 s of rest, followed by 30 velocity trials (10 per velocity) each lasting 40 s, consisting of 20 s stimulus followed by 20 s of no stimulation, as illustrated in Figure 1e. The interval between two consecutive saltatory waves was 2 s, while the internode intervals varied based on the velocity and measured node distances. The number of saltatory waves across subjects was consistent; however, it was different across velocities, e.g., up to three more stimulus trains could fit in a 20 s window for the fastest velocity (45 cm/s) when compared to the slowest (10 cm/s). The disparity between the number of stimulus trains across velocities was a concern in the experimental design, but we decided to impose a consistent duration of stimulation, as opposed to a consistent number of pulses. The order of velocity trials was randomized. The total duration of each experiment was 20 minutes plus an initial 60 s of baseline recording for each participant.

2.3. Data Analysis

2.3.1. Preprocessing

NIRS brain AnalyzIR toolbox [41] was used for preprocessing of the fNIRS data. The following modules of Version 615 with default settings were used for preprocessing the data:
  • BaselineCorrection() for removing DC-shift and motion correction which detects statistical outliers following an autoregressive integrative model fit of the data,
  • OpticalDensity() for calculating log r a w m e a n ( r a w ) , and
  • BeerLambertLaw() for applying the modified Beer–Lambert law.
Before and after preprocessing, the time series were visually inspected to make sure no abundantly noisy or abnormal segments are present in the data.
The input dataset to our algorithm were the estimated concentration changes of HbO and HbR over time. The time series (52 channels × 2 wavelengths) were detrended and bandpass filtered [0.01 Hz–0.18 Hz], in order to retain physiologically relevant components [42] of the fNIRS signal.
Following preprocessing, the fNIRS trials were split into stim-on and stim-off periods of 20-s duration by using the timestamps of stimulus pulse train. For feature extraction, only the last 10 s of stim-on, and the last 10 s of stim-off were considered. At the i -th trial, the data x i     m × d from all channels are windowed to 5-s blocks with 80% overlap, and then concatenated, such that m = n c h × n s , where n c h and n s are number of channels and number of samples in each time window, respectively, and d is total number of 5-s blocks within the i -th trial. When considering the 80% overlap, there are six 5s blocks within each 10 s period of stim-on and stim-off, which adds up to d = 12 blocks per trial. At 7.8 Hz sampling rate, there are n s = 39 samples per 5 s block per channel, adding up to 4056 samples for the n c h = 104 channels of HbO and HbR per velocity. These blocks are the high-dimensional inputs to the CSP algorithm for dimensionality reduction.

2.3.2. Channel Selection

A binary classification on data that were collected from each channel has been applied to identify the putative set of channels, including task-related concentration changes of HbO and HbR during the stim-on period when compared to the stim-off period. Accordingly, we have computed the average of each measurement block, i.e., summation of each block divided by its length, for both stim-on and stim-off periods. We used RDA to discriminate between stim-on and stim-off conditions in order to learn which channels attain the highest accuracy and area under the curve (AUC) in a binary classification of two exemplary discriminable periods.
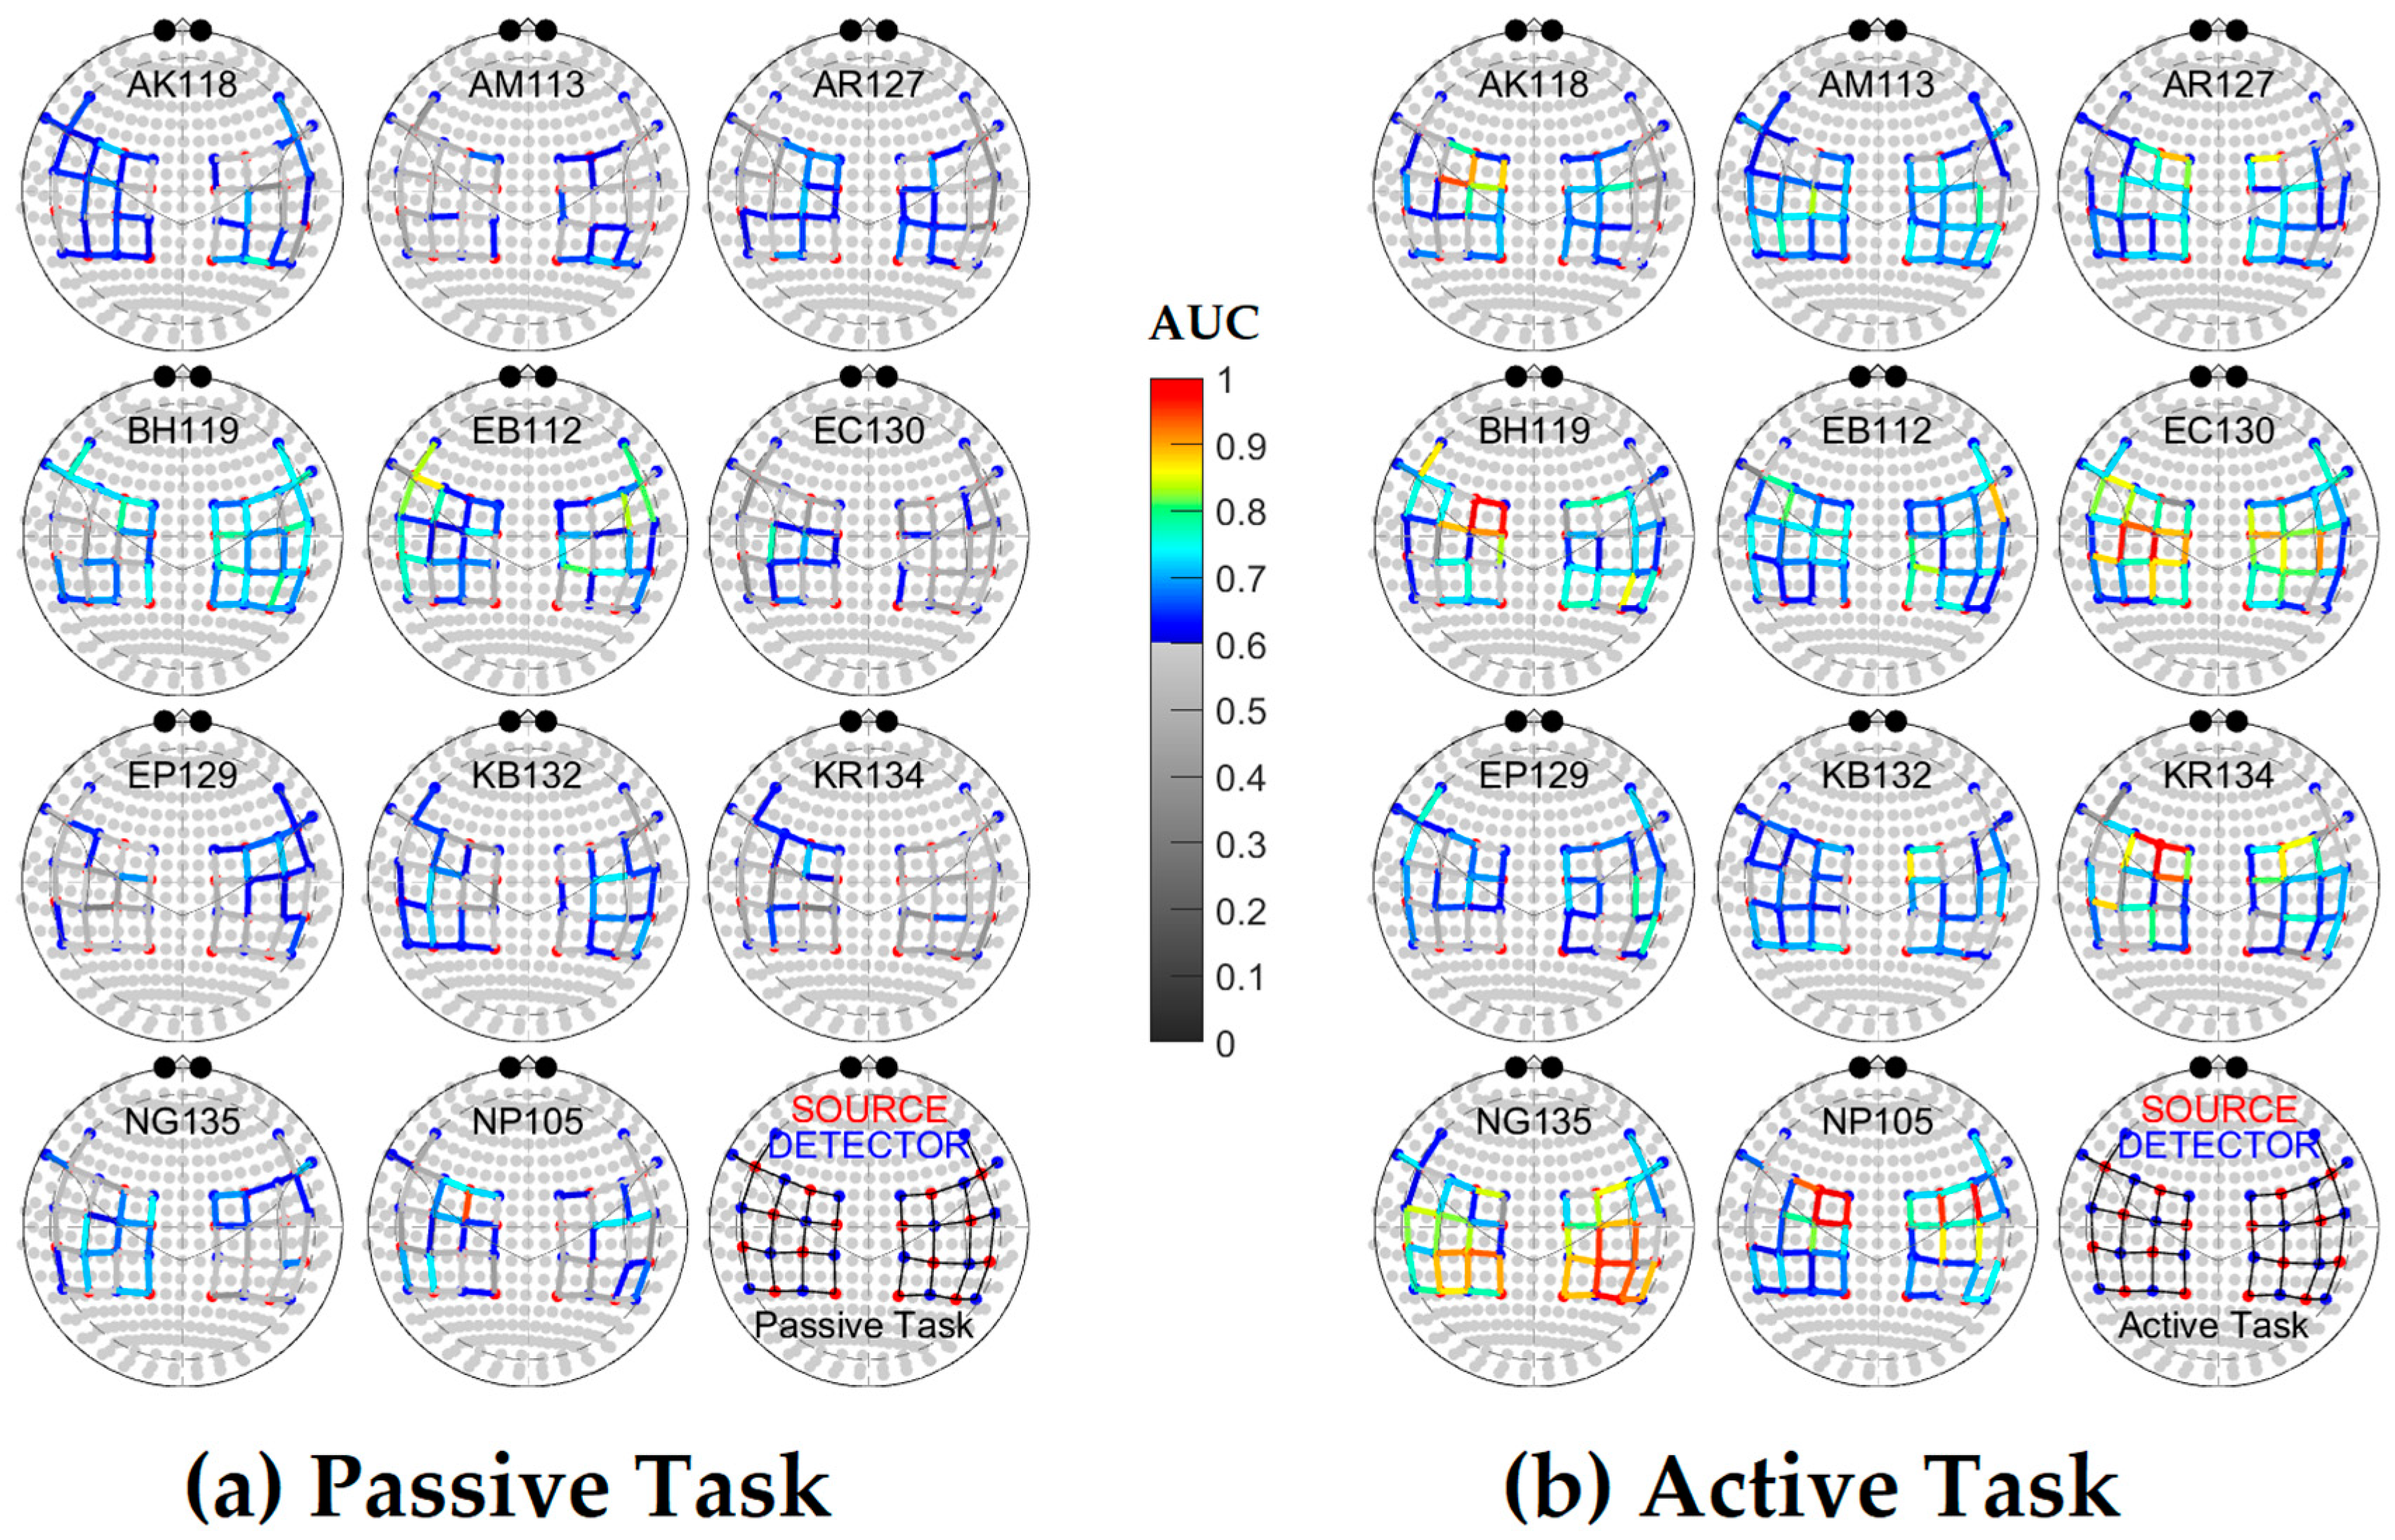
Before proceeding to dimensionality reduction and velocity classification task, we trimmed the feature space by only selecting channels that meet the AUC > 60% criterion in discriminating the stim-on and stim-off conditions, as illustrated in Figure 2. Table 1 shows the percentage of channels per subject, which meet the 60% AUC threshold and remain in the feature space for velocity classification. The average percentage of included channels are 47% and 77% for the passive and active tasks, respectively.

2.3.3. Feature Extraction and Classification

Extracting features that provide the most information about the stimulus-related evoked HR is one of the main challenges for the classification problem at different velocities. CSP is a widely used method of feature extraction in multivariate biological signals [38], which has found application in a diverse range of fields, particularly in motor imagery BCIs based on EEG [43] or fNIRS [44,45]. For binary classification, given a two-class dataset (e.g., stim-on vs. stim-off), CSP computes spatial filters that maximize the ratio of the variance of the data of one class to the variance of the other and projects the resultant data into a low-dimensional space via a linear transformation. A set of spatial filters W * can be determined by solving the following optimization problem:
W * = arg   max w { W T Σ 1 W W T Σ 2 W }
where Σ c is the covariance matrix corresponding to the class c . Given W * , the filtered signal can be presented as:
x ˜ i = W * T x i
Assuming that the spatial feature vectors captured by CSP follow a Gaussian distribution, i.e., x ˜ i   ~ N ( μ ,   Σ ) , and are independent and identically distributed (i.i.d.), we apply RDA for classification of combined HbO and HbR time series to the provided velocity labels. K-fold cross validation ( K = 10 ) is used to learn the hyperparameters of the classifier, including shrinkage and regularization parameters, and to maximize the AUC.

3. Results

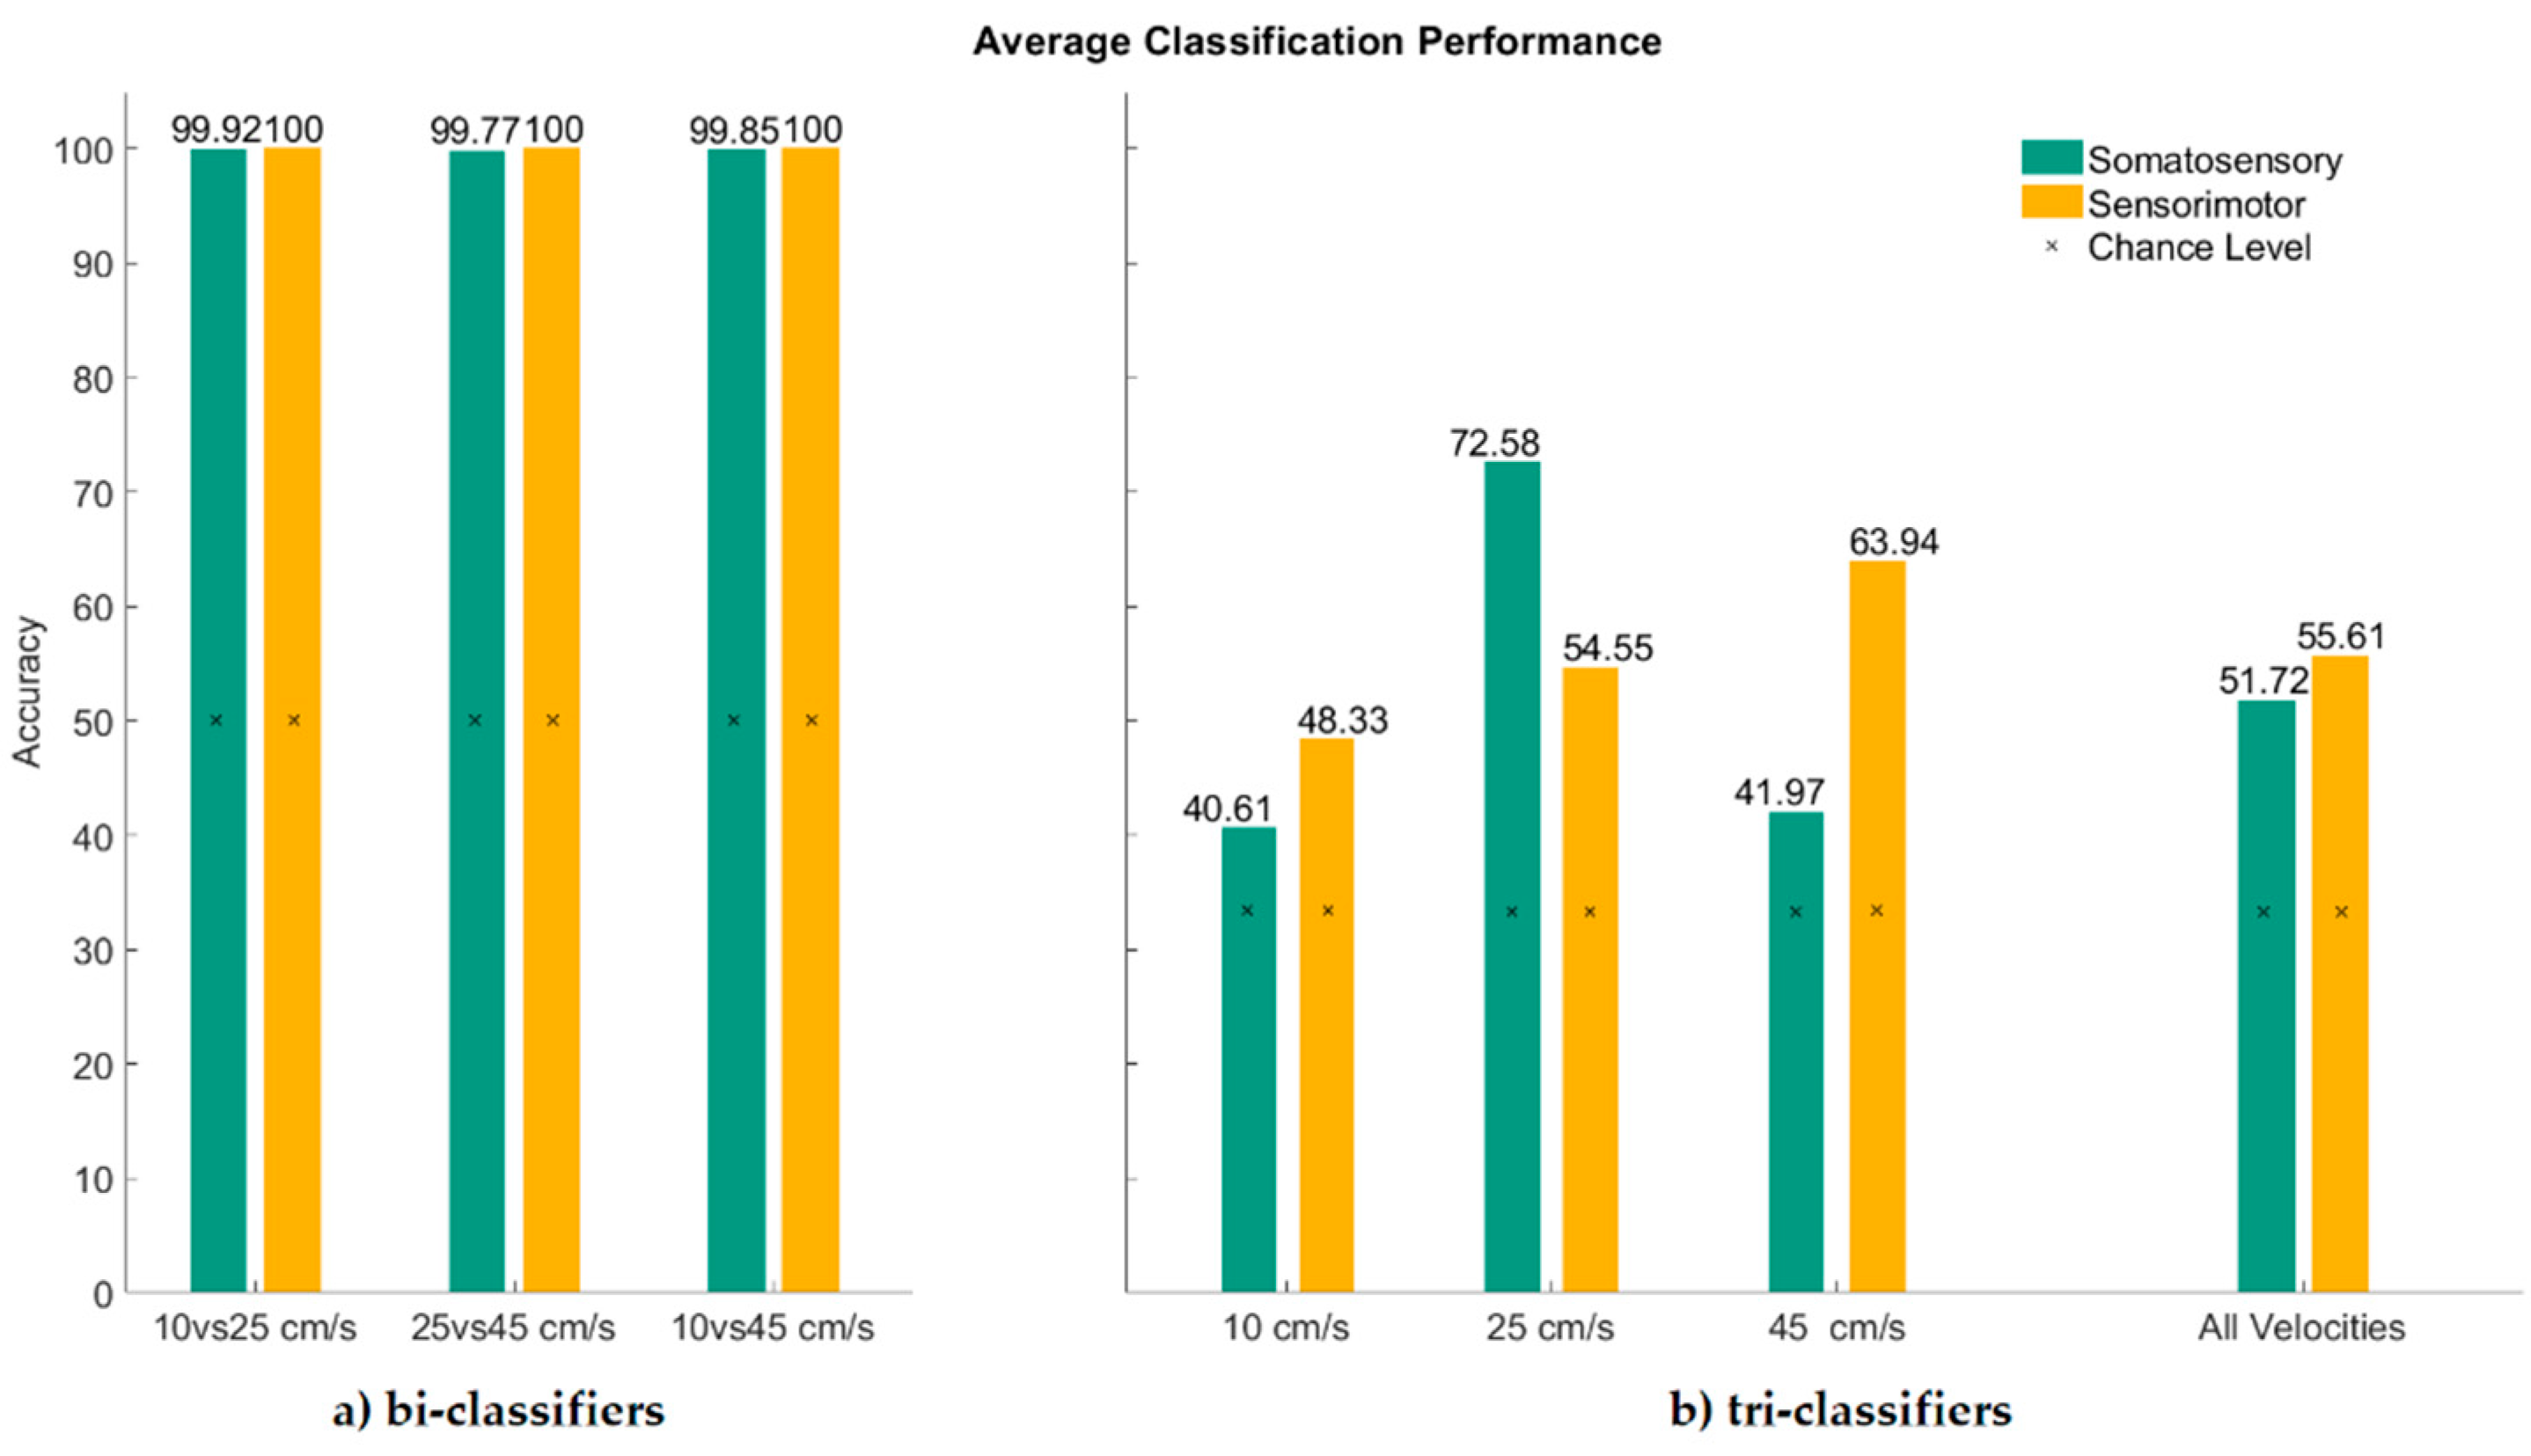
For binary classification, i.e., pairwise comparison between two velocities, we evaluated the performance of the classifier in three cases: 10 vs. 25, 10 vs. 45, and 25 vs. 45 cm/s. As commonly expected for bi-classifiers, and as shown in Figure 3a, they perform almost perfectly (Accuracy > 99%) in both active and passive tasks. However, when given the task of distinguishing the correct velocity out of the possible velocities, i.e., a tri-classifier with chance level at 33%, as shown in Figure 3b, the average performance drops to 51.7% and 55.6% accuracy for passive and active tasks, respectively, ranging from 40.6% accuracy at worst and 72.6% at best.
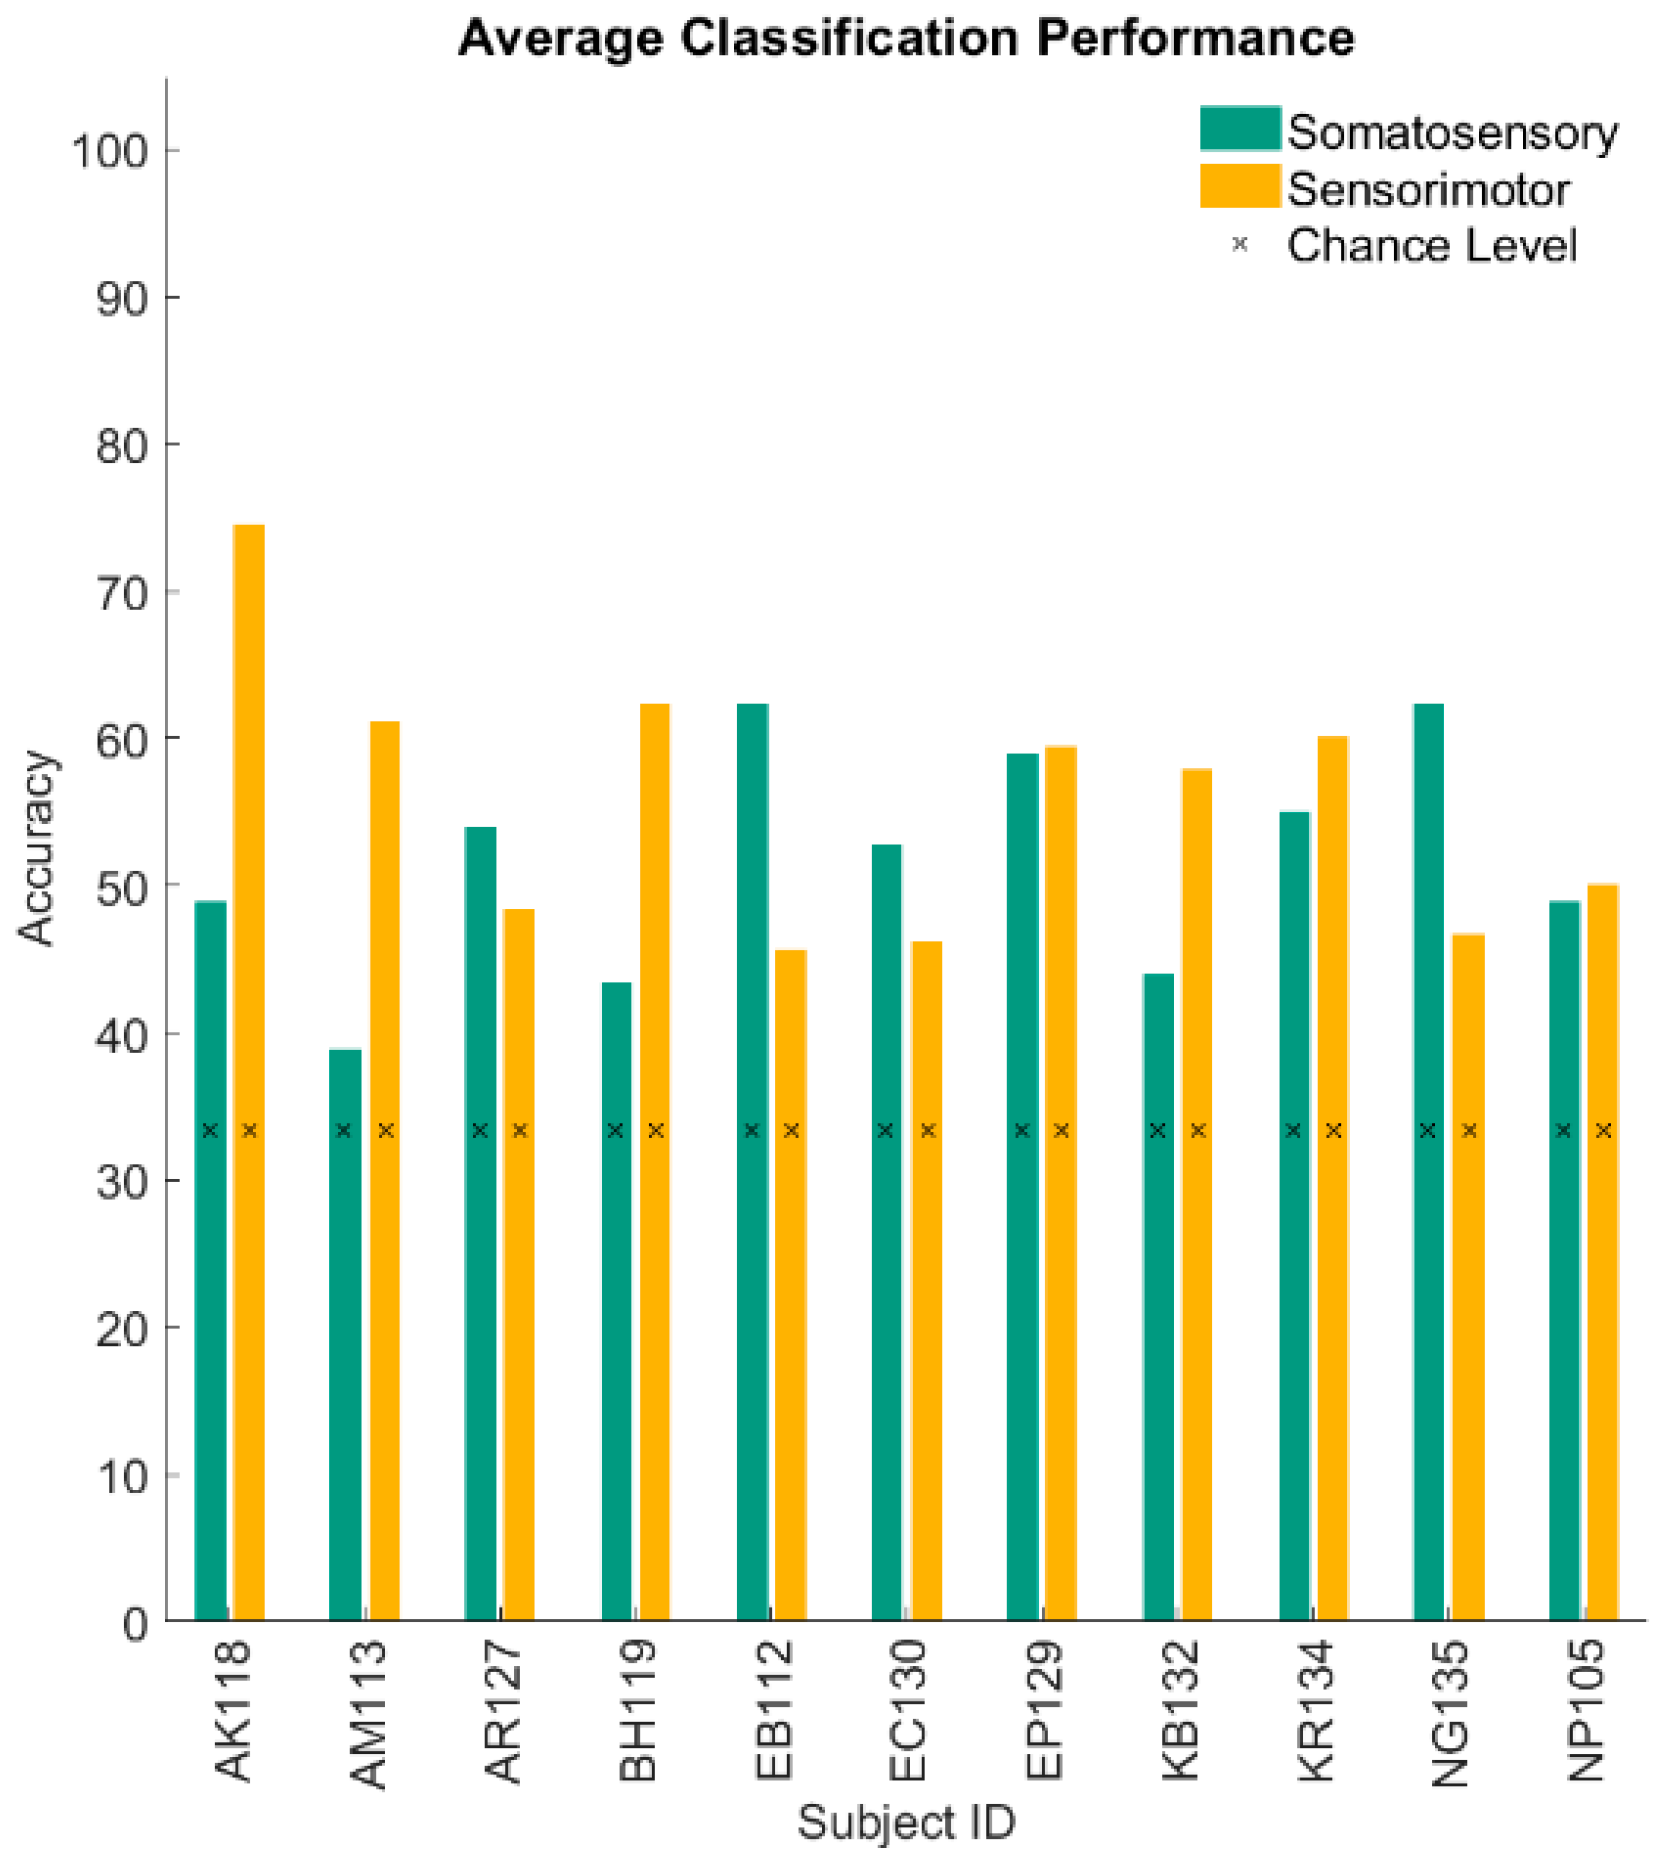
Figure 3 demonstrates that the average performance of the classifiers greatly exceeds the chance level. In Figure 4, the detailed classification performance of tri-classifiers is shown for each of the 11 participants, to confirm the consistency of this performance for every participant.
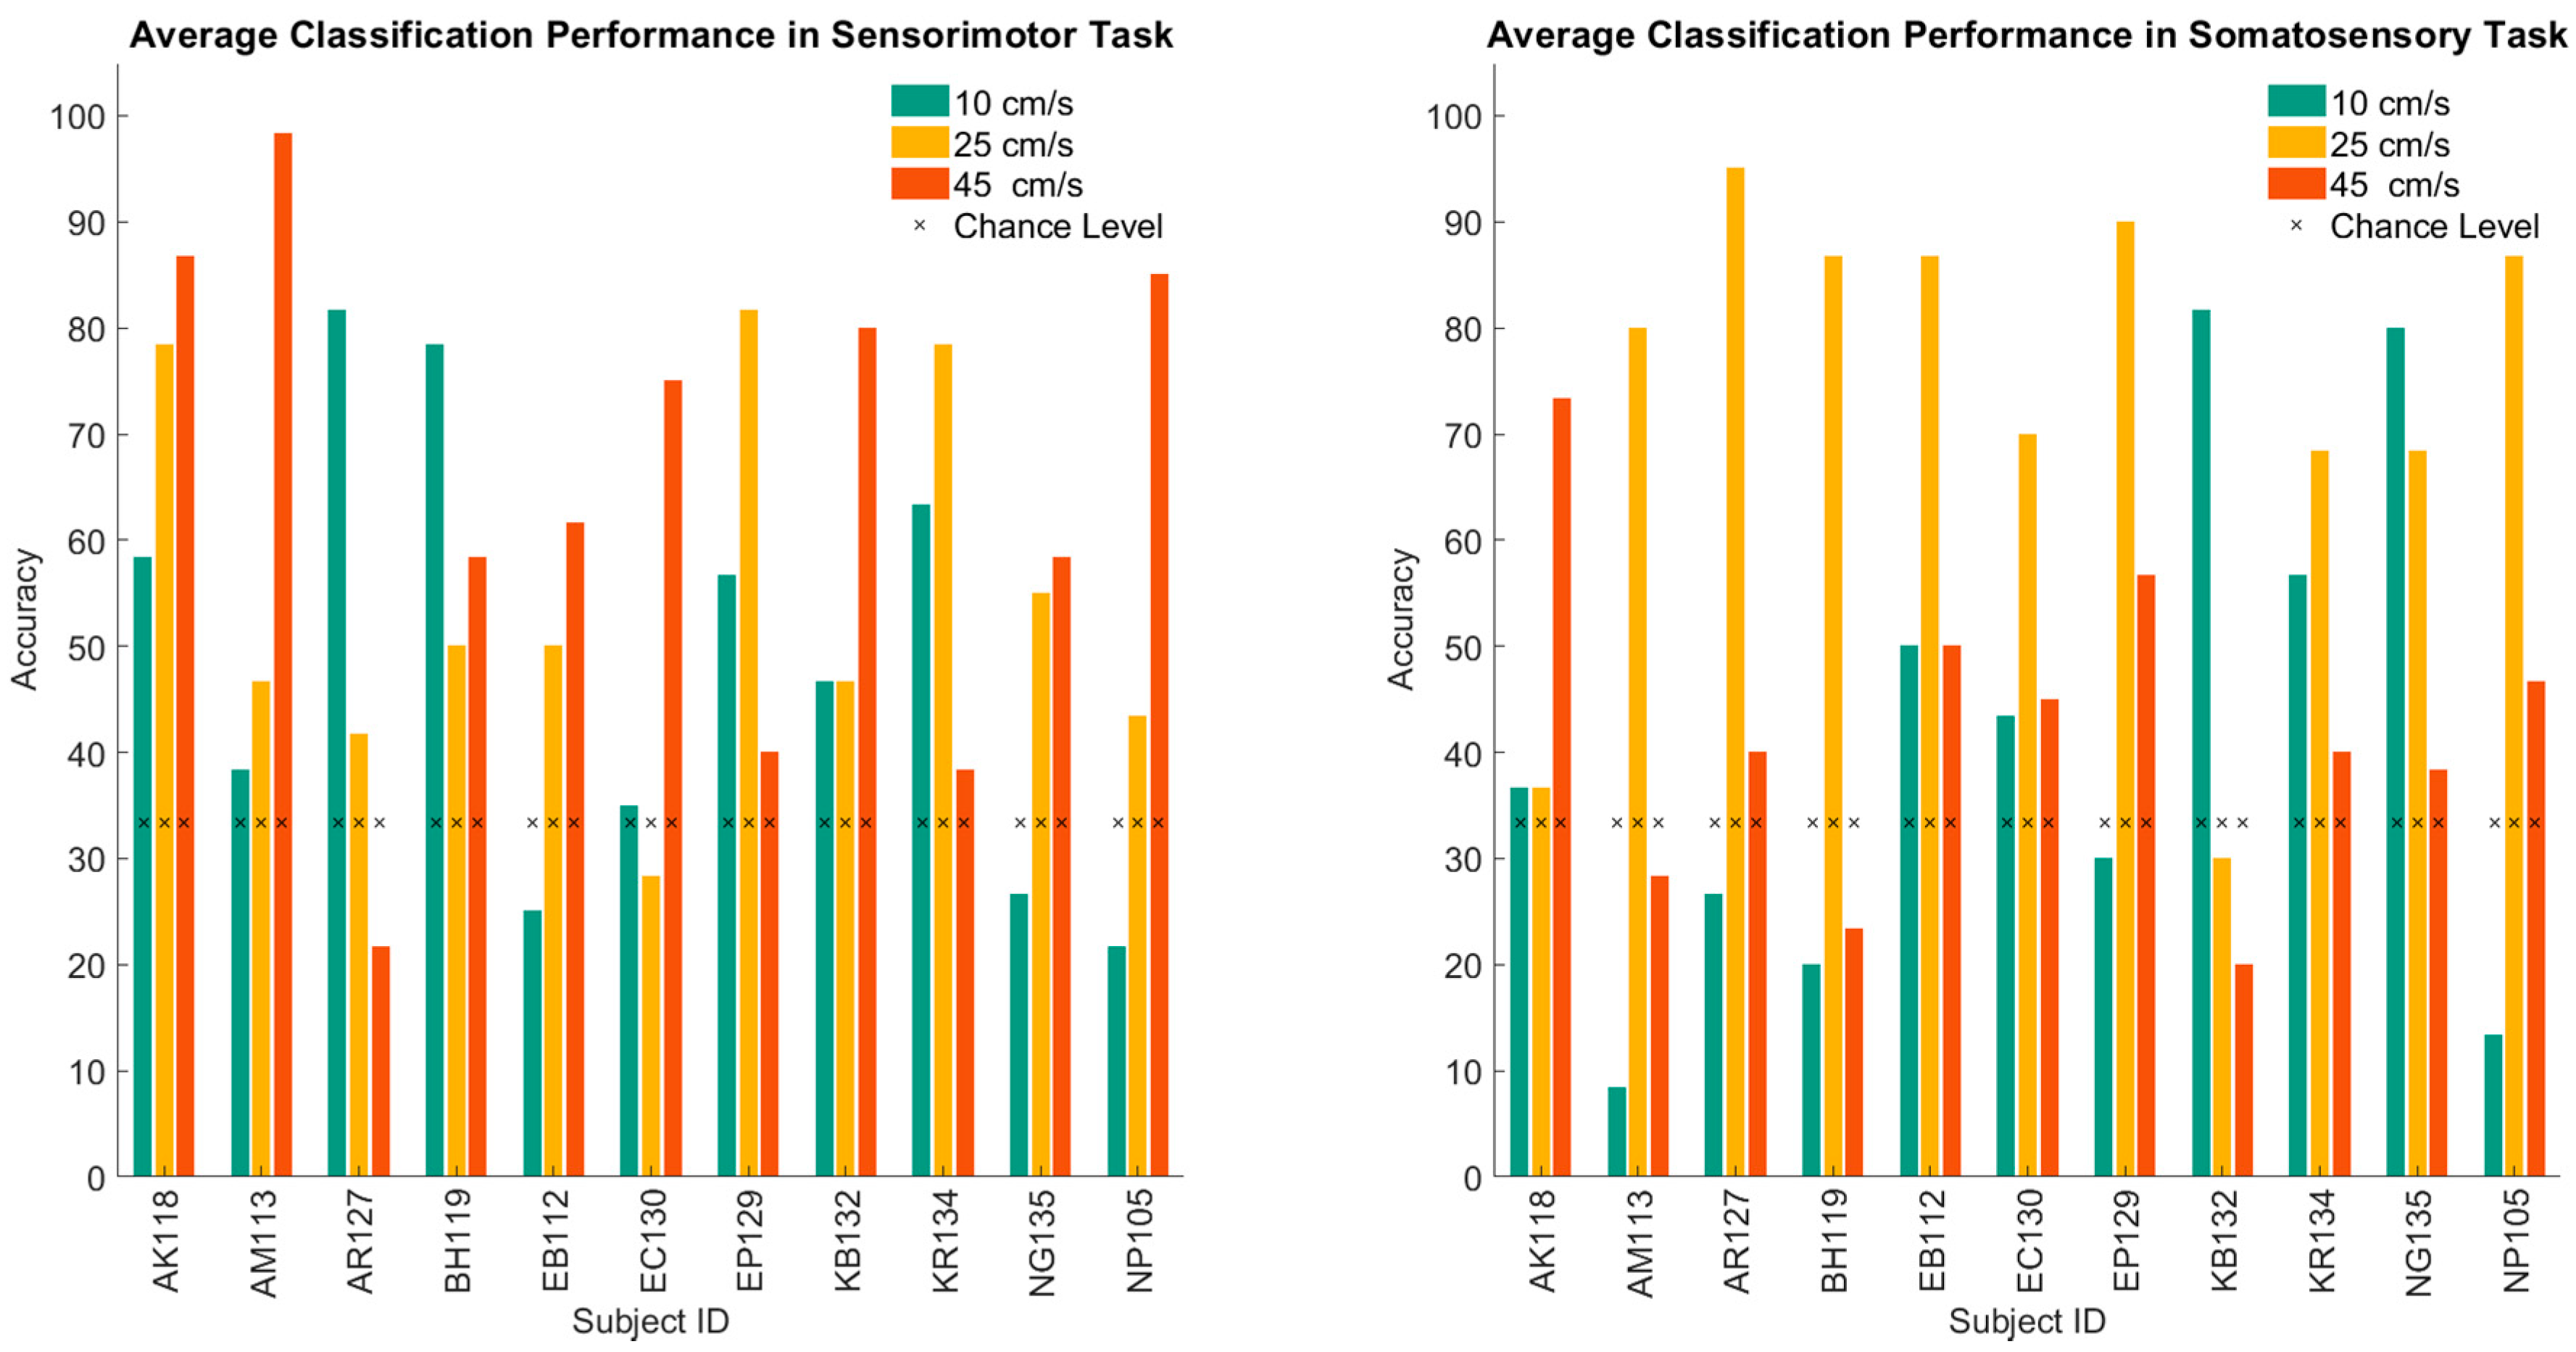
We show in Figure 5 the performance of the tri-classifiers in both active and passive tasks for every velocity and participant to further investigate the performance of the classifiers across participants and tasks.
Despite the consistent aggregated performance of the tri-classifiers above the chance level shown in Figure 3b and Figure 4, Figure 5 shows that, of the 33 individual classification tasks, five and nine instances fail to perform above the chance level in active and passive experiments, respectively.
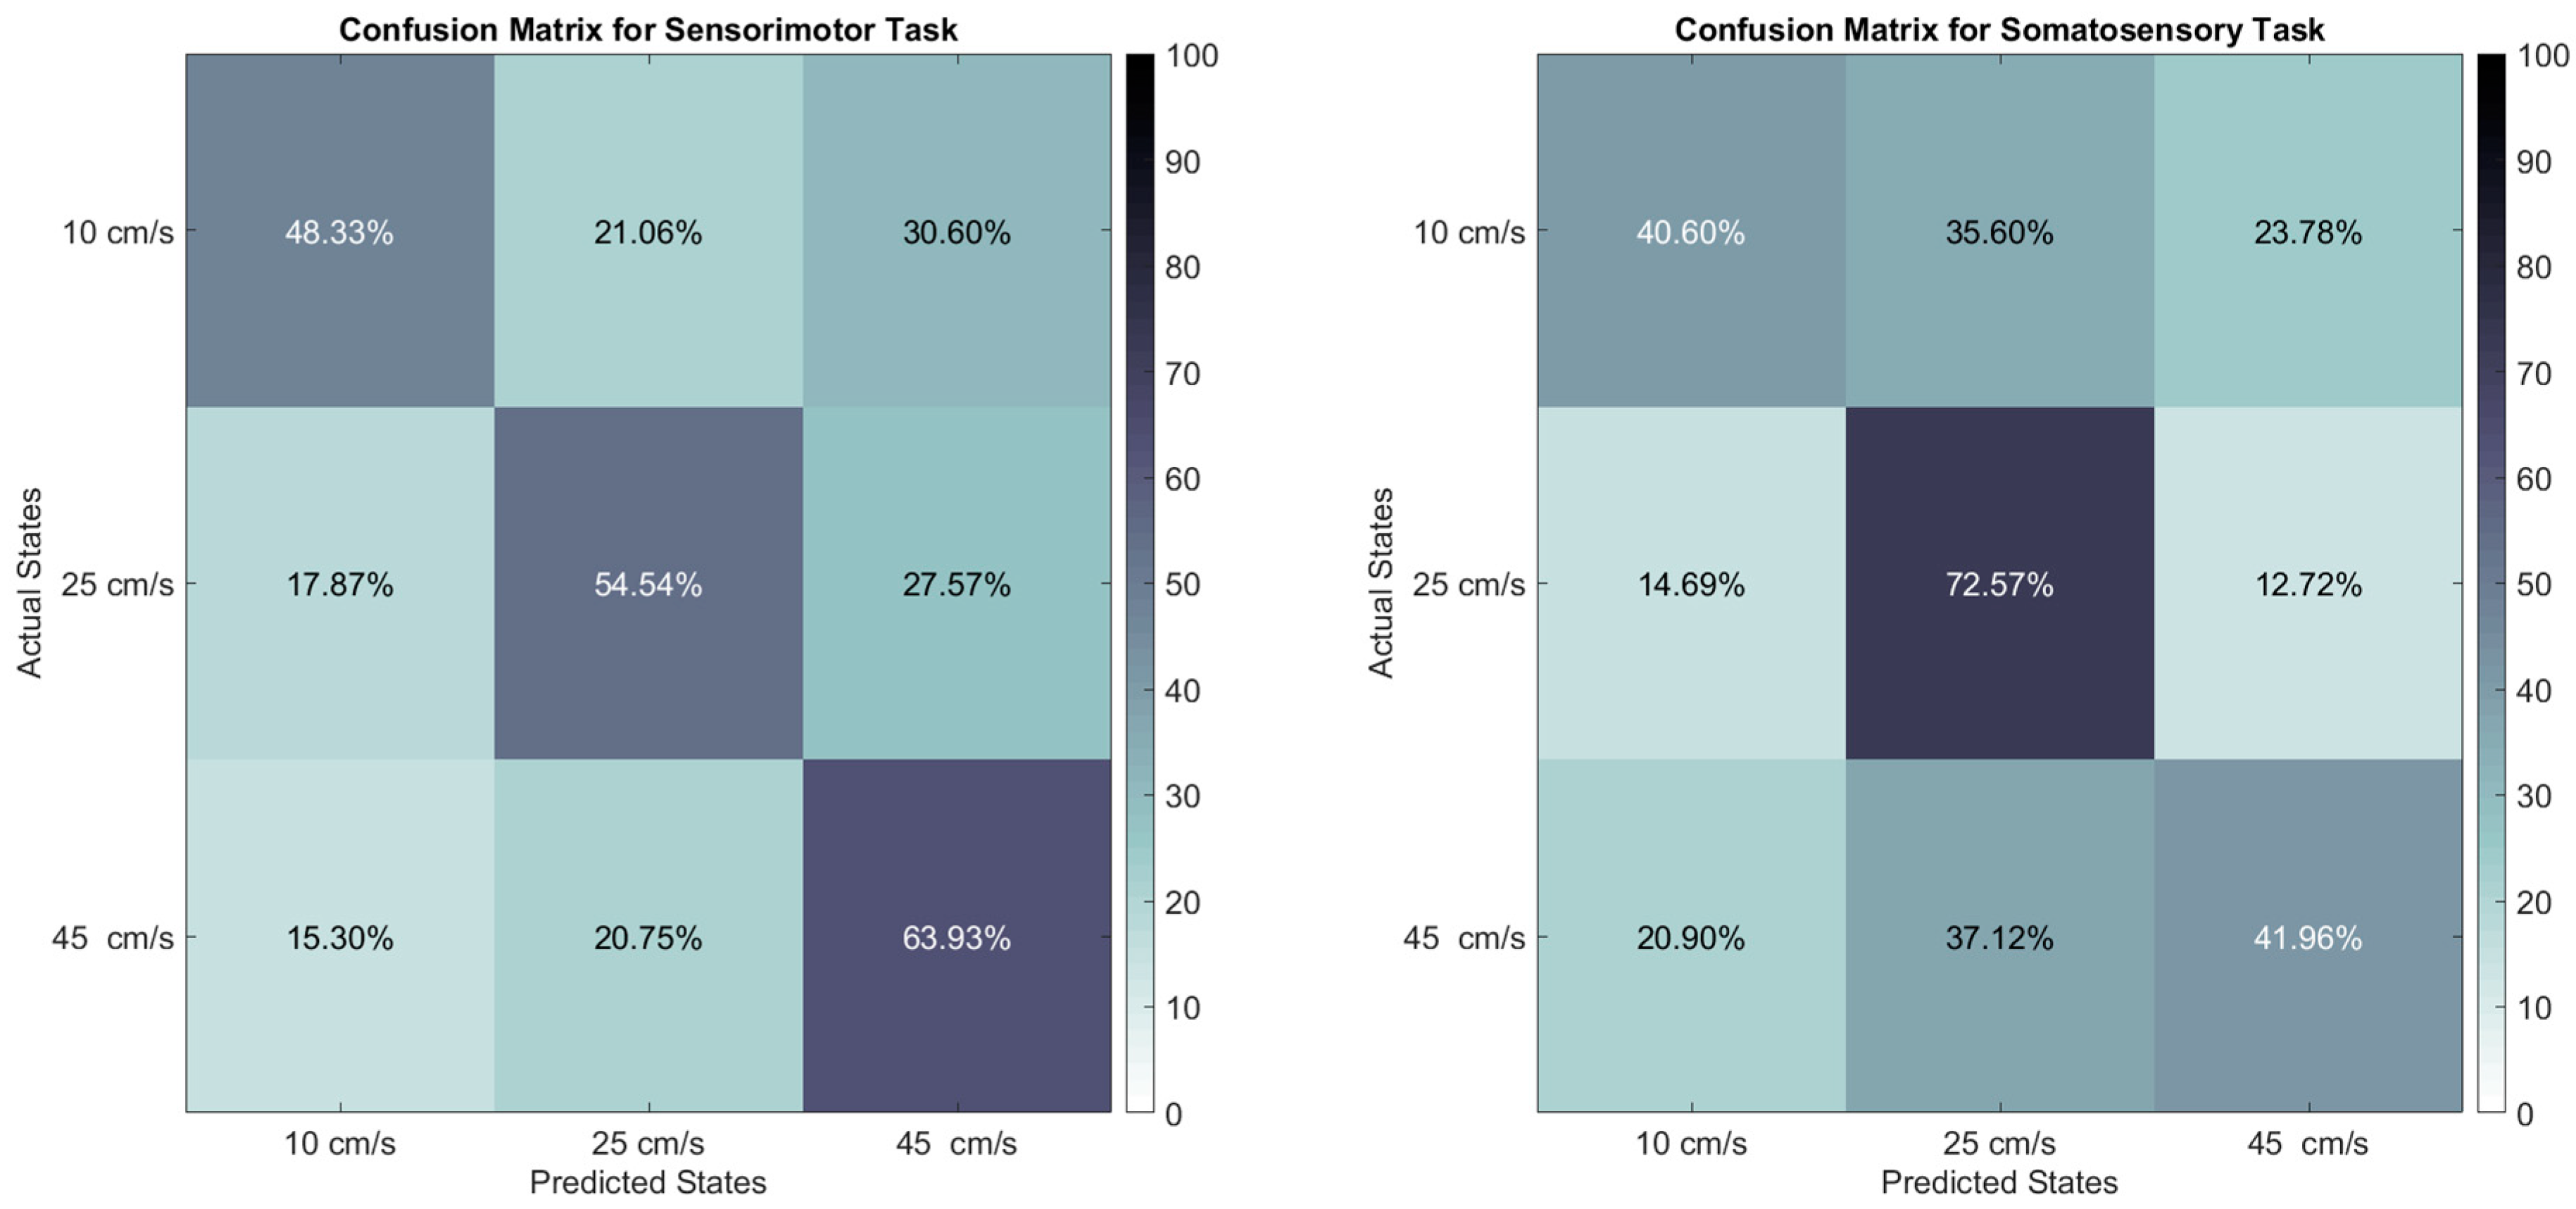
Figure 6 shows the confusion matrices for the classification performance.
For the active experiment, the tri-classifier performs the best in detecting the highest velocity (64% accuracy), and the worst for the lowest velocity (48% accuracy), as demonstrated in Figure 6.
For the passive experiment, the tri-classifier performs reliably well in detecting the middle velocity of 25 cm/s with 73% accuracy, while only being marginally acceptable for the lowest and highest velocities (41% and 42% accuracies, respectively).

4. Discussion

In the present study, we used a somatosensory and motor stimulation paradigm in order to study the dynamics of evoked cerebral HR, as measured by fNIRS, when the velocity of the somatosensory or motor stimulus is the variable of interest. The primary aim was to identify the stimulus parameters that evoke the maximum HR. Additionally, we trained and evaluated the performance of an RDA-based classifier in discriminating the traverse velocity of the stimulus.
To the best of our knowledge, no machine learning algorithm has been previously used to classify the fNIRS-based HR signal when the velocity of the stimulus is the variable of interest. The most-comparable BCI-fNIRS studies involving three-class discrimination tend to consider inherently more discriminable scenarios, e.g., rest vs. left-hand vs. right-hand motor execution [46], or mental arithmetic vs. left-hand vs. right-hand motor imagery [47].
The average accuracies of tri-classifiers that are reported in [46,47] range roughly from 55% to 90%, depending on the classification task, feature vectors, and the classification algorithms. In comparison, our average accuracies of 51.7% and 55.6% for the passive and active task, respectively (as shown in Figure 3b), for an inherently less discriminable task, demonstrates the potential of fNIRS in revealing and exploiting subtle HR differences. The near-perfect performance (>99%) of two-class discrimination of the stimulus, as illustrated in Figure 3a, makes fNIRS an ideal complementary modality in hybrid BCI solutions, particularly given the ease-of-use and noninvasive nature of the technology.
The immediate next step in improving the classification performance, is the fine-tuning of the classifier and the optimization of the feature vectors based on the specific task. Since the M1 and S1 areas of the cortex are extremely responsive to any movement, additional improvements may be achieved by motion-correction solutions and monitoring movement artifacts, e.g., by the inclusion of electromyogram or accelerometer sensors. It is important to note that, even if the fNIRS acquisition device is completely robust against movement artifacts, the elicited HR of such movements in the cerebral cortex still remains, and can only be addressed if comprehensive auxiliary signals point to undesirable movements. The evoked hemodynamic response in extracerebral tissues, e.g., skull and scalp, is another conflicting measurement that is picked up by the NIRS machine. Therefore, the inclusion of short-separation channels for regressing out the extracerebral HR can improve the reliability and accuracy of such experiments. Furthermore, physiological monitoring with a minimal array of EEG electrodes to monitor participant status (i.e., alert, drowsy, sleep) is advisable, as state control can significantly affect cerebral process mechanisms, including HR and blood flow dynamics during somatosensory encoding and motor control [48].
It is known [49] that voluntary sensorimotor tasks, i.e., the active paradigm (motor plus somatosensory), can evoke a larger HR amplitude due to the activation of motor cortex and movement-related afference which engages S1, as opposed to somatosensory-only tasks that typically involve passive tactile stimulation of the extremities. Higher HR amplitude could potentially lead to more discriminable feature vectors, which is a possible explanation behind the slightly higher average accuracy (55.6% vs. 51.7%) in the active versus passive experiment. However, if discriminating the stimulus velocities was the only goal, the inclusion of active paradigm may not be justifiable, as it may bring complicating factors to the study, such as movement artifacts or how the participants vary in performing the task, and negatively impact the reproducibility. Moreover, the applied hand flexion force by participants during the active paradigm, and its likely variation across different velocity trials, is a potentially a contributing factor in evoking HR [50,51]. Another confounding factor is the response latency by the participants during the active task, which can also affect HR, further complicating the interpretation of the results and a fair comparison against the passive task.
Perhaps by simplifying the experiment design through excluding the active paradigm, and by including additional stimulus velocities instead, one can better identify the maximally discriminable stimulus parameters and feature vectors. Although the average accuracy results that are presented in this study demonstrate the feasibility of velocity discrimination in HR, as measured by fNIRS, the fact that nine out of 33 classification accuracies in the passive task are below the chance level, as illustrated in Figure 5, emphasizes the need to curate stimulus parameters and feature vectors that improve the reliability of the classifier.

Author Contributions

Conceptualization, M.H. and S.B.; methodology, M.H., J.G. and S.B.; software, M.H. and J.G.; validation, M.H. and S.B.; formal analysis, M.H.; investigation, M.H., M.S. and J.G.; resources, S.B.; data curation, M.H., M.S. and J.G.; writing—original draft preparation, M.H.; writing—review and editing, M.H., J.G., M.S. and S.B.; visualization, M.H.; supervision, S.B.; project administration, M.H.; funding acquisition, S.B. All authors have read and agreed to the published version of the manuscript.

Funding

This research was funded in part by the Barkley Trust at the University of Nebraska (Barlow PI).

Conflicts of Interest

The authors declare no conflict of interest.

References

  1. Kamper, D.G.; Fischer, H.C.; Conrad, M.O.; Towles, J.D.; Rymer, W.Z.; Triandafilou, K.M. Finger-thumb coupling contributes to exaggerated thumb flexion in stroke survivors. J. Neurophysiol. 2014, 111, 2665–2674. [Google Scholar] [CrossRef]
  2. Kang, N.; Cauraugh, J.H. Force control in chronic stroke. Neurosci. Biobehav. Rev. 2015, 52, 38–48. [Google Scholar] [CrossRef] [PubMed]
  3. Seo, N.J.; Enders, L.R.; Motawar, B.; Kosmopoulos, M.L.; Fathi-Firoozabad, M. The extent of altered digit force direction correlates with clinical upper extremity impairment in chronic stroke survivors. J. Biomech. 2015. [Google Scholar] [CrossRef] [PubMed] [Green Version]
  4. Wu, C.W.; Seo, H.J.; Cohen, L.G. Influence of electric somatosensory stimulation on paretic-hand function in chronic stroke. Arch. Phys. Med. Rehabil. 2006, 87, 351–357. [Google Scholar] [CrossRef]
  5. Celnik, P.; Hummel, F.; Harris-Love, M.; Wolk, R.; Cohen, L.G. Somatosensory Stimulation Enhances the Effects of Training Functional Hand Tasks in Patients With Chronic Stroke. Arch. Phys. Med. Rehabil. 2007, 88, 1369–1376. [Google Scholar] [CrossRef] [PubMed]
  6. Bastos Conforto, A.; Nocelo Ferreiro, K.; Tomasi, C.; dos Santos, R.L.; Loureiro Moreira, V.; Nagahashi Marie, S.K.; Baltieri, S.C.; Scaff, M.; Cohen, L.G. Effects of Somatosensory Stimulation on Motor Function After Subacute Stroke. Neurorehabil. Neural Repair 2010, 24, 263–272. [Google Scholar] [CrossRef] [PubMed] [Green Version]
  7. Fleming, M.K.; Sorinola, I.O.; Roberts-Lewis, S.F.; Wolfe, C.D.; Wellwood, I.; Newham, D.J. The Effect of Combined Somatosensory Stimulation and Task-Specific Training on Upper Limb Function in Chronic Stroke. Neurorehabil. Neural Repair 2015, 29, 143–152. [Google Scholar] [CrossRef] [PubMed] [Green Version]
  8. Grant, V.M.; Gibson, A.; Shields, N. Somatosensory stimulation to improve hand and upper limb function after stroke—A systematic review with meta-analyses. Top. Stroke Rehabil. 2018, 25, 150–160. [Google Scholar] [CrossRef]
  9. Ghaziani, E.; Couppé, C.; Siersma, V.; Søndergaard, M.; Christensen, H.; Magnusson, S.P. Electrical Somatosensory Stimulation in Early Rehabilitation of Arm Paresis After Stroke: A Randomized Controlled Trial. Neurorehabil. Neural Repair 2018, 32, 899–912. [Google Scholar] [CrossRef]
  10. Coscia, M.; Wessel, M.J.; Chaudary, U.; Millán, J.D.R.; Micera, S.; Guggisberg, A.; Vuadens, P.; Donoghue, J.; Birbaumer, N.; Hummel, F.C. Neurotechnology-aided interventions for upper limb motor rehabilitation in severe chronic stroke. Brain 2019, 142, 2182–2197. [Google Scholar] [CrossRef] [Green Version]
  11. Lay, C.C.; Frostig, R.D. Complete protection from impending stroke following permanent middle cerebral artery occlusion in awake, behaving rats. Eur. J. Neurosci. 2014, 40, 3413–3421. [Google Scholar] [CrossRef] [PubMed]
  12. Bandla, A.; Le Teng Sherry, C.; Lim, F.; Chuan, C.K.; Liao, L.D.; Thakor, N.V. Peripheral sensory stimulation is neuroprotective in a rat photothrombotic ischemic stroke model. In Proceedings of the Annual International Conference of the IEEE Engineering in Medicine and Biology Society, EMBS; Institute of Electrical and Electronics Engineers Inc.: Piscataway, NJ, USA, 2016; Volume OCT, pp. 6086–6089. [Google Scholar] [CrossRef]
  13. Yang, M.; Yang, Z.; Yuan, T.; Feng, W.; Wang, P. A Systemic Review of Functional Near-Infrared Spectroscopy for Stroke: Current Application and Future Directions. Front. Neurol. 2019, 10, 58. [Google Scholar] [CrossRef] [PubMed]
  14. Mihara, M.; Miyai, I. Review of functional near-infrared spectroscopy in neurorehabilitation. Neurophotonics 2016, 3, 1–8. [Google Scholar] [CrossRef] [PubMed]
  15. Mihara, M.; Hattori, N.; Hatakenaka, M.; Yagura, H.; Kawano, T.; Hino, T.; Miyai, I. Near-infrared spectroscopy-mediated neurofeedback enhances efficacy of motor imagery-based training in poststroke victims: A pilot study. Stroke 2013, 44, 1091–1098. [Google Scholar] [CrossRef] [Green Version]
  16. Soekadar, S.R.; Birbaumer, N.; Slutzky, M.W.; Cohen, L.G. Brain-machine interfaces in neurorehabilitation of stroke. Neurobiol. Dis. 2015, 83, 172–179. [Google Scholar] [CrossRef] [Green Version]
  17. Villringer, A.; Planck, J.; Hock, C.; Schleinkofer, L.; Dirnagl, U. Near infrared spectroscopy (NIRS): A new tool to study hemodynamic changes during activation of brain function in human adults. Neurosci. Lett. 1993, 154, 101–104. [Google Scholar] [CrossRef]
  18. Mancini, D.M.; Bolinger, L.; Li, H.; Kendrick, K.; Chance, B.; Wilson, J.R. Validation of near-infrared spectroscopy in humans. J. Appl. Physiol. 1994, 77, 2740–2747. [Google Scholar] [CrossRef]
  19. Quaresima, V.; Ferrari, M. A Mini-Review on Functional Near-Infrared Spectroscopy (fNIRS): Where Do We Stand, and Where Should We Go? Photonics 2019, 6, 87. [Google Scholar] [CrossRef] [Green Version]
  20. Ferrari, M.; Quaresima, V. A brief review on the history of human functional near-infrared spectroscopy (fNIRS) development and fields of application. Neuroimage 2012, 63, 921–935. [Google Scholar] [CrossRef]
  21. McCormick, P.W.; Stewart, M.; Lewis, G.; Dujovny, M.; Ausman, J.I. Intracerebral penetration of infrared light: Technical note. J. Neurosurg. 1992, 76, 315–318. [Google Scholar] [CrossRef]
  22. Gratton, G.; Maier, J.S.; Fabiani, M.; Mantulin, W.W.; Gratton, E. Feasibility of intracranial near-infrared optical scanning. Psychophysiology 1994, 31, 211–215. [Google Scholar] [CrossRef] [PubMed] [Green Version]
  23. Del Bianco, S.; Martelli, F.; Zaccanti, G. Penetration depth of light re-emitted by a diffusive medium: Theoretical and experimental investigation. Phys. Med. Biol. 2002, 47, 4131–4144. [Google Scholar] [CrossRef] [PubMed]
  24. Liu, N.; Cui, X.; Bryant, D.M.; Glover, G.H.; Reiss, A.L. Inferring deep-brain activity from cortical activity using functional near-infrared spectroscopy. Biomed. Opt. Express 2015, 6, 1074–1089. [Google Scholar] [CrossRef] [PubMed] [Green Version]
  25. Wang, Y.; Sibaii, F.; Custead, R.; Oh, H.; Barlow, S.M. Functional Connectivity Evoked by Orofacial Tactile Perception of Velocity. Front. Neurosci. 2020, 14, 182. [Google Scholar] [CrossRef] [PubMed] [Green Version]
  26. Oh, H.; Custead, R.; Wang, Y.; Barlow, S. Neural encoding of saltatory pneumotactile velocity in human glabrous hand. PLoS ONE 2017, 12, e0183532. [Google Scholar] [CrossRef] [PubMed] [Green Version]
  27. Custead, R.; Oh, H.; Rosner, A.O.; Barlow, S. Adaptation of the cortical somatosensory evoked potential following pulsed pneumatic stimulation of the lower face in adults. Brain Res. 2015. [Google Scholar] [CrossRef]
  28. Venkatesan, L.; Barlow, S.; Popescu, M.; Popescu, A.; Auer, E.T. TAC-cell inputs to human hand and lip induce short-term adaptation of the primary somatosensory cortex. Brain Res. 2010, 1348, 63–70. [Google Scholar] [CrossRef] [Green Version]
  29. Hozan, M.; Greenwood, J.; Sullivan, M.; Barlow, S. Cerebral Hemodynamic Response Encodes the Velocity of Patterned Tactile Stimuli: An fNIRS Study. In Proceedings of the Society for Neuroscience 2019, Session 485—Touch: Transduction and Stimulus Encoding, Chicago, IL, USA, 19–23 October 2019; p. 485.19/L5. [Google Scholar]
  30. Hozan, M.; Greenwood, J.; Sullivan, M.; Barlow, S.M. An fNIRS study of sensorimotor cortical hemodynamics in hand motor tasks coupled with pneumotactile stimulation at different traverse velocities. In Proceedings of the Society for Neuroscience 2018, Session 671—Voluntary Movements: Finger and Grasp Control: Normal Human Behavior, San Diego, CA, USA, 3–7 November 2018; p. 671.10/LL3. [Google Scholar]
  31. Greenwood, J.; Hozan, M.; Sullivan, M.; Barlow, S.M. Cortical fNIRS hemodynamics during saltatory pneumotactile glabrous hand stimulation in neurotypical adults. In Proceedings of the Society for Neuroscience 2018, Session 392–Somatosensation: Thalamic and Cortical Processing, San Diego, CA, USA, 3–7 November 2018; p. 392.13/BB4. [Google Scholar]
  32. Tak, S.; Ye, J.C. Statistical analysis of fNIRS data: A comprehensive review. Neuroimage 2014, 85, 72–91. [Google Scholar] [CrossRef]
  33. Kamran, M.A.; Mannan, M.M.N.; Jeong, M.Y. Cortical Signal Analysis and Advances in Functional Near-Infrared Spectroscopy Signal: A Review. Front. Hum. Neurosci. 2016, 10, 261. [Google Scholar] [CrossRef] [Green Version]
  34. Song, H.; Bogdan, I.I.M.; Wang, S.; Dong, W.; Quan, W.; Dang, W.; Yu, X. Automatic schizophrenia discrimination on fNIRS by using PCA and SVM. In Proceedings of the 2016 IEEE International Conference on Bioinformatics and Biomedicine, BIBM 2016; Institute of Electrical and Electronics Engineers Inc.: Piscataway, NJ, USA, 2017; pp. 389–394. [Google Scholar] [CrossRef]
  35. Ho, T.K.K.; Gwak, J.; Park, C.M.; Song, J.I. Discrimination of Mental Workload Levels from Multi-Channel fNIRS Using Deep Leaning-Based Approaches. IEEE Access 2019, 7, 24392–24403. [Google Scholar] [CrossRef]
  36. Fernandez Rojas, R.; Huang, X.; Ou, K.L. A Machine Learning Approach for the Identification of a Biomarker of Human Pain using fNIRS. Sci. Rep. 2019, 9, 5645. [Google Scholar] [CrossRef] [PubMed]
  37. Friedman, J.H. Regularized Discriminant Analysis. J. Am. Stat. Assoc. 1988, 84, 165–175. [Google Scholar] [CrossRef]
  38. Blankertz, B.; Tomioka, R.; Lemm, S.; Kawanabe, M.; Müller, K.R. Optimizing spatial filters for robust EEG single-trial analysis. IEEE Signal Process. Mag. 2008, 25, 41–56. [Google Scholar] [CrossRef]
  39. NIRScout fNIRS Neuroimaging | NIRx. Available online: https://nirx.net/nirscout (accessed on 15 November 2019).
  40. Galileo Tactile Stimulator System—Brainbox. Available online: https://brainbox-neuro.com/catalogue/neuro-sensory/tactile-stimulation/galileo-tactile-stimulus-system/ (accessed on 15 November 2019).
  41. Santosa, H.; Zhai, X.; Fishburn, F.; Huppert, T. The NIRS Brain AnalyzIR Toolbox. Algorithms 2018, 11, 73. [Google Scholar] [CrossRef] [Green Version]
  42. Fernandez Rojas, R.; Huang, X.; Hernandez-Juarez, J.; Ou, K.L. Physiological fluctuations show frequency-specific networks in fNIRS signals during resting state. In Proceedings of the Annual International Conference of the IEEE Engineering in Medicine and Biology Society, EMBS; Institute of Electrical and Electronics Engineers Inc.: Piscataway, NJ, USA, 2017; pp. 2550–2553. [Google Scholar] [CrossRef]
  43. Wang, Y.; Gao, S.; Gao, X. Common spatial pattern method for channel selection in motor imagery based brain-computer interface. In Proceedings of the Annual International Conference of the IEEE Engineering in Medicine and Biology—Proceedings, Shanghai, China, 31 August–3 September 2005; Volume 7, pp. 5392–5395. [Google Scholar] [CrossRef]
  44. Zhang, S.; Zheng, Y.; Wang, D.; Wang, L.; Ma, J.; Zhang, J.; Xu, W.; Li, D.; Zhang, D. Application of a common spatial pattern-based algorithm for an fNIRS-based motor imagery brain-computer interface. Neurosci. Lett. 2017, 655, 35–40. [Google Scholar] [CrossRef]
  45. Kabir, M.F.; Islam, S.M.R.; Rahman, M.A. Accuracy Improvement of fNIRS based Motor Imagery Movement Classification by Standardized Common Spatial Pattern. In Proceedings of the 2018 4th International Conference on Electrical Engineering and Information & Communication Technology (iCEEiCT), Dhaka, Bangladesh, 13–15 September 2018; pp. 395–400. [Google Scholar] [CrossRef]
  46. Trakoolwilaiwan, T.; Lee, J.; Choi, J. Convolutional neural network for high-accuracy functional near- infrared spectroscopy in a brain–computer interface: Three-class classification of rest, right-, and left- hand motor execution. Neurophotonics 2017, 5, 011008. [Google Scholar] [CrossRef]
  47. Hong, K.S.; Naseer, N.; Kim, Y.H. Classification of prefrontal and motor cortex signals for three-class fNIRS-BCI. Neurosci. Lett. 2015, 587, 87–92. [Google Scholar] [CrossRef]
  48. Hage, B.; Way, E.; Barlow, S.M.; Bashford, G.R. Real-Time Cerebral Hemodynamic Response to Tactile Somatosensory Stimulation. J. Neuroimaging 2018, 28, 615–620. [Google Scholar] [CrossRef]
  49. Franceschini, M.A.; Fantini, S.; Thompson, J.H.; Culver, J.P.; Boas, D.A. Hemodynamic evoked response of the sensorimotor cortex measured noninvasively with near-infrared optical imaging. Psychophysiology 2003, 40, 548–560. [Google Scholar] [CrossRef] [Green Version]
  50. Dai, T.H.; Liu, J.Z.; Saghal, V.; Brown, R.W.; Yue, G.H. Relationship between muscle output and functional MRI-measured brain activation. Exp. Brain Res. 2001, 140, 290–300. [Google Scholar] [CrossRef]
  51. Nambu, I.; Osu, R.; Sato, M.A.; Ando, S.; Kawato, M.; Naito, E. Single-trial reconstruction of finger-pinch forces from human motor-cortical activation measured by near-infrared spectroscopy (NIRS). Neuroimage 2009, 47, 628–637. [Google Scholar] [CrossRef] [PubMed]
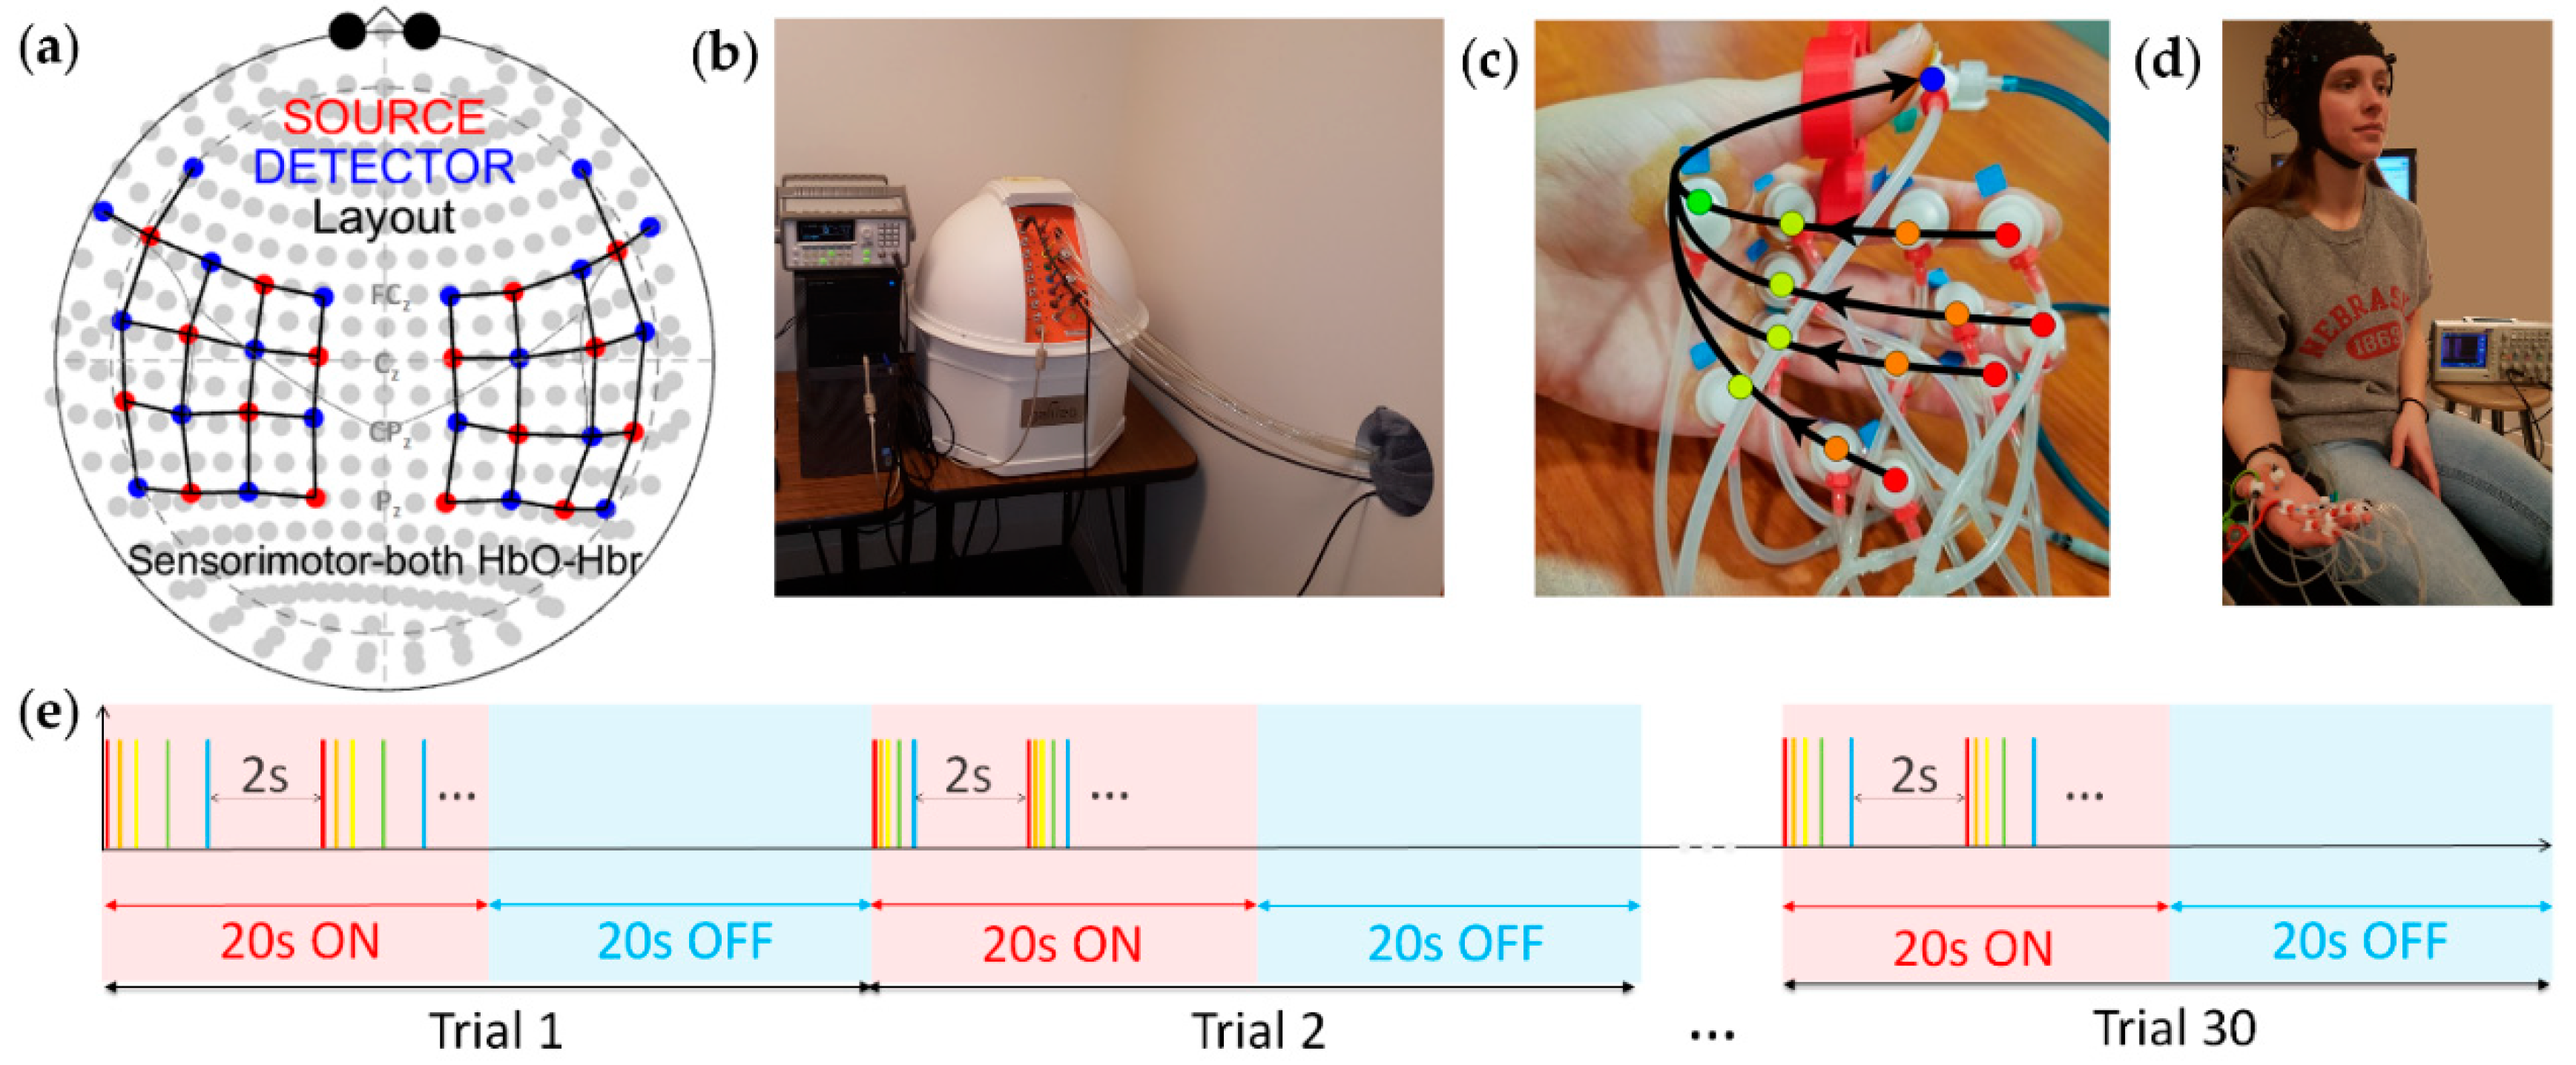
Figure 1. Experiment Design: (a) fNIRS optode layout. Blue dots are light sources, red dots are detectors and grey dots are five-percent distance increments in the standard 10–20 system. Each line is a link (channel). (b) Galileo™ pneumotactile stimulus control system housed in a sound-isolated room adjacent to the fNIRS recording suite to minimize its acoustic noise. (c) Color-coded TAC-cells and the arrows show the order and direction of the saltation wave at each node. Each wave starts at D2–D5 fingertips (red nodes) and terminates at the thumb (blue node). The time interval between two consecutive nodes depends on the velocity and hand measurements. (d) Participant configured with the fNIRS cap while receiving the somatosensory stimulus. (e) Stimulus pulse train color-coded to match channel assignment. Each node delivers a 60 ms pulse. Each stimulus pulse train consists of five 60 ms pulses at varying intervals based on the velocity and hand measurements. Each trial lasts 40 s, consisting of 20 s of stimulus in the form of repeated pneumatic pulse trains with 2 s interburst intervals, followed by 20 s of no stimulation. There are 10 trials per velocity, resulting in 30 trials per task. Each trial is immediately followed by another in a random-balanced velocity design.
Applsci 10 03381 g001
Figure 2. Stim-on vs. Stim-off discriminatory contribution of each link across 11 participants when both HbO and HbR are fed to the RDA classifier. Channels with AUC > 0.6 where chosen for feature extraction (a) Passive (somatosensory only) task. (b) Active (motor+somatosensory) task.
Applsci 10 03381 g002
Figure 3. Average classification performance in bi- and tri-classifiers in the passive (green) and active (yellow) tasks, across 11 participants. (a) three bi-classifiers performing almost perfectly (accuracy > 99%). (b) three tri-classifiers and their average result.
Applsci 10 03381 g003
Figure 4. Average classification performance of tri-classifiers in the passive (green) and active (yellow) tasks for individual participants.
Applsci 10 03381 g004
Figure 5. Average classification performance of tri-classifiers in distinguishing the three velocities of 10 cm/s (Green), 25 cm/s (Yellow), and 45 cm/s (Red) in Active (left panel) and Passive (right panel) tasks.
Applsci 10 03381 g005
Figure 6. Confusion matrices of the tri-classifiers for the Active (left panel) and Passive (right panel) experiments.
Applsci 10 03381 g006
Table 1. Percentage of channels per subject remaining in the feature space by meeting the AUC > 0.6 threshold.
AK118AM113AR127BH119EB112EC130EP129KB132KR134NG135NP105
Passive 63.5%26.9%50.0%80.8%71.2%23.1%38.5%55.8%21.2%44.2%40.4%
Active 59.6%86.5%73.1%73.1%86.5%94.2%63.5%73.1%67.3%88.5%82.7%