1. Introduction
Numerous projections and scenarios confront population with the need to mitigate and adapt to climate change in the near future. According to the latest report from the Intergovernmental Panel on Climate Change (IPCC)’s Fifth Assessment Report (AR5), the influence of man on the climate system is clear and indisputable. In the last few decades, greenhouse gas emissions were much higher, which contributed to the increase in air temperatures. The IPCC stated that the last three decades were the warmest when compared to all previous ones since 1850 [
1]. According to these projections, an increase in surface temperatures is expected during the 21st century. In 2013, IPCC projected that Earth’s temperature at the end of the 21st century will increase by 1.5 °C to 5 °C, compared to the period 1850–1900, in all climatic scenarios. Furthermore, in the presented projections, it is expected that heat waves will become more frequent and with a longer duration [
1].
Urban climate results from the modifications caused by the characteristics urban areas. Cities are characterized by a well-arranged urban mosaic of warmer and cooler areas [
2,
3]. When urban areas are warmer than the surrounding areas, the urban heat island (UHI) phenomenon occurs. These are usually densely built places where urban characteristics promote urban heating. This phenomenon is the main climatic change caused by man in an urban environment, and it is a direct consequence of the modifications of the energy and radiative balance of the urban space [
4]. This is one of the most evident thermal patterns of the urban climate, occurring practically all over the world [
5], and it is one of the most studied phenomena in urban climatology [
6].
The magnitude or intensity of the UHI is quantified by the difference between the temperature recorded in the warmest location in the city at any given time and the lowest temperature of all rural locations that surround the city [
5,
7]. The intensity of this phenomenon varies from city to city and depends on the density of construction, the abundance of vegetation, the emission of heat and pollutants by human activities, and the characteristics of the building covering materials [
4].
The density of construction affects the magnitude of these phenomena; denser construction and higher buildings result in a more intense heat island [
4]. On the contrary, more vegetation contributes to the reduction of UHI and urban heating. The great emission of heat and pollutants due to industrial activities also warms the urban atmosphere. The types of buildings and materials determine the amount of energy that is absorbed and emitted into the atmosphere, enhancing this phenomenon. In fact, the growing use of different types of materials in cities, with high heating capacity and low albedo, when associated with non-vegetated areas, enhances the UHI effect [
8].
Being a major phenomenon and a global topic of interest for all affected cities, there are already numerous studies that suggested mitigation measures for this phenomenon. From a literature review, it is possible to see that several different types of measures can be used, for example, by increasing the city’s albedo, achieved by changing the materials used in urban areas since materials with low emissivity are mainly responsible for the increase of surface temperatures during the night [
9], by increasing evapotranspiration, through the increase of vegetated areas within the city, by promoting ventilation within the urban canyons, and by creating a shadow effect, with trees, for example, to promote shortwave radiation blocking.
Reducing the surface temperatures of materials and planting trees in urban areas contributes directly and effectively to reducing the negative effects of UHI. The use of reflective or higher-albedo materials is an inexpensive way to improve air temperatures and to mitigate UHI [
9]. The use of cold roofs, together with the increase in the number of green spaces, is a passive cooling method that can be implemented in existing urban areas or that may be built [
10]. Green spaces can minimize the impacts of urban growth, for example, by reducing the energy consumption of buildings [
11]. In densely built urban areas, it is difficult to build large green areas and, therefore, replacing “typical” roofs with green roofs or cold roofs may be a good solution for UHI mitigation [
12]. Roofs can provide an excellent space to apply these two mitigation techniques. Reflective (or cool) roofs have lighter colors and high albedo, increasing reflection and contributing to a decrease in surface temperatures. Also green roofs have several advantages, such as longer durability of materials (which are protected by vegetation), reduction of energy consumption for cooling (in summer period), improved air quality, and noise reduction, thereby contributing to the mitigation of the UHI [
13].
In addition to the materials and the types of urban surfaces, urban geometric forms also play a key role in the formation of UHI. Urban morphology determines the variation of air and surface temperatures and the urban structure of a city can be considered the main cause for the formation of UHI [
14]. Urban geometry is determinant in the development of heat islands since they regulate the absorption and the emission of heat, modifying the temperature of the air in the urban boundary layer, as well as the surface temperatures.
Dense urban forms are usually responsible for multiple reflections of solar radiation, influencing air convection out of urban canyons and heat losses due to a low sky view factor (SVF). High buildings and narrow streets reduce SVF by increasing the amount of shaded area on the surface, keeping the bottom of the urban canyon cooler during the day but warmer at night [
15].
In 2005, Alcoforado et al. proposed some mitigation measures for the UHI and urban heating of Lisbon [
4]. The authors mentioned the need to maintain a high SVF, to create more green spaces within urban areas to select appropriate building materials. In addition to these wide-ranging guidelines, and with a view not only to mitigate this phenomenon but also to tackle progressive urban warming, they pointed to the need to maintain the main ventilation paths of the city and to implement “cold” or greens roofs in the city.
In 2010, Alcoforado et al. carried out a study at the microscale, highlighting three factors that reduce urban heating, guarantee ventilation conditions, and increase summer thermal comfort [
16]: urban geometry, green spaces, and building coating materials used within the city. Regarding the choice of what type of materials should be used in urban areas, three characteristics should be considered: albedo, thermal conductivity, and heat capacity [
16]. This selection should be made carefully, ensuring the reduction of heat storage. However, the possible harmful effects that the choice of materials may have, such as chaining phenomena of passers-by or increasing radiative input on the human body, thereby increasing the thermal stress, also need to be considered.
The present work intends to be a contribution to the decision-making and implementation of mitigation measures for the UHI adapted to the urban context of Lisbon, not only looking at the city as a flat surface but also considering the third dimension of urban areas. The main objectives of this work are (1) to calculate the radiative balance of a groups of facades in Telheiras, located in the northern part of Lisbon, (2) to obtain thermal images of the facades, using thermal infrared thermography, (3) to understand how the temperatures of the facades and other surfaces affect air temperatures of the urban canyon, and (4) to comprehend how radiative balance values recorded on facades and different surfaces influence air temperature.
2. Materials and Methods
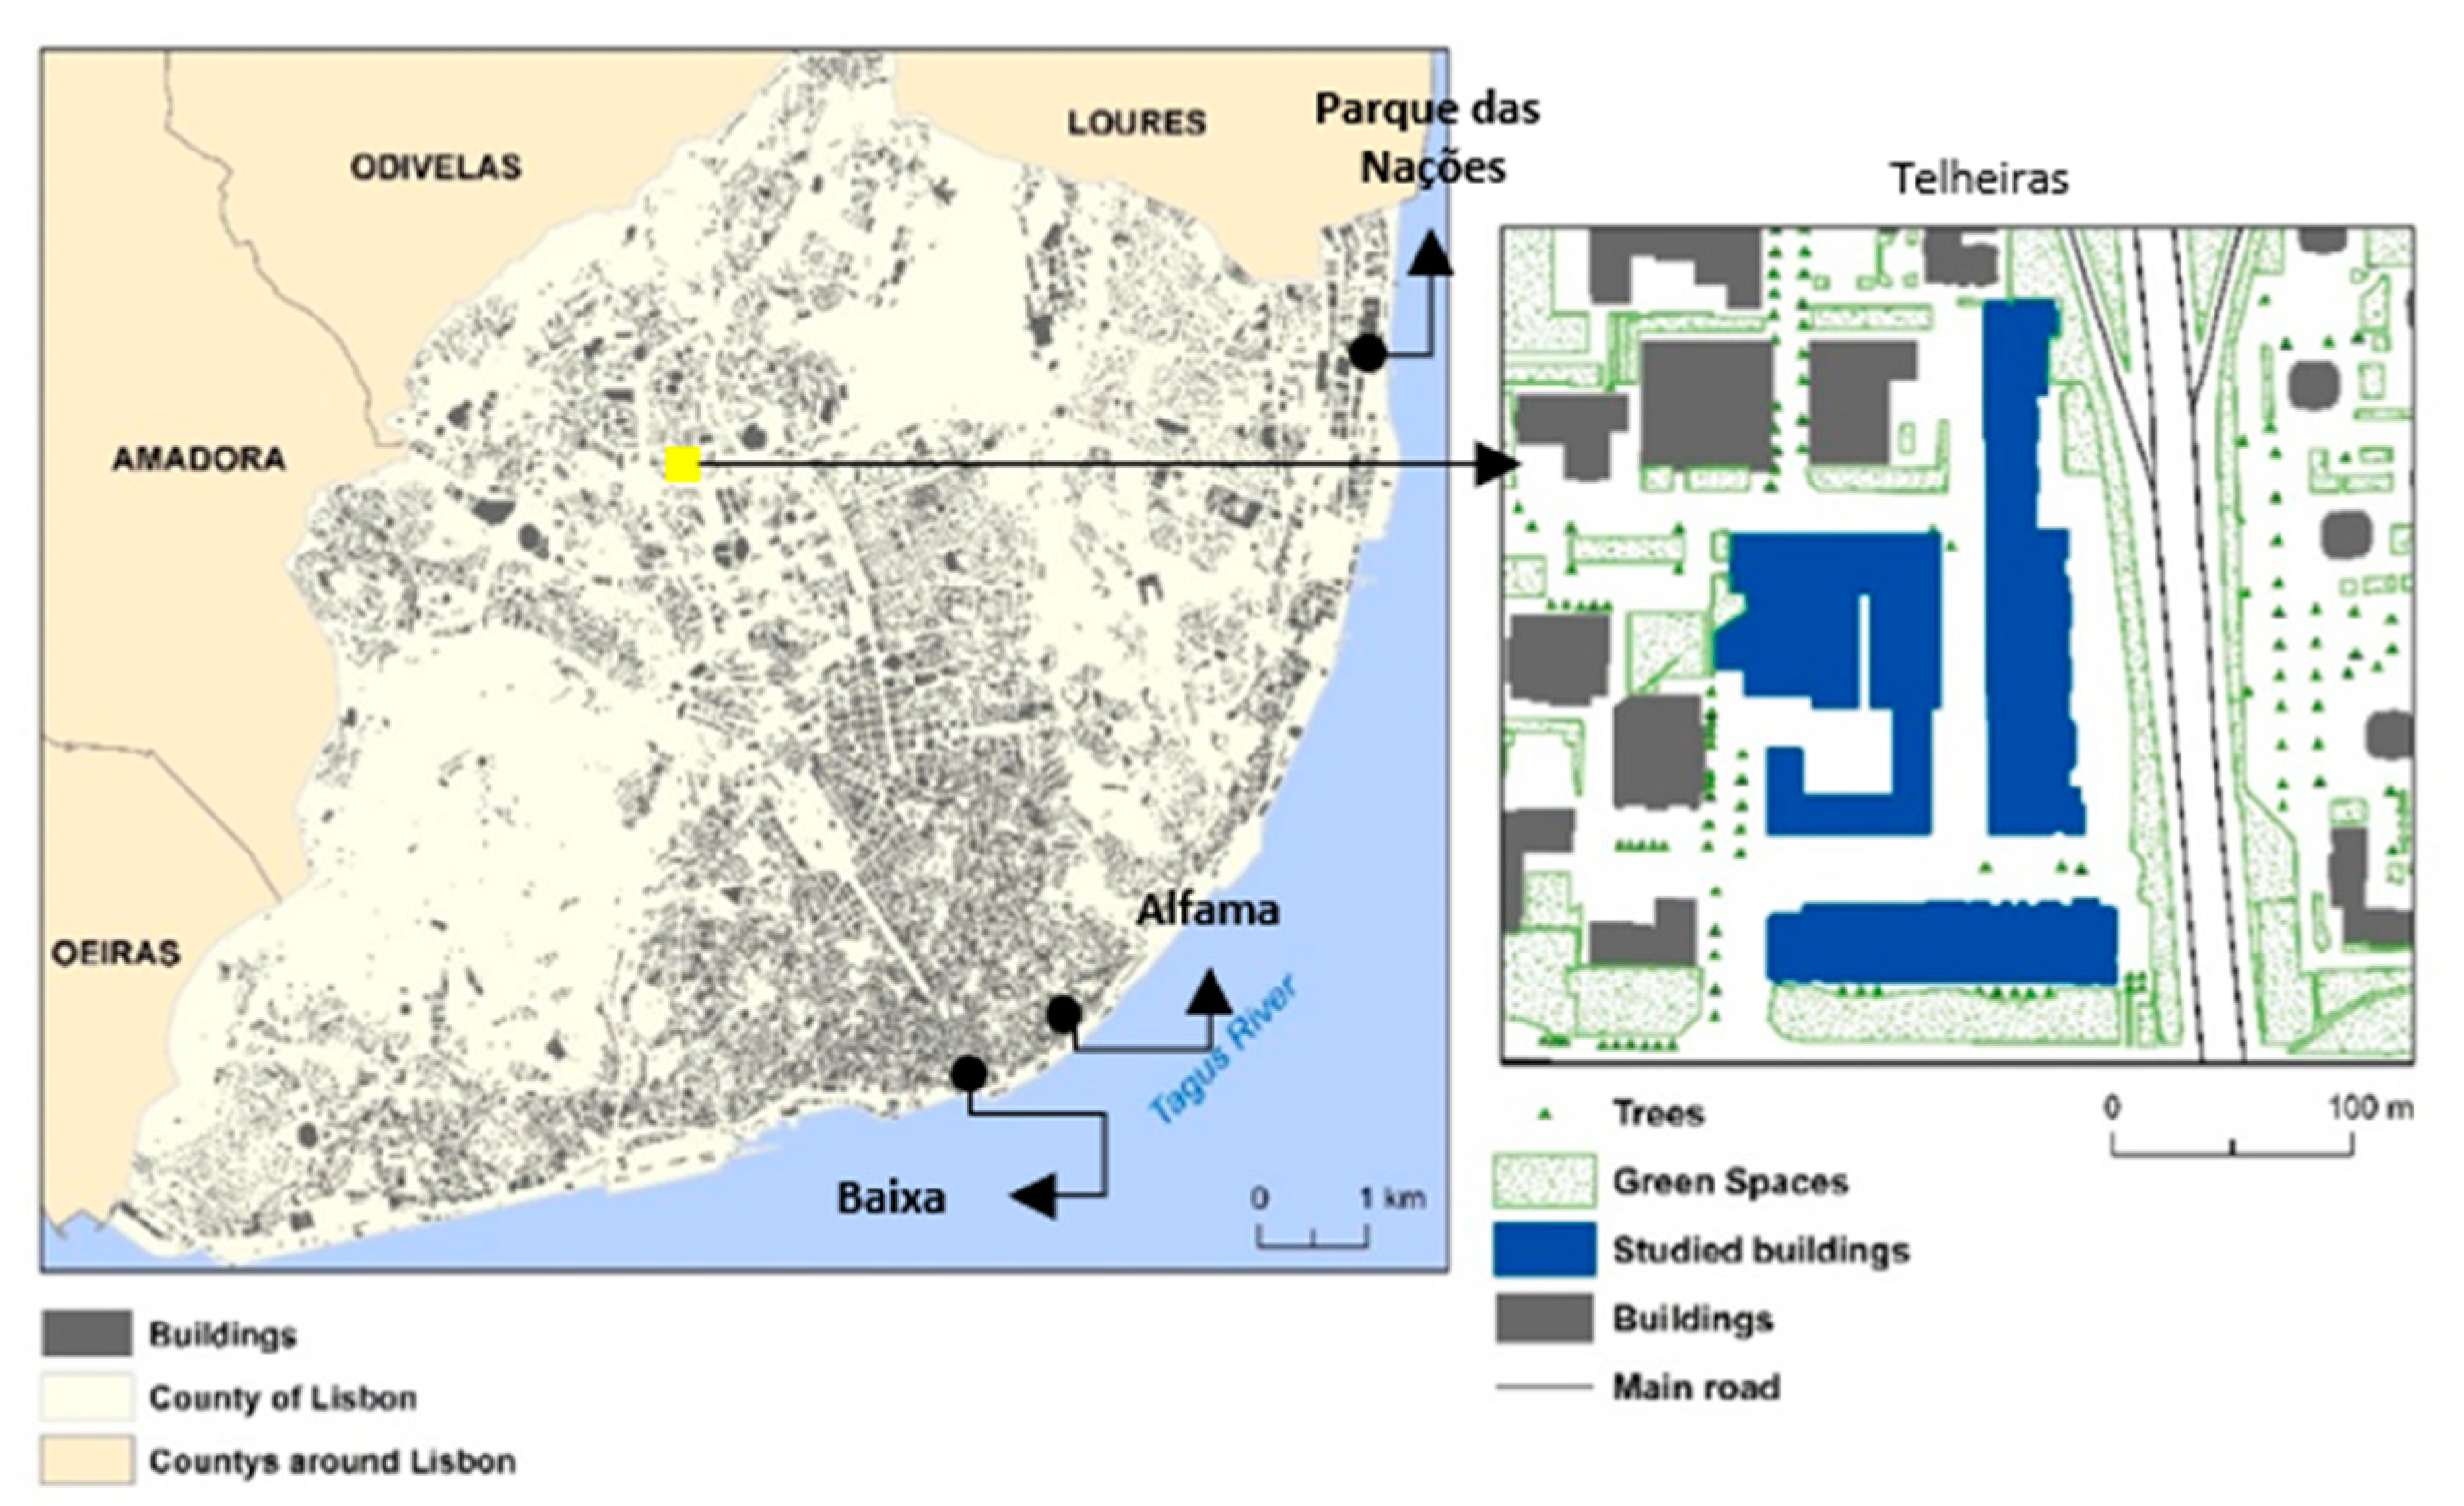
Lisbon is located in the western part of mainland Portugal, at a latitude of approximately 38°42′ north (N) and a longitude of 9°10′ west (W); it has hot and dry summers characterized by the concentration of most of the precipitation between October and April, reaching peak levels between November and February. Regarding air temperature, the annual values are about 16°C, with the minimum values between December and February and the highest values between July and September [
2,
3]. Lisbon’s climate depends essentially on regional geographic factors, such as latitude and proximity to the Atlantic Ocean, where the latter gives the city a distinctive thermal amenity and a wind regime marked by a high frequency of winds from the north and northwest [
4]. In the mesoclimatic and local scales, the climate of Lisbon is conditioned by the uneven topography and by the proximity to Tagus river [
2].
Lisbon presents a heterogeneous urban morphology, which resulted from various periods of urban growth. In the southern part of the city, there remains, until today, an older central nucleus, corresponding to the oldest part of the city. Here, the occupation by buildings is more densified, expanding from Alfama to Baixa [
17,
18]. At the end of the 20th century, new urbanization appeared in the most peripheral areas of Lisbon such as Telheiras neighborhood, the urbanization of Alto do Lumiar, and, to the east, Parque das Nações.
For this study, a group of buildings was chosen in the northern part of the city. Based on the following criteria, one street in Telheiras was selected (
Figure 1): since one of the objectives was to obtain thermal images, the study area was chosen to be wide and unobstructed; moreover, the chosen area represented a typical urban canyon that can be found today in the northern part of Lisbon.
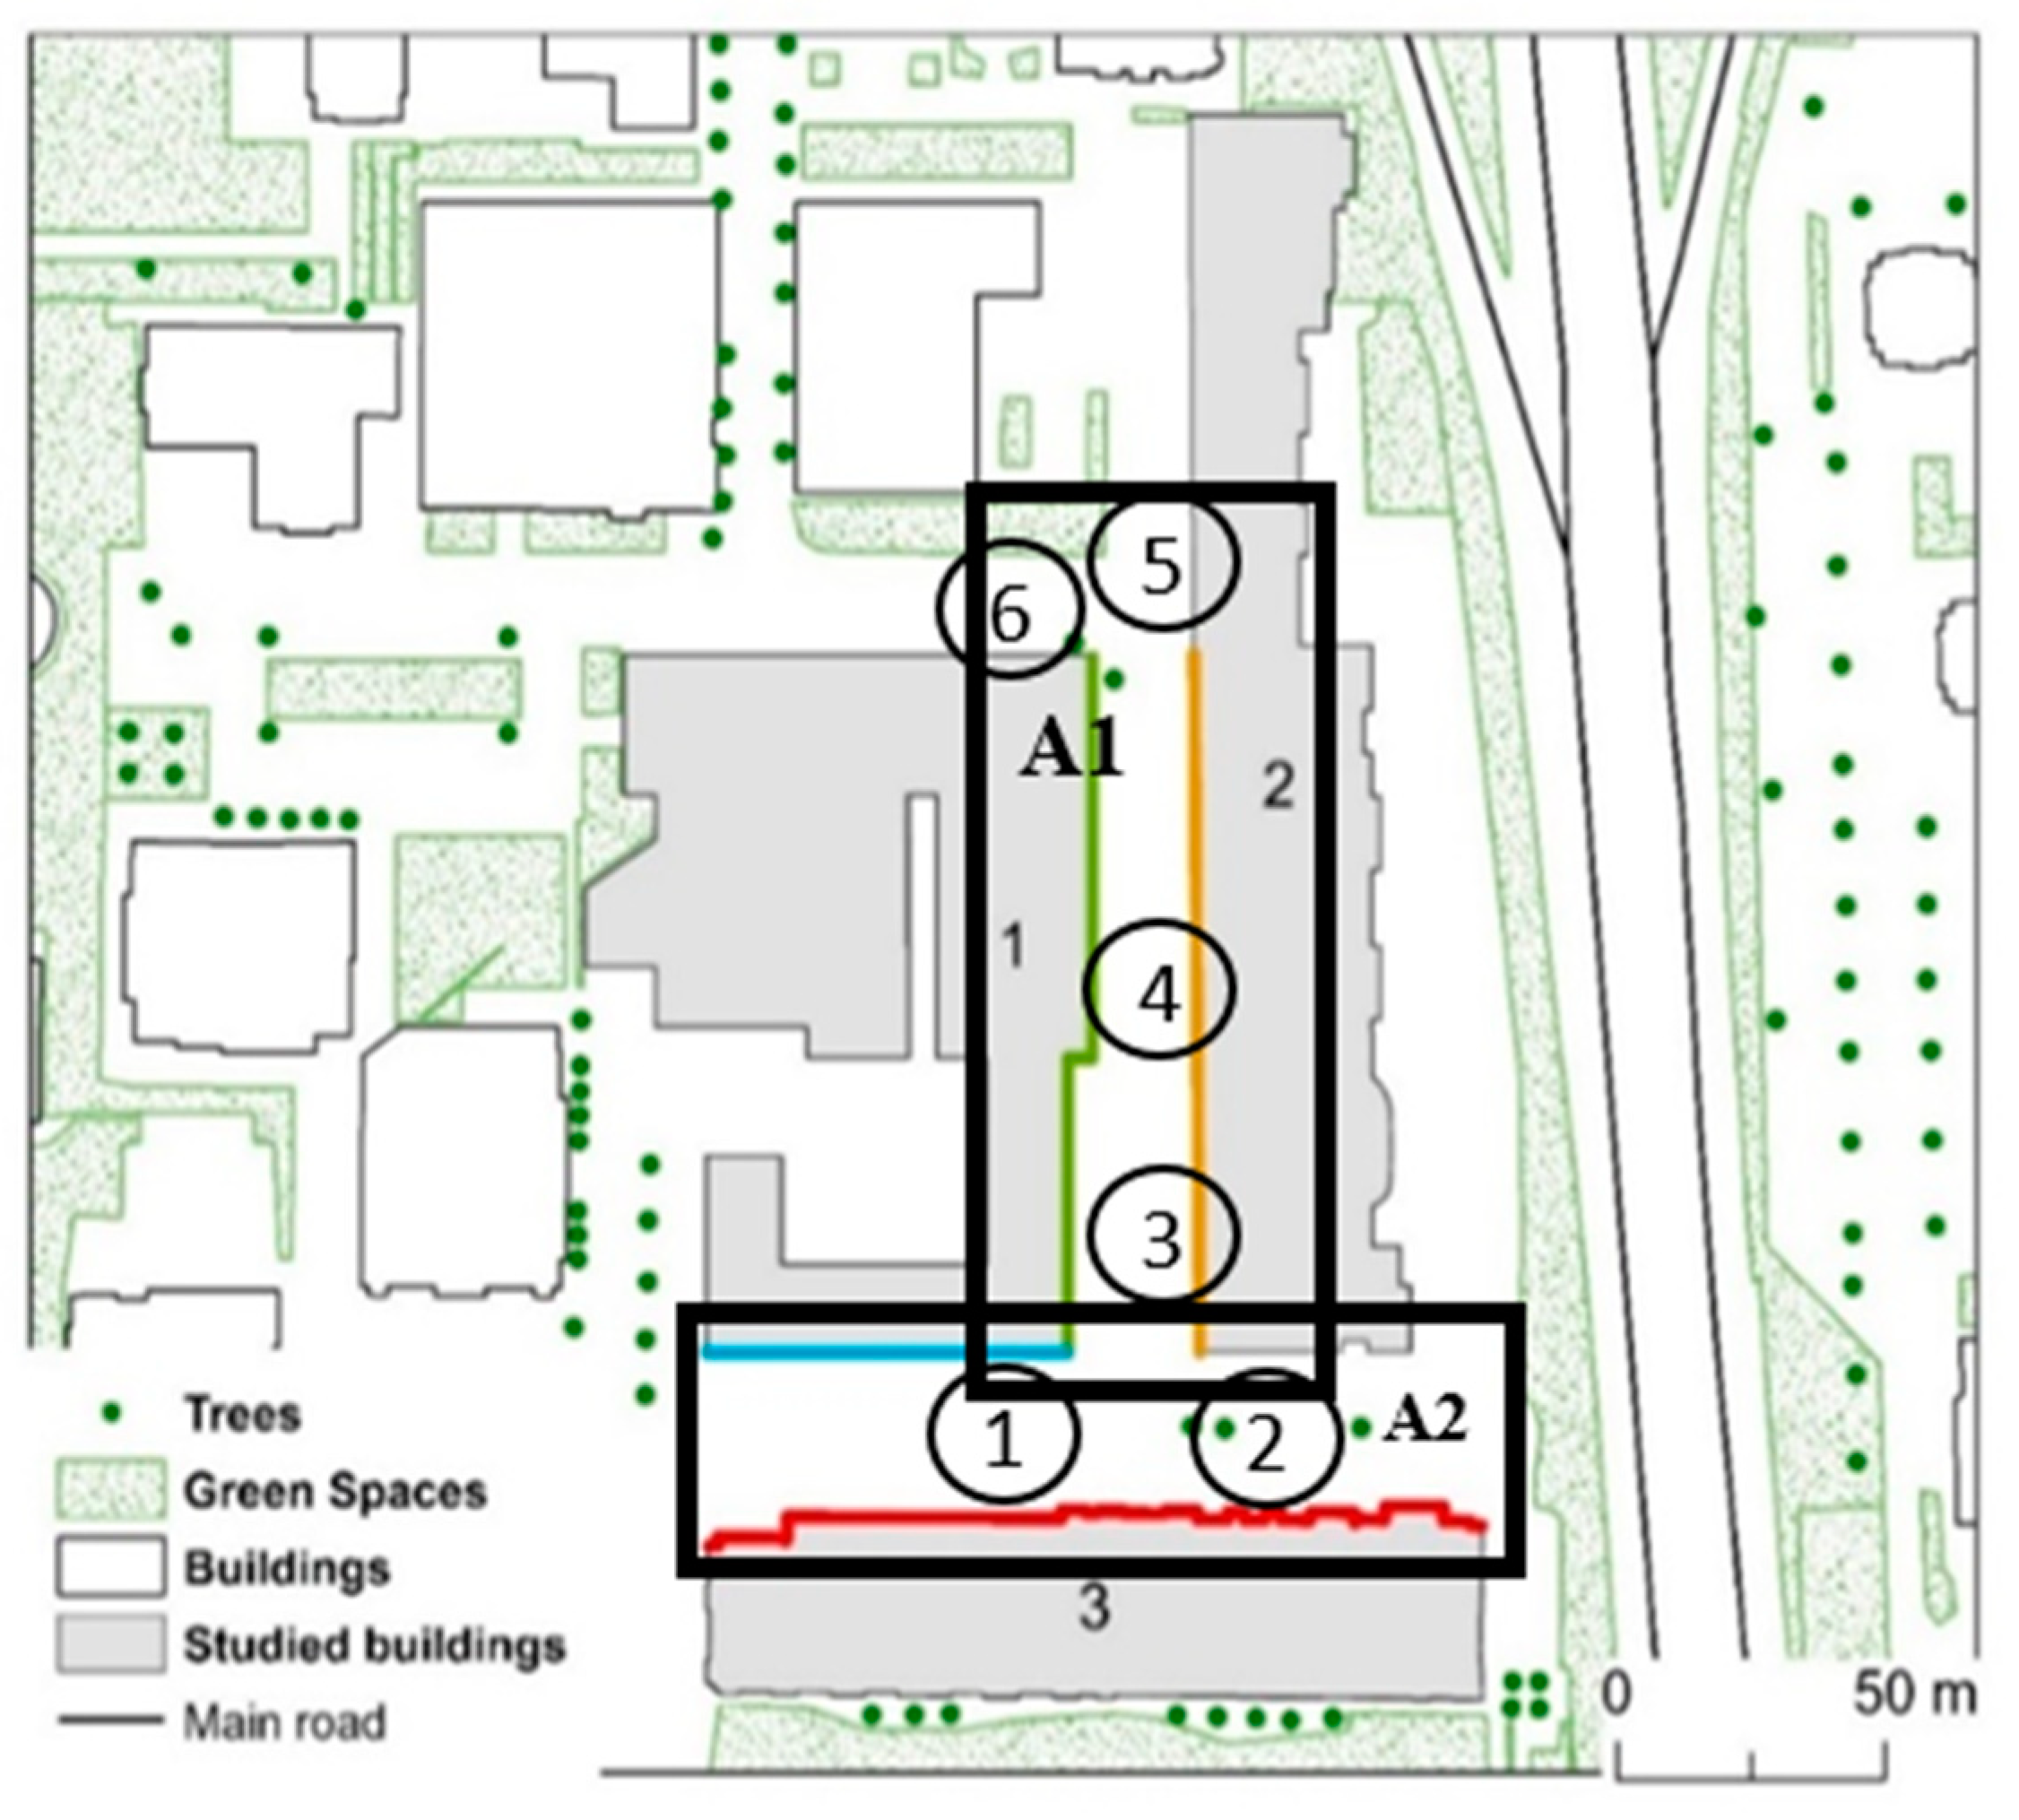
Two main areas can be differentiated in the study area (
Figure 2). Area 1 has a length of 245 m and is about 34 m wide, with north–south orientation. Area 2 has a slightly shorter length, 152 m, and is about 17 m wide, with an east–west orientation.
The buildings under study have some differences between them. In group 1 (A1) buildings have heights between 24 and 33 m. In this group, the radiative balance was calculated and thermal images of the east and south facades were collected (
Figure 2). In group 2 (A2), the facade of the buildings are exposed to the west and present heights between 24 and 33 m. The heights of group 2 buildings, whose facade are faced north, varied between 27 and 33 m.
A brief characterization of the facades of the different groups of buildings, ranging from white to pink and gray, is presented in
Table 1. This table presents the percentage that each color occupies in the facades of the different groups of buildings, as well as the percentage of the facade occupied by windows.
To monitor the air temperature in the selected urban canyon, a micrometeorological network was installed, consisting of six Hobos Pro V2, in both areas of the canyon (
Figure 2).
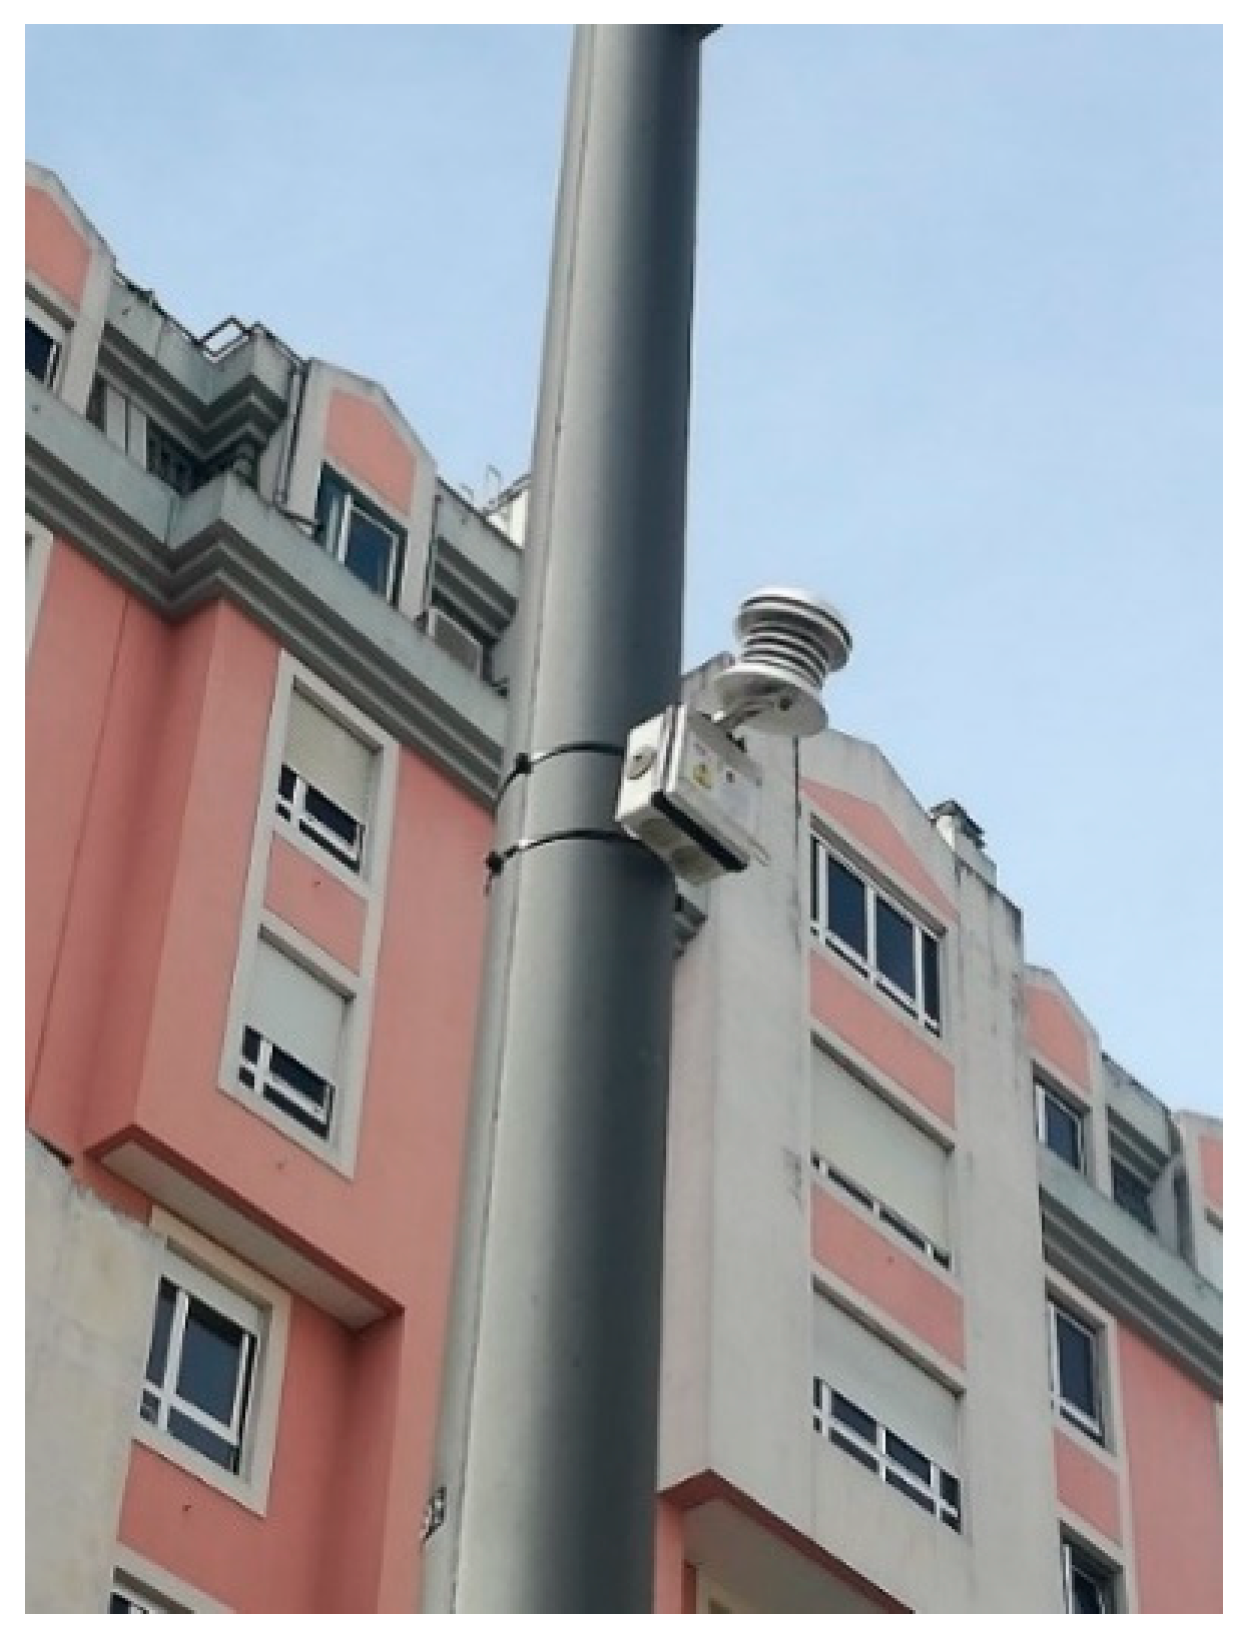
The installation of the devices was carried out with the help of the Department of Public Lighting of the Lisbon City Hall, on 20 April 2018. All the instruments were positioned in available lamps in the study area as shown in
Figure 3, about 3 m from the ground and north-oriented.
The monitoring of air temperature in Area 1 (orientation east/west) was done with Hobos 1 and 2, and the monitoring of Area 2 (orientation north/south) was done with Hobos 3, 4, 5, and 6. The data were recorded by each sensor every 30 min, between 20 April 2018 and 27 July 2018. On 28 July, the devices were removed from the study area.
Since the period in which the instruments gathered data was exceptionally rainy and with numerous days with considerable cloudiness, only the days when the cloud cover was less than 4/8 were considered.
Cloud cover data were collected from Iowa Environmental Mesonet. MODIS (Moderate Resolution Imaging Spectroradiometer) satellite imagery was used to fill the existing flaws in the data. Through these images, if at 12:00 p.m., more than 4/8 of the sky was covered with clouds, that day was excluded.
For the analysis of air temperature data, hourly averages were calculated on each day, to understand the behavior of this variable in the study area. The collected data allowed comparing the registered air temperature in two streets with opposite exposures to the prevailing wind direction in Lisbon (north and northwest).
Using an infrared thermal camera (FLIR B425) the surface temperatures of the facades and different materials were collected.
Table 2 summarizes the input parameters of the thermal camera on all the days that fieldwork was carried out. Thermal images were collected in 2018 at different times: in the winter, on February 21, in the spring, on June 18, and in the summer, on July 7. In the summer period, images were collected at four different times of the day: 09:00 a.m., 1:00 p.m., 3:00 p.m., and 7:00 p.m. Regarding the afternoon period we chose two different times to collect images, to register the temperature variation from when the air temperature is higher and when the incident solar radiation is lower.
Since different urban surfaces present different emissivity values, we chose to collect all images with a constant value of 0.98.
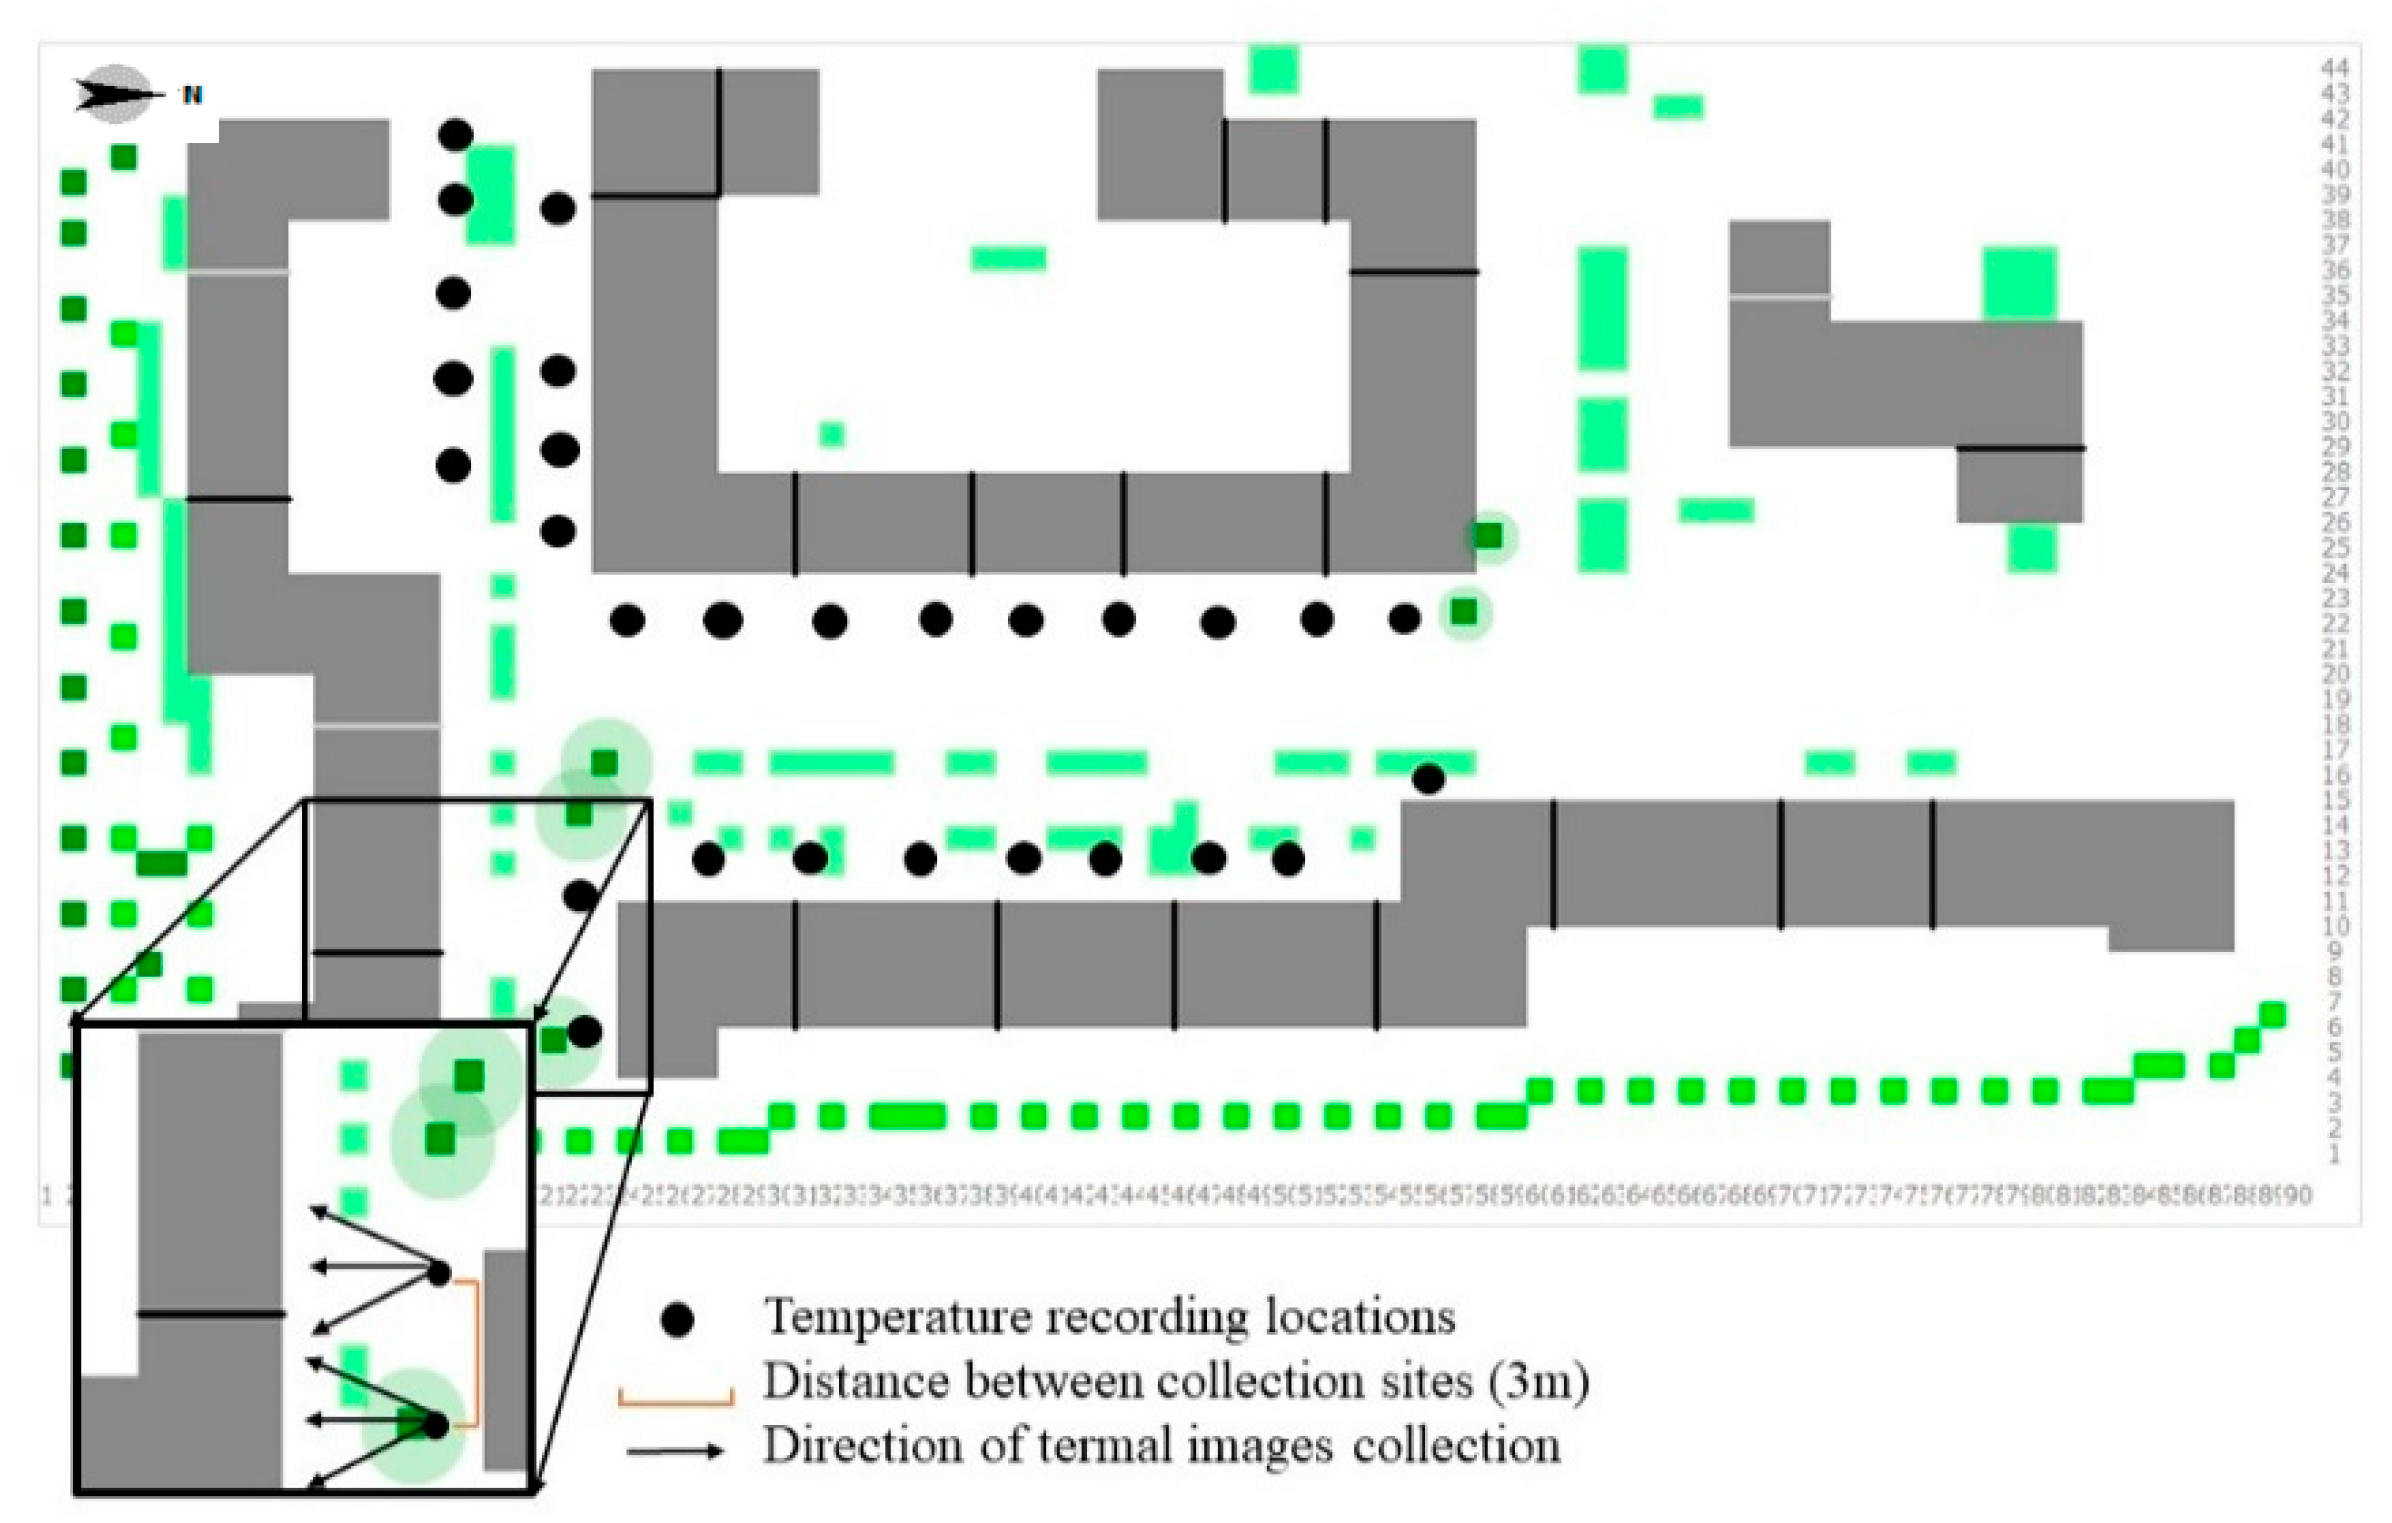
Given the characteristics of the studied streets, the distance between the camera and the facades was ±25 m to collect the thermal images of the facades with exposure to east and west. In the case of north and south facades, the distance was ±17 m. To guarantee the stability of the thermal infrared camera, a tripod was used (around 1.67 m high). The ground floor was not included, since it was covered by windows and glazed doors, and because there were always parked cars in front of them (heat sources that can influence the obtained measurements).
To collect the thermal images, the scheme shown in
Figure 4 was followed. In addition to the facades, thermograms were collected from different surfaces in the study area: asphalt, tile floor, and sidewalk.
All collected thermograms (summer period) were analyzed using FLIR Tools software [
19]. It was decided not to consider the values registered in windows, since, being translucent surfaces, they present different emissivity values when compared to the materials used in the facades. In addition, the temperature of these surfaces can be influenced by the interior of the apartments. The decision to not consider these surfaces also depended on the existence of different types of conditions where there were windows with interior or exterior blinds. Finally, we also did not consider the values obtained in “strange” objects that could be framed in the thermal images, such as lamps, plants on the balconies of each apartment, and people who were sometimes outside.
In order to be able to compare different thermograms, as well as to perceive in which colors and types of surfaces the highest and lowest temperatures were recorded, two scales were used: one for the thermal images of the facades and one for the horizontal surfaces.
For the estimation of the radiation balance, KIPP & ZONEN pyranometer and pyrgeometer were used (
Figure 5). Several materials representative of different vertical surfaces (including different orientations and colors) and horizontal surfaces (asphalt, tiles, and bricks) were sampled. These measurements were done in the summertime, on the 7th July, at different times of the day.
Figure 6 represents the points where the radiation balance was calculated. Locals 1–3 were used to calculate the radiation balance at the center of the urban canyon at 1:40 p.m. (
Table 3).
Locals 4–7 represent the places where the radiation balance of each facade was calculated. The times of these measurements are summarized in
Table 3.
For the east facade, in addition to the hourly measurements, the radiation balance was calculated at 10:30 a.m., the hour at which the angle of elevation of the sun was 47°. For the west facade, the radiation balance was calculated at 5 p.m., when the angle of elevation of the sun was 45°. For the north and south facades, the radiation balance was assessed at 1:40 p.m., when the angle of elevation of the sun was at its maximum.
Points 8, 9, and 10 were selected to make hourly measurements, from 9 a.m. to 7 p.m., at west and east facades and in the center of the urban canyon. Locals 11–13 represent the measurements in different types of materials used on horizontal surfaces (asphalt, tile, and Portuguese light sidewalk).
3. Results
3.1. Air Temperature Monitoring
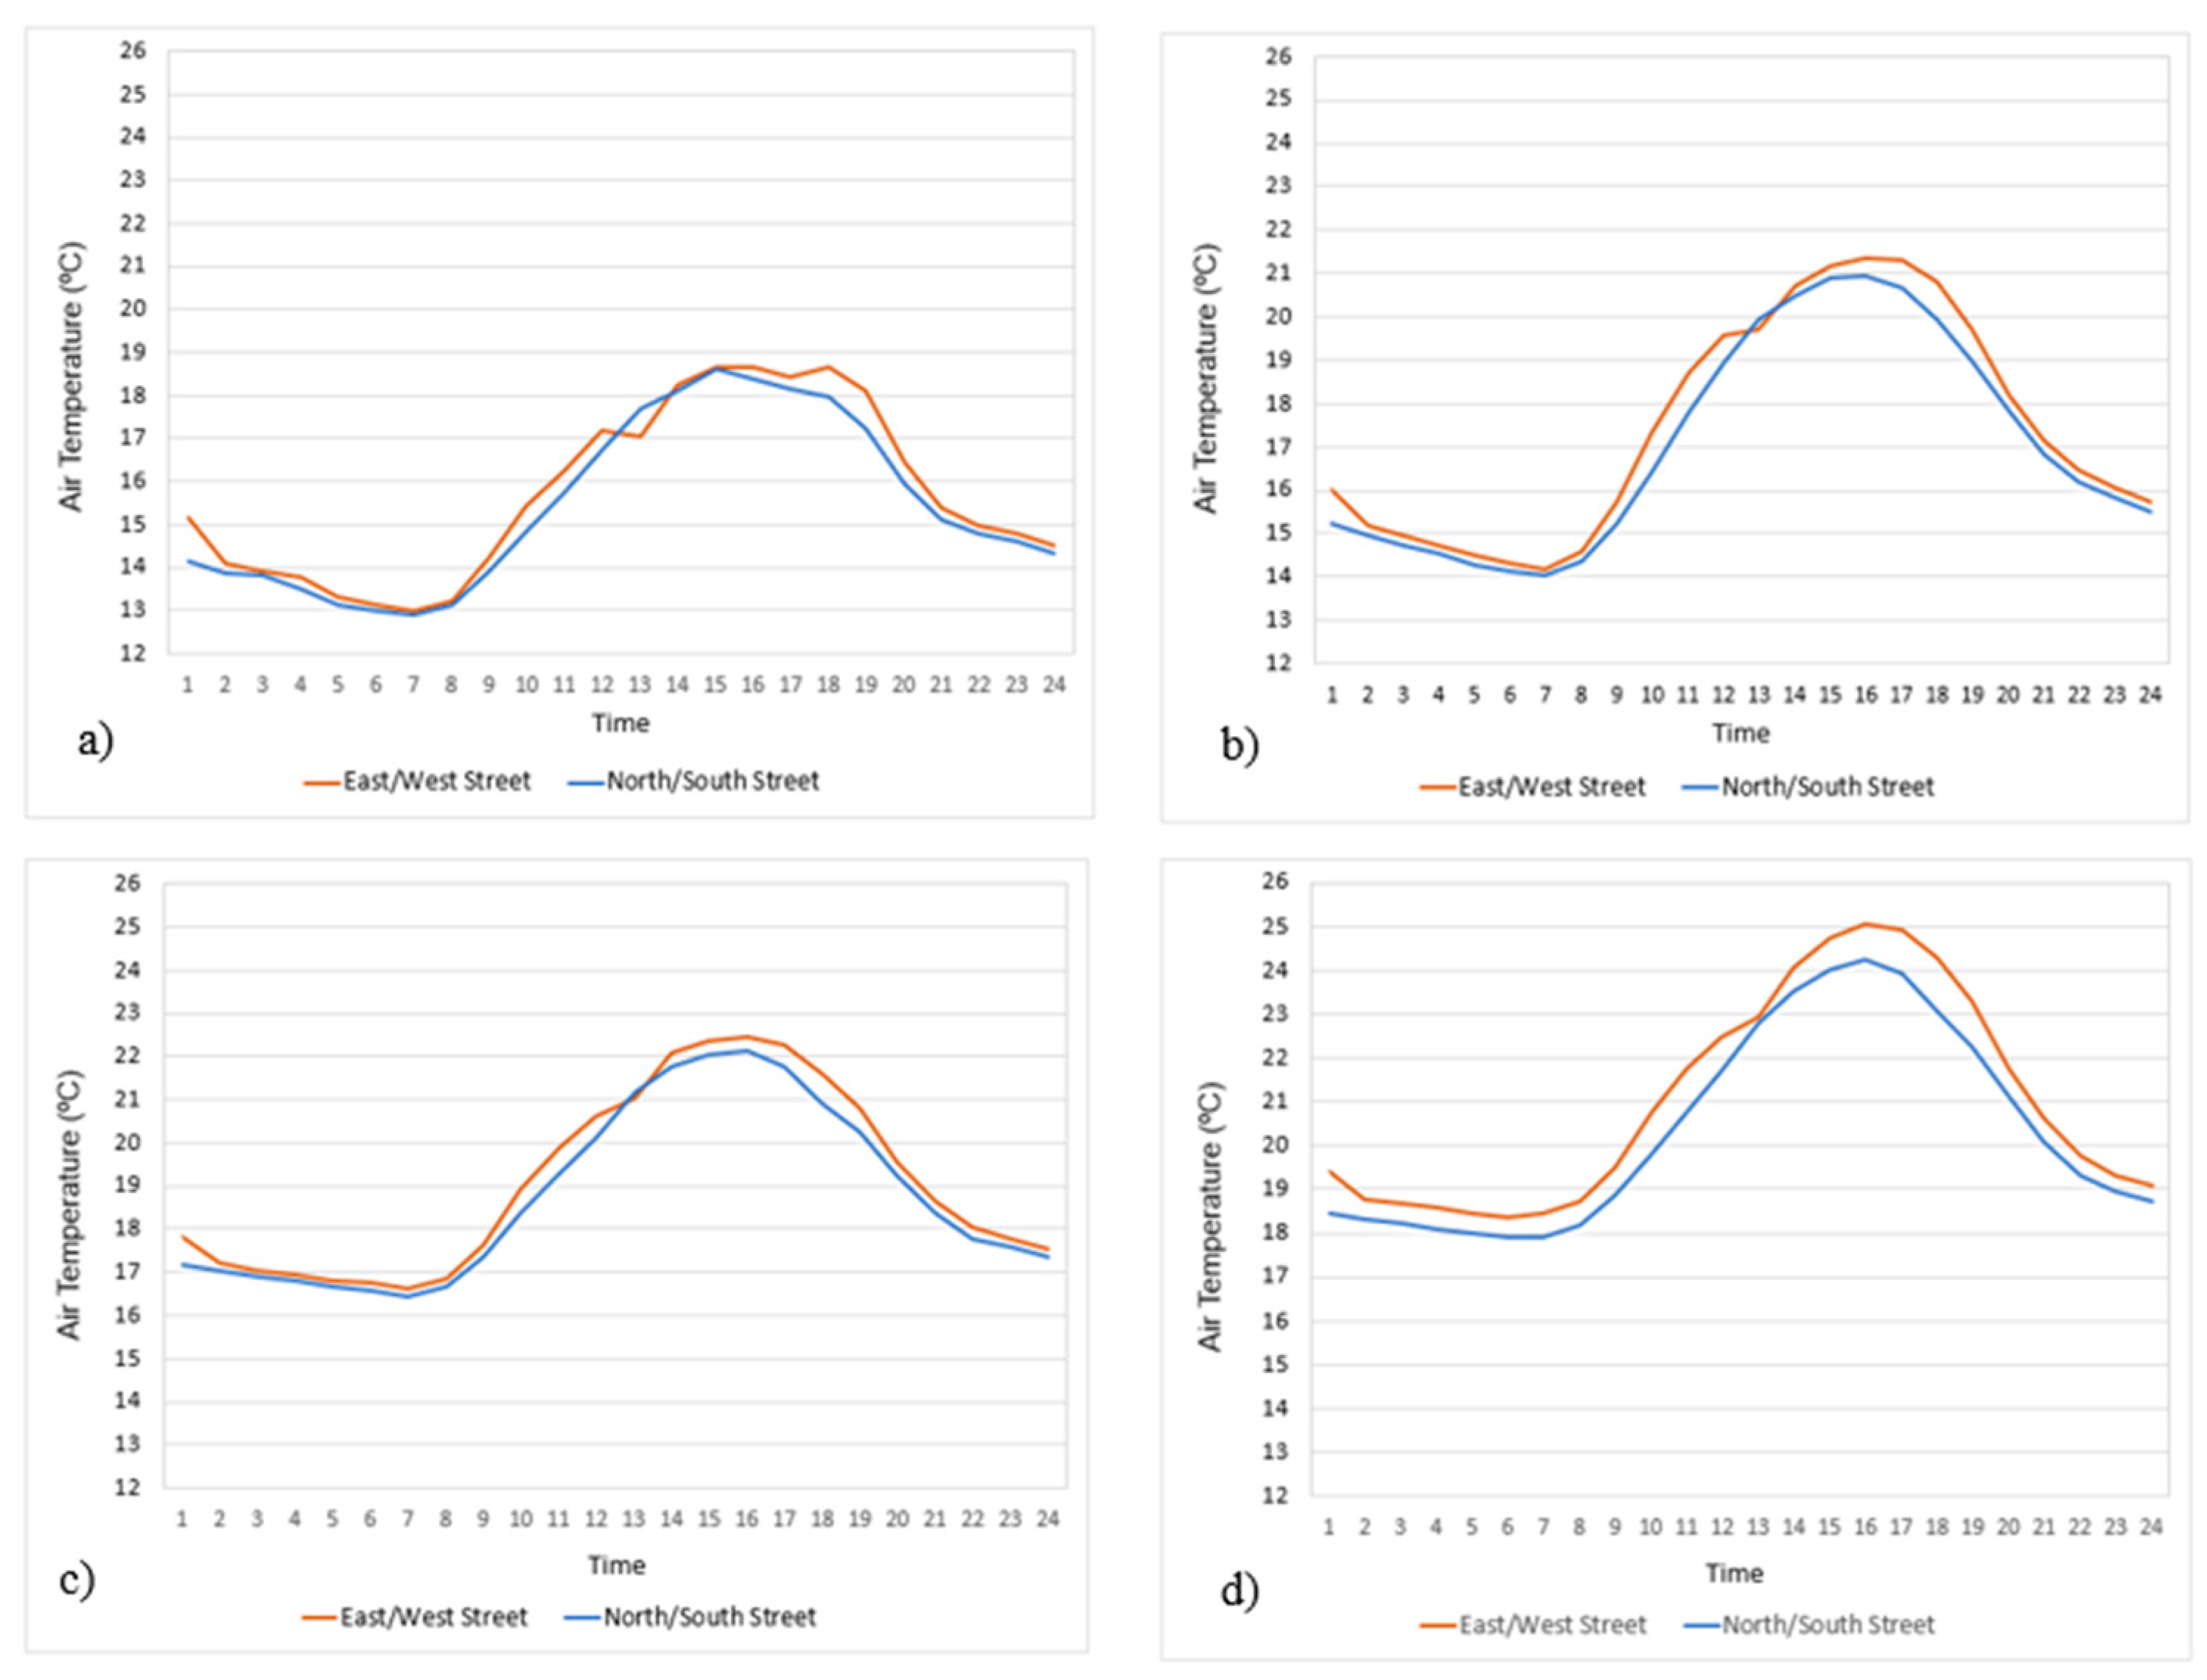
The use of the micrometeorological network for air temperature monitoring allowed us to understand the thermal patterns inside the urban canyon. Hobos 1 and 2 recorded air temperatures in the east/west orientation and although both devices were placed near to each other, the values registered in Hobo 1 represent better the behavior of temperatures in areas that are not exposed to the dominant wind direction in Lisbon (north/south). The highest air temperatures were registered along the south facade (the values were registered by Hobo 1), and Hobo 2, although was located in the east/west orientation, presented air temperatures similar to those observed with the Hobos placed along the north/south-orientated area, most probably due to the influence of ventilation from the predominant north wind direction.
Hobos 3, 4, 5, and 6, which were placed along the north/south oriented urban canyon, showed similar values during the four months (April to June 2018). However, Hobo 5, which was located in the northern, always recorded the highest temperatures. This can be explained by the fact that, of the three instruments placed in this orientation, Hobo 5 was closer to the west facade than the other two, which were in the center of the urban canyon and more exposed to heat and radiation fluxes from the facades.
Figure 7 shows the hourly air temperatures of the of the instruments installed on the street with east/west and north/south orientation. The highest hourly temperatures were always registered in the instruments placed in the area with east/west orientation when compared with those installed in the area with north/south exposure. The highest differences were recorded in all the studied period, between 9:00 a.m. and 7:00 p.m. when the urban canyon received direct solar radiation.
3.2. Thermal Images of an Urban Canyon
During all fieldwork days, facades and surface temperatures of the urban canyon were recorded using a FLIR thermal camera. The analysis of surface temperatures was done considering the predominant surface exposure.
During summertime, the fieldwork was carried out on the 7th July 2018, and the temperature of the facades was registered at 9 a.m., 1 p.m., 3 p.m. and 7 p.m.
The analysis of the recorded temperatures in the south and north facades of the buildings showed that, between 9 a.m. and 3 a.m., the southern facade always presented temperatures higher than those registered in the north facade. The only exception occurred at 7 p.m. when the northern facade registered a maximum temperature slightly higher than that recorded on the south facade.
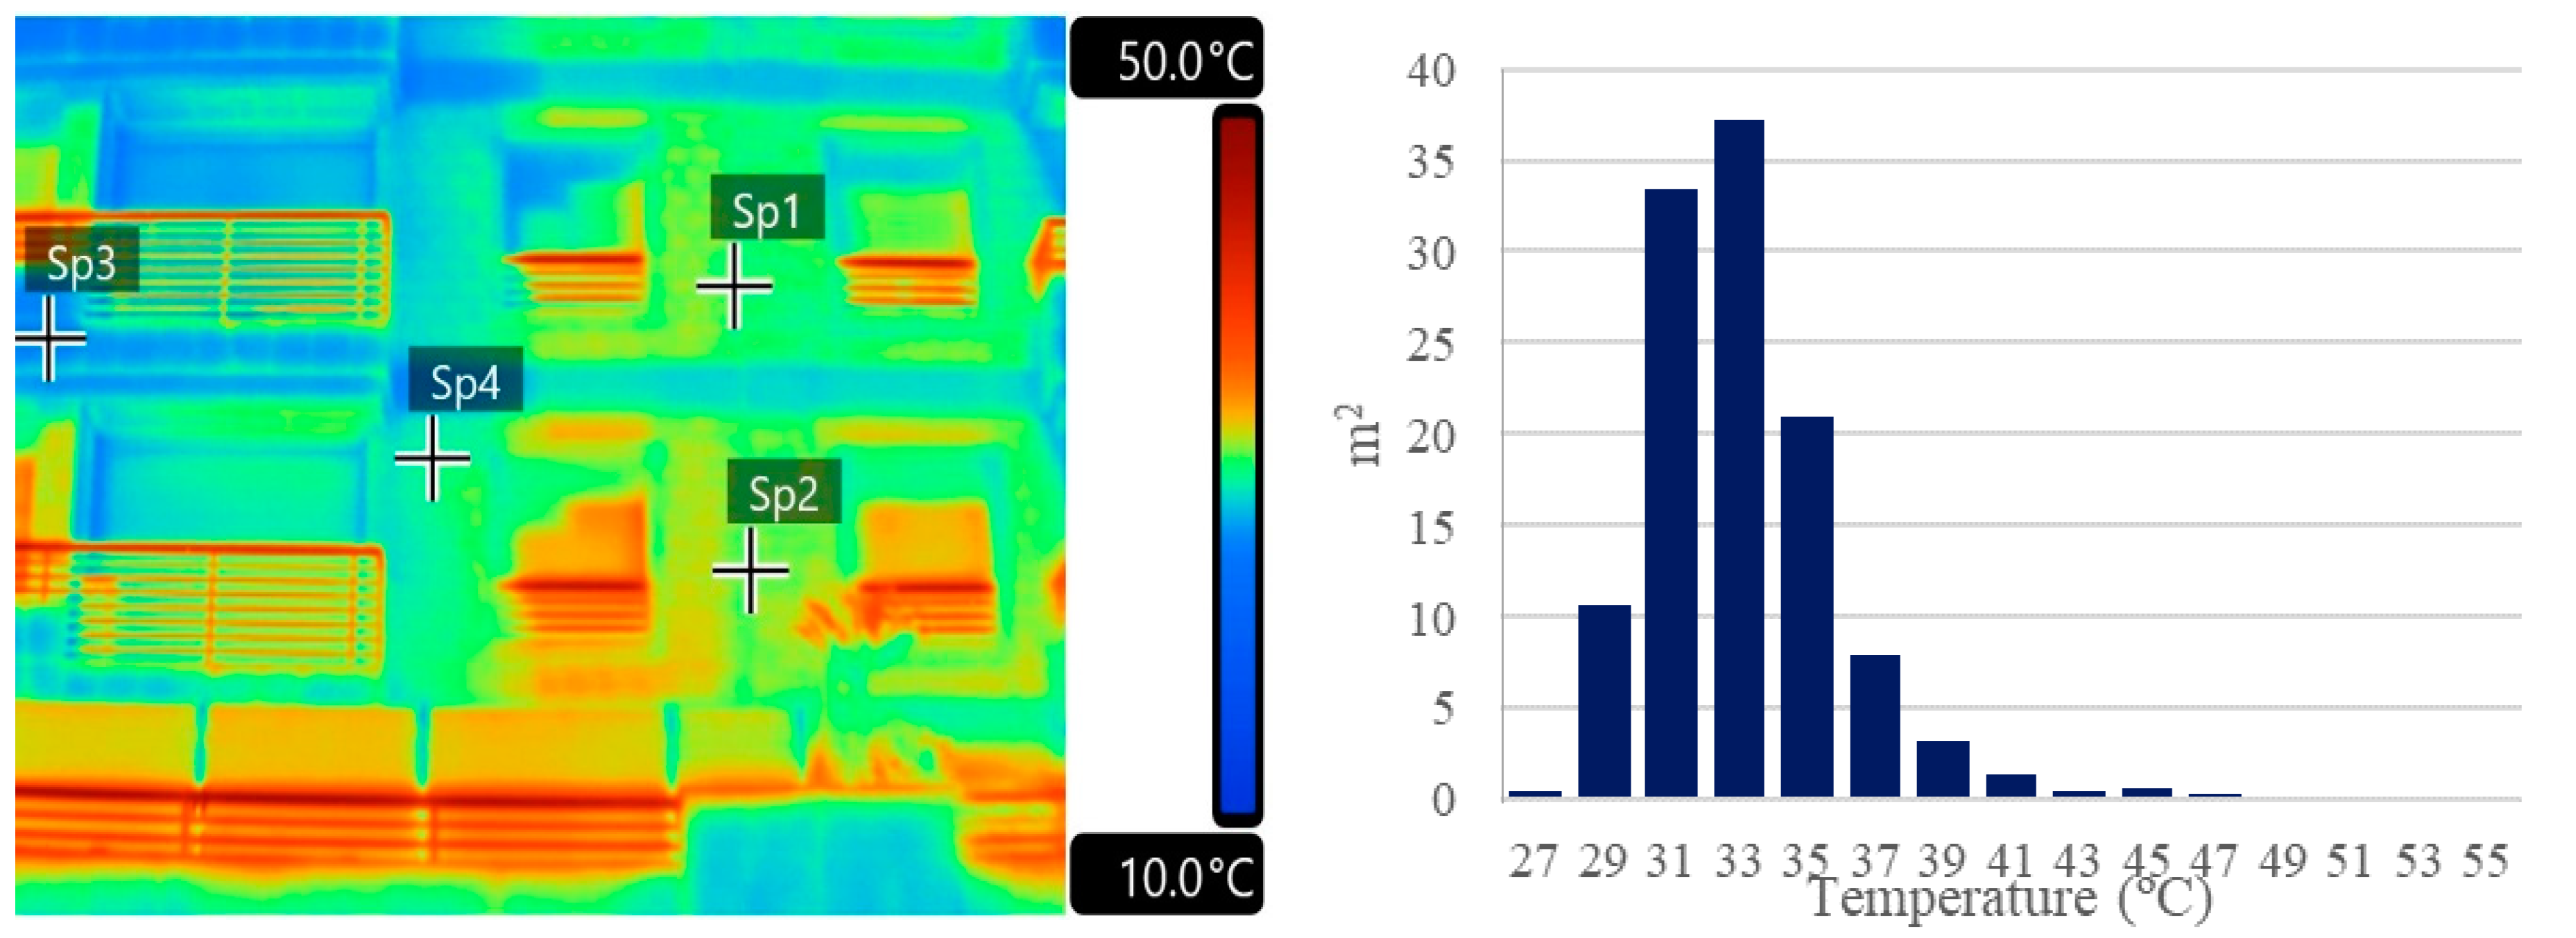
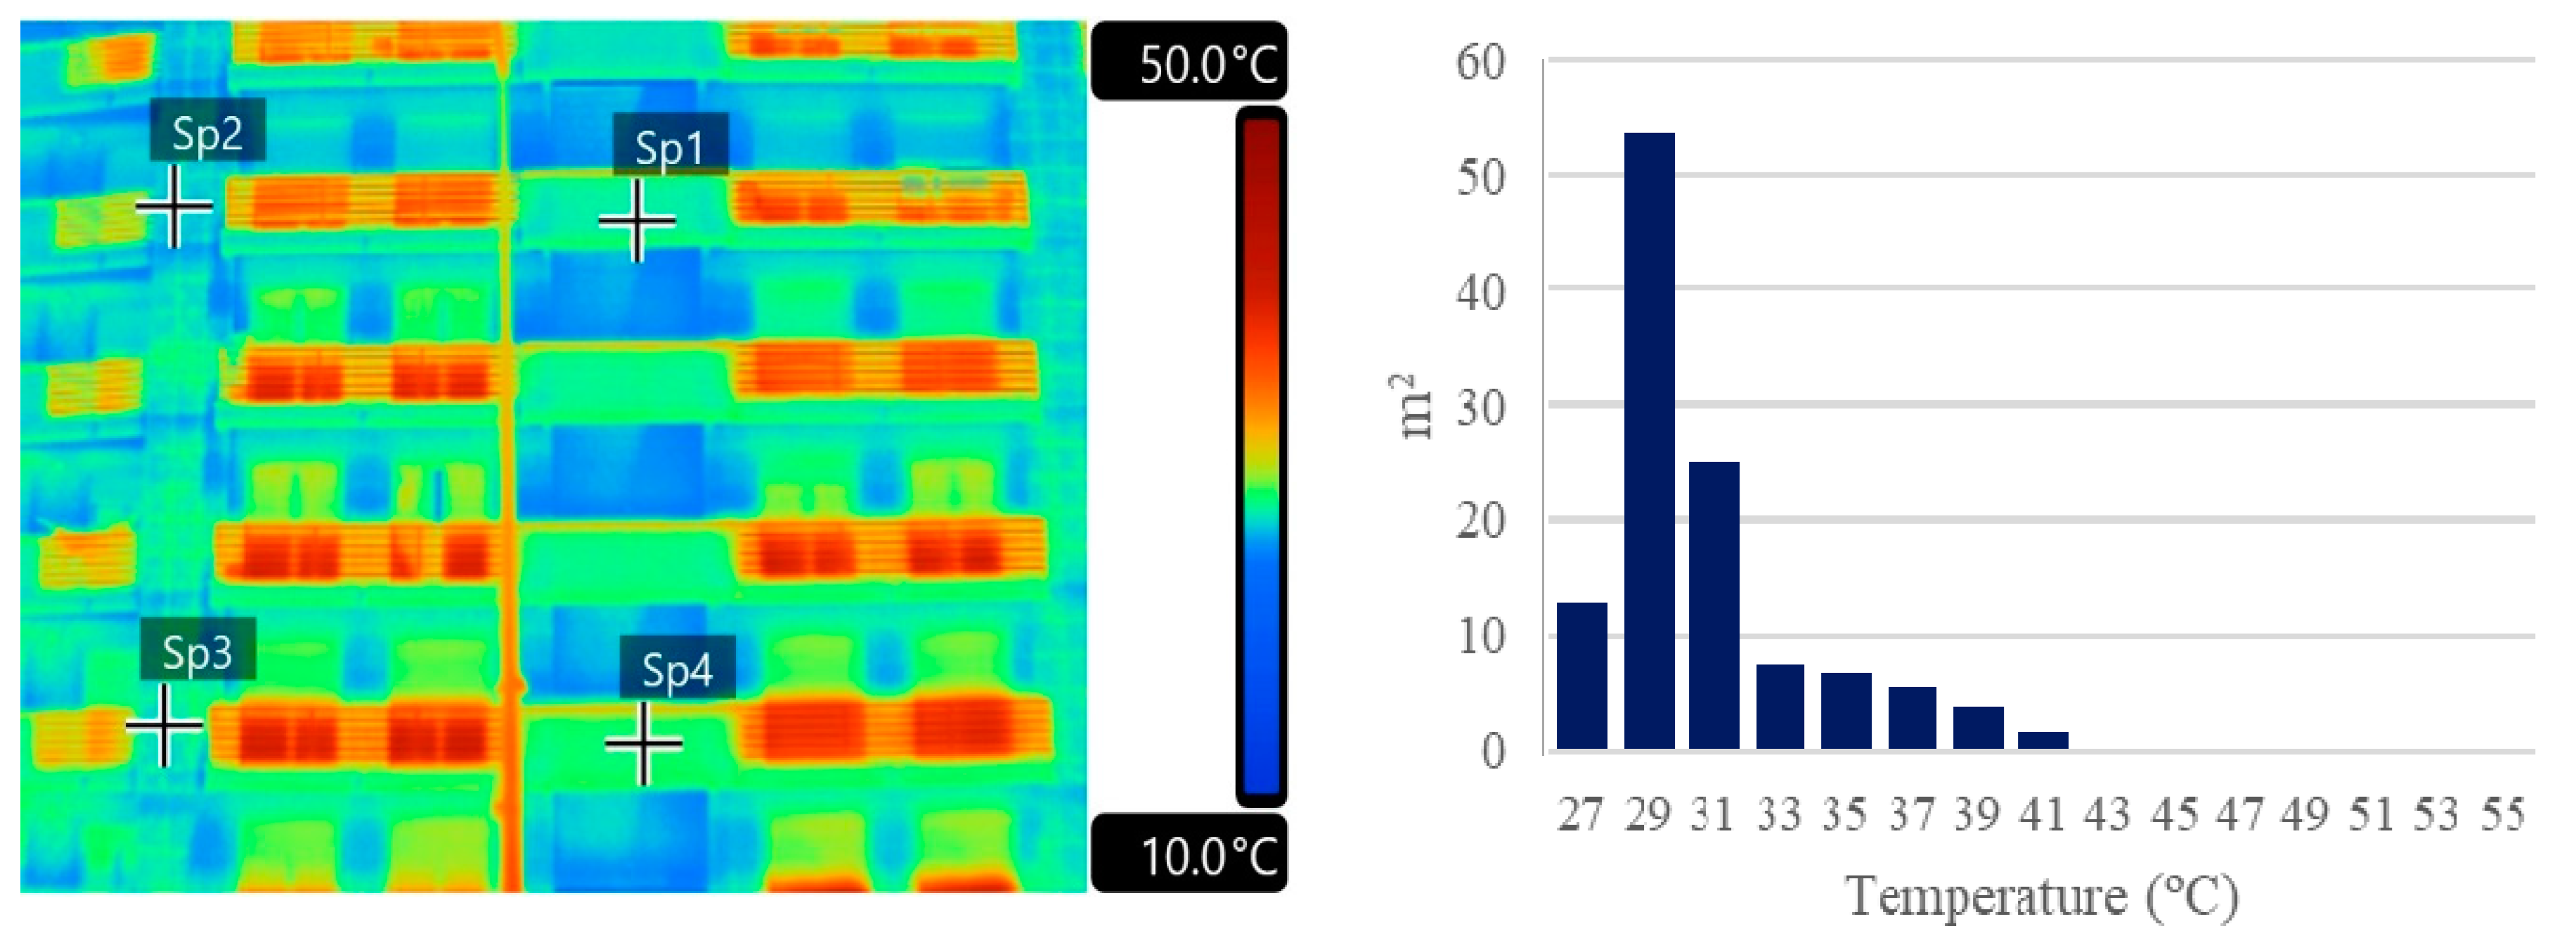
Figure 8 shows the temperature of the southern facade at 3 p.m. when the highest temperature was recorded. The highest average temperature of the entire facade was also recorded at 3 p.m.
Figure 9 shows the temperature of the north facade when the highest surface temperature was reached (7 p.m.). In the south facade, the highest average temperature throughout the facade was recorded at the same time the highest maximum air temperature was recorded.
In the east facade, the highest surface temperatures were recorded between 1 p.m. (39.1 °C) and 3 p.m. (34.6 °C).
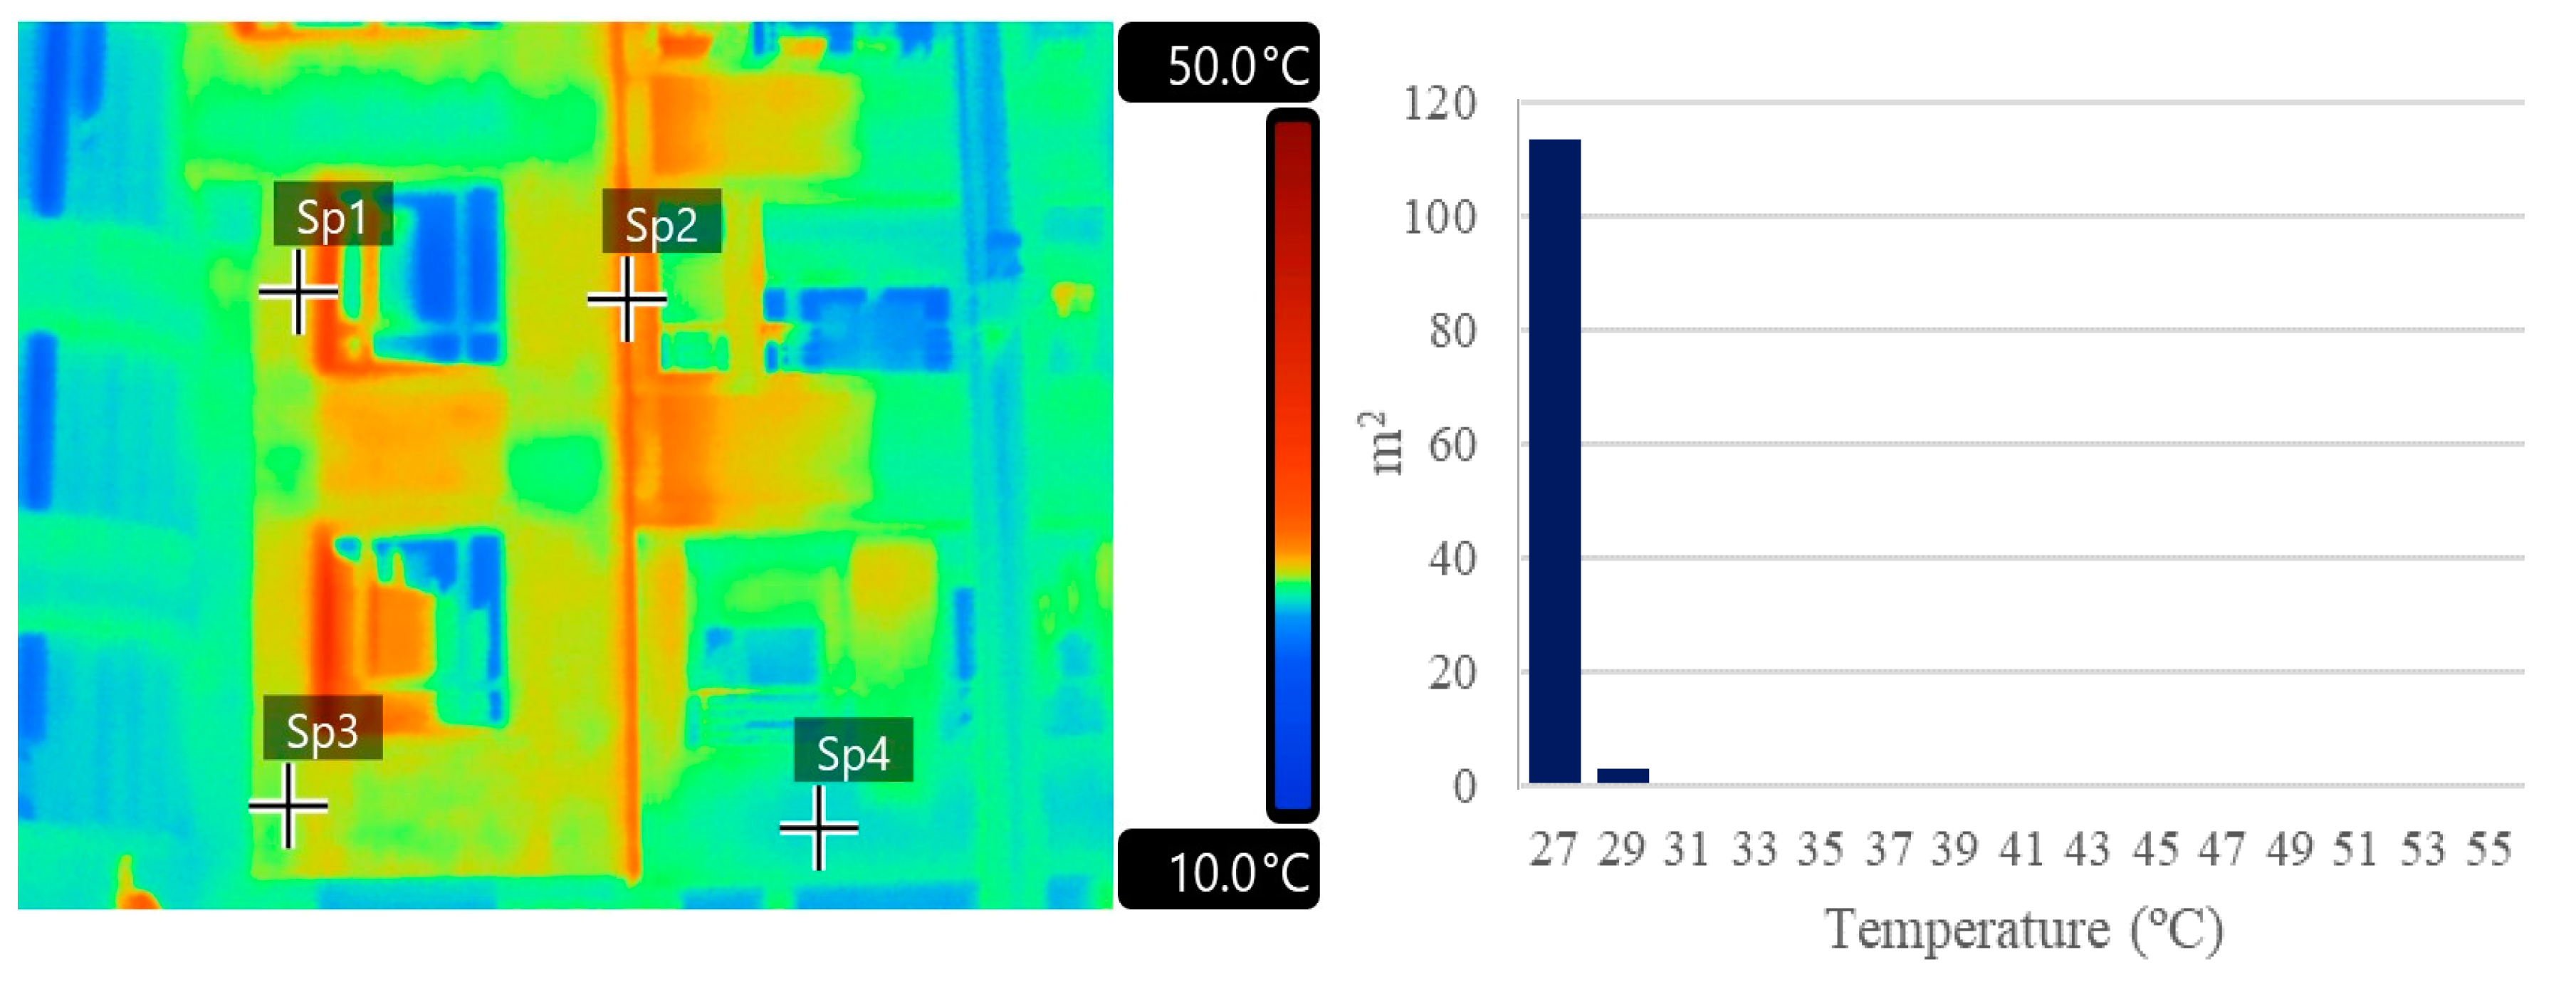
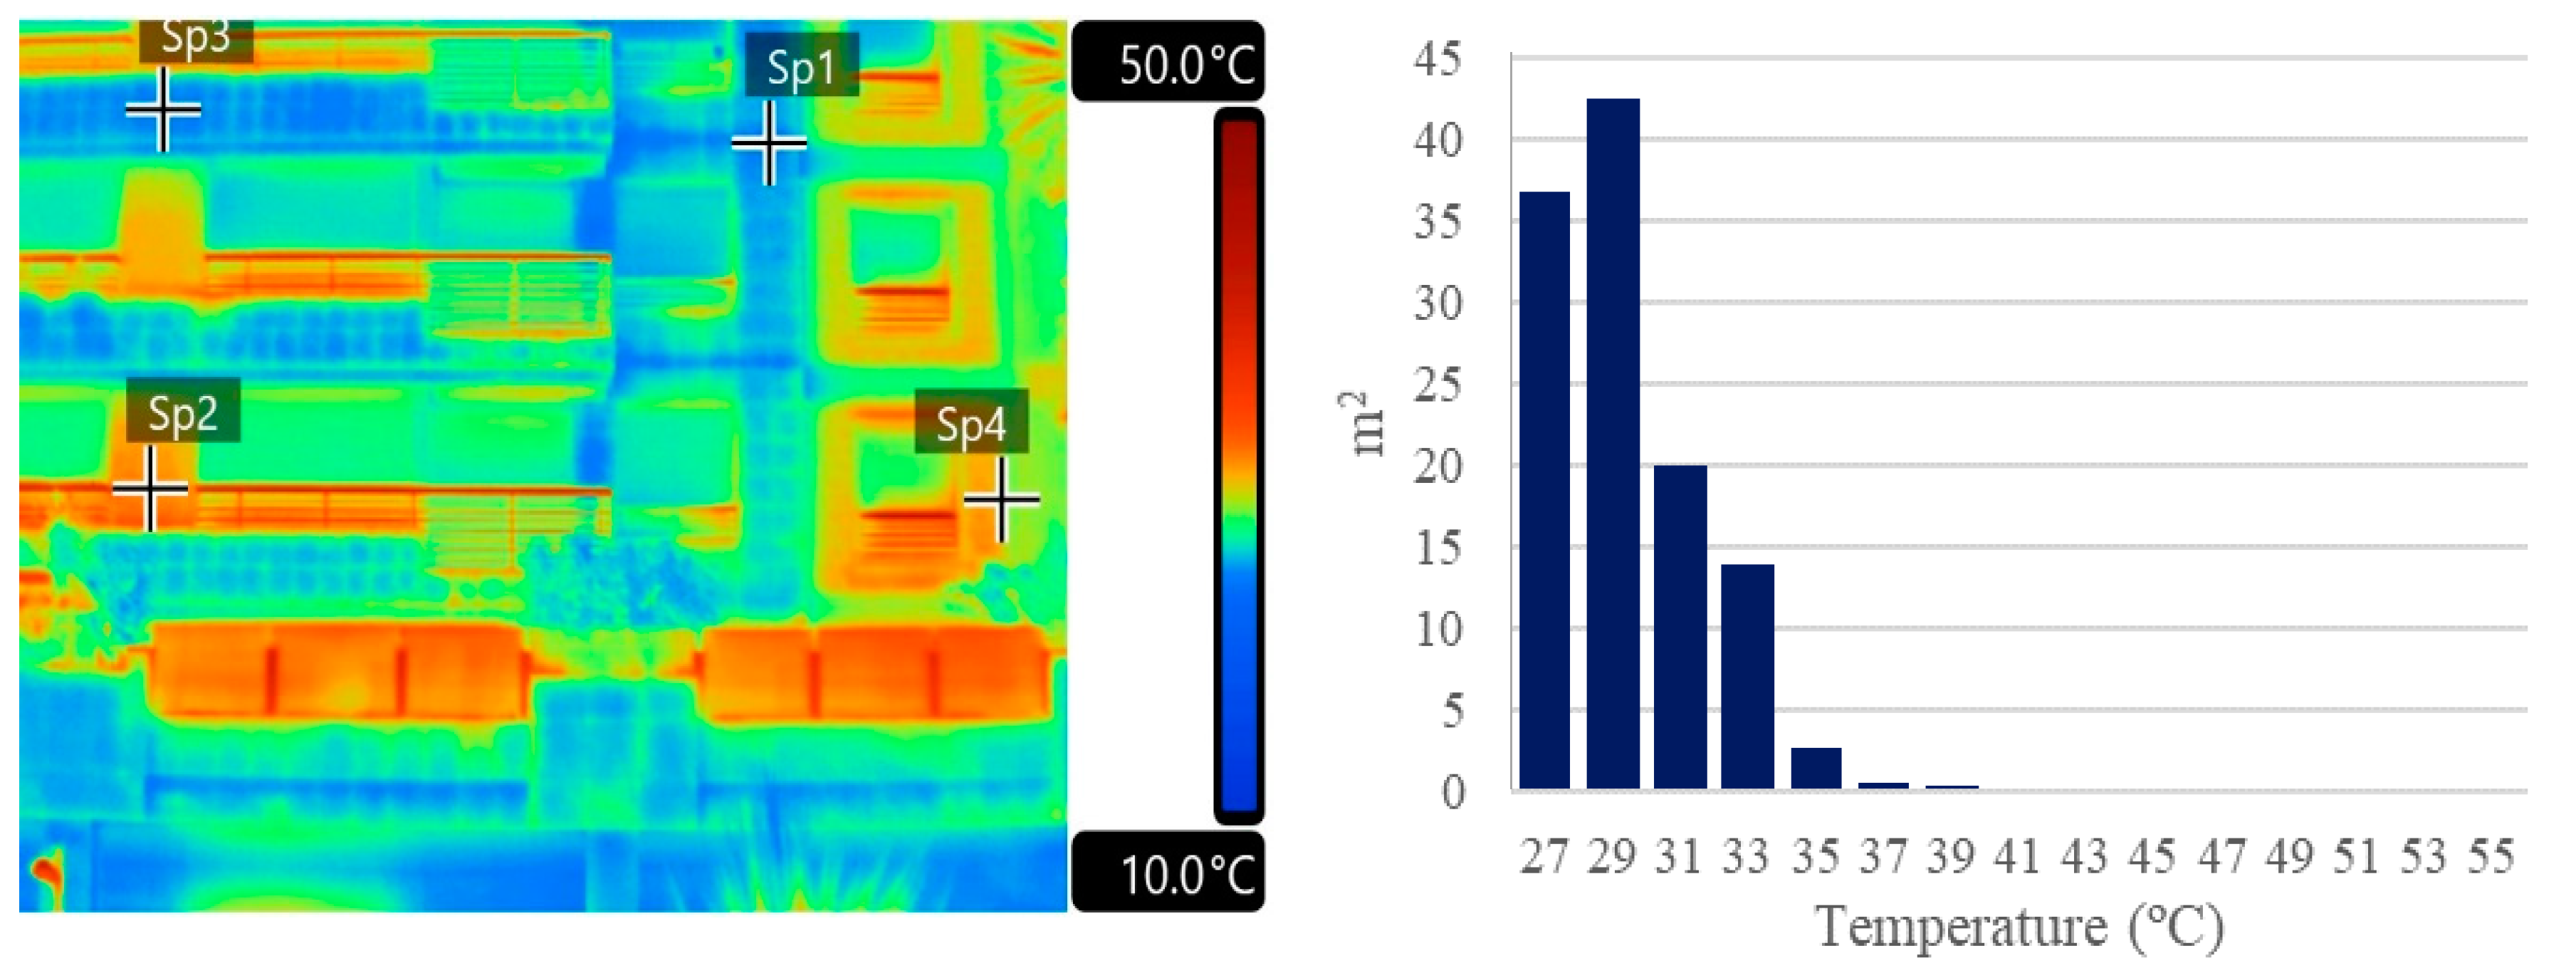
Figure 10 shows the variation of the surface temperature of the east facade at 1 p.m. On the west facade (
Figure 11), which receives only direct solar radiation in the afternoon, the highest temperatures were registered during the same period, especially between 3 p.m. and 7 p.m. (maximum temperatures of 38.1 °C and 35.1 °C, respectively).
The analysis of the thermal images collected in the east and west facades showed that, in the morning, the east facade presented higher temperatures than the west facade since it received direct solar radiation. In the afternoon, the opposite was observed, with the west facade presenting higher surface temperatures. However, by analyzing the differences between both facades, although the east facade received radiation during most of the morning period and the west facade only began receiving radiation after 1:40 p.m., ending shortly after 7 p.m., the temperatures reached by the latter were higher than those registered in the morning on the east facade.
Regarding the influence of the exposure of facades, the ones south-exposed, always presented, both in the morning and in the afternoon period, the highest temperatures of the four facades studied. In springtime (in the morning), this facade presented higher temperatures, when compared to the north facade, on average (6 °C). The same happened, in the afternoon, when this facade was, on average, warmer than the north facade (4 °C). In the summer, the south facade was warmer than the north even when the latter was already receiving direct solar radiation.
The results show that facade surface temperatures directly respond, most of the time, to the incidence of solar radiation. However, the maximum temperatures on these surfaces were sometimes recorded under conditions where the facades were no longer receiving solar radiation. This shows that even materials used in urban environments which only receive diffuse solar radiation have important thermal responses that can contribute to warming the urban environment.
Thermal Images of Other Urban Surfaces and Materials
Thermal images of horizontal surfaces were also collected in two day and are representative of spring and summer periods. The differences found allowed us to see that asphalt is the type of material that presented the highest temperatures when compared to the temperatures registered by other materials.
On the 7th of July, thermal images of the three types of material (asphalt; light-colored Portuguese sidewalk and pavement) were collected at four different times (9 a.m., 1 p.m., 3 p.m. and 7 p.m.). In this day, the highest temperatures were obtained between 1 p.m. and 3 p.m.
In the case of the of light-colored Portuguese sidewalk, the maximum temperature (56.6°C) was recorded at 1 p.m., whereas, on the asphalt and pavement the highest maximum temperatures were only recorded at 3 p.m. (58.4 °C and 42.1°C, respectively).
Comparing the temperatures of the different types of materials, it was observed that asphalt was on average 6.3 °C warmer than pavement and about 13 °C warmer when compared to the values obtained on the pavement in the morning (9 a.m.). At 1 p.m., these differences were higher, with values, on average, 9.7 °C higher in relation to sidewalk and 19.8 °C with respect to pavement. Already in the afternoon (3 p.m.), the differences were even higher, in the case of sidewalk, with values 13.1 °C higher on average.
When compared to the temperatures reached by the pavement, the difference between the temperatures recorded on the asphalt and the pavement dropped slightly to 19.3 °C. This can be explained by the fact that, at this time, the pavement was already receiving direct solar radiation. At 7 p.m., the average temperature difference between the asphalt and the sidewalk was 8.5 °C. At this time of the day, the pavement was warmer than the asphalt, because the latter was no longer receiving direct solar radiation. Comparing the temperatures reached by the pavement and the Portuguese sidewalk, the pavement was always warmer than the sidewalk, except for the period at 7:00 p.m., when the sidewalk had higher temperatures, on average (9.5 °C).
The three types of materials used on the horizontal surface presented different thermal behavior during the field work. Asphalt was the material that presented the highest temperatures, due to having a low albedo, between 0.05 and 0.2 [
20]. This type of material (very common in Lisbon) occupies a large part of the surface of the urban canyon area (40%) presenting high temperatures even in the morning, with average temperatures of 31.6 °C at 9 a.m. and 51.9 °C at 1 p.m. In the afternoon, when there is no incident solar radiation, this type of material still presents high surface temperatures (55.5°C at 3 p.m. and 36.3°C at 7p.m.).
High temperatures were also registered in materials with a higher albedo. In the case of the Portuguese sidewalk, whose albedo normally varies between 0.3 and 0.4, the observed maximum temperatures varied between 55 °C and 57 °C. In the case of the pavement, the highest temperature recorded was 42.1 °C. This was also noted by Del Carpio et al [
21]; the temperatures registered in the different types of materials are directly related to their solar reflectance (of
R2 ≥ 0.95). According to the authors, the most reflective surfaces, such as Portuguese sidewalk, presented lower temperatures when compared to materials such as asphalt, which presented the highest temperatures. The same was observed in the present work regarding the surface temperatures of the Portuguese sidewalk.
3.3. Radiation Balance of Urban Surfaces
On the 7th July 2018, the components of the net all wave radiation were collected, where Q* = (K↓ − K↑) + (L↓ − L↑) [
22], in different surfaces of the urban canyon (H/W = 0.86; SVF = 0.42). Values were registered every hour in the east and west facades.
The maximum value was always lower than 900 W∙m
−2, attainment the highest values between 11 a.m. and 3 p.m. In the morning and mid-day, until 2 p.m., the net all wave radiation of the east facade was higher, when compared with the obtained values for the west facade. Between 2 p.m. and 6 p.m., the highest values were registered in the west facade (
Figure 12 and
Table 4).
At 10:30 a.m. and 5 p.m. (when both facades had the same solar incidence angle), the east facade had ~437 W∙m−2 and the west facade ~973 W∙m−2. For the north and south facades, Q* values were only collected when the sun was at its maximum elevation (1:40 p.m.). At that time, the south facade had ~632 W∙m−2 and the north facade ~559 W∙m−2.
As can be observed (
Figure 12), the radiation balance of these surfaces responded directly to the incidence solar radiation: for example, the east facade, which received solar radiation during the morning, presented, in this same period, a higher value than the west facade (on average 474 W∙m
−2), and the opposite happened in the afternoon. In the case of the north and south facades, the southern facade presented a Q* higher than the north facade (+73 W∙m
−2). This can be explained by the fact that this facade received solar radiation for a longer period of time.
In addition, Q* of the floor react to the thermal response of the urban canyon to the incidence solar radiation. It was only at 11 a.m., when the whole canyon received solar radiation (except shaded areas), that the floor Q* showed a large increase in recorded values (227 W∙m−2 at 11 a.m. and 826 W∙m−2 at noon).
As for the relation between Q* of the different surfaces and the air temperatures observed in the urban canyon, the highest temperatures were recorded in the street with north/south orientation (in which the radiation balance of these facade was calculated hourly), between 2 p.m. and 4 p.m. Within this period, Q* of the east facade varied between 50.4 W∙m−2 and 58.8 W∙m−2 and the west facade varied between 49.5 W∙m−2 and 722.6 W∙m−2. In the case of the floor, Q* was higher when the air temperatures were also higher. This shows that these vales can be good indicators of thermal pattern inside the urban canyons.
The values of net all wave radiation were also collected for the different materials used on horizontal surfaces at three times: 9 a.m., 1 p.m. and 7 p.m.
Table 5 presents the Q* for the three types of materials used on the surfaces of the floor in the urban canyon. The highest values were recorded over the asphalt, both at 9 a.m. and 6 p.m. At 1 p.m., the highest value (888 W∙m
−2) was recorded on the pavement.
The obtained results showed that, on asphalt, the highest temperatures were registered when the radiative balance of this type of material was also higher (3 p.m.). The same happened in the case of the sidewalk, which had the highest temperatures and the highest Q* at 1 p.m.
4. Conclusions
The thermal and radiative properties of the urban atmosphere and surfaces properties collected in summertime of 2018, allowed us to have an integrative view of the processes and patterns characteristics in two urban canyons in the neighborhood of Telheiras (northern Lisbon district).
The results showed that all surfaces respond directly to the amount of incident radiation. It was observed that, in the morning, the east facade presented higher radiation balance values than the west facade, reaching its maximum at 1 p.m., in the summertime, with a maximum of 825.4 W∙m−2. During the afternoon, the highest values were recorded on the west facade, with a maximum of ~722 W∙m−2, at 3 p.m., in the summer.
In the facades exposed to the north and south, the radiative performance was as follows: at the time of maximum sun elevation, the south facade presented a higher radiation balance than the north facade, with values of ~632 W∙m−2 versus ~559 W∙m−2 (in the north facade).
Regarding the temperature of the different surfaces of the urban canyon, the south facade always presented higher temperatures when compared to the north facade, with the greatest differences observed at 3 p.m. The facade exposed to the east only presented higher temperatures at 1 p.m. In the morning and in the afternoon, the west facade always presented higher values, on average (+2.3°C) in summertime.
About the radiation condition of the three types of floor (flat surfaces), asphalt showed the highest values when compared to the pavement of the Portuguese light-colored sidewalk. As for the radiation balance, asphalt presented the highest temperatures, when compared to the Portuguese sidewalk (+4.9 °C). When compared to the pavement, asphalt always presented higher temperatures, on average (+12.9 °C), during the day.
With this work, it was confirmed that the use of a microclimatic network to monitor the air temperature is fundamental at the micro-meteorological scale. The results obtained during the period between April and July in the studied urban canyon allowed us to conclude that air temperature is higher in the east/west oriented street than in the north/south canyon. These differences, which never exceed 1.2 °C, were more evident in the afternoon, between 3:00 p.m. and 8:00 p.m.
The few differences in thermal responses of the different urban materials, both on facades and surfaces, are related to the fact that the types of materials used in urban areas are not very diversified. Roads are usually built using asphalt or concrete, which have high absorption and low reflective capacities. This causes a major accumulation of energy on these surfaces, which is later released into the atmosphere, contributing to warming up the urban canopy layer [
23,
24]. In the case of materials and colors used in the facades, we can conclude that due to the multiple reflections that occur in urban canyons, it is easier for these materials to absorb energy, releasing it to the atmosphere, especially at night time when the radiative balance is negative.
In future investigations, it would be important to include other urban components that also influence the urban climate (like vehicles, green spaces, etc.). In a future perspective, the inclusion of other types of materials may be also important. As mentioned earlier, there are many other materials used in urban environments with very different thermal responses, that will allow a more comprehensive knowledge of the thermal behavior of the materials under different conditions.


