Article

Web Objects Based Contextual Data Quality Assessment Model for Semantic Data Application

by
Muhammad Aslam Jarwar
1 and
Ilyoung Chong
2,*
1
Department of Information and Communications Engineering, Hankuk University of Foreign Studies, Seoul 02450, Korea
2
Digital Literati Information Technology Co., Ltd., Cheong-ju 28126, Korea
*
Author to whom correspondence should be addressed.
Appl. Sci. 2020, 10(6), 2181; https://doi.org/10.3390/app10062181
Submission received: 20 February 2020 / Revised: 10 March 2020 / Accepted: 15 March 2020 / Published: 23 March 2020

Abstract

:
Due to the convergence of advanced technologies such as the Internet of Things, Artificial Intelligence, and Big Data, a healthcare platform accumulates data in a huge quantity from several heterogeneous sources. The adequate usage of this data may increase the impact of and improve the healthcare service quality; however, the quality of the data may be questionable. Assessing the quality of the data for the task in hand may reduce the associated risks, and increase the confidence of the data usability. To overcome the aforementioned challenges, this paper presents the web objects based contextual data quality assessment model with enhanced classification metric parameters. A semantic ontology of virtual objects, composite virtual objects, and services is also proposed for the parameterization of contextual data quality assessment of web objects data. The novelty of this article is the provision of contextual data quality assessment mechanisms at the data acquisition, assessment, and service level for the web objects enabled semantic data applications. To evaluate the proposed data quality assessment mechanism, web objects enabled affective stress and teens’ mood care semantic data applications are designed, and a deep data quality learning model is developed. The findings of the proposed approach reveal that, once a data quality assessment model is trained on web objects enabled healthcare semantic data, it could be used to classify the incoming data quality in various contextual data quality metric parameters. Moreover, the data quality assessment mechanism presented in this paper can be used to other application domains by incorporating data quality analysis requirements ontology.

1. Introduction

Due to the proliferation of Artificial Intelligence (AI), the Internet of Things (IoT), Social Network Services (SNS), and e-health, a huge amount of data is generated, integrated and aggregated for the decision making process [1]; however, the quality of the data is questionable, along with associated risks [2,3]. It has been estimated that 40% of the expected value from business targets could not be achieved due to the bad data quality, and it affects 20% on the productivity of laborers [4]. In the article [5], it is mentioned that 70% of participants reveal that their business faced hardships due to poor data quality. The data produced and used in the organizations contain 1–5% of poor data quality [6]. This may be one of the reasons that organizations face hardship and could not be able to sustain the business for a longer duration. According to the estimation done by the International Data Corporation (IDC) that the big data market will increase to 136 billion per year and the bad data cost can also be increased with the same speed [7]. The 2016 Harvard business review report indicates that the knowledge workers waste 50% time in data hunting and fixing of errors. Similarly, data scientist spends 60% of their time on the cleaning and organization of data [8]. Therefore, the quality of data is important for the organizations and it should be checked and measured before using it in the applications and services.
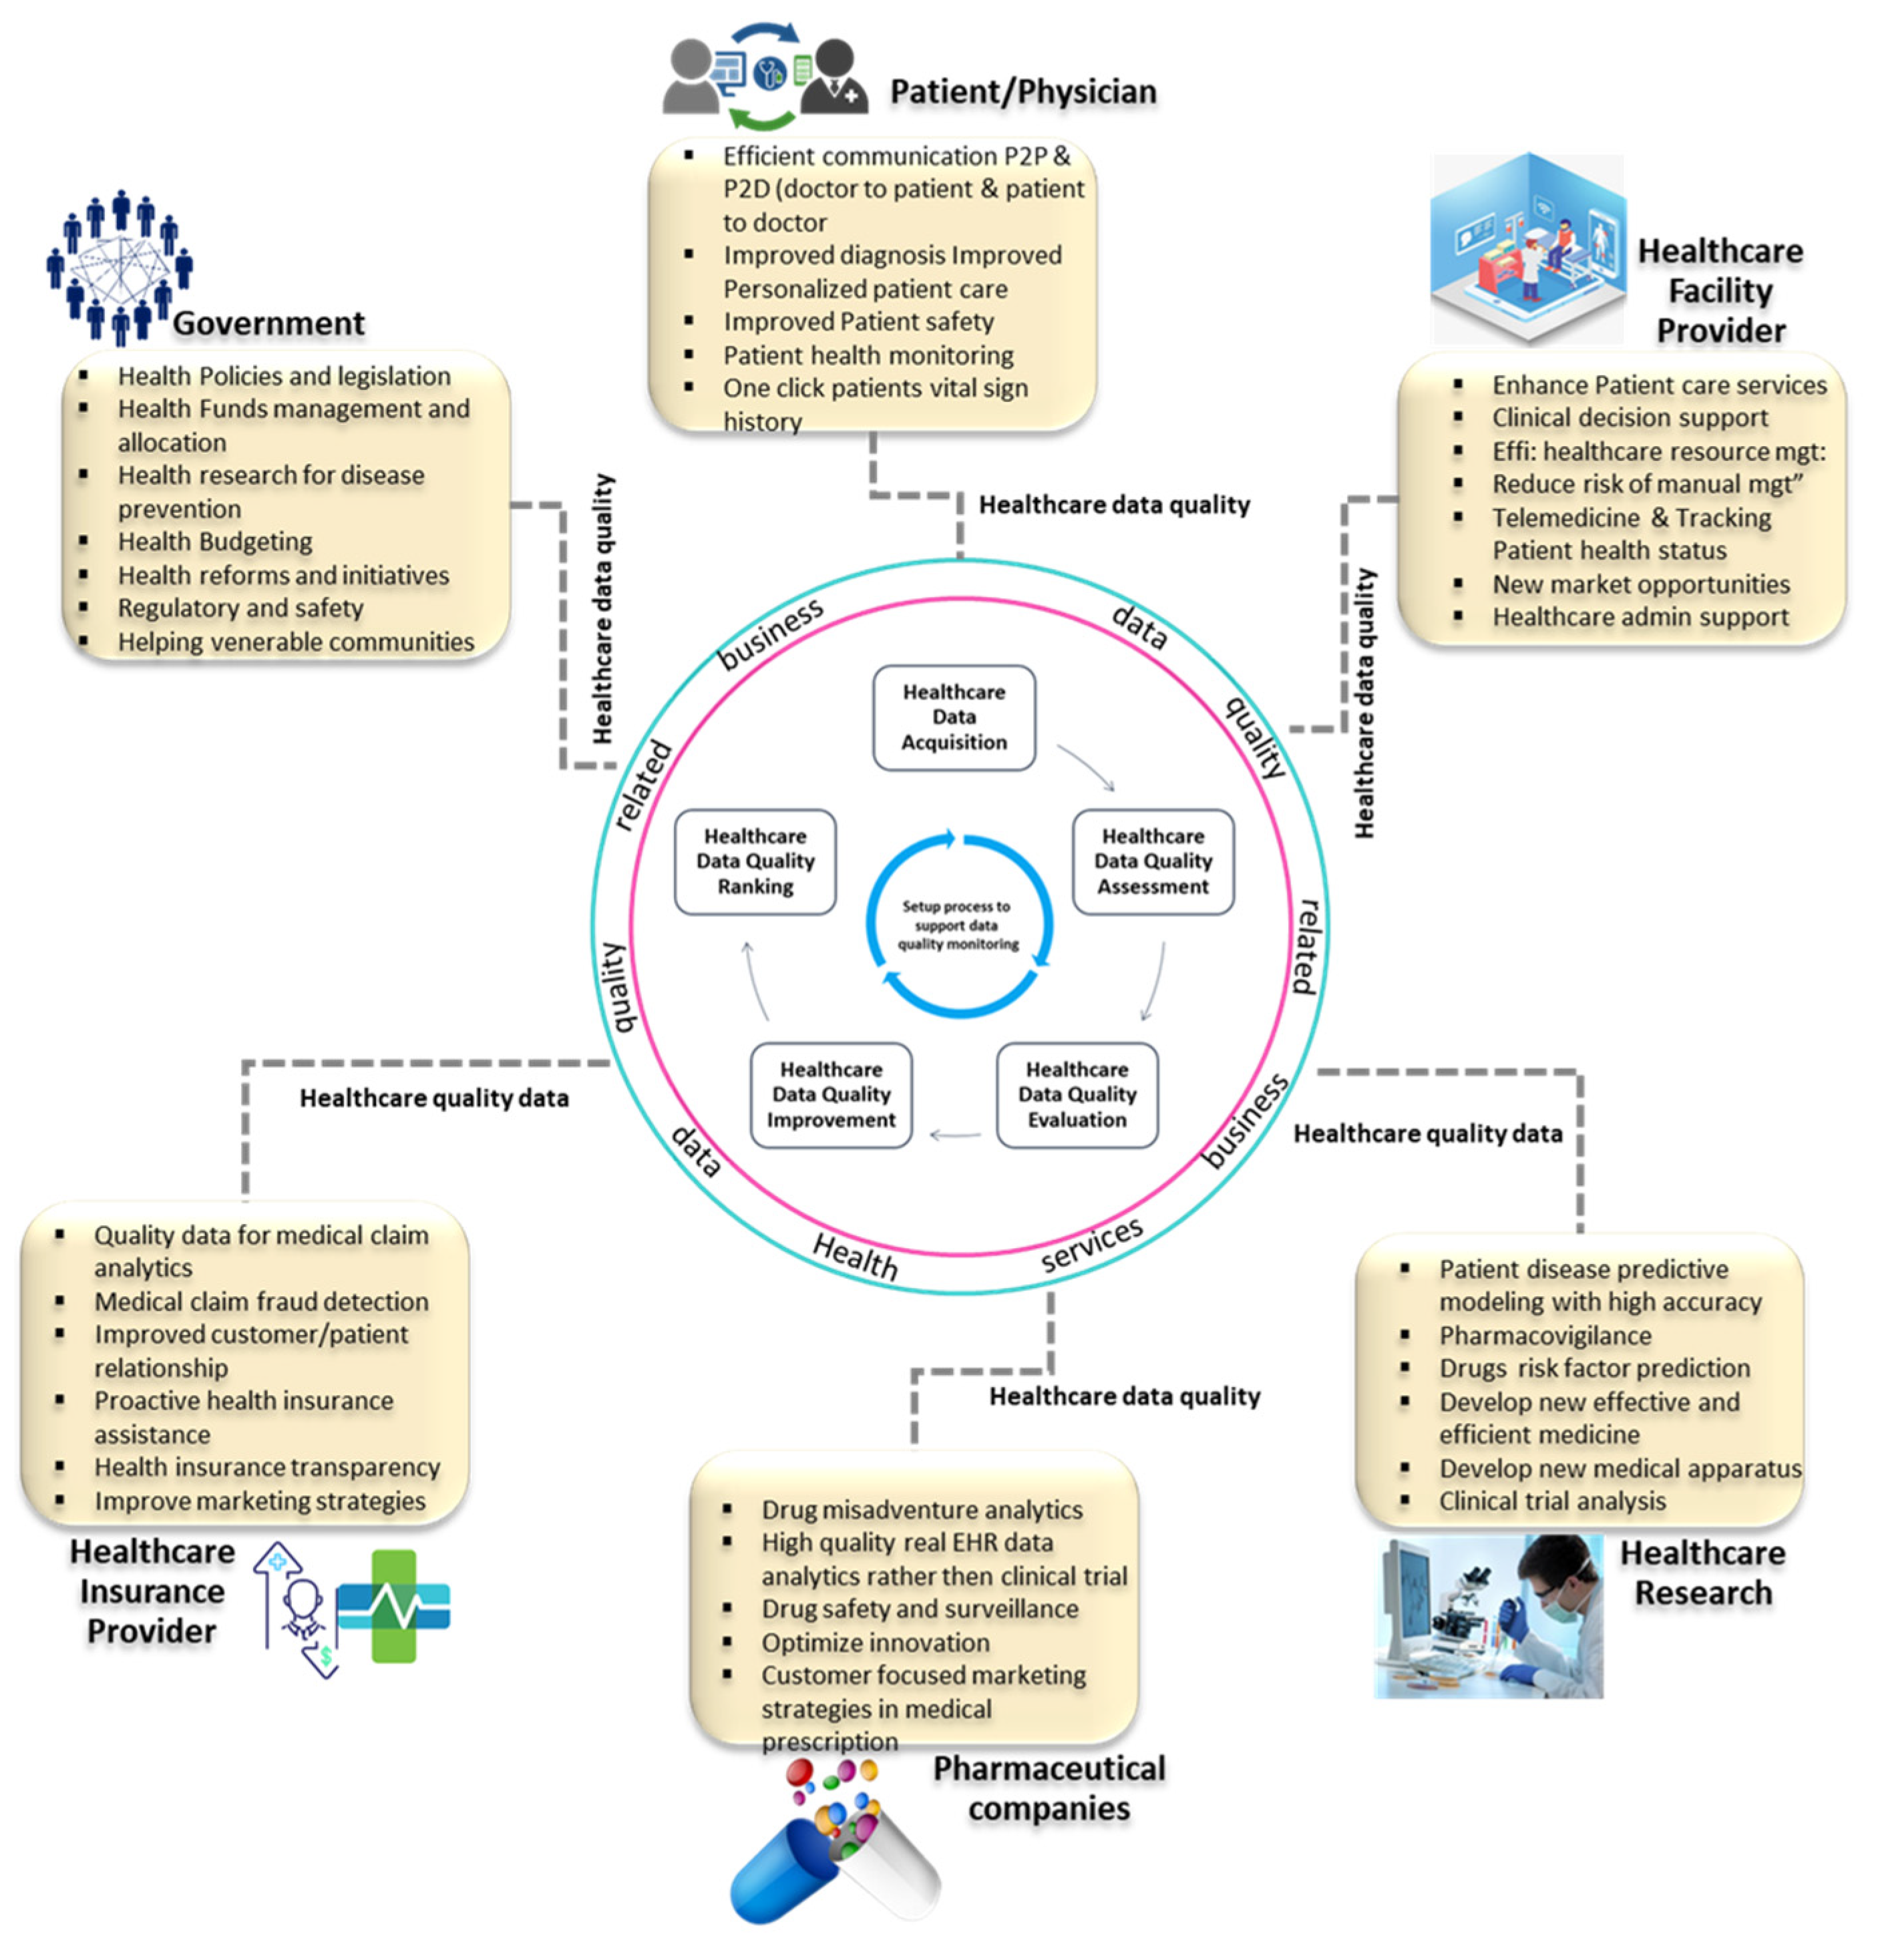
Data quality is more important in the healthcare domain. The magnificent assessment of data quality leads to provide better services and efficient resource management. The data used in the services should be checked in terms of quality for accurate planning and decisions. On the other hand, unchecked data from unreliable resources may cause serious damages to the reputation and loss of businesses. In the healthcare domain, a large quantity of data is collected such as electronic health records, laboratory results, patients’ health status monitoring data through wearable and non-wearable sensors, etc. However, the potential of that data could not be exploited because of poor quality and low confidence [9,10,11]. There are many reasons for poor quality healthcare data such as wear and tear of healthcare equipment, untrainable staff, and different formats, etc. By using machine learning or deep learning models, we can estimate the quality of healthcare data by eliminating the deficiencies of subjective measures. So that the healthcare data could be fully utilized without any risk for better patient care and delivery of high-quality services. In the healthcare domain, there are various governmental, non-profit organization and business stakeholders who can get benefits from well-defined contextual data quality assessment mechanisms. The advantages of contextual data quality analytics for various stakeholders in the healthcare environment have been summarized in Figure 1.
Quality of the same data may be different for the various applications and users; because each application has its context and requirements to use that data. Data quality refers that the data is fit for use in a specific context and it can be defined as “the standard of something as measured against other things of a similar kind” [12,13]. The International Organization for Standardization (ISO) defines data quality as “characteristics of data that relate to their ability to satisfy stated requirements”. Moreover, data quality can be specified as the “degree to which the characteristics of data satisfy stated and implied need when used under specified conditions”. To assess data quality various metrics have been used such as completeness, accuracy, timeliness, uniqueness, reliability, consistency, reputation, interpretability, and relevancy, etc. [10,11,14]. Zaveri et al. [15,16], have discussed sixty nine data quality metrics and all these may not be used in the context of single application data, some are important for one case that others will be more suitable in another context. Therefore, it is also a significant contribution to identify the required data quality metrics in the application’s context and nature of data.
The quality of data should be analyzed in the application or business context impartially [17,18]. Normally the data quality is assessed with some business rules that can be applied to the data. For example, to measure the accuracy aspect of data quality, the percentage of values with errors is divided by the total number of values in a data instance [19]. However, the contextual data quality assessment is a complex mechanism that needs automatic learning procedures to identify many patterns of incorrect or malicious data. To overcome the aforementioned issues, we present a contextual data quality assessment mechanism that supports data quality assessment for web objects healthcare applications by using deep learning models and semantic ontologies. The proposed data quality assessment mechanism is evaluated with two healthcare applications that provide services based on the emotion data received from wearable sensors. The Web of Objects (WoO) is a simple but efficient services platform that supports a robust way to develop application services with data abstraction using Virtual Objects (VOs) and Composite Virtual Objects (CVOs) [20]. It fosters to analyze a very huge amount of data using microservices and VOs and CVOs ontologies [21]. The intrinsic and contextual data quality assessment processing services are distributed and scaled into many microservices to increase the availability of quality data for the semantic data applications [22,23]. The proposed model supports to analyze data quality with intrinsic and contextual metric parameters at the data acquisition, assessment and service level. The functionality of WoO based data quality assessment mechanism can be generalized and extended to other applications by incorporating data quality requirements and assessment business rules. Moreover, the contributions of this article have been summarized as follows:
  • The data quality requirements have been identified for WoO based healthcare applications with respect to data acquisition, assessment and measurement of the quality of objects.
  • The contextual data quality assessment metric parameters and functions for WoO have been defined with respect to the data acquisition, data quality assessment level, and service level.
  • The intrinsic and contextual data quality assessment metric parameters have been presented.
  • The deep learning model has been developed to perform the WoO based data quality assessment with respect to the contextual aspect of data quality.
  • We present a comprehensive web objects based data quality assessment model for the healthcare applications. This model is based on semantic ontologies and deep learning models.
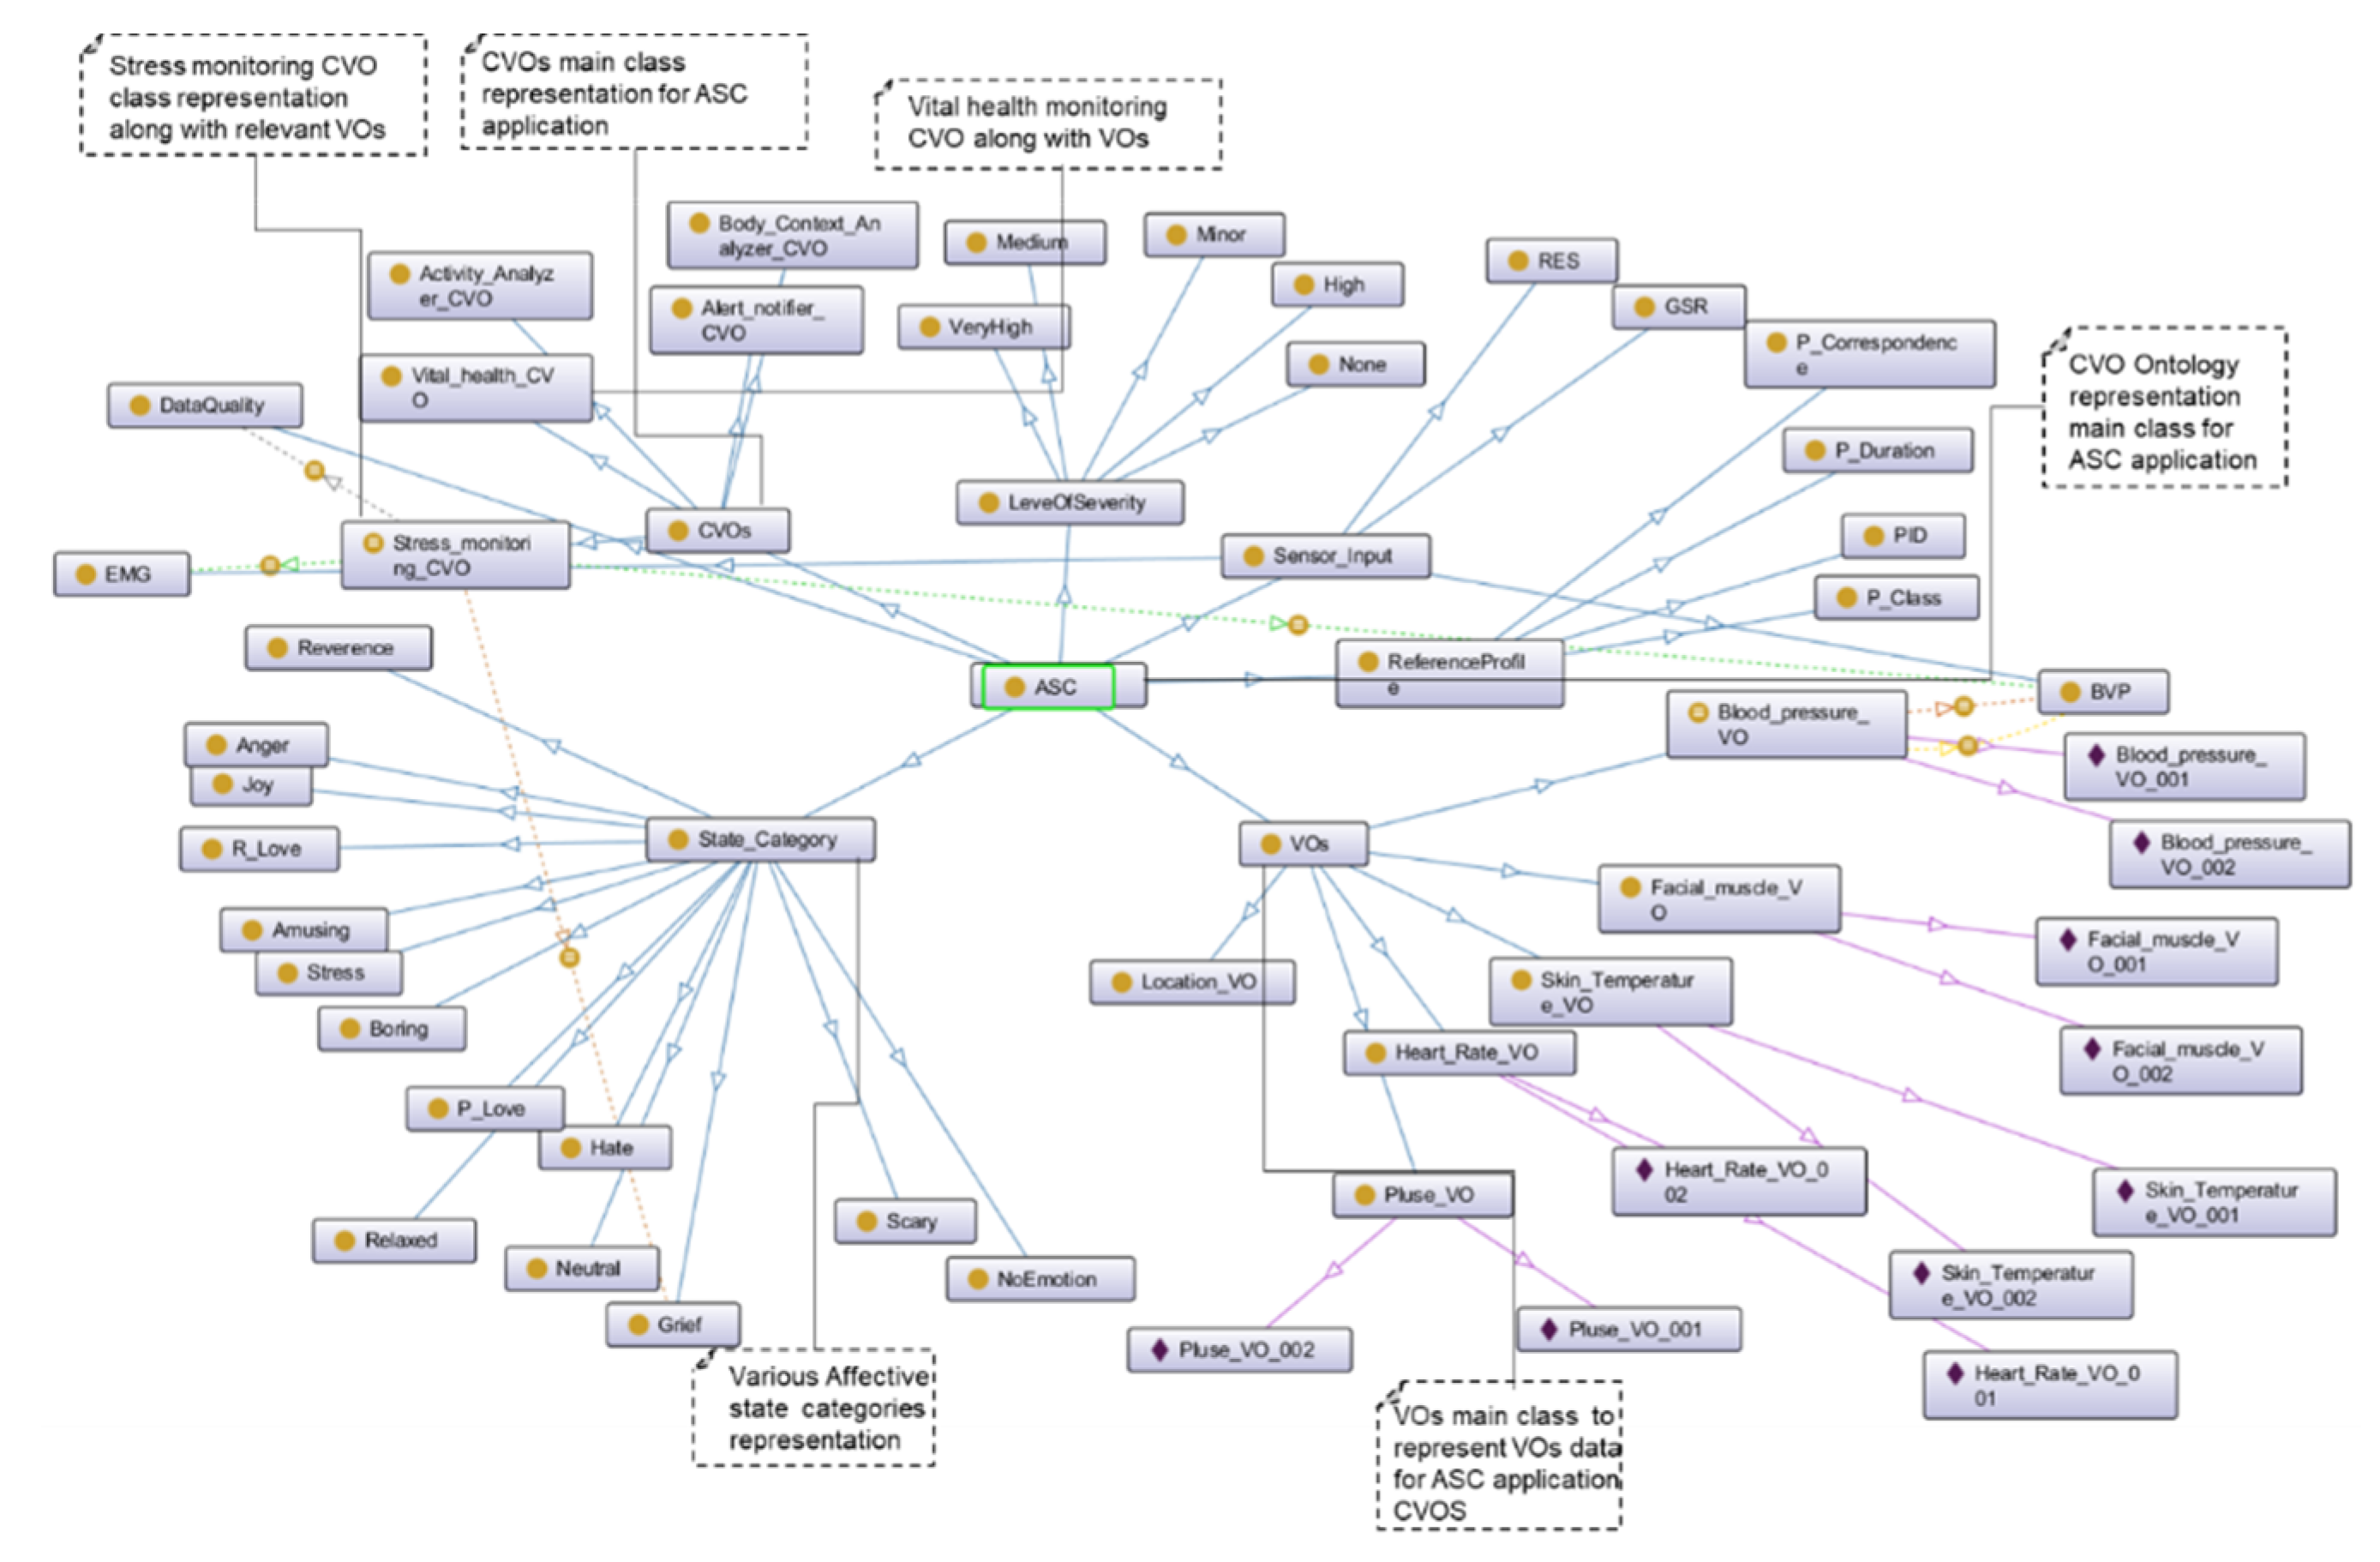
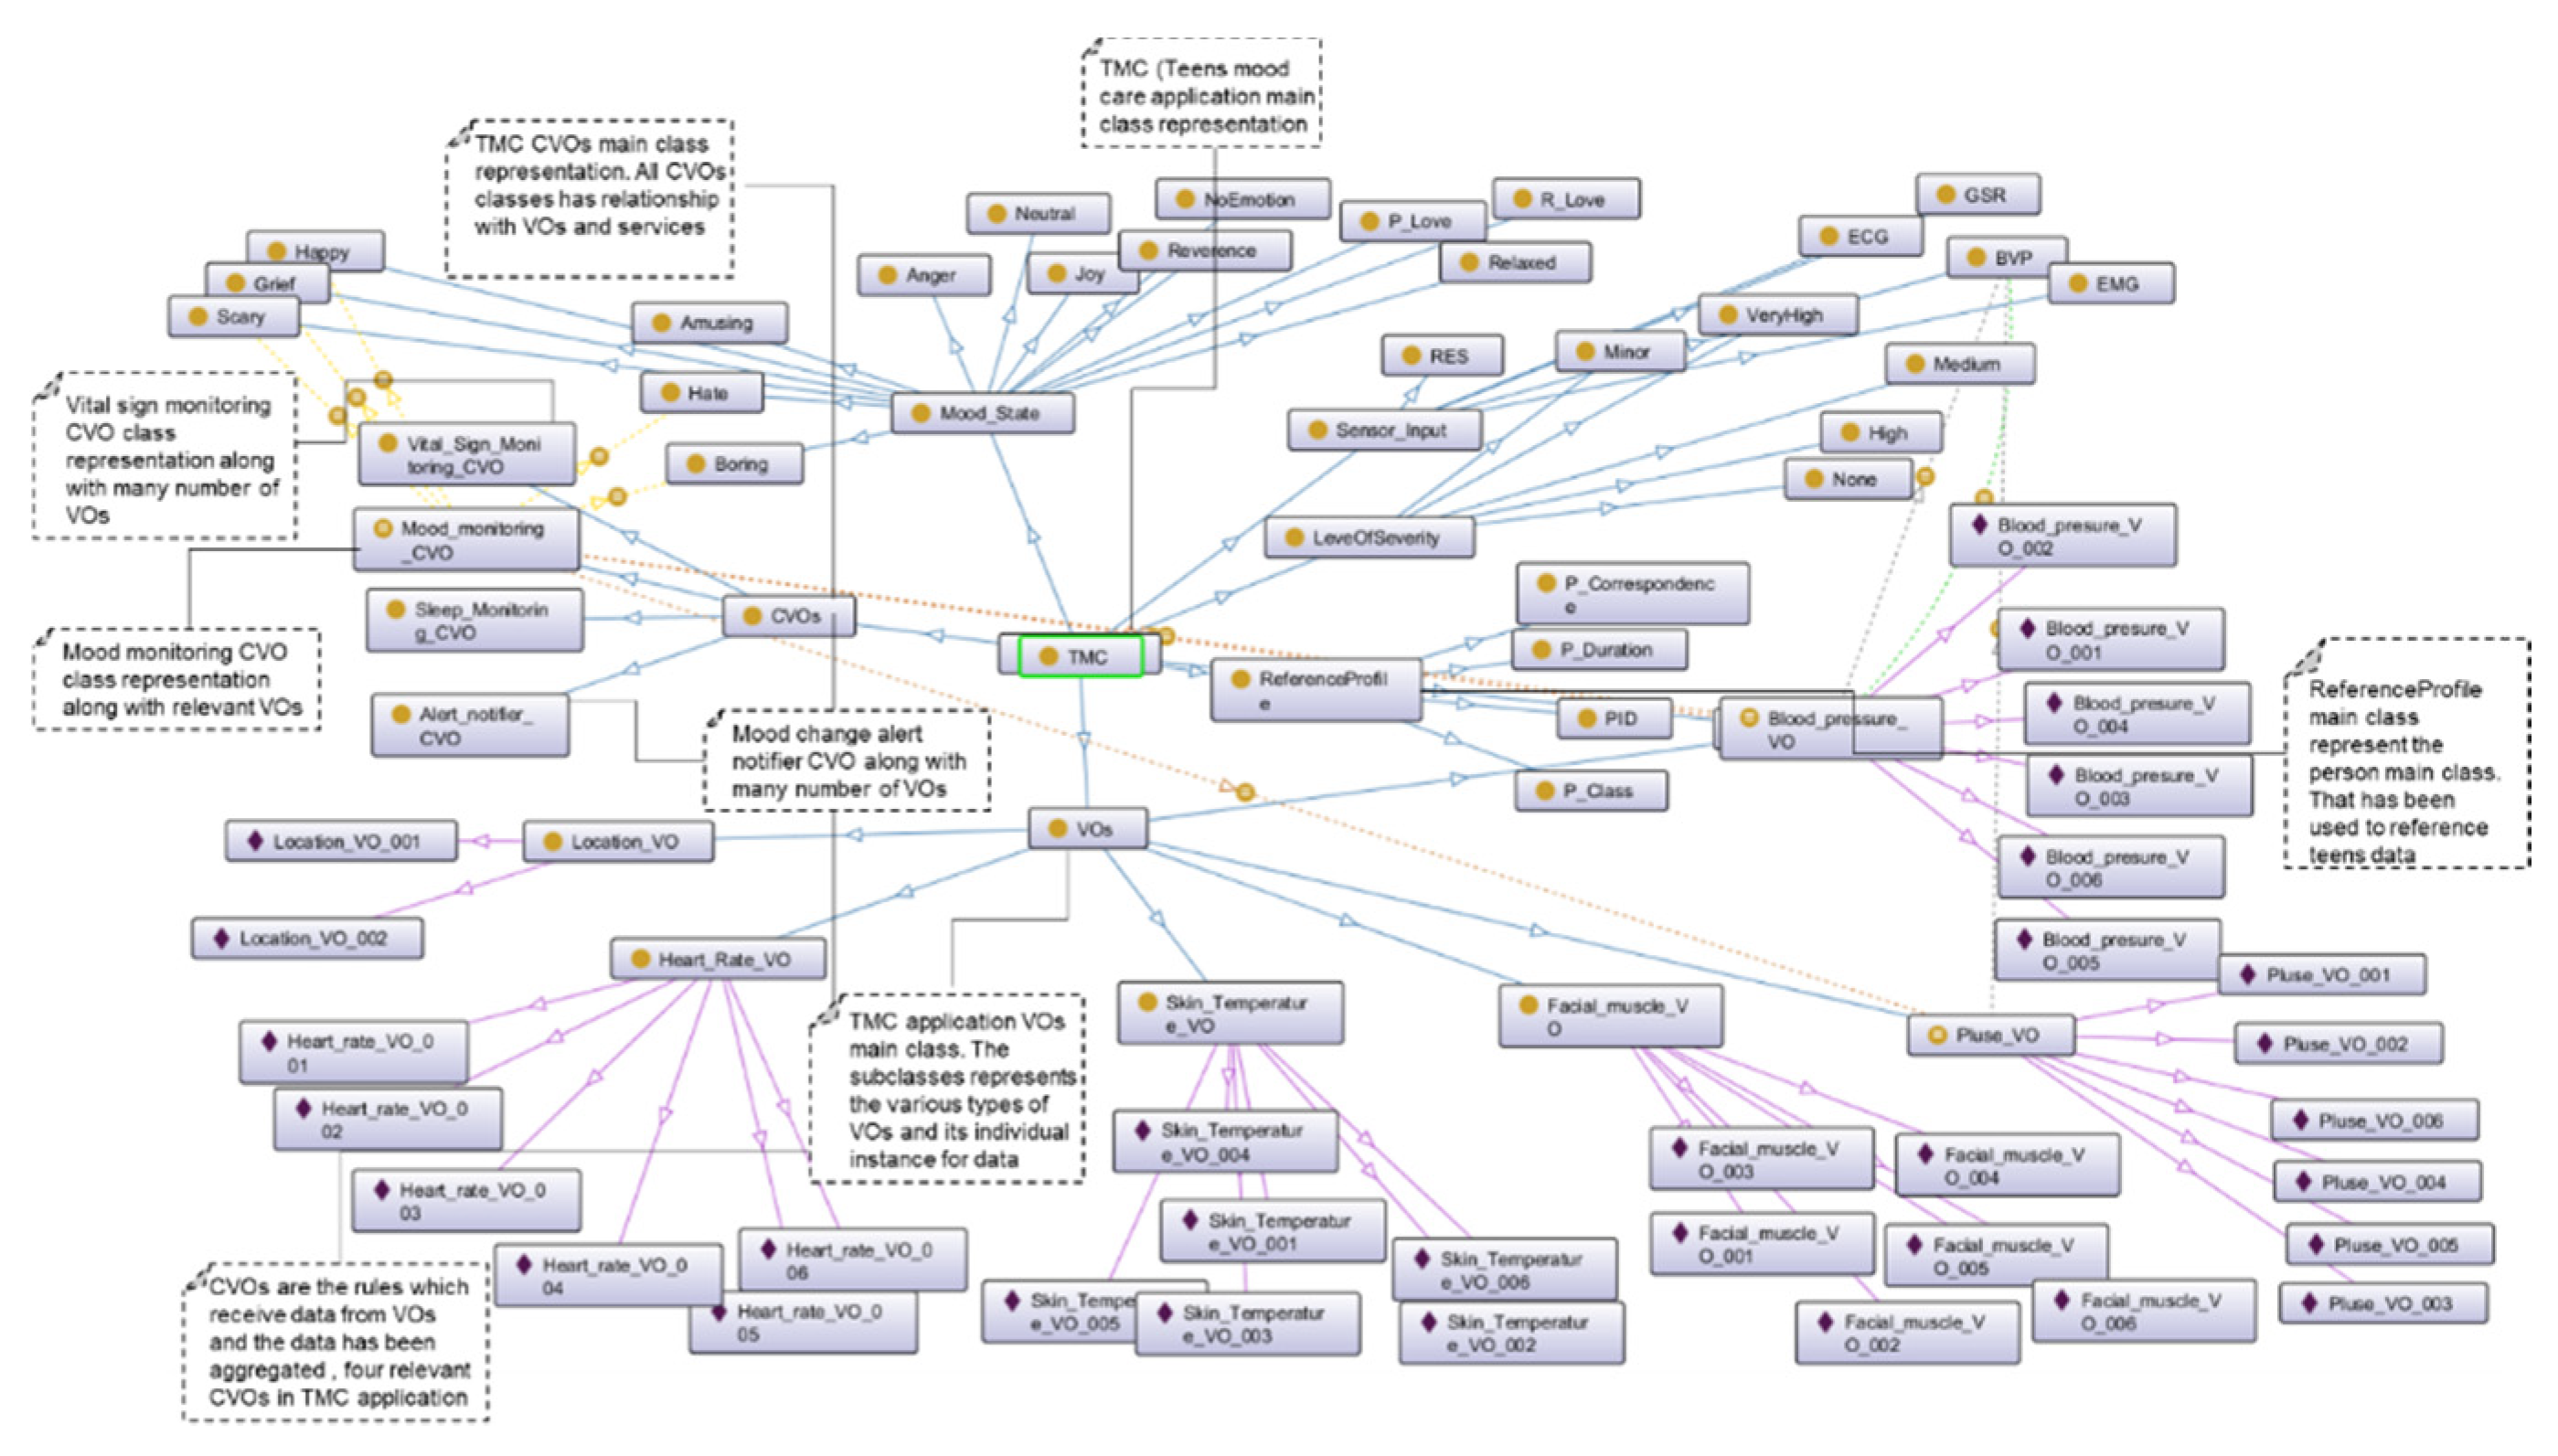
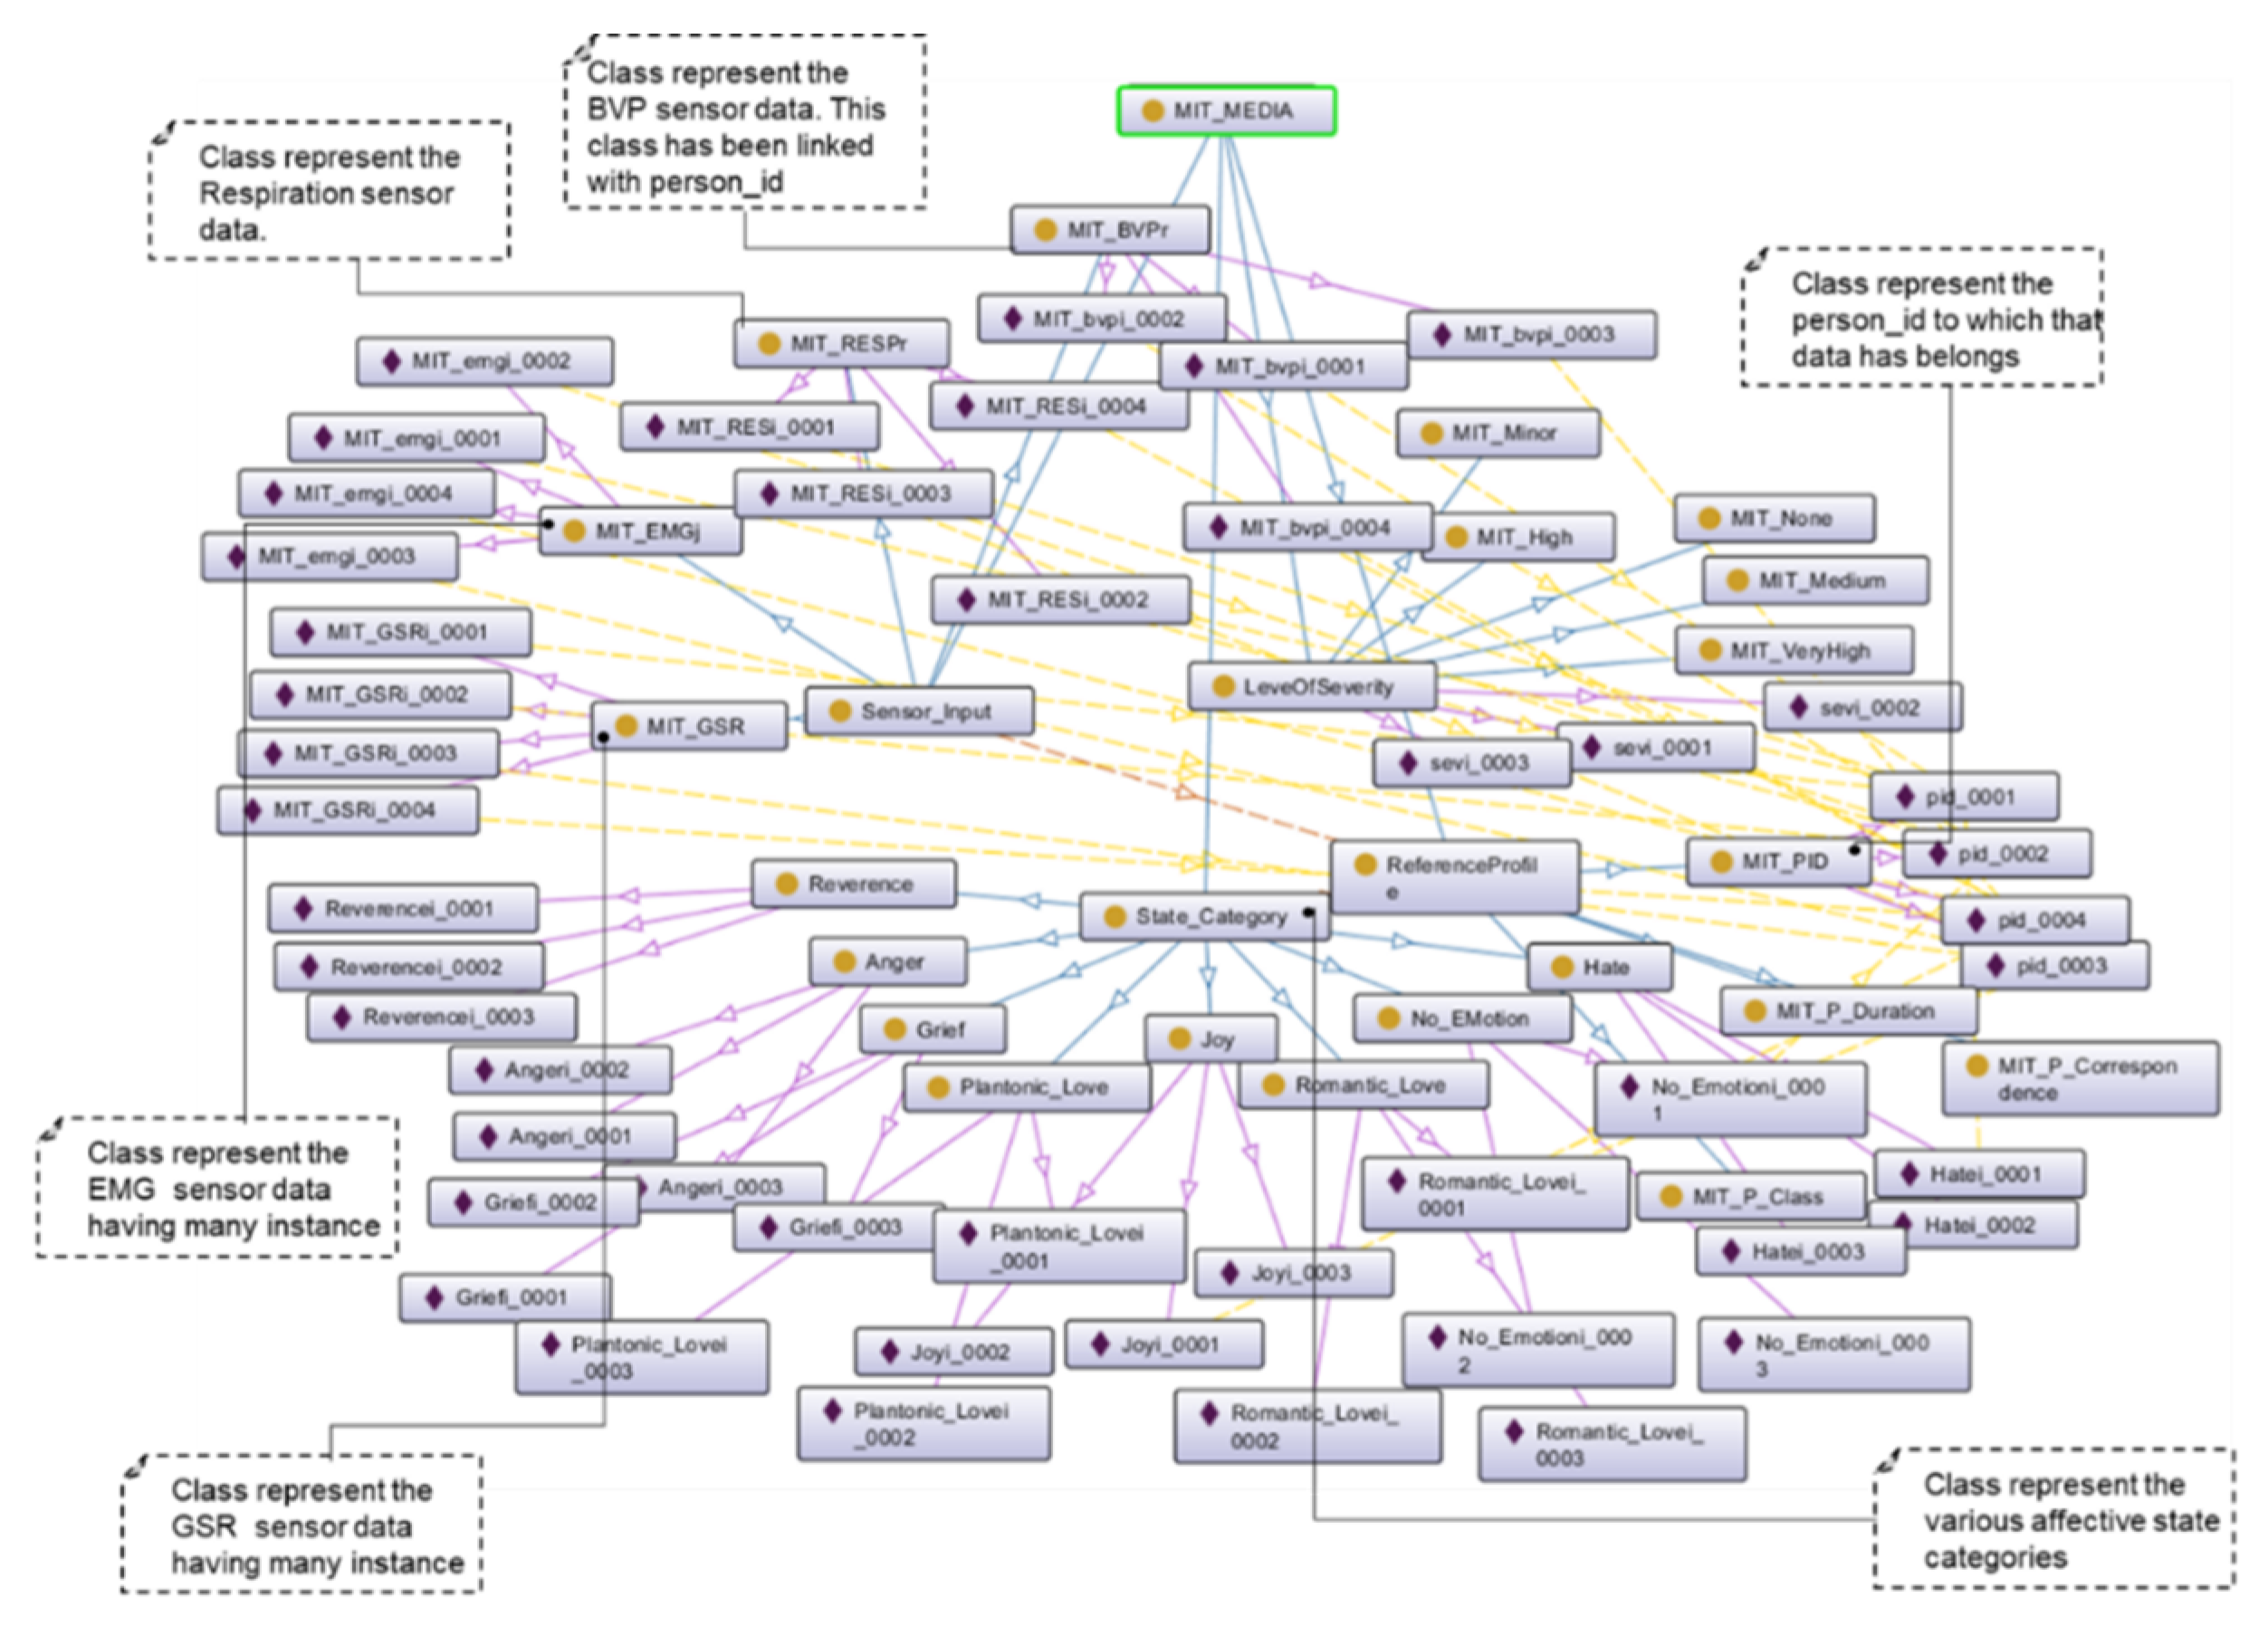
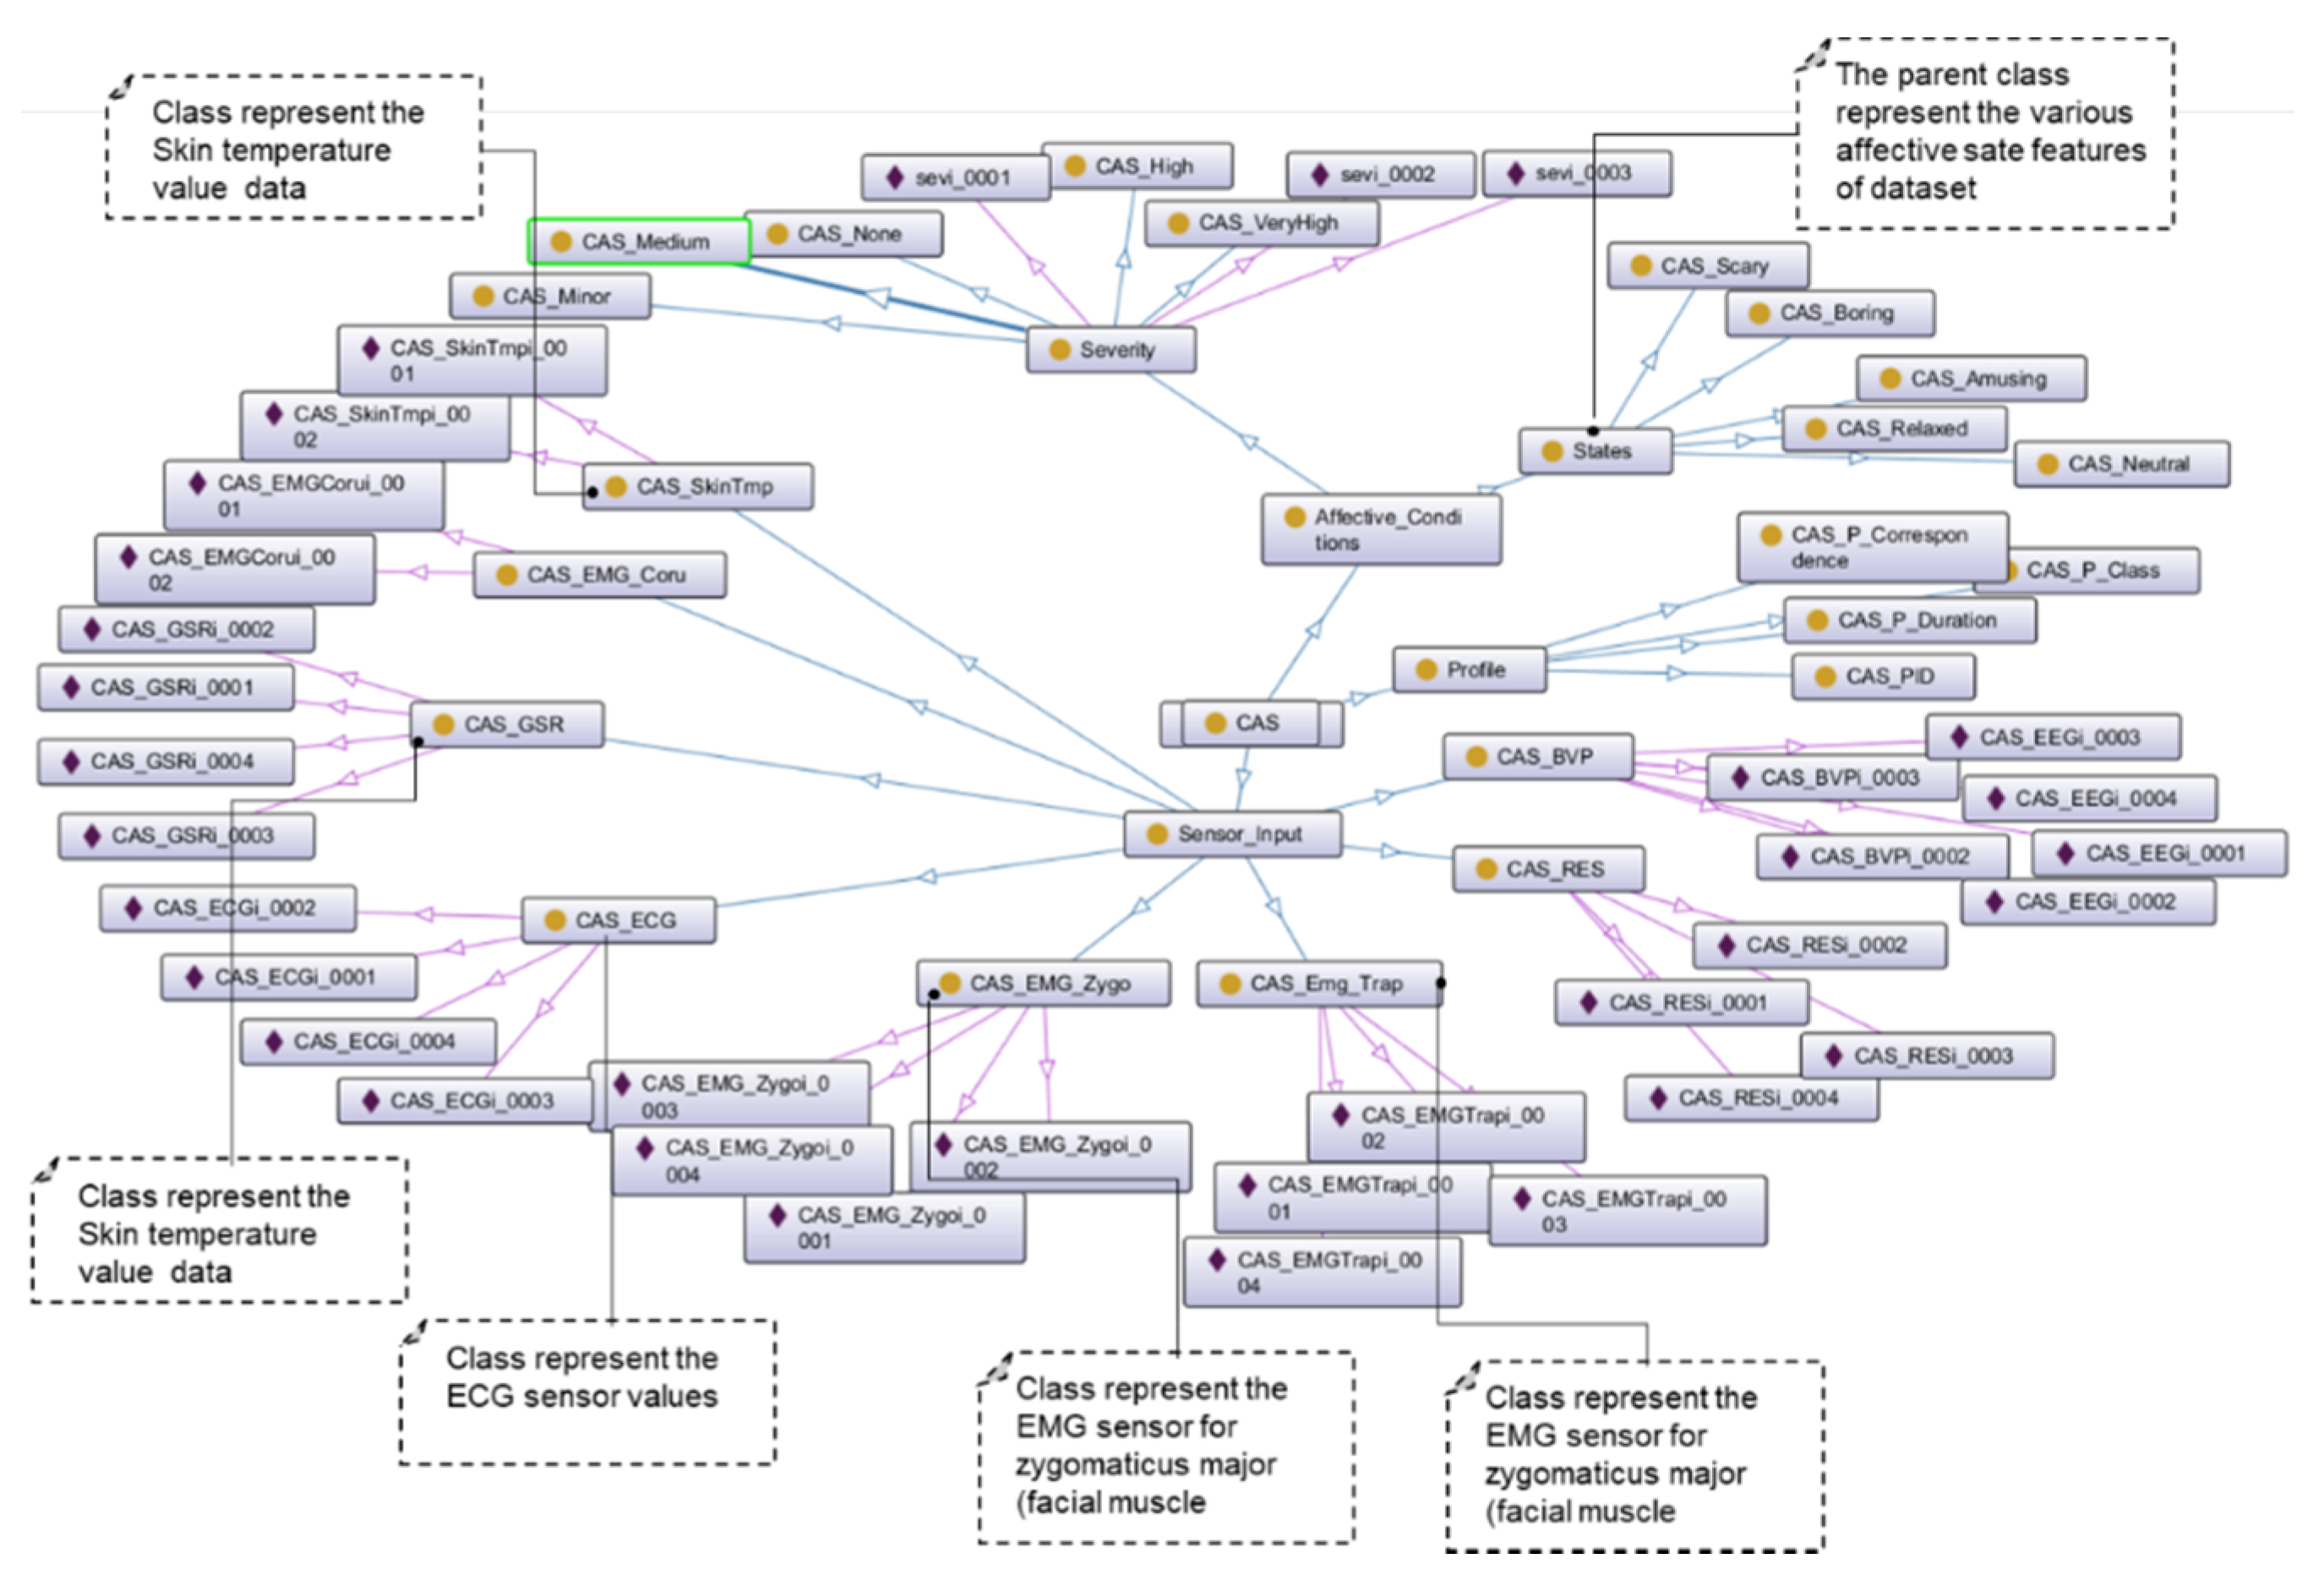
  • To validate the proposed approach of data quality assessment, we developed the Affective Stress Care (ASC) and Teens’ Mood Care (TMC) application ontologies.
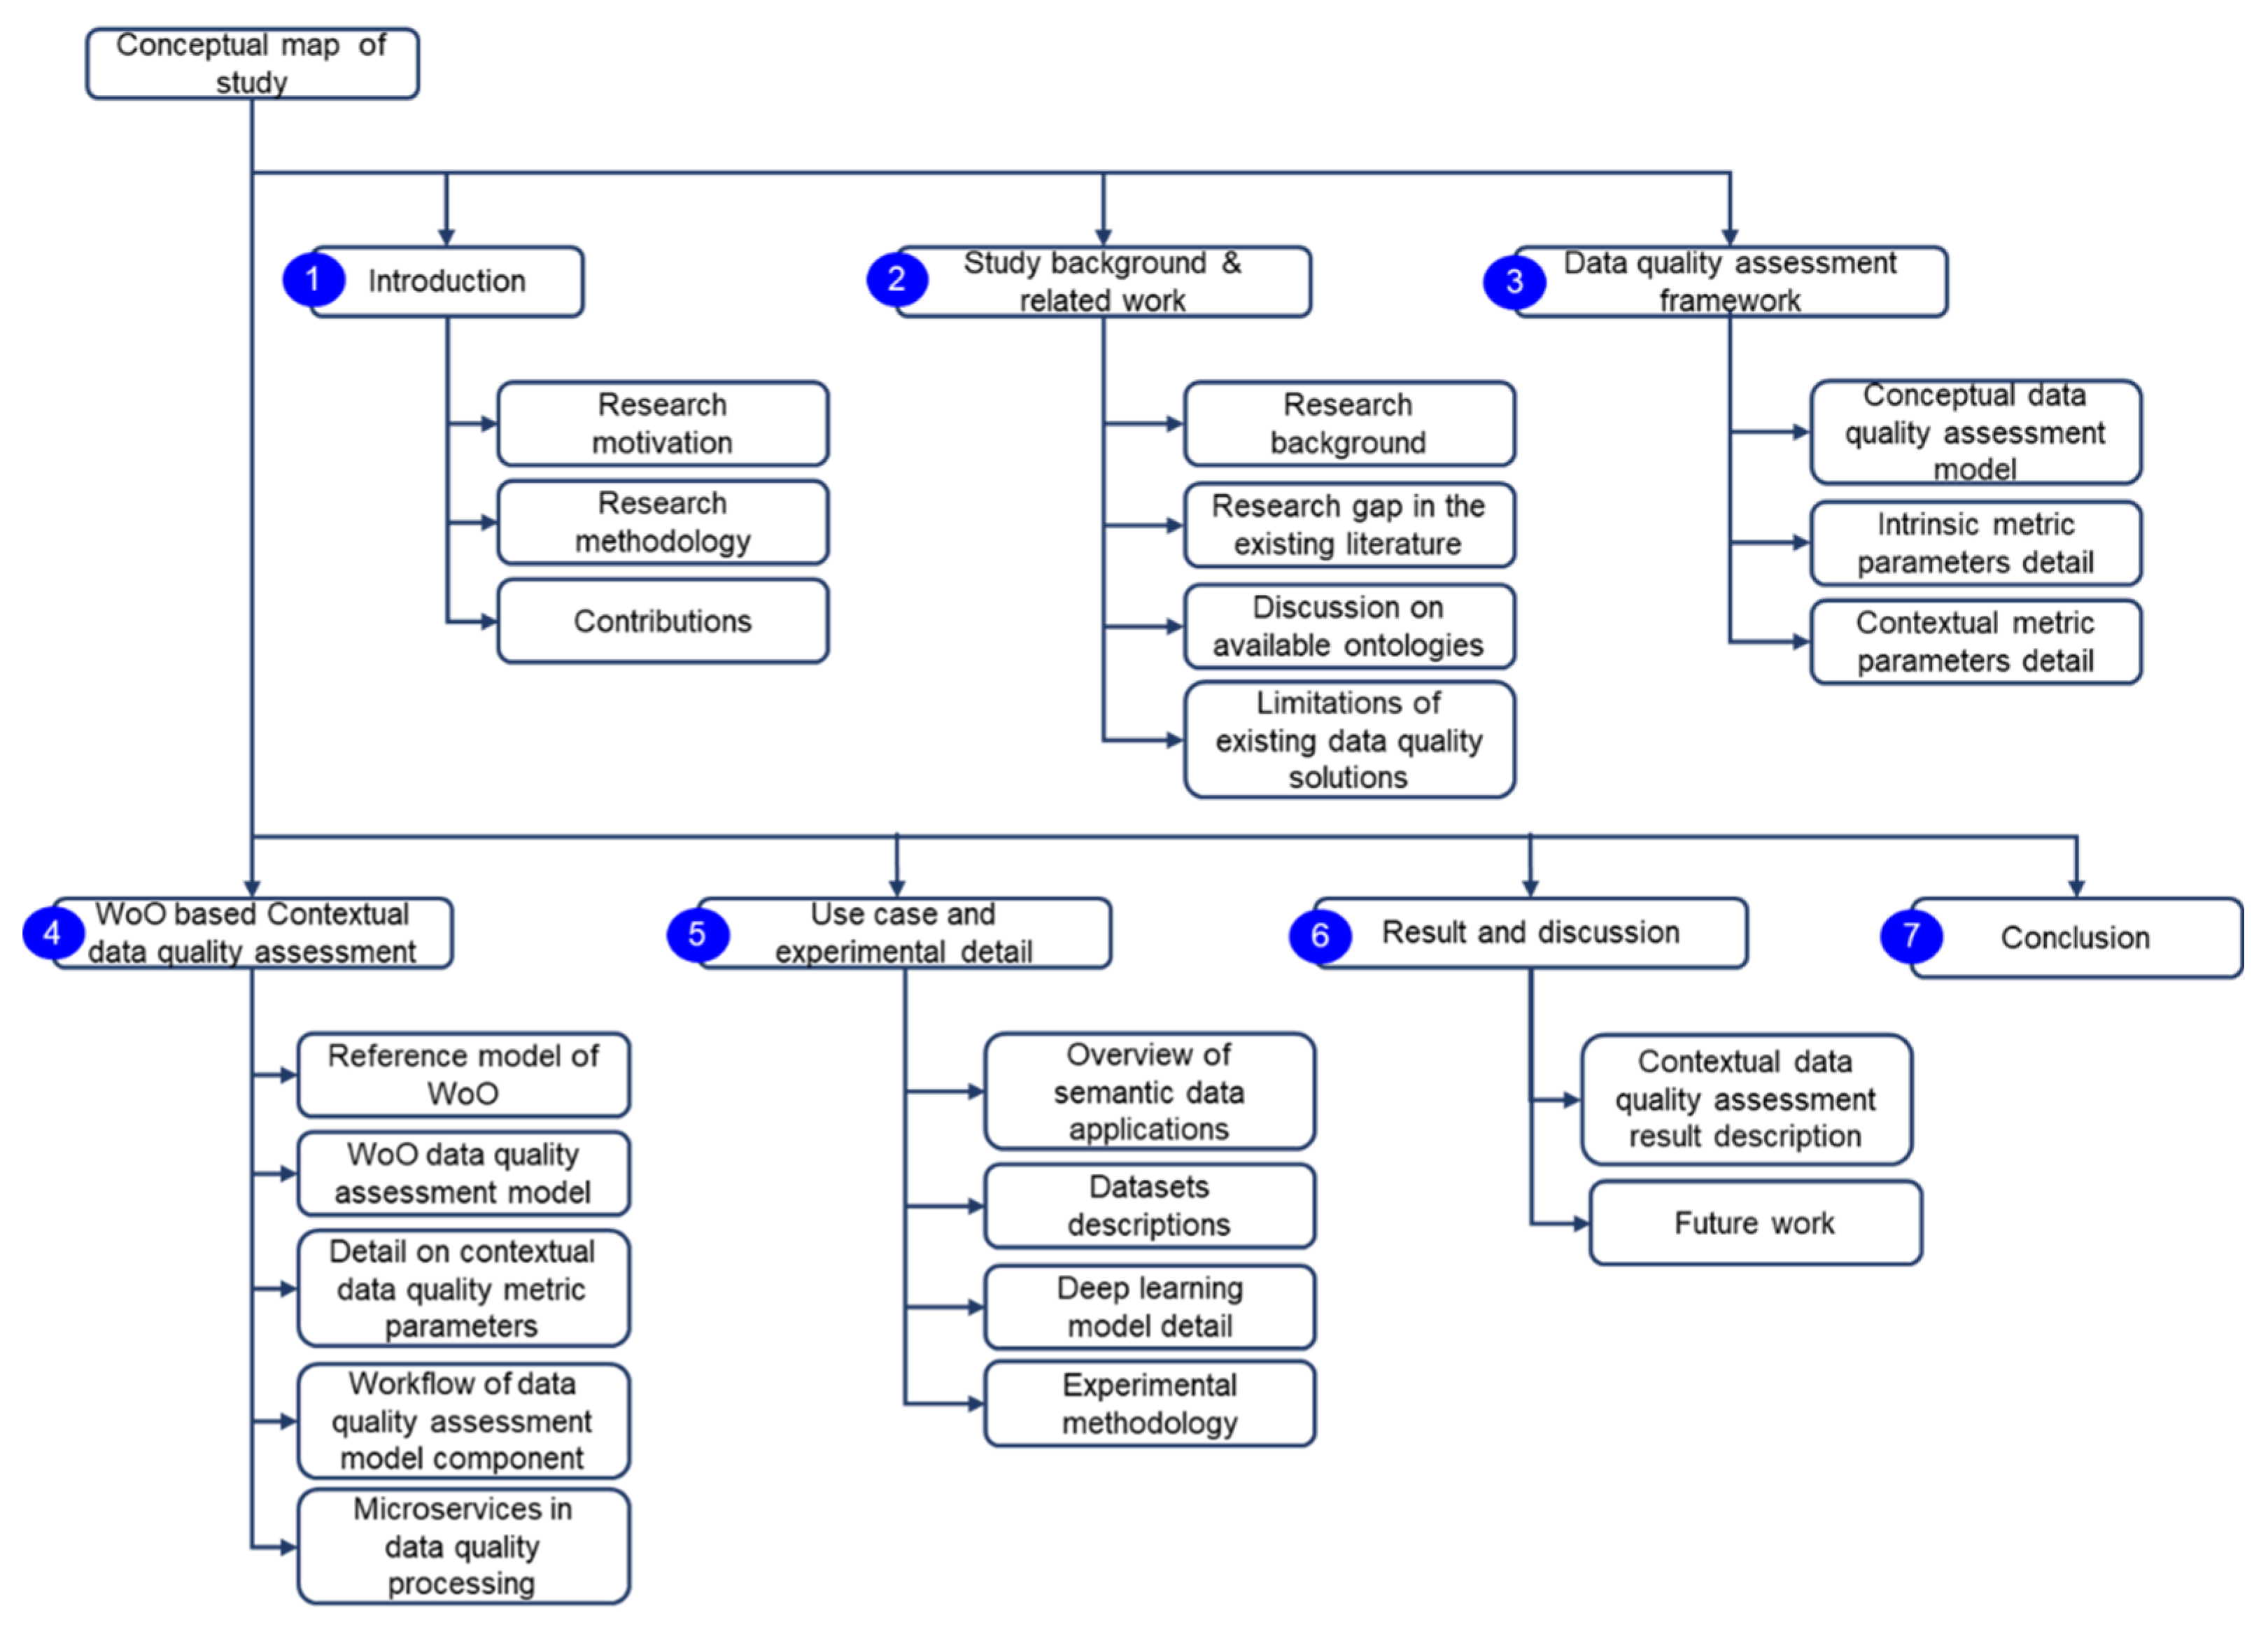
The conceptual map of this study is illustrated in Figure 2. The study background and research gap are covered in Section 2; the conceptual framework of data quality assessment and intrinsic and contextual metric parameters are covered in Section 3; WoO based contextual data quality assessment model is discussed in Section 4; use case and experimental model is elaborated in Section 5; Results, future work, and conclusion have been covered in Section 6 and Section 7 respectively.

2. Background and Related Work

As in our daily life, we assess objects in the real-world based on some attributes and do the comparison in order to use them for a specific purpose. Similarly, in the data quality literature, the data is assessed based on data metadata and properties. These data attributes are called data quality dimensions, which are used to measure the quality of data [15,24,25]. The measurement procedure of these data quality dimensions is called data quality metrics or indicators [15,25]. The assessment of data quality is very crucial when it comes to choose one dataset over the other or rank the dataset for specific information need and application context [26,27,28]. The data quality assessment is performed based on the metrics, and these have been classified into four categories such as intrinsic, contextual, representational and accessibility [29,30,31]. In the literature, the existing data quality frameworks perform data quality assessment using metrics. However, the acquisition level data quality measurement in terms of security, privacy, and retrieval efficiency, etc., have not given much attention [30,32].
In articles [19,33], the authors have discussed the data quality analytics frameworks to assess the quality of data received from the physiological sensors. These frameworks support data quality assessment based on the data quality metrics and rules. Both frameworks do not support data acquisition and contextual level data quality analytics. In most of the literature, the data quality accuracy metric has been widely focused [34]. Such as in the article [35], authors analyze the multivariate anomalies with principal component analysis and compute the accuracy of the healthcare dataset that contain the vital sign of patients who were admitted in the intensive care unit. To predict the mortality and length of staying in the hospital various benchmarking deep learning models have been applied and evaluated based on the model accuracy [36]. The data quality is also important in the situation where the decisions are taken based on the machine learning model results. In order to measure the quality of training data for machine learning models, an incremental data quality validation framework has been discussed [37]. This framework validates the quality of data with dynamic rules and constraints in terms of accuracy, consistency, and completeness.
To analyze the quality of sensor data deployed in the sea, the ensemble machine learning classification framework has been designed [38]. In which the few samples of sensors data have been analyzed in the data quality assessment classifier. Authors [38] have used cluster sampling and believe that this sampling method can better represent the distribution of a dataset. The ensemble framework used in this research article is only able to classify data quality qualitatively without any context. However, our data quality assessment mechanism classifies the quality of data quantitatively in the application context.
To perform enterprise data quality assessment, Gürdür et al. [39] have discussed a six step methodology that focuses on the identification of most relevant data quality metrics. The six step includes identification of stakeholder that will be involved in the data quality assessment process, extraction of data quality requirements, identification of relevant metrics and rules, querying data, visualization, and improvement of data. The research gap in article [39] is the focus on data quality assessment based on metrics which are not sufficient for the contextual data quality; however, our proposed model supports deep learning and semantic ontology based data quality assessment methodology. To analyze data quality of the healthcare data, authors [40] developed the data quality knowledge repositories; that contain the characteristics of data quality rules. These rules have been used to measure the quality of healthcare data. The concepts of data quality rules in the knowledge repositories have been represented with the Dublin Core Metadata standard.
The data quality has an impact on contextual services and applications. Sundararaman et al. [41] proposed a framework to link data quality with the business outcome. Authors [41] indicate data quality metrics as factors of data quality and have shown the correlation between the data quality factors and the impact on the business outcome. The data quality is measured with its relevance factors such as weight and the business impact. In the evaluation of this framework, a survey questionnaire filled by the domain experts has been used. To conduct this survey the authors defined a hypothesis that “there is a direct relation between business outcomes and data quality factors”. To know the impact of data quality in the business process, a runtime data quality verification mechanism has been discussed [42]. This mechanism checks data quality in two aspects that the business process completed well with the provided data and whether the completed process affect the stored data negatively.
To model data quality assessment various ontologies have been developed in the past. The popular data quality ontologies include W3C data quality ontology, the quality model ontology, evaluation results ontology, and the dataset quality ontology [43,44,45,46]. We developed WoO VOs/CVOs ontologies to acquire the relevant data for the services and tasks and then perform the contextual data quality analytics on individual and aggregated data. Currently to perform data quality analytics various open source and commercial solutions are available. Among them, IBM infoSphere information analyzer, Uniserv data quality scorecard, Talend for data quality analysis, and Collibra data governance and data quality solutions have been widely discussed in the literature [47,48,49,50]. Among them, only Talend supports data quality analytics with machine learning and other tools follow the rule-based approach. All these tools do not support metric parameters based data quality assessment for individual and aggregated data in the application context; however, our proposed model supports contextual data quality assessment with deep learning models and semantic ontologies.

3. A New Framework to Assess a Data Quality

3.1. Data Quality Assessment Model

The data quality assessment model fosters scalable and modular services to analyze the contextual quality of data by using semantic ontologies and deep learning models. These services process a huge amount of incoming healthcare data and support efficient data processing. The tasks in the proposed data quality assessment model have been designed as scalable and distributed into modular and robust components by following the microservices pattern. The proposed data quality assessment model functions have been distributed into three layers such as the data acquisition, data quality assessment, and data quality service layer functions. In the proposed model each layer has its specialized functionality which handles the quality of heterogeneous data. The proposed data quality assessment model is shown in Figure 3.

3.1.1. Data Acquisition Layer Functions

Data acquisition layer functions support assessing the data quality with respect to access and representational categories of metric parameters. The data acquisition level functions support data quality assessment during the data collection, transformations, storage, and retrieval. The data quality assessment is performed, according to domain-specific business rules, applications specific dataset attributes, and the requirements of applications. The required data has been collected from all the healthcare data sources and transformed in the RDF/XML data model by using dataset ontology tuples and encoded to handle data privacy. Among these collected data only the required data attributes or data tuples with respect to application needs and requirements have been further analyzed and represented with data attributes templates. The data acquisition layer provides a separate dataset ontology repository to analyze semantic data quality retrieval and storage efficiency. This ontology model contains metadata that shows how to compute the datasets quality metrics and to choose data quality assessment scale etc.

3.1.2. Data Quality Assessment Layer Functions

To measure the quality of various types of data such as critical, non-critical, new data, and old data, we need different types of data quality assessment functions. These functions should be context-dependent and based on application requirements. For example, we need separate data quality assessment functionality for recently sensing devices or appliance so that its quality could be analyzed and issues in the data could be rectified at the earlier stage. For health status forecasting services sometimes, we need single type of data and at another time we need multiple types of data, therefore we need to assess the quality of data as individual and combined. The individual assessment function provides the mechanism to assess the quality of data of each required data attribute (VOs) separately. Another capability of this function is that the individual data quality assessment can be applied standalone or it can be used collectively with periodic and ongoing data quality assessment functions. In the individual data quality assessment function, the data from multiple sources have not been harmonized or integrated. Where each dataset attribute will be analyzed separately with a single data quality metric.
Another type of assessment is the aggregated data assessment. In which the incoming data from heterogeneous sources (i.e., combination of VOs) have been used in a single service, then the service required the aggregated data quality assessment. The assessment model enables aggregated data quality assessment learning capability. In this type of assessment, good- or poor-quality data received from a single source may affect the overall assessment results. For example, as shown in Figure 4, the data source A and B have different dataset attributes and data quality metric parameters. The data attribute one and two have been harmonized as single data based on the domain data quality analytics rule and service requirement. After the harmonization of data attributes from source A, the data quality metric patterns have been inserted for the model to learn the metric parameters. The model will learn the metric pattern for integrated data based on the already trained deep learning weights. The model’s learning results for source A dataset attributes will be normalized in the final aggregated data quality results. A similar process has also been taken place for the data source B attributes but with different data quality metric parameters. Finally, the learning results of both models will be combined as an aggregated data quality report.
The periodic assessment function measure data quality after each specific interval. This function assesses the quality of data with respect to various aspects as defined in the application business rule. Those data quality aspects could be based on the application contexts, such as completeness in depth, breadth, density, and accuracy. Another important function of this layer is the ongoing data quality assessment function. The main capability of this function is to ensure the validation of the quality of data received from the critical data sources such as data which are used to monitor patient health conditions in an emergency. This function supports priority checking among the critical data categories. The ongoing data quality assessment function is used in the application context when the quality of data is very crucial.

3.1.3. Data Quality Service Layer Functions

The data quality analytic model provides the functional capability of various contextual data quality services at the service layer. The service layer provides service management functions and new contextual data quality services can be created by composing the microservices with additional features such as new data quality metrics, new data attributes, and new data quality business rules. Furthermore, the service layer supports the evaluation of the contextual quality of services; so that the additional quality analysis features can be deployed. Moreover, this layer supports data quality service API; that could be used to access the services from other applications. All the functional capabilities provided by this layer are knowledge-driven. The knowledge-driven means it uses deep learning models to analyze service quality. The data quality processing cost evaluation function enables to evaluate the data quality assessment processes with a focus on computational time and cost which is used in the previous steps. Based on these evaluation results, the data quality assessment model processes could be optimized. The critical data are more important than the rest of the data in the data quality assessment model. The mechanism of critical data monitoring function focuses on very important data that has been defined as per the healthcare application context.

3.2. Data Quality Assessment Metric Parameters

The assessment of data quality has been categorized into four categories such as intrinsic, contextual, representational, and accessibility [29,31]. The intrinsic and contextual metric have been defined in [29,31], However, there are no clearly defined parameters that how to measure these metrics parameters. We extend the categories of data quality classification metrics with parameters in order to analyze the data quality of WoO based healthcare semantic data applications. We used these extended data quality metric parameters with our defined data quality assessment model in Section 3.1.

3.2.1. Intrinsic Metric Parameters

Intrinsic means essential and naturally. The intrinsic category of data quality is concerned with the actual values of data regardless of the context or data elements. We used intrinsic metric parameters over the VOs data where each VOs data has been analyzed individually with respect to the intrinsic features. This category is about data itself and mainly deals with the originality of data or raw data. The data quality metrics and assessment parameters are shown in Figure 5.
The metrics of this category include believability, accuracy, objectivity, and reputation. The believability can be defined as the incoming data that has been considered as accepted or regarded as true, real, and credible. The parameters to measure this metric include temporal antecedent (not in sequence) and mismatch data. For example, the incoming data of vital signs are out of defined range then its believability will be reduced. Another important metric parameter of the intrinsic category is accuracy. The accuracy metric shows that the ground truth or real-world events have been captured, presented and described without any errors. The accuracy metric can be detected with many parameters such as missing data, out of range values, out of date data, the values in the wrong field, and the temporal difference between the data generated and collected.
The intrinsic data quality deals that how the data has been harvested. Whether the required protocols have been followed during the sensing and collection. To deal with this type of quality aspect the objectivity metric parameters have been defined. The parameters include the invalid mean of data instance and imprecise data. The data collected with wrong procedures would have invalid mean and it contains data with wrong precision. In the intrinsic data quality, even though the accuracy of the data is high, the received data is not from reliable sources and so this data cannot be used in services such as secondary data in the healthcare research. The data quality reputation deals with this kind of data quality aspect. There are two metric parameters for this data quality aspect. The data source and malicious data. The malicious data is a type of data that has been manipulated or some invalid information added through the unauthorized activity.

3.2.2. Contextual Metric Parameters

The contextual category of data quality is related with respect to the data components in a certain context (e.g., completeness, timeliness, and consistency). Moreover, the data quality aspects in this category are associated to a certain context and specific usage. It may be affected by usage characteristics such as the task, the organizational domain, and the timing of usage, etc. We proposed and used contextual data quality metric parameters over the CVOs data, where the application data from VOs have been aggregated in the application context. The metric parameters in this category are shown in Figure 6.
The value-added metric focuses that if we use this type of data in the current context will it affect application quality positively or negatively. Mainly, value added analytics focuses on whether there are any advantages to use this data for the task in hand. The metric parameters include inefficiency in data usage, number of missing and unusable and duplicate data. If the data has been purchased and is not used or not usable in the context of an application, it will reduce the value of the data for this task. Another important contextual metric is data relevancy. The relevancy aspect of data quality is concerned that whether the available or incoming data can be helpful to resolve the task or fulfill service requirements. In the WoO enabled semantic data application the relevancy emphasis that which VOs are more relevant to the CVOs in the context when more than one similar VOs are available. The metric parameters for this metric include missing relevant terms, missing domain data and object properties and limited coverage. To identify the freshness of data for the task in hand or CVOs, the timeliness metric parameters have been used for WoO enabled applications data quality analytics. Timeliness can be measured with the difference between the last update to the current value and it can also be analyzed based on the age of data. The timeliness metric considers that there should be consistency in the arrival of data for the tasks’ processing by the CVOs.
In order to find out the completeness aspect of data quality, the parameters for the completeness have been proposed. It includes missing values in the not nullable attributes, missing attributes (e.g., metadata), and data instances in the wrong fields. Moreover, to measure the completeness metric parameters, the temporal window size must be defined in order to measure the completeness in a specific context (i.e., CVO) that the percentage of data is complete during this time. There is one more similar metric parameter like completeness that is known as the appropriate amount of data. This metric focus that how much data is available for the task such as prediction and classification. The parameters for this metric include the non-availability of enough data to predict and missing data density.

4. Web of Objects Based Contextual Data Quality Assessment Model

4.1. Web of Objects Model

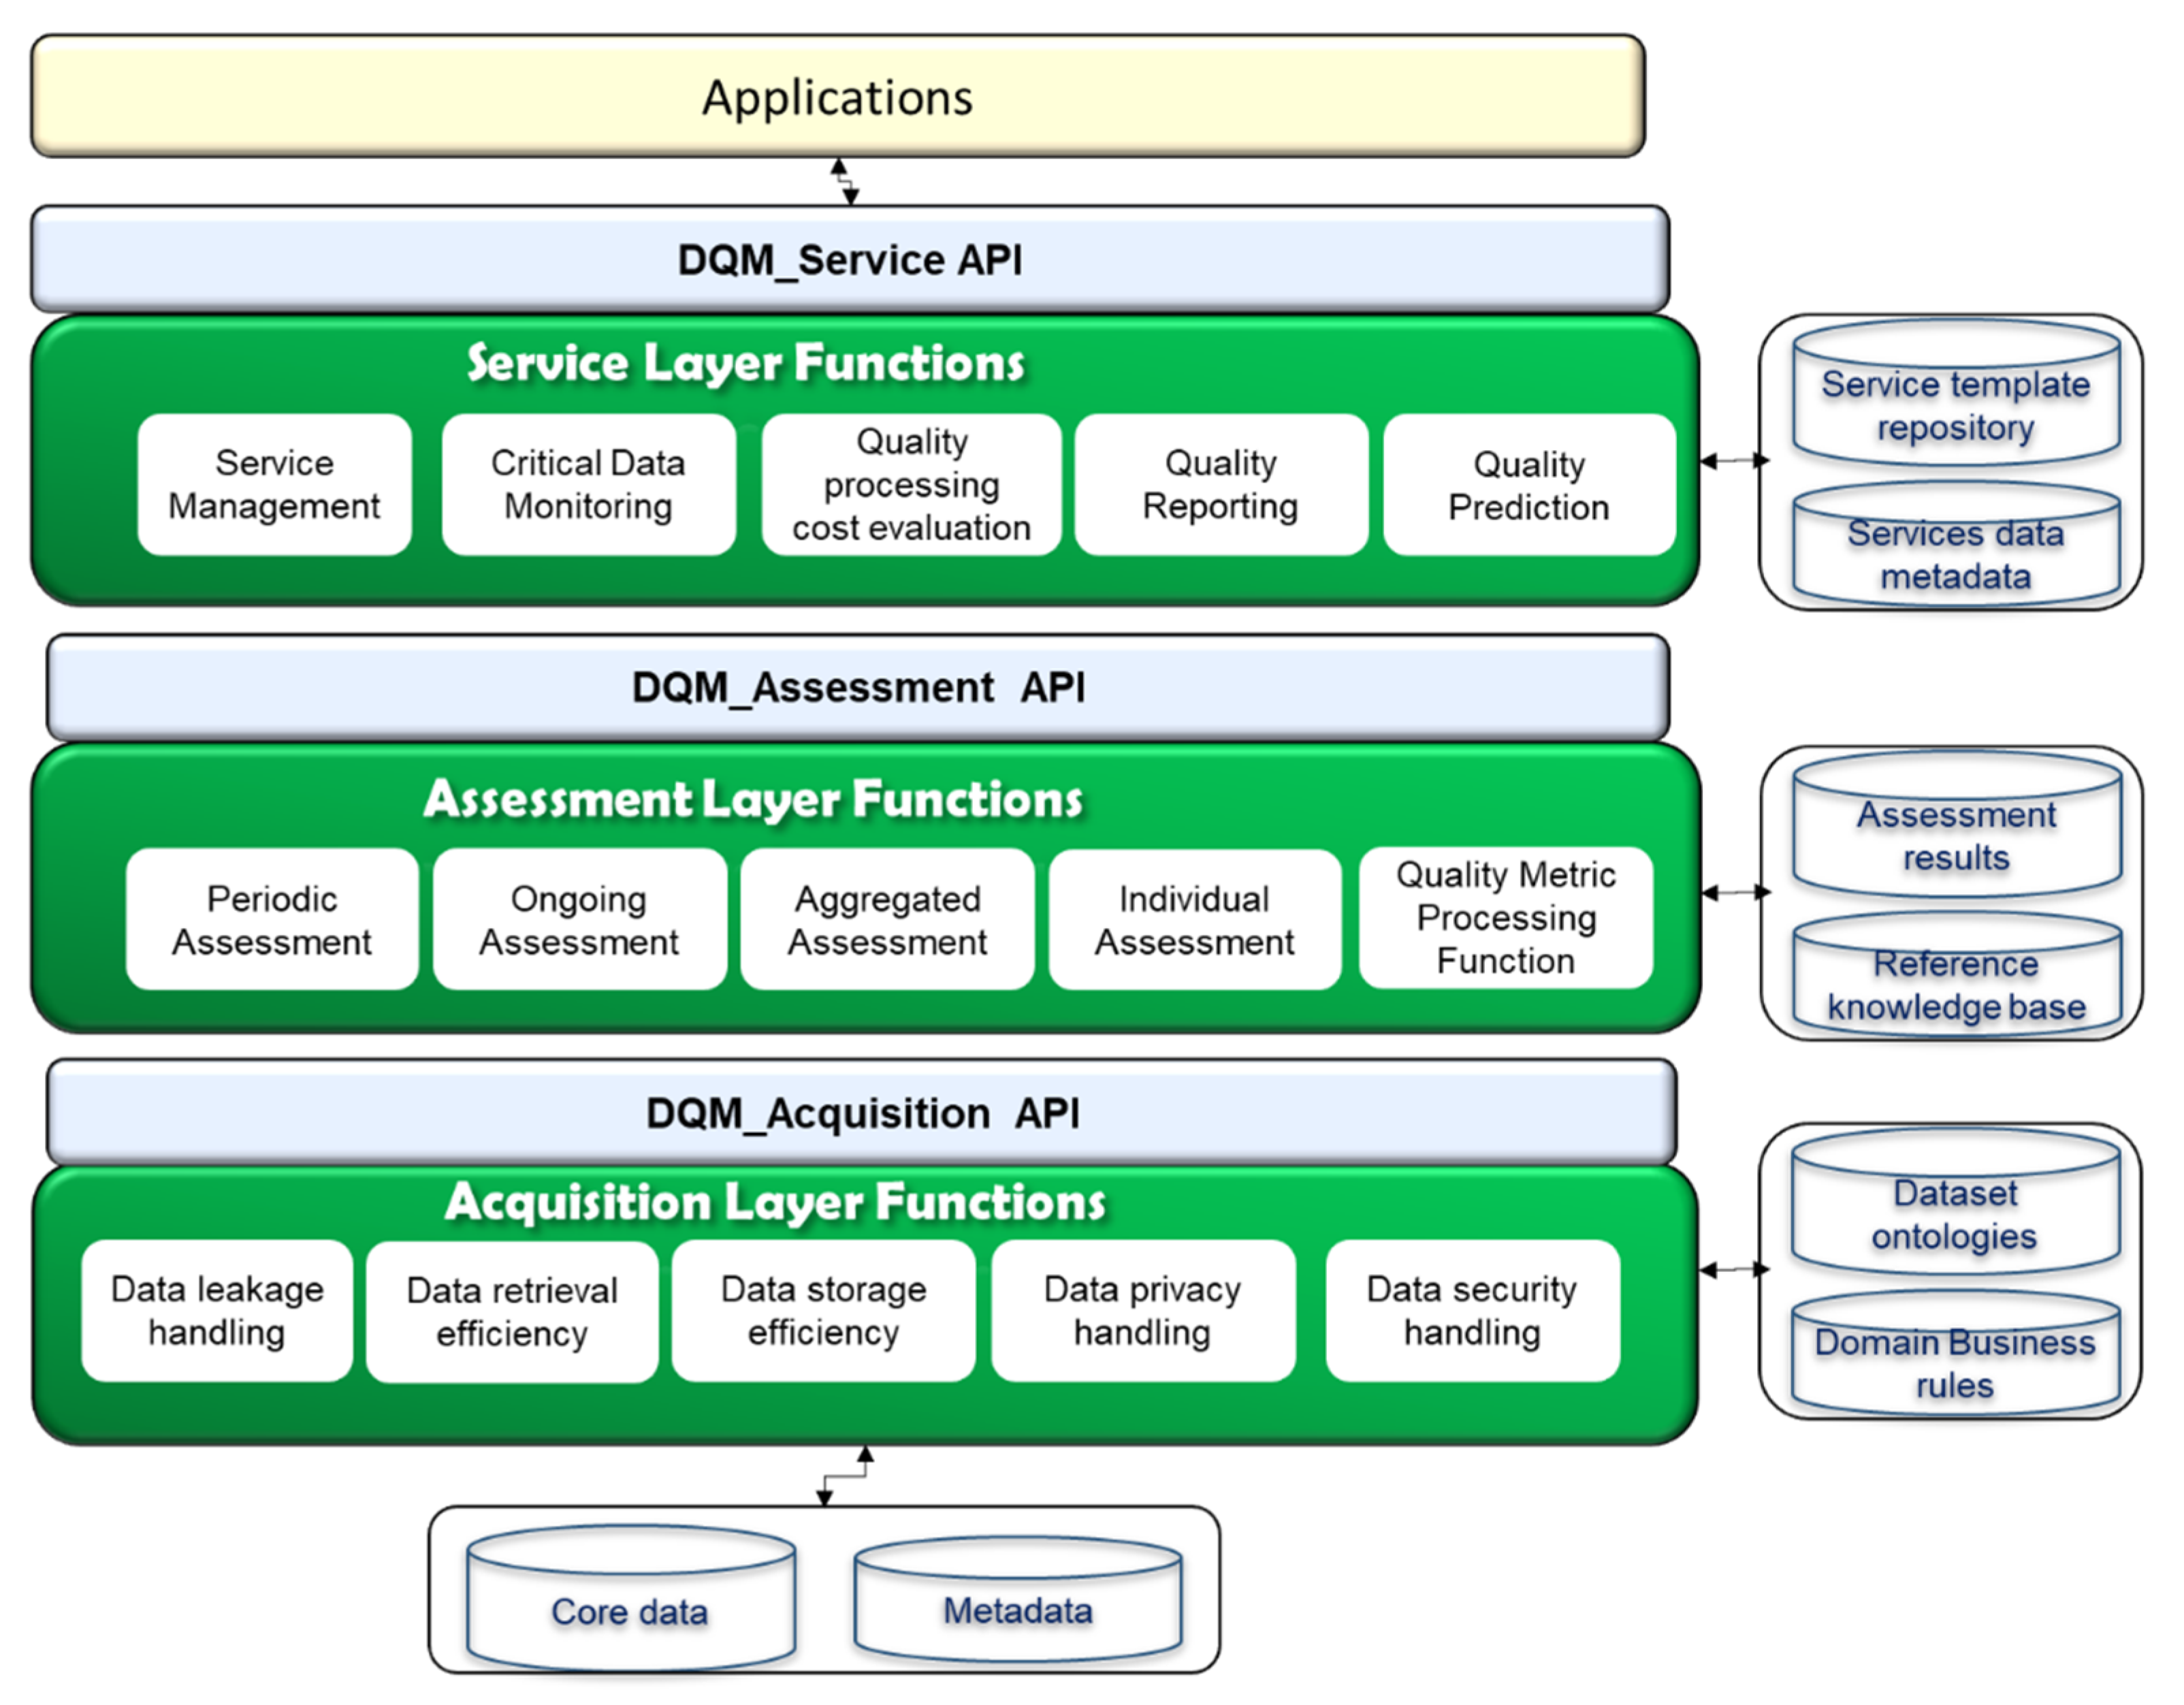
The WoO foster an efficient and simple service provisioning platform that processes the data for the provision of high quality healthcare services [51]. The Virtual Object (VO) and Composite Virtual Object (CVO) are the two building blocks of the WoO platform, that harmonize the real-world objects, by using semantic ontologies for connecting, interpreting, and sharing of data among various services [
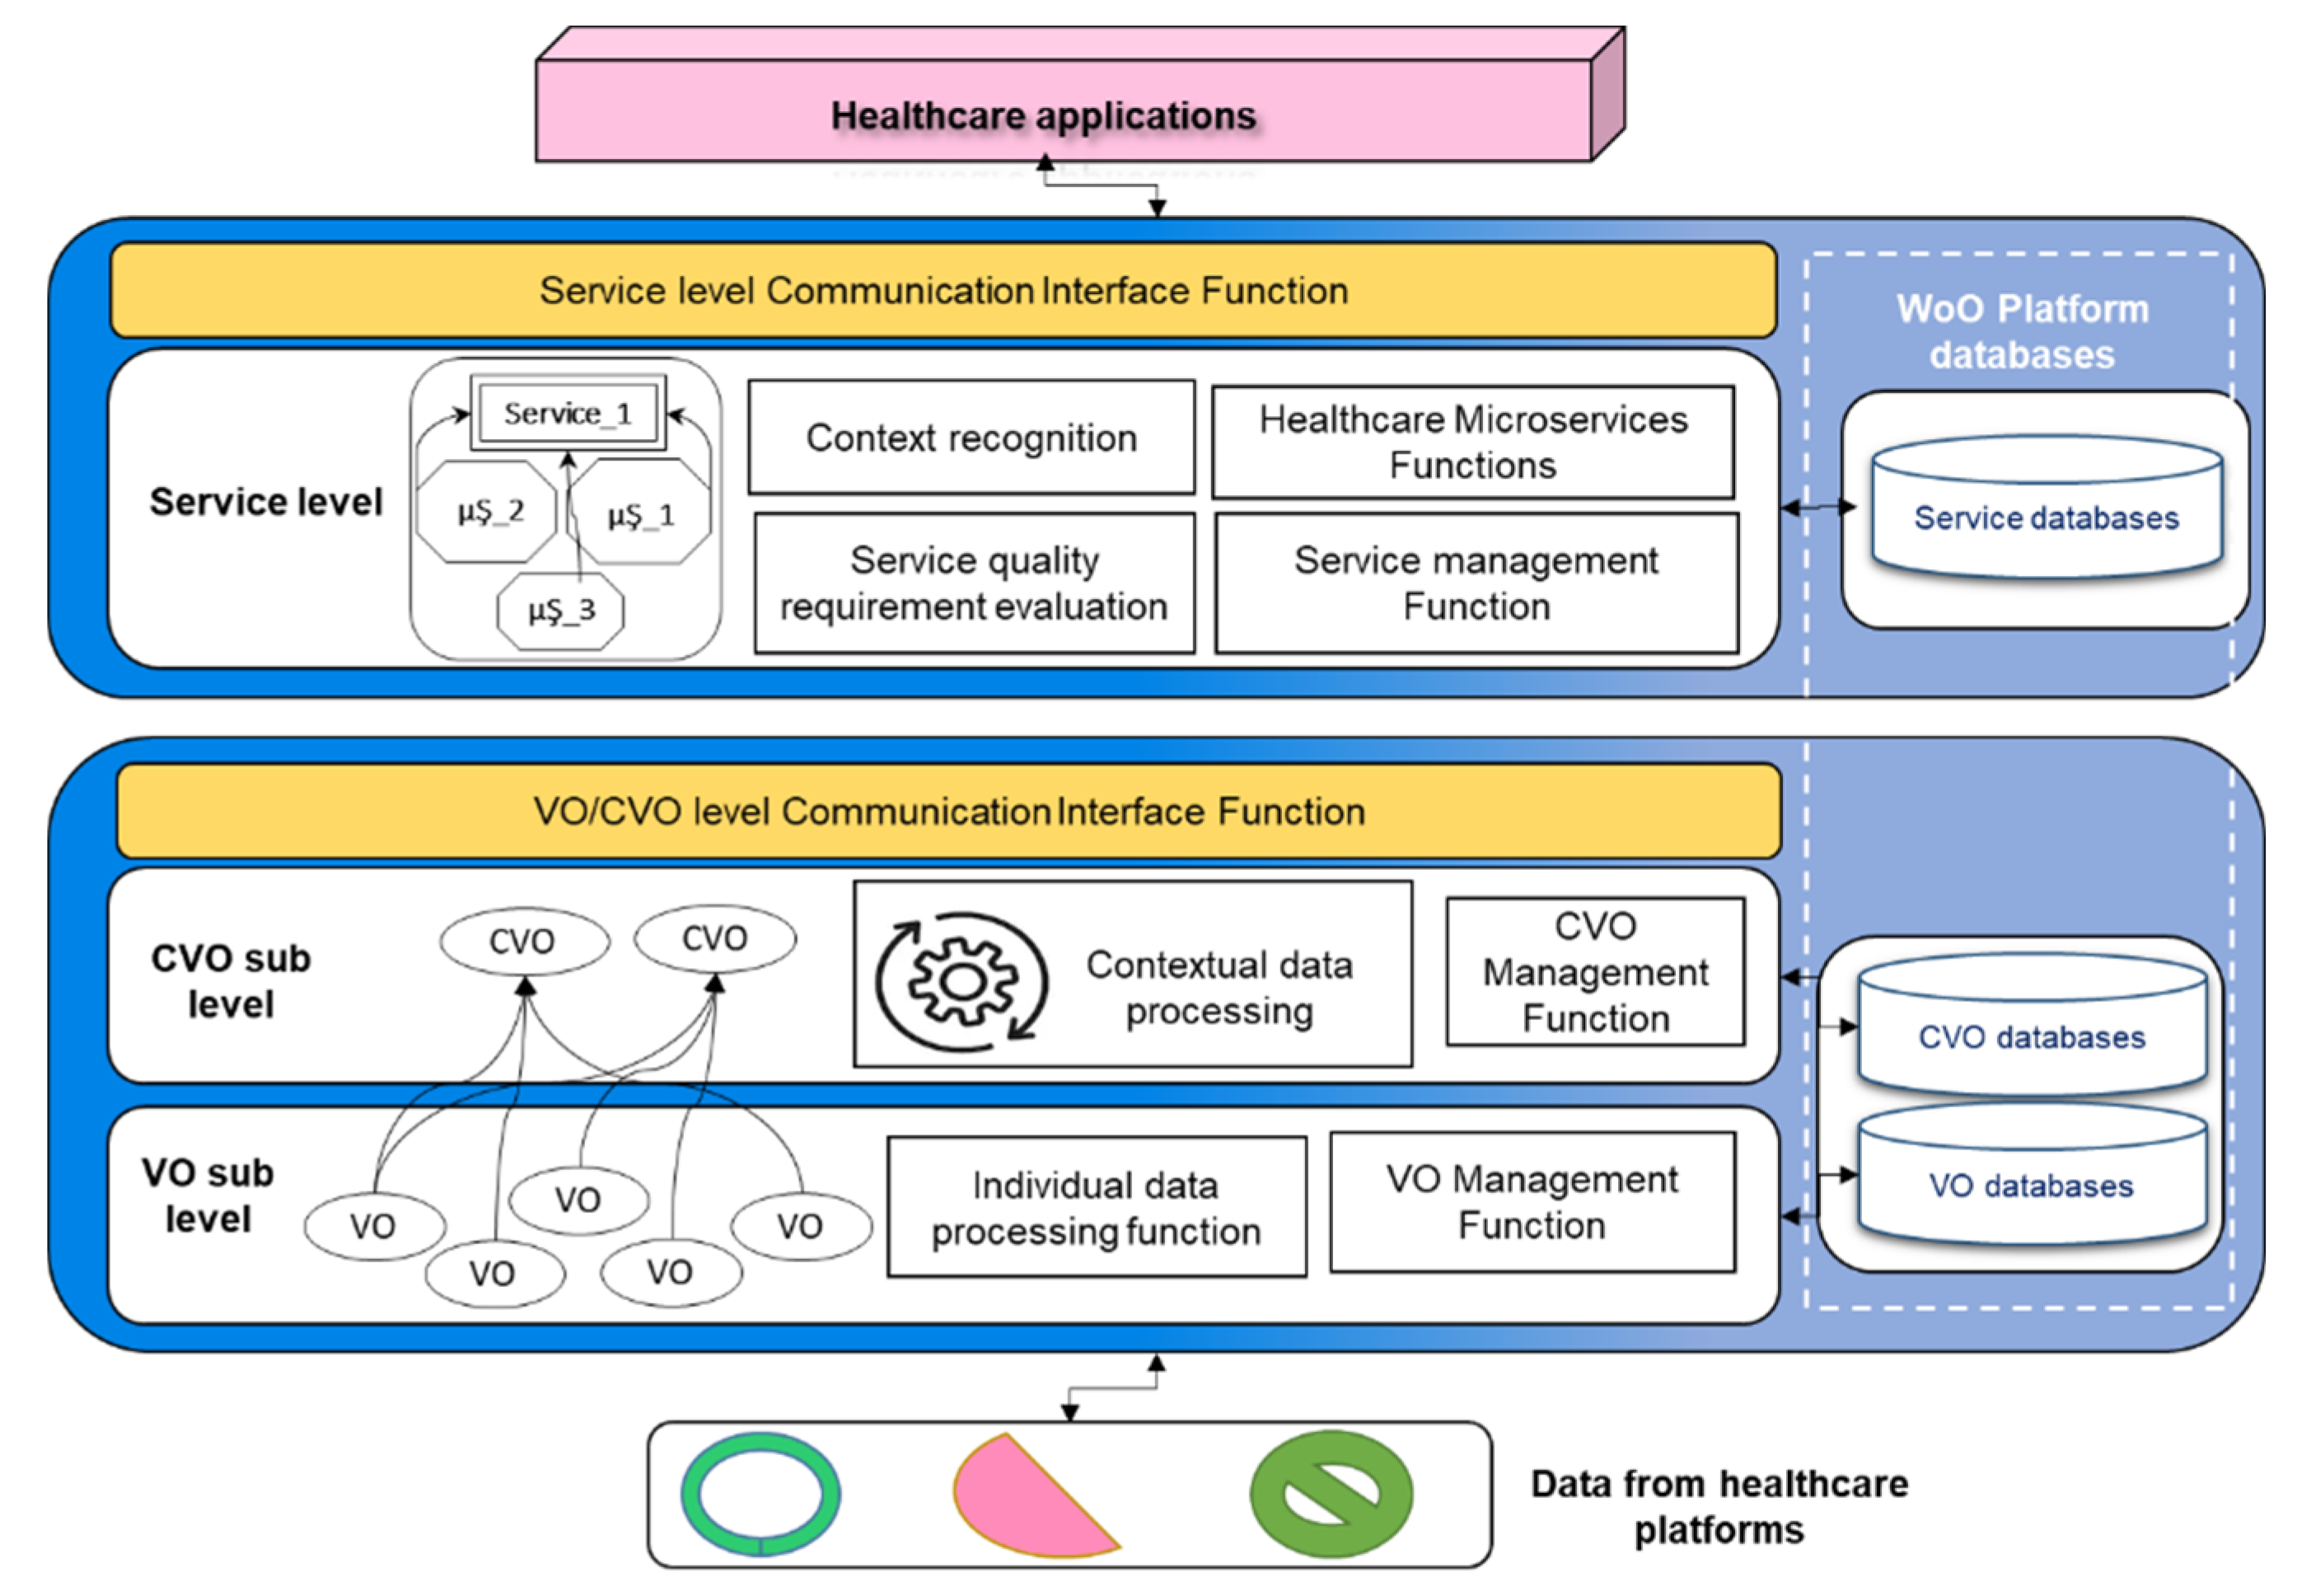
52]. The functional model of the web of objects (ITU-T Y.4452) [51] with additional functions for data quality assessment is shown in Figure 7.
In order to foster data quality processing and the requirement of business context independently, the VO layer functions have been designed. The WoO functional model’s VO layer is used to represent and virtualize the semantic data attributes and quality metrics. The VO/CVO layer is also used to virtualize the real-world objects and provide a communication interface to the data quality assessment model in order to receive data quality requirements and process it accordingly. In a real-world implementation scenario it may be possible that different functions could be deployed on different machines in the cloud. The CVO layer has been proposed to apply data quality business rules and to select data attributes in the form of VOs; because the CVO is the mashup of multiple VOs that are composed in a specific context. The semantic rules have been applied over the list of VOs to achieve the functionality of CVO and then the CVO executes the features of services. In WoO, real-world objects and other data objects have been annotated with VOs semantically; in order to create knowledge for the actions on objects. For example, receiving current humidity, temperature, weather update, and the detection of occupancy of persons in the conference room for regulating conference room temperature automatically. To provide high quality services in the healthcare environment, we defined data quality requirements, and types of assessment for each layer of WoO. The intrinsic metric parameters are applied at the VO sub-level because at this level there is no context of the application or task in hand. Each VOs semantic data could be analyzed individually using deep learning models. The contextual metric parameters have been applied at the CVO level, because the CVO composes the VOs data in the context of application and service.

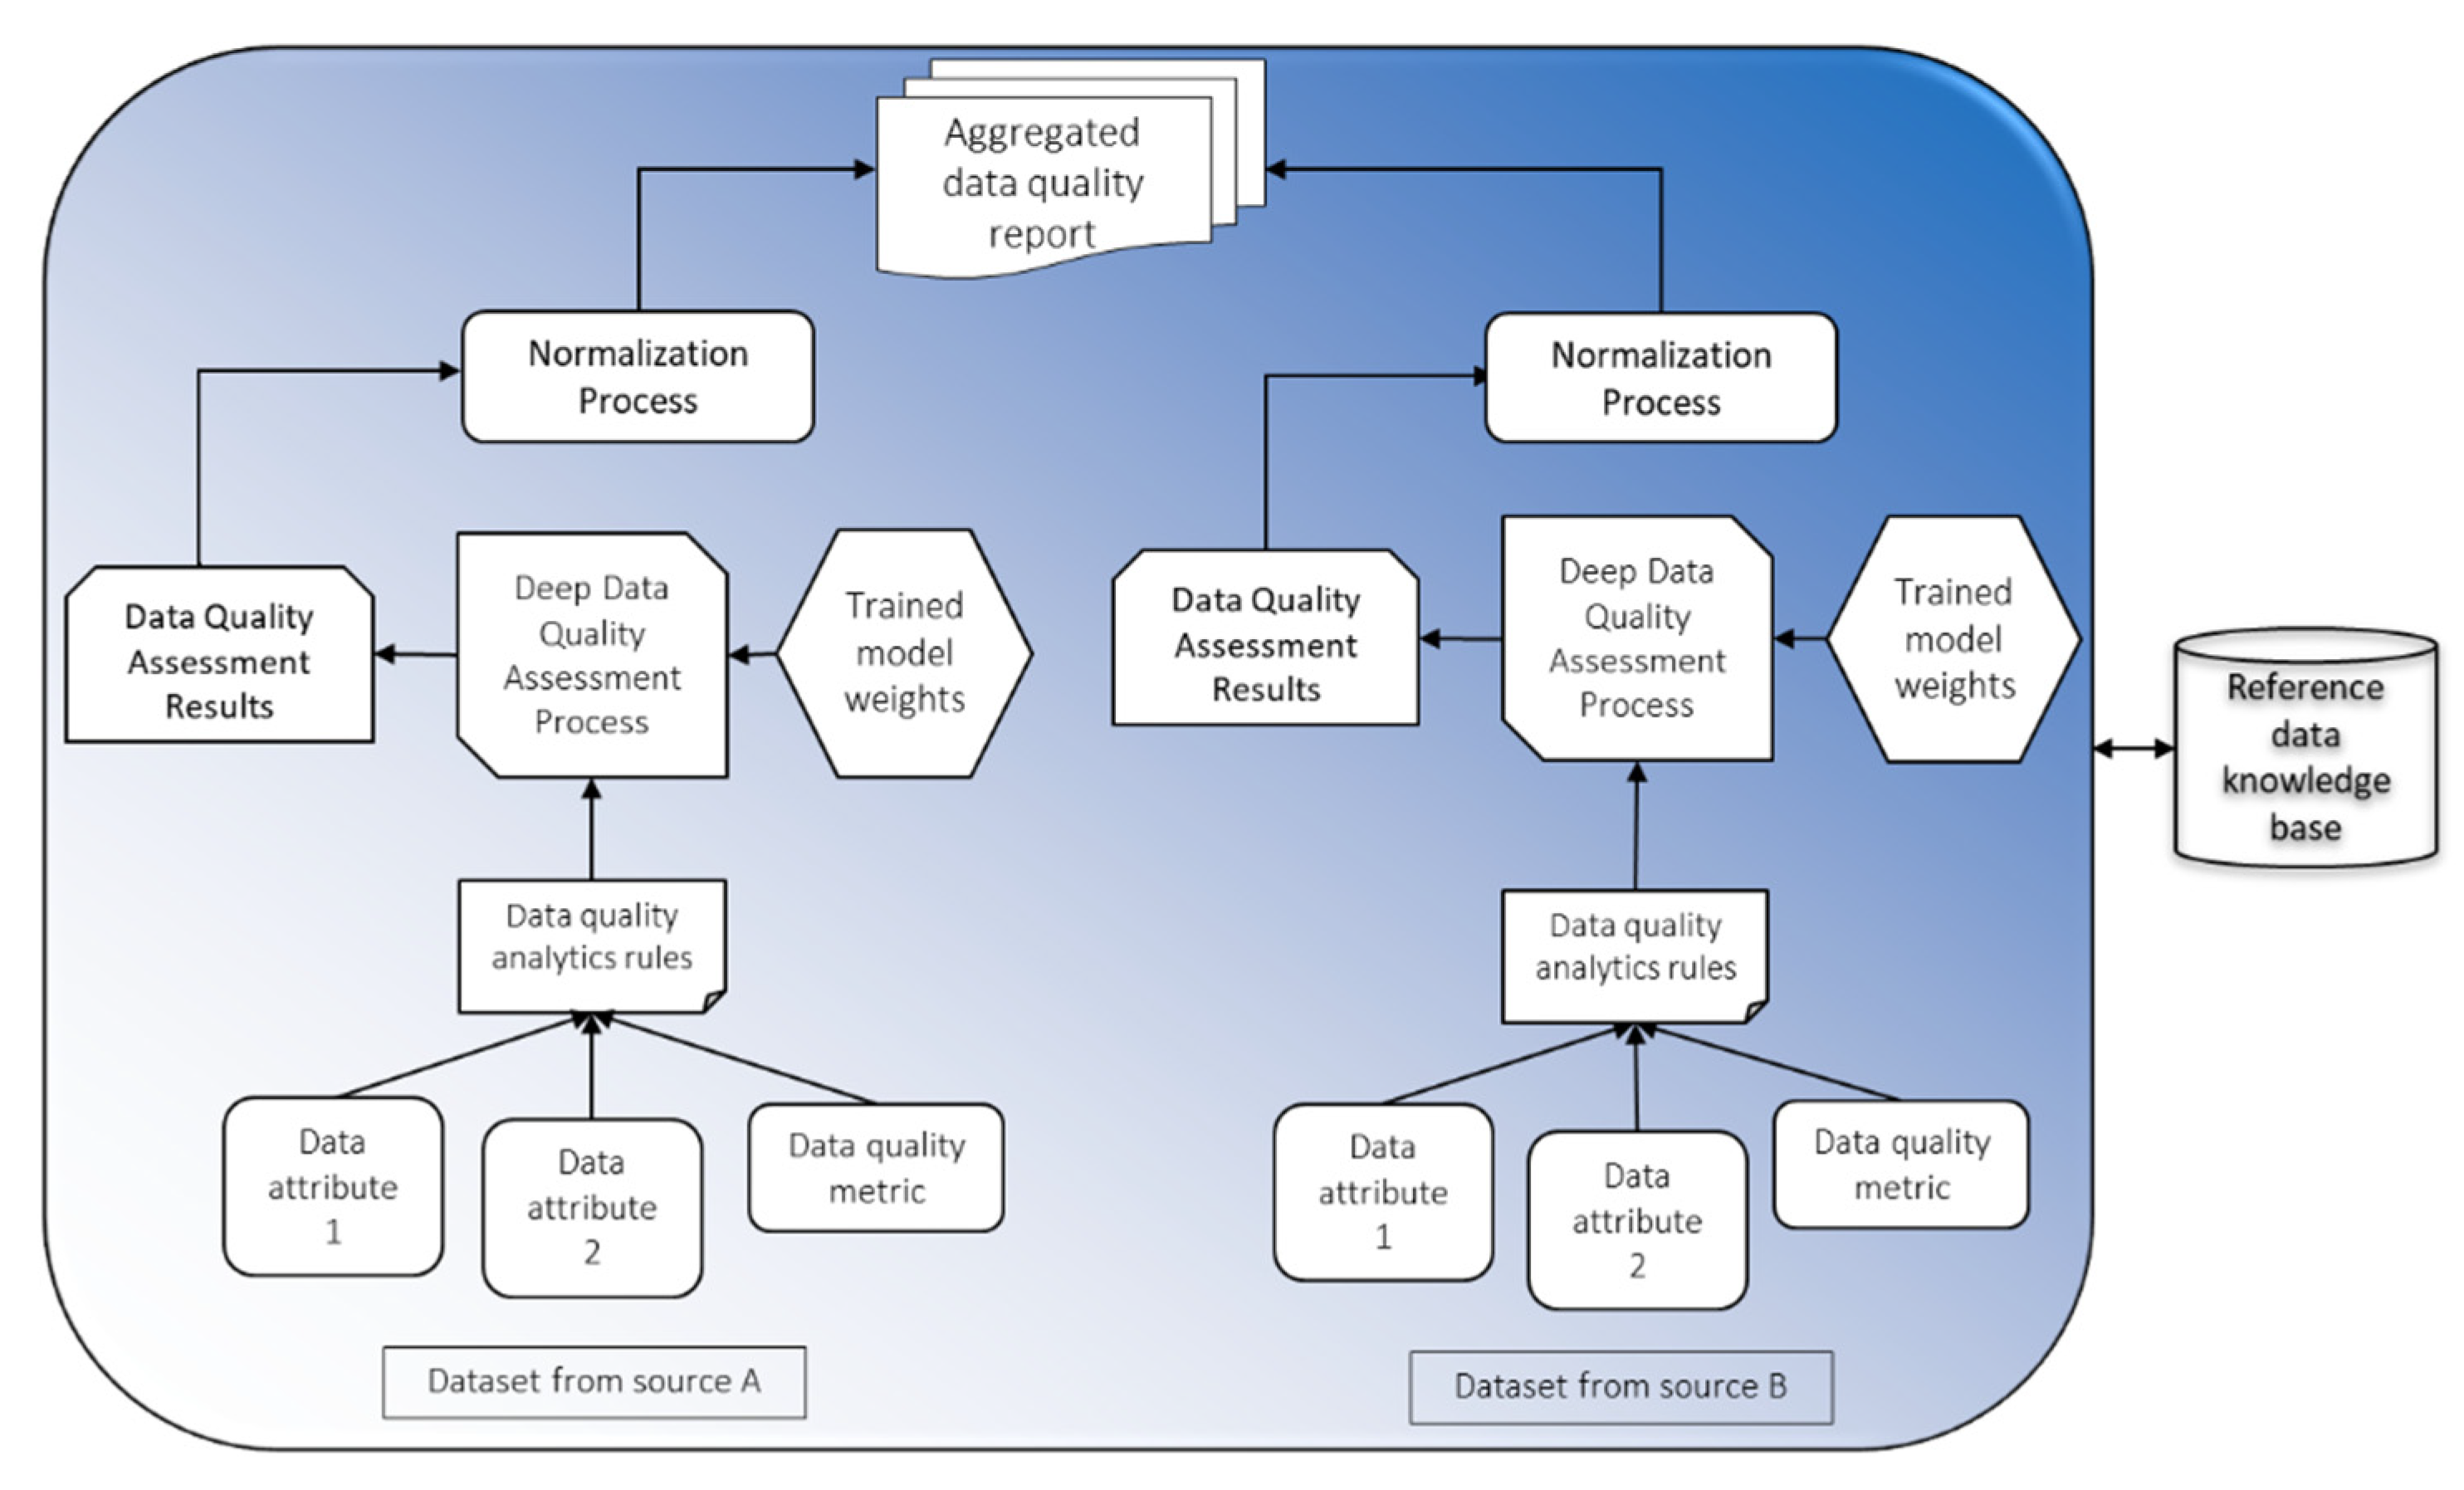
4.2. Web Objects Based Data Quality Assessment for Semantic Data Applications

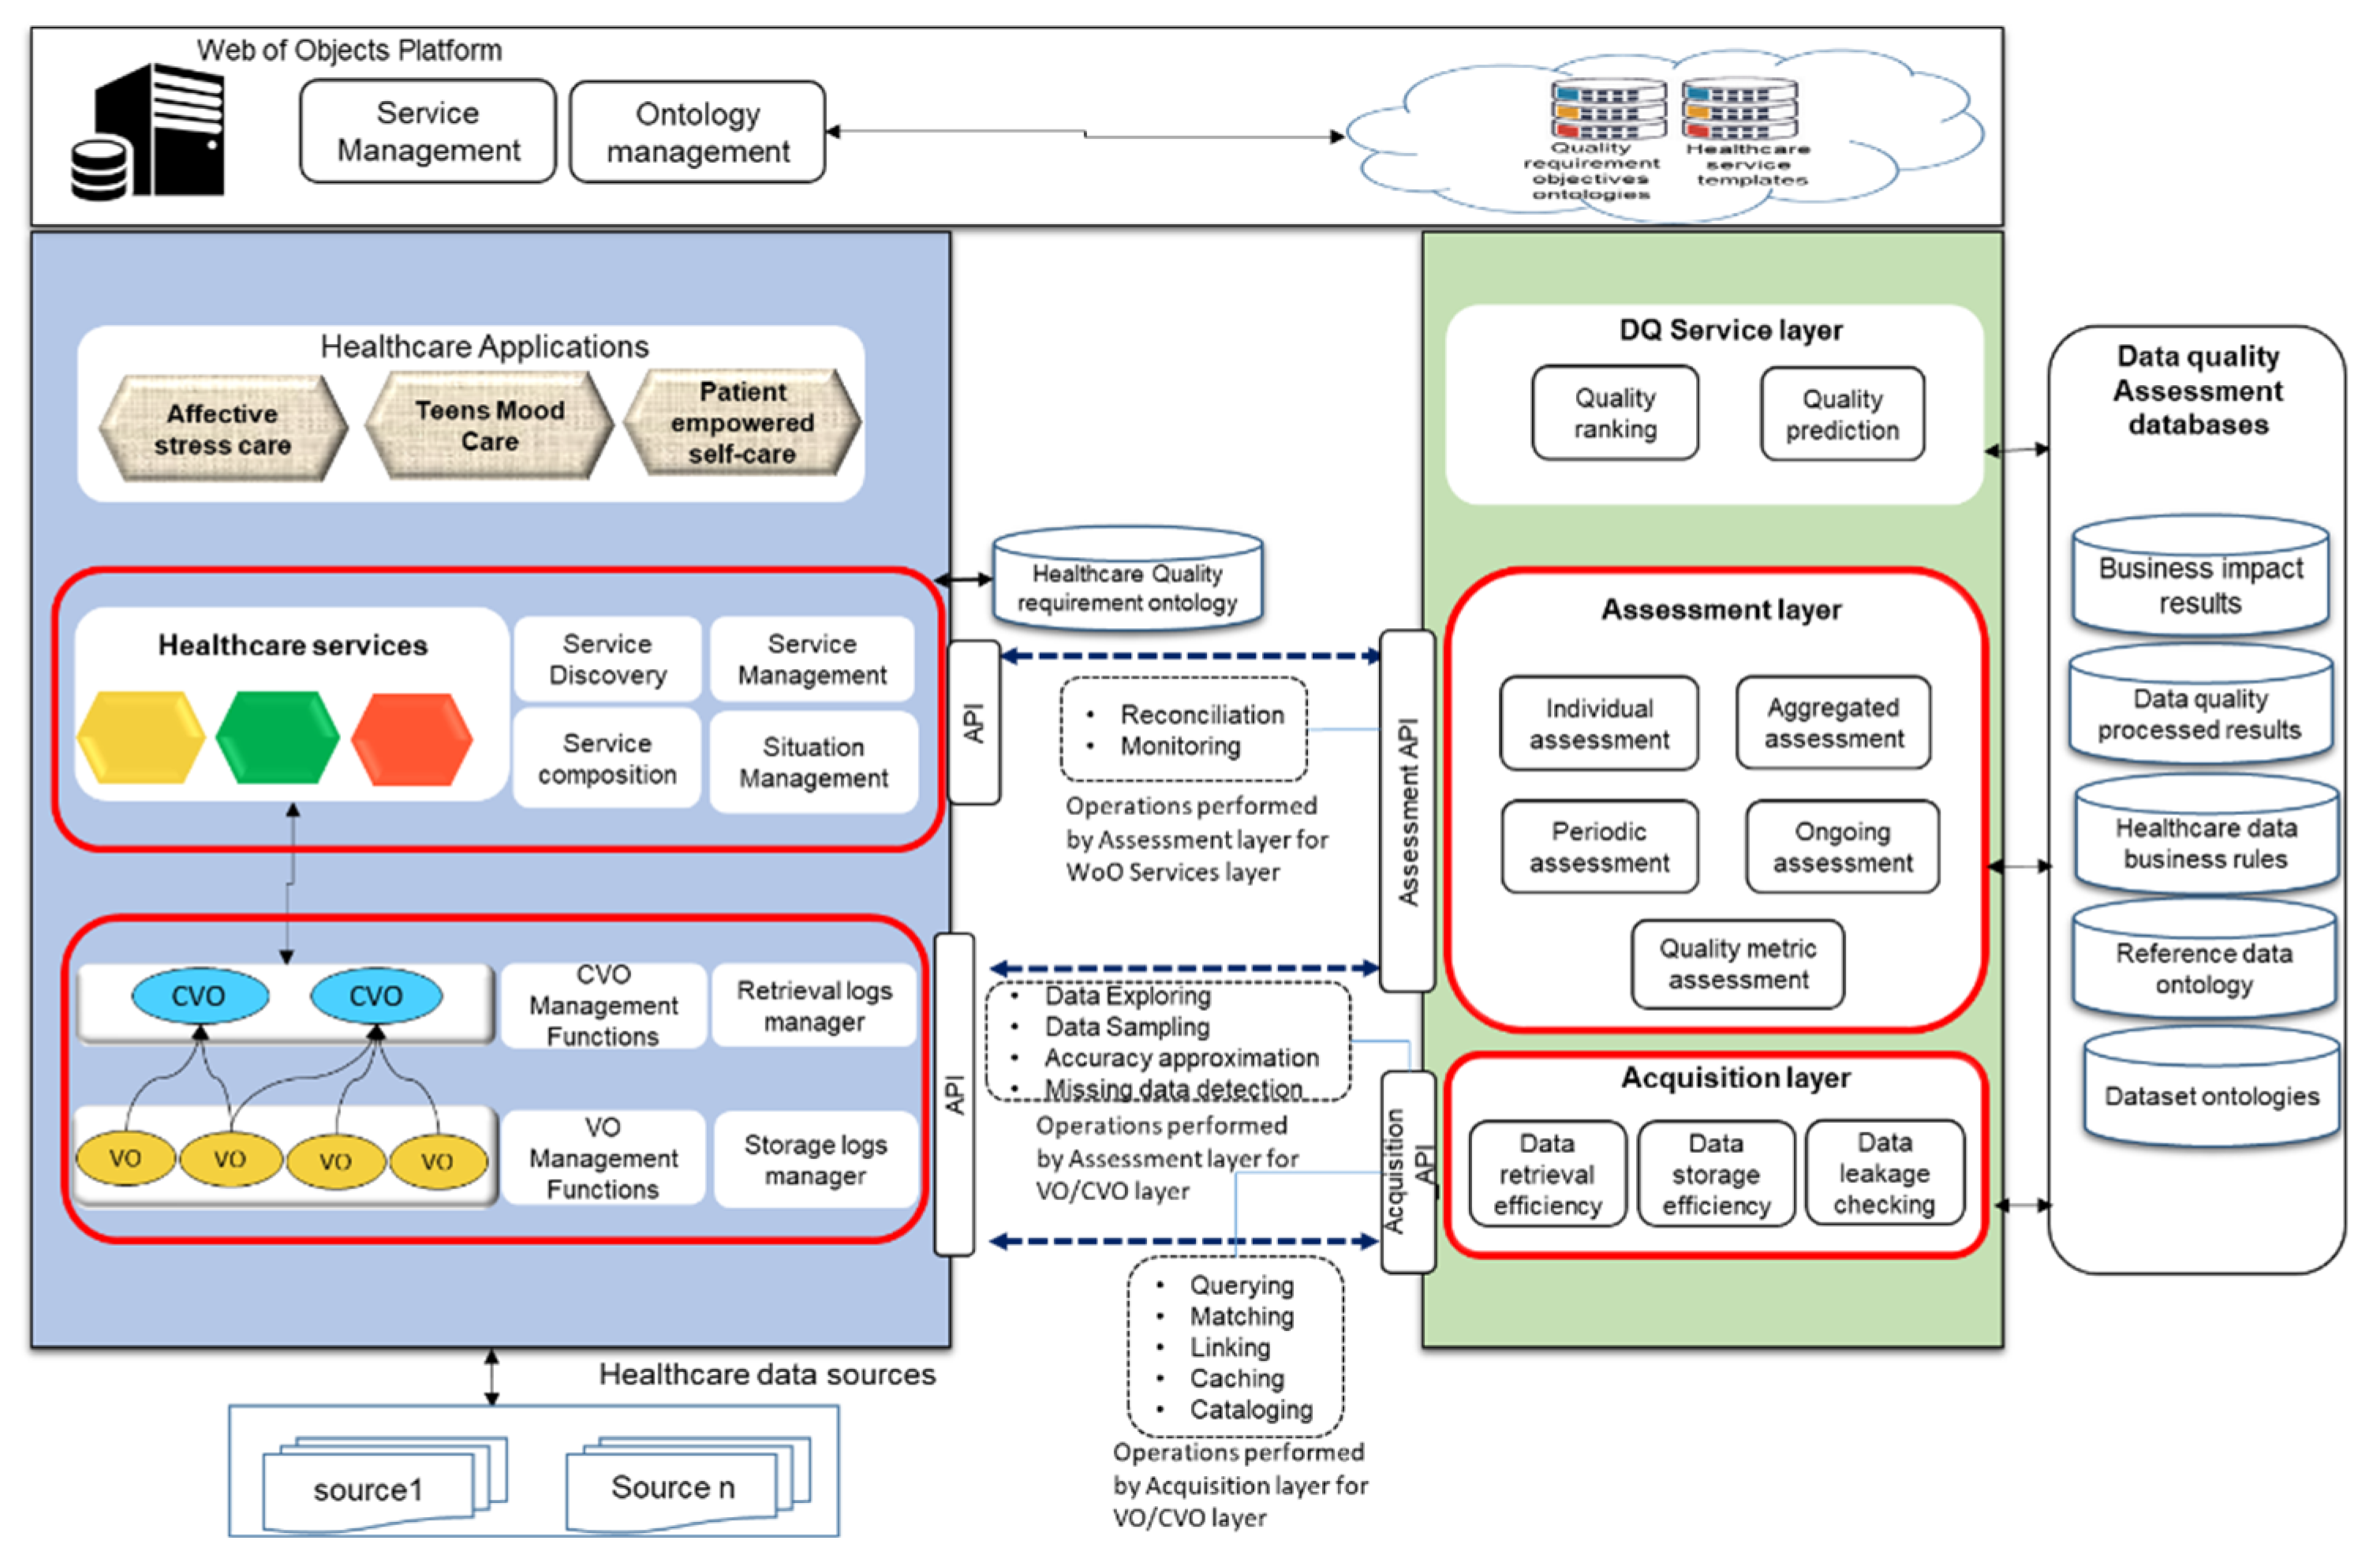
In this section, we discuss the mapping of a data quality assessment functions with WoO enabled healthcare applications model. In the WoO platform, the incoming data will be received from healthcare sources. It will be harmonized with VOs and CVOs for healthcare service features. The healthcare data quality issues can occur during data life cycles such as collection, transformation, retrieval, and analytics. The data quality assessment for WoO based healthcare applications data is shown in Figure 8.
In order to show WoO based data quality assessment, the layer to layer mapping has been performed between the WoO services platform and data quality assessment functions. The acquisition layer has been mapped with the WoO VO and CVO layer for assessing the acquisition level data quality. In this case, it will check VOs/CVOs creation, storage and retrieval efficiency, and harmonization of incoming healthcare data from heterogeneous sources. The data quality assessment layer has been mapped with the WoO VOs/CVOs layer and data quality model service layer. At the VO/CVO level, it assesses the quality of VOs and CVOs data as per the healthcare application requirements. The intrinsic and contextual metric parameters have been applied with the individual, aggregated and periodic assessments. The ongoing assessment has been performed for critical healthcare data. During the data quality assessment at the acquisition and assessment level, various operations have been performed. These operations include querying, matching, linking, cataloging, caching, data exploring, sampling, accuracy approximation, and missing data detection. The assessment layer monitors the overall data quality with respect to the healthcare services at the WoO service level. Here the data quality assessment model performs the operation of reconciliation and monitoring of data in the services’ context.

4.3. Contextual Data Quality Assessment Metric Parameters Mechanism

The process to perform contextual data quality assessment with respect to defined metric parameters have been described for each contextual metric in the WoO semantic data applications. All these metric parameters analytics process is implemented using microservices. The contextual metric parameters microservices are used with data quality assessment model functions such as individual assessment and aggregated data assessment, etc. The detailed process for each contextual data quality metric parameters is presented in the following sub-sections.

4.3.1. Value Added Metric Assessment Mechanism

In WoO enabled data quality assessment, the value-added metric assessment emphasis on the benefits and advantages of using the semantic data in a CVO context and its impact on service quality. The value-added metric is applied to the VOs data which are aggregated in the CVO context. To analyze this metric the VOs duplication data, missing data, and the data acquisition cost parameters are analyzed with respect to each CVO for the semantic data applications. In order to assess the contextual data quality aspect for CVO, it is necessary that the data assessing time duration should be defined clearly. Based on the results of this metric the data quality impact of CVO is decided in the service or application context. If the CVO quality with respect to this metric is low, then based on the required threshold value we could say that this data is not suitable for the CVO or otherwise. The value-added assessment mechanism block diagrams are shown in Figure 9.

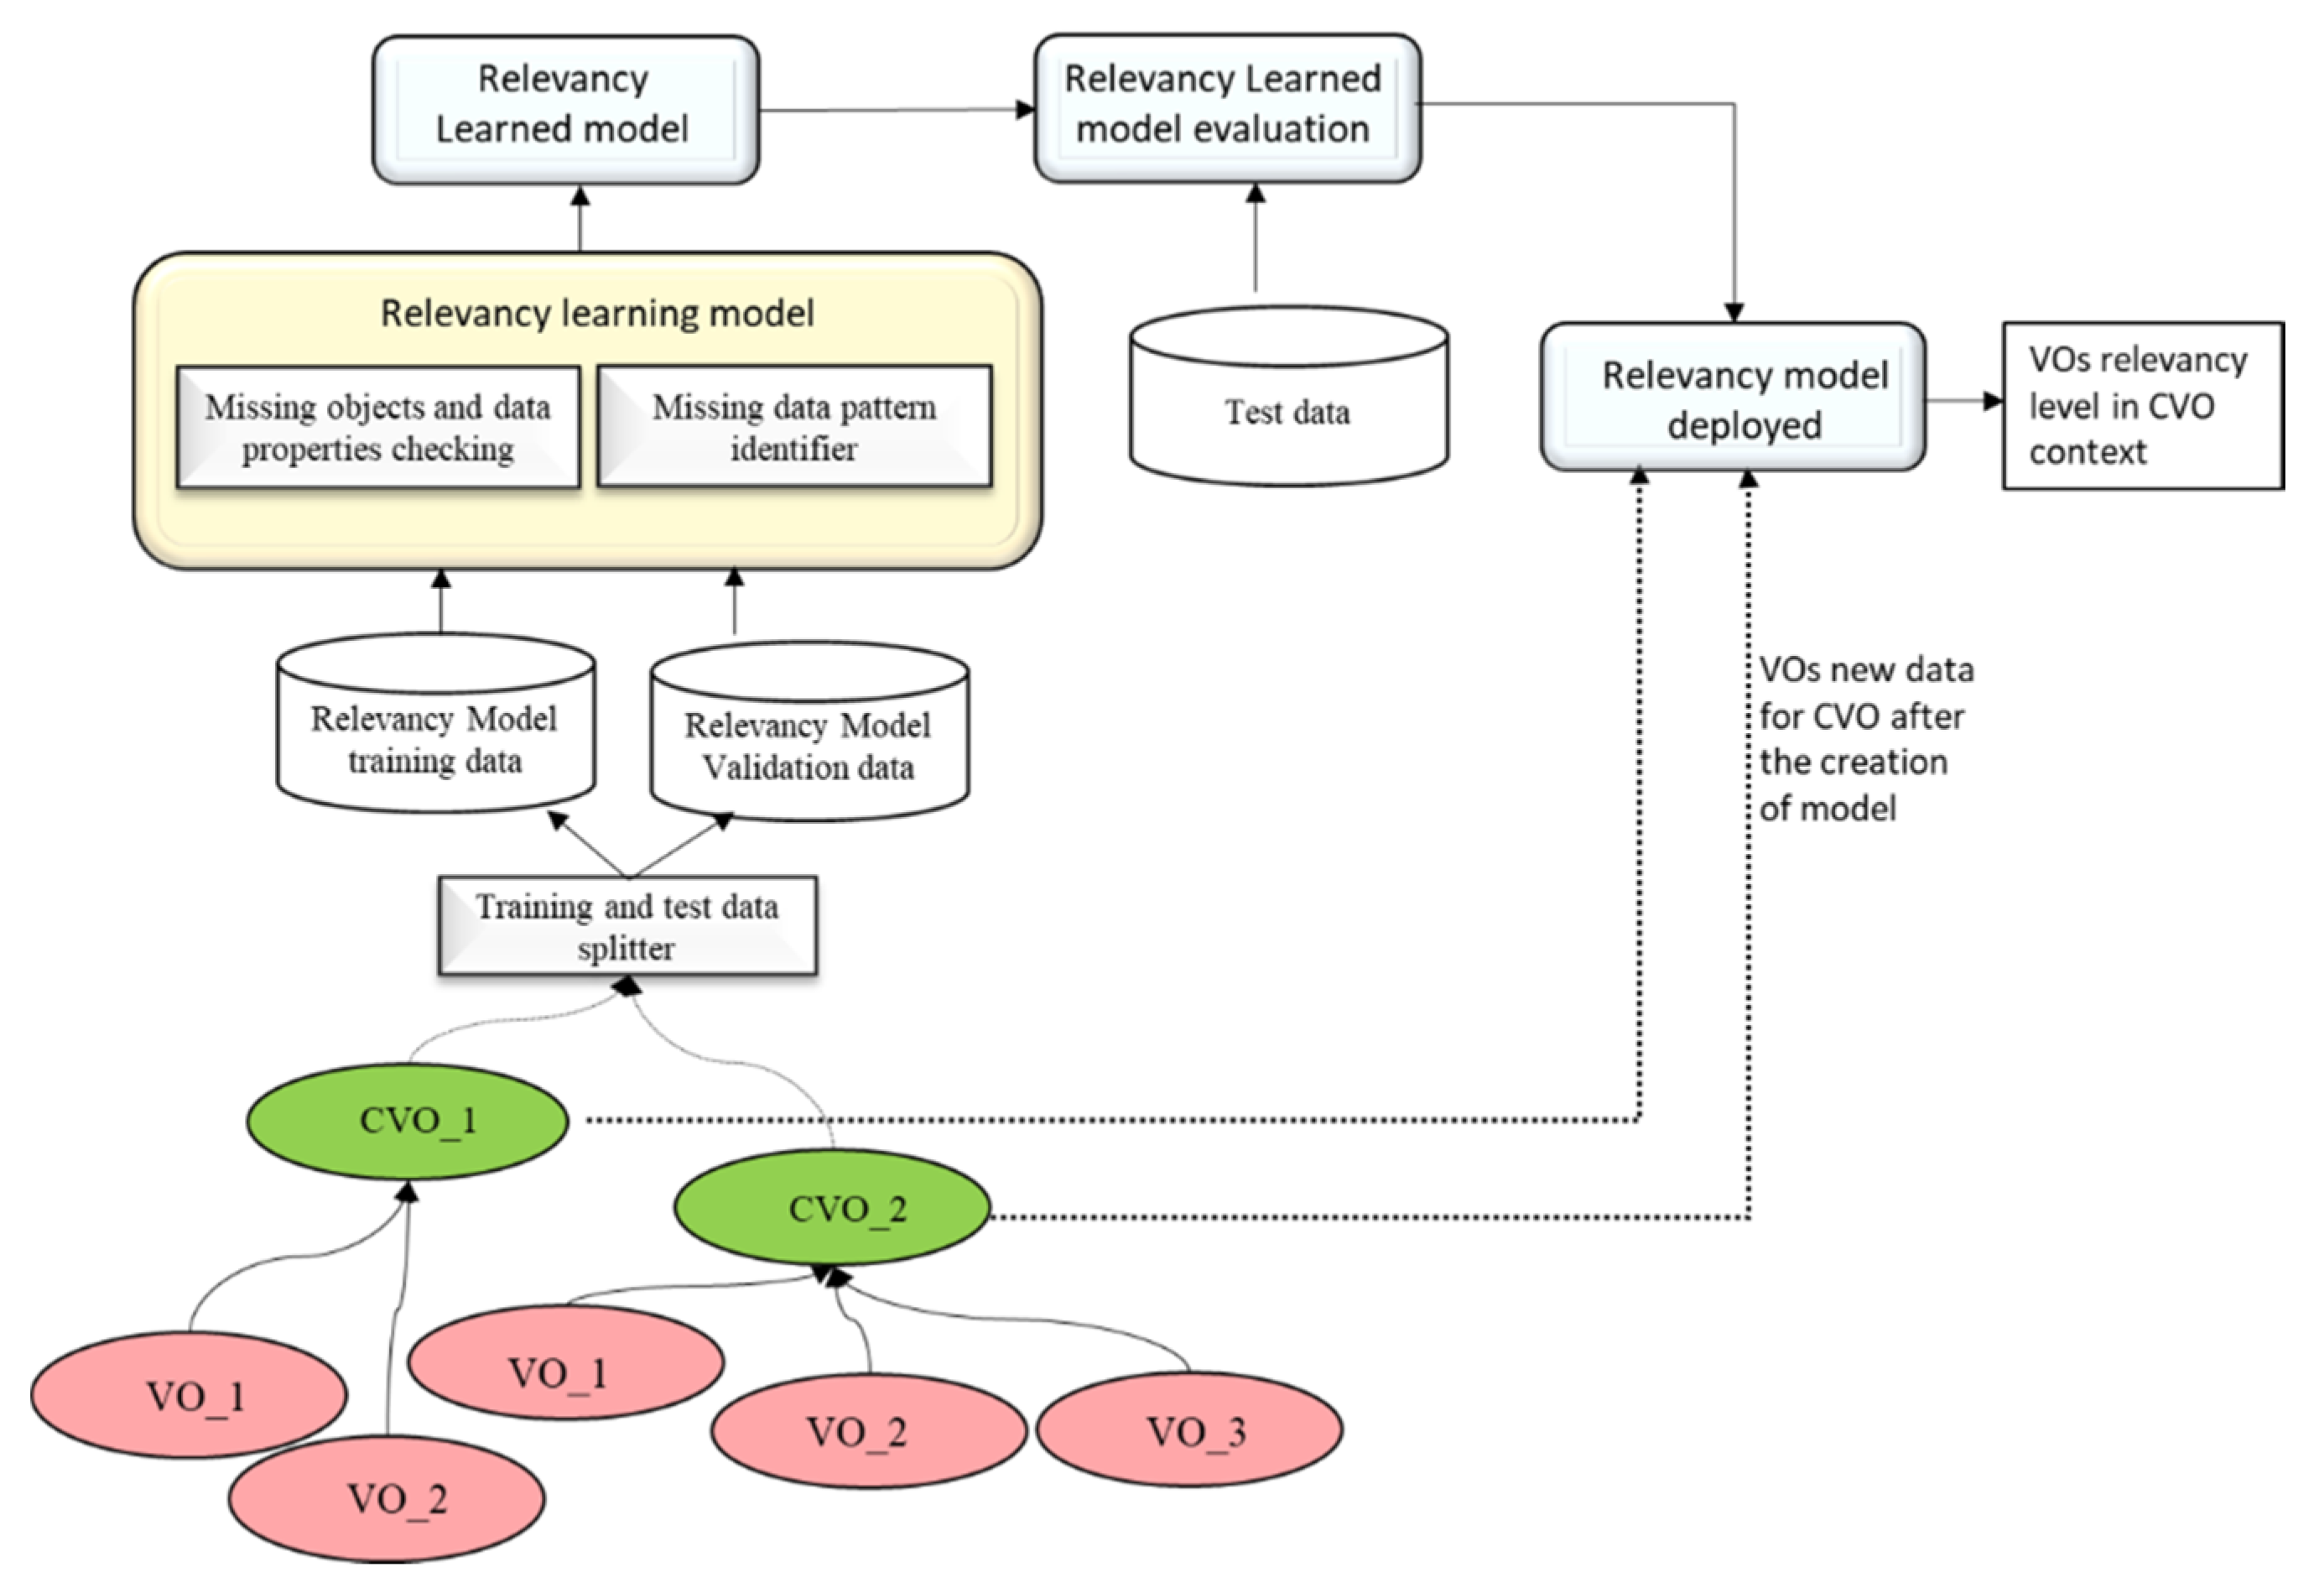
4.3.2. Relevancy Metric Assessment Mechanism

The relevancy metric has been used to identify that the VOs data are relevant for a CVO context. The relevancy metric analyzed that the VOs have complete relevant data for the CVO; and there is no missing object and data properties relation with other supported VOs such as a person’s ID, location, etc. The machine learning or deep learning model can be used to learn above mentioned patterns to find out the relevancy value of VOs in a CVO context. The relevancy assessment learning model for the WoO semantic application data is shown in Figure 10. In this figure, there are two CVOs (CVO_1, CVO_2). The CVO_1 includes two VOs (VO_1, VO_2) and CVO_2 receives data from the VO_1, VO_2, and VO_3 respectively. In order to learn the contextual relevancy metric parameters model, the VOs data has been distributed into training and testing. The learned model will be used to classify the VOs data relevancy in the CVO context. If the aggregated VOs data quality in terms of relevancy is low, then the relevant CVO will be discarded from the service or the service quality will be resumed partially.

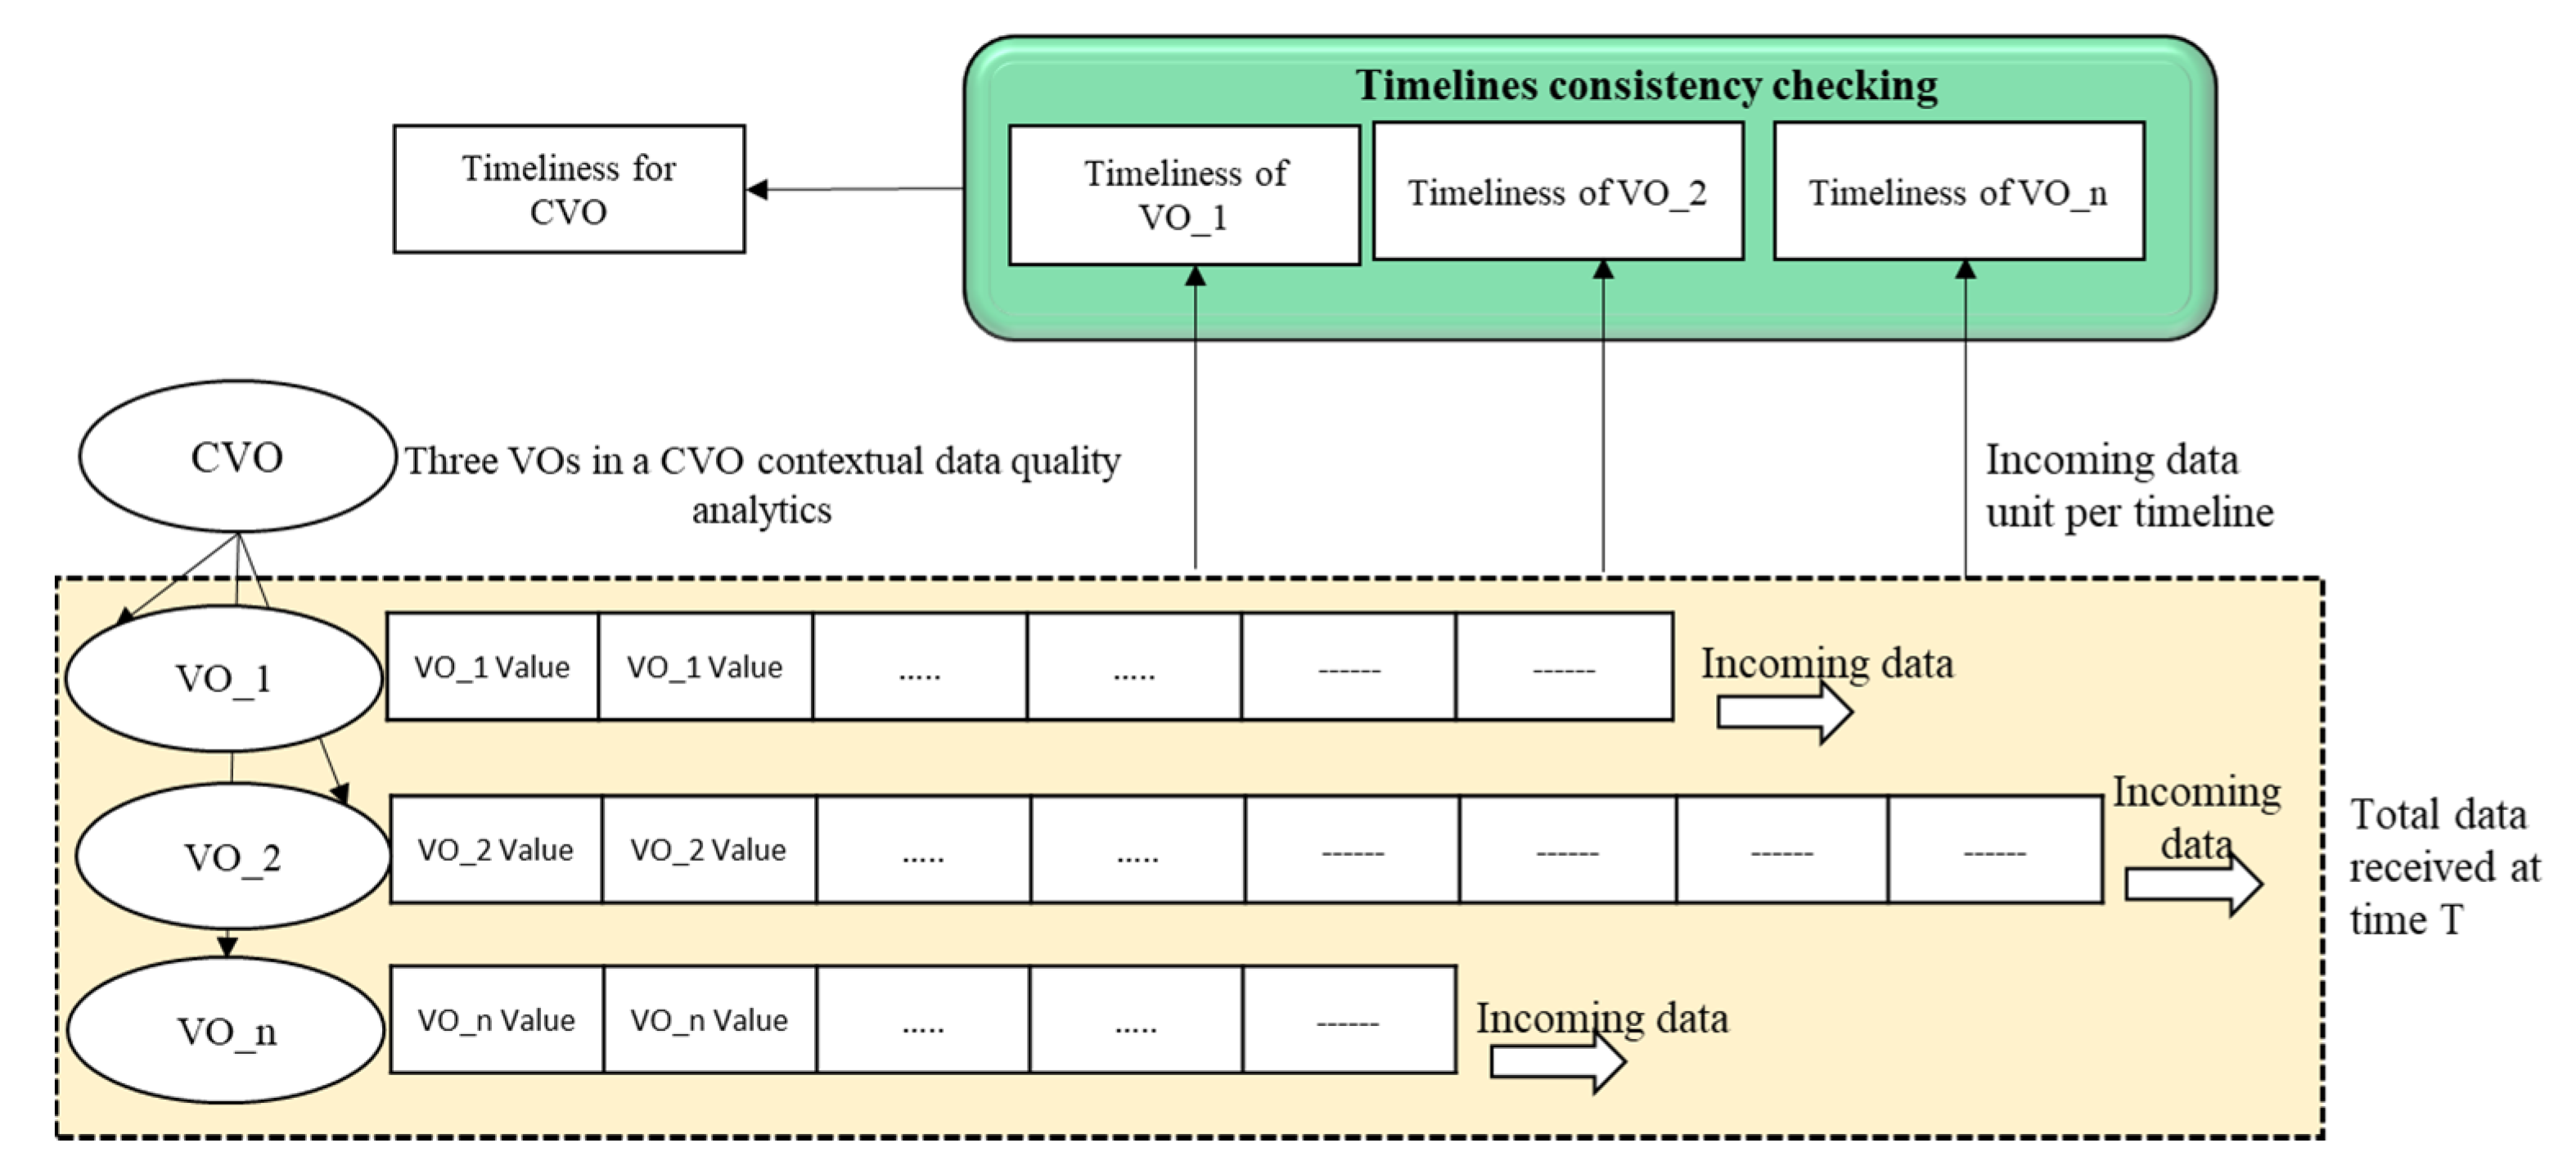
4.3.3. Timeliness Metric Assessment Mechanism

In healthcare data quality analytics, the timeliness is called data currency. The timeliness metric reflects two concepts in the healthcare domain. The first aspect is related to data itself and the second aspect related to the healthcare application infrastructure. The timeliness is considered when the value of the entity is recorded in the database and when it is used for some clinical decisions. In the healthcare domain, the data timeliness feature could be identified by investigating data entry logs, the time difference between the related events within the medical repository. In the WoO enabled healthcare application environment, the timeliness feature could be identified by investigating the data arrival and retrieval consistency for the application and services. In our data quality assessment model, we developed the metric parameters for the data acquisition and data quality assessment level.
In the WoO semantic data application, the VOs have been composed in the CVO context for some features such as to monitor the current state of teen’s mood. In this context, the VOs incoming data should be consistent and synchronized with respect to the time as required by the CVO. If the VOs incoming data timeliness is not consistent, then the CVOs will not perform the expected task. The VOs and CVOs data temporal features are used to analyze the timeliness metric value. Such as three VOs receiving data from physiological sensors with different timeline rates. Figure 11 illustrates the timeliness metric assessment of VOs in a CVO context for semantic data applications.

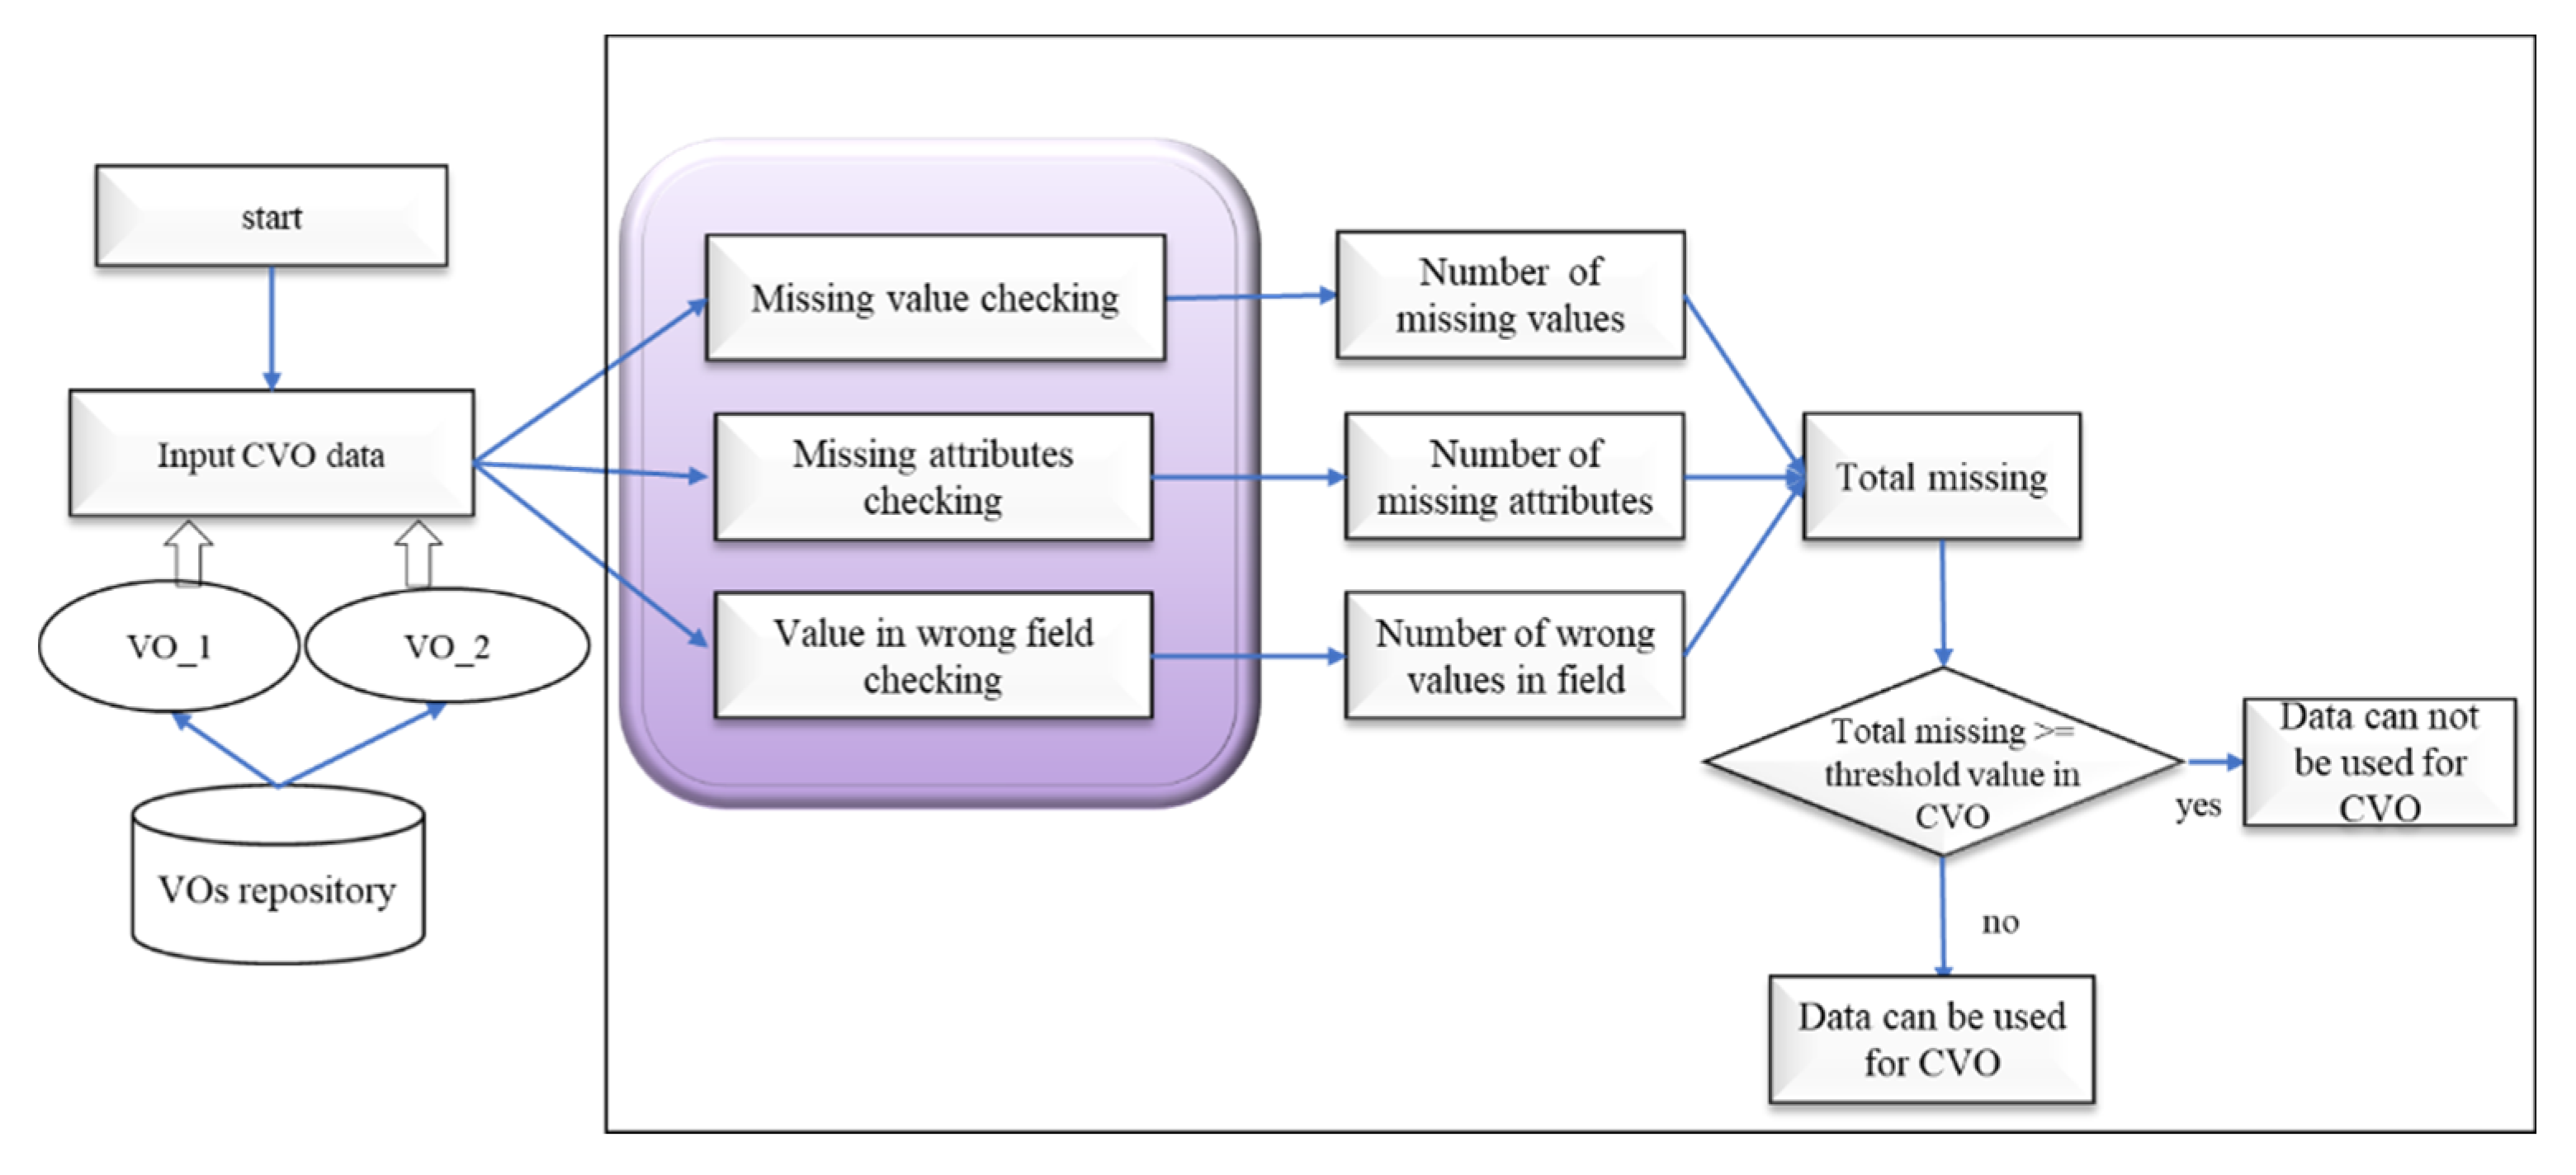
4.3.4. Completeness Metric Assessment Mechanism

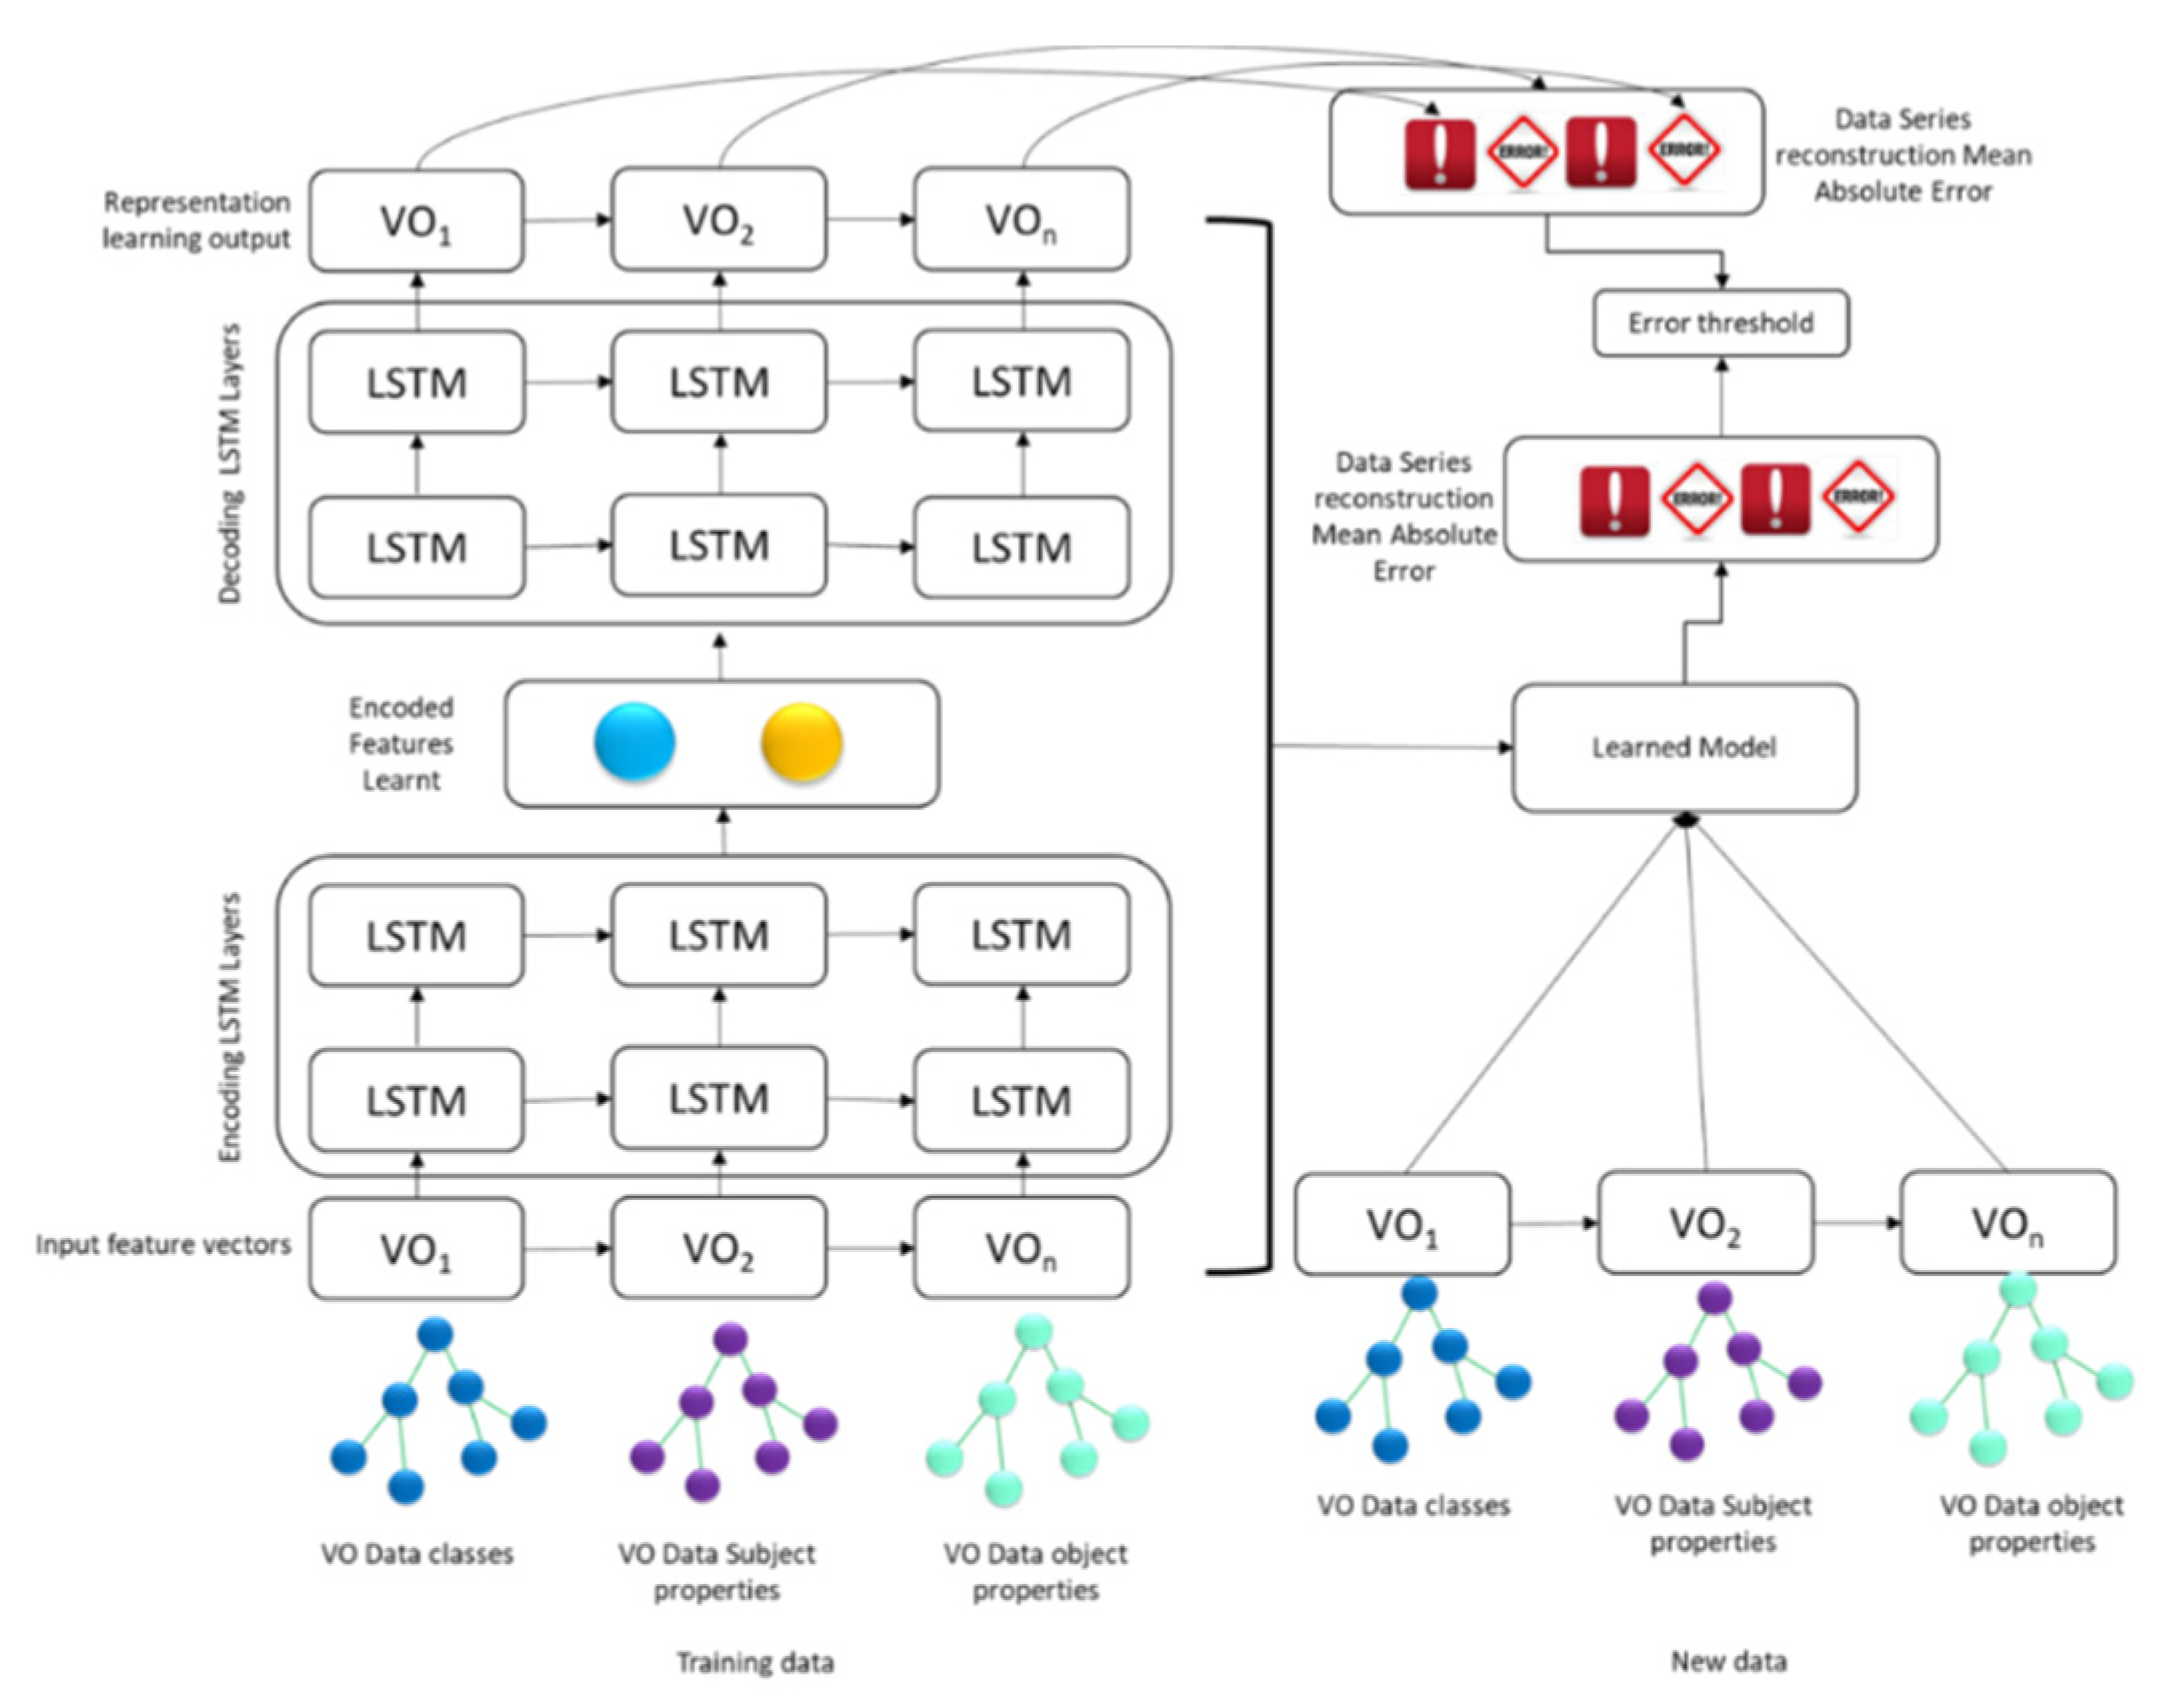
The data quality assessment model can detect and measure data quality in various aspects. Among these data quality aspects, data completeness is one of the most common data quality metrics for healthcare data. The completeness can be described as whether the facts are fully presented. The completeness is a contextual metric that focuses on the selected VOs in the CVO context; that VOs should not have missing data and it contains all the required information for the task to be performed. For example, the electronic health record or physiological sensors data collected is sufficient to predict and classify emotion state or whether the data contains any missing values. In our data quality assessment model for semantic data application, this metric has been applied on person data VOs such as assessing that a persons information is complete, and on sensor data VOs that all the physiological sensor observation has completely received. This metric has three parameters including VOs missing value analysis, VOs missing data attributes analysis, and analysis of wrong field values. The detailed mechanism to use the completeness metric for the contextual data quality assessment in the WoO enabled applications environment is shown in Figure 12.

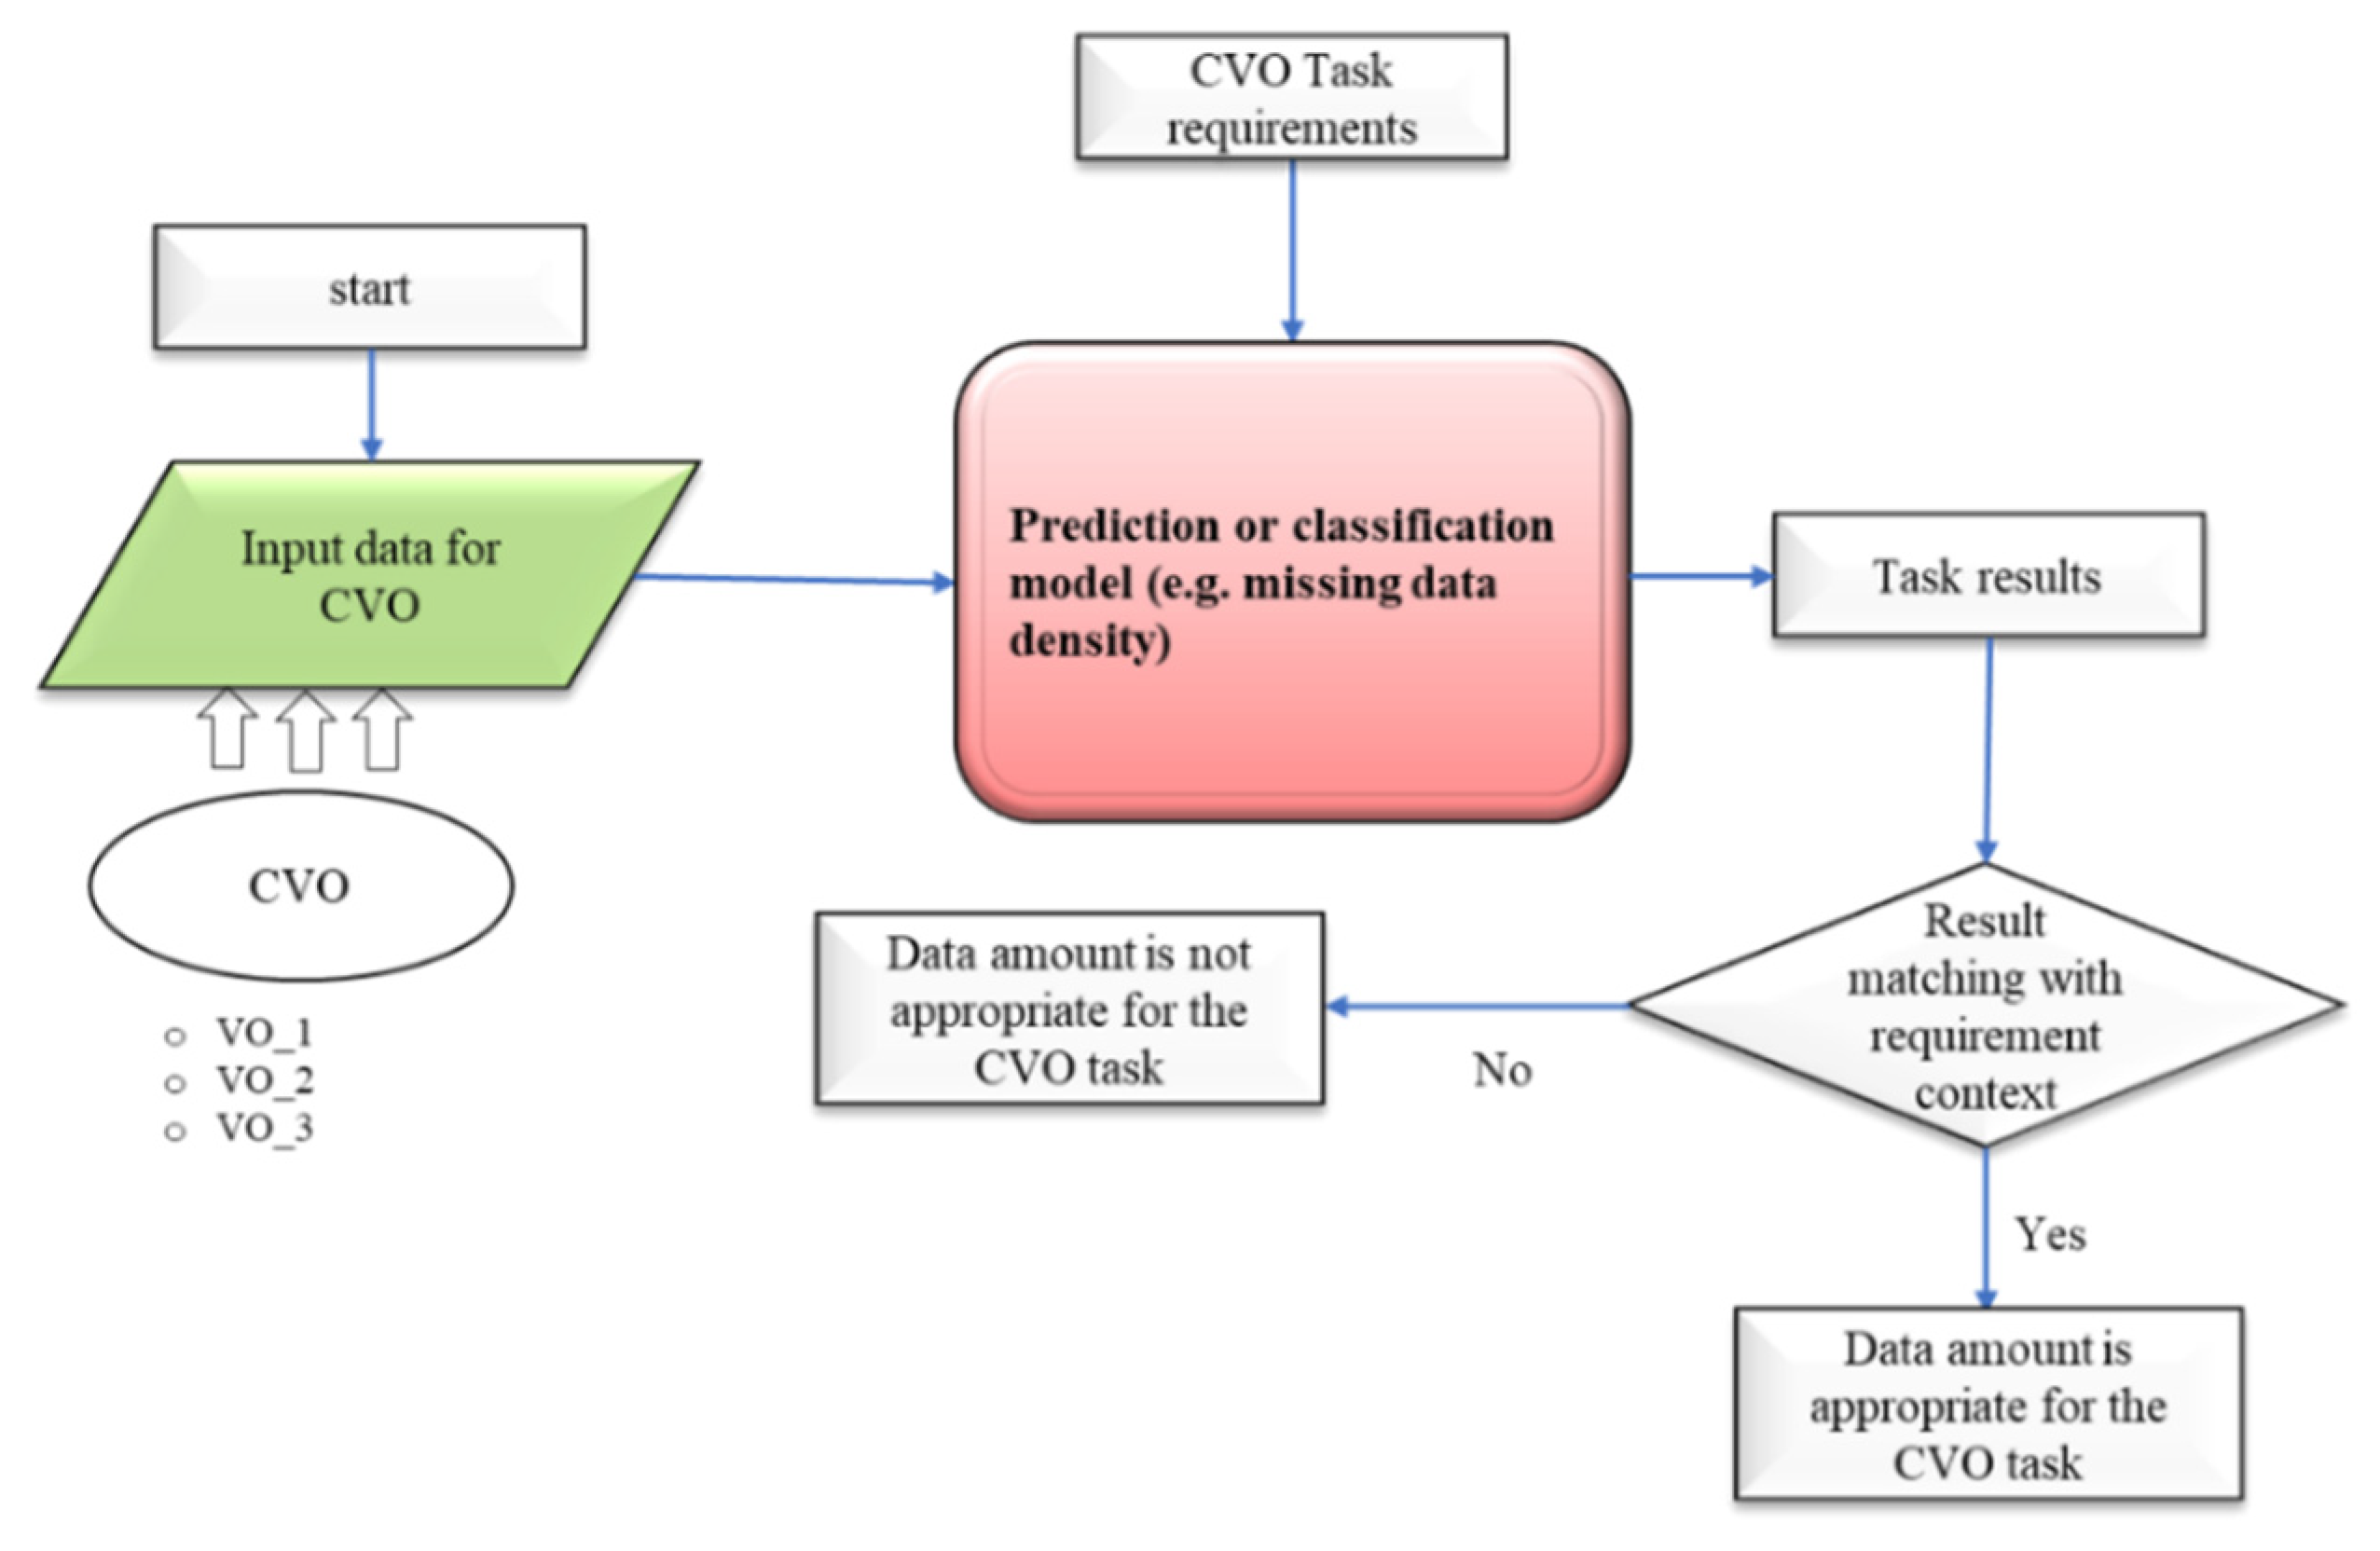
4.3.5. Appropriate Amount of Data

In the contextual data quality assessment, the appropriate amount of data is one of the important data quality metrics. This metric has similar characteristics with respect to the completeness metric. It focusses that the available data is enough for the task or services. In our WoO semantic application data quality assessment model, we designed the metric parameters assessment mechanism and applied it on the CVOs aggregated data. This metric analyzes that the CVOs have enough data to perform relevant tasks according to the requirement of service features. The data quality assessment mechanism for the metric parameters is illustrated in Figure 13.
The CVO contains VOs data including object and data properties is the input to the learning model. Based on the input data, the model learns that the data is enough for the application and services. The appropriate amount of data value metric parameters has been learned with data prediction and classification models. The decision of whether the data is enough for the service is taken based on the threshold value. The CVO appropriate amount of data threshold value could be fixed and can also be learned based on the service quality requirement in which that CVO will be used. For example, this metric analyzed that the selected VOs data (i.e., EMG_VO, BVP_VO, Skin_temp_VOs) and properties are enough for the CVO features.

4.4. Data Quality Assessment for Semantic Data Applications

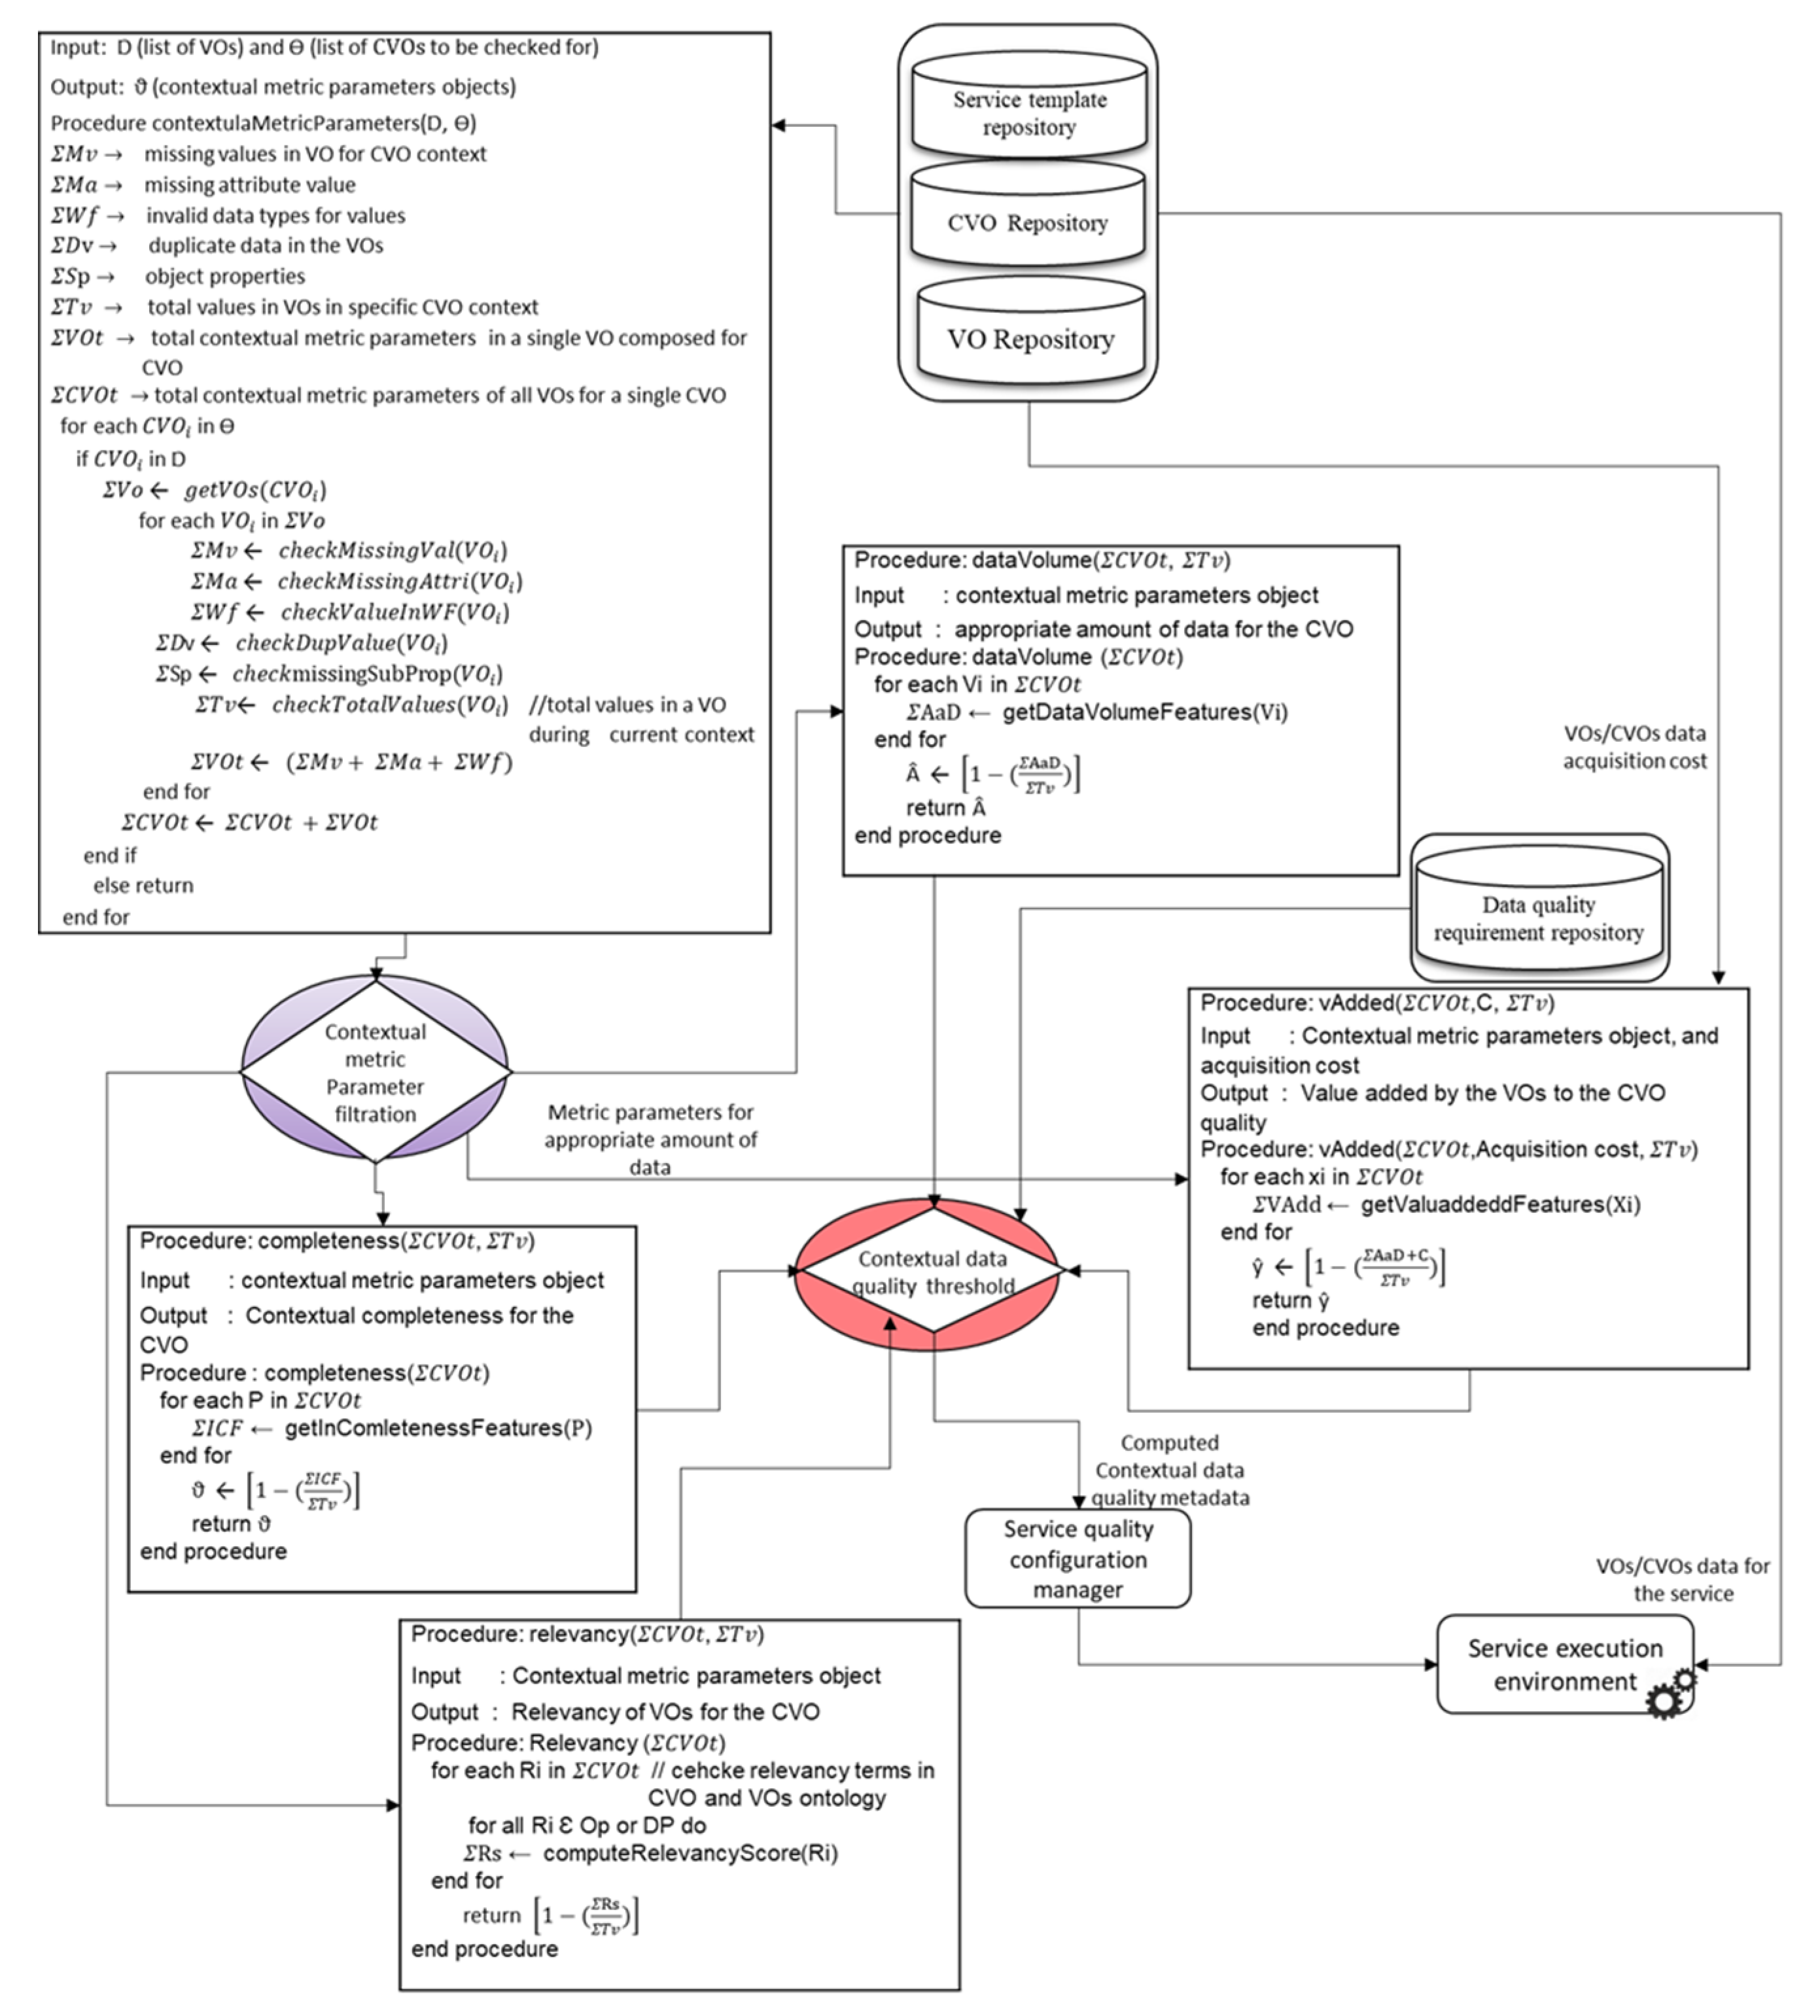
To perform the contextual data quality assessment of the semantic data applications, it is necessary that the incoming data should be transformed into the semantic data using dataset ontologies and VOs/CVOs templates. We applied the contextual data quality assessment metric parameters along with data quality functions at the data acquisition, data quality assessment, and service level. The flow diagram of applied data quality metric parameters algorithm and functions is shown in Figure 14. For the development of contextual data quality assessment model, we designed many data repositories and data quality processing modules in order to support modularity and scalability. However, in the pseudo-code, we show a few of them for clarity and understandability. The VOs and CVOs repositories are used to store the templates of VOs and CVOs along with incoming semantic data for the applications. Among these repositories, there is a service repository that contains the application services template. We developed the data quality requirement repository, which contains the contextual data quality requirement for the CVOs and services.
Initially the semantic data of CVOs and VOs are given the input to the contextual metric parameters procedure (contextualMetricParameters). This procedure receives the two inputs as the list of CVOs (θ) along the corresponding list of VOs () in the current context. For each CVO, all the corresponding VOs are extracted from semantic ontology and its semantic data is assessed with various contextual data quality metric parameters. The checkMissingVal method identifies the missing data values in the VOi compulsory fields. To detect the missing attribute in the VOi, the method checkMissingAttri has been designed. This method identifies any missing attribute in the incoming data in the VOs. The information about the data attributes is referred through the semantic dataset and VOs ontology. To assess other data quality parameters that are necessary for the contextual data quality assessment various methods are designed such as method for the identifying of value in the wrong fields (ceheckValueInWF), detection of duplicate data (cehckDupValue), and identification of missing subject properties (checkmissingSubProp), etc. All the contextual metric parameters in the VOs data within the CVOs context are identified and the final contextual metric parameters object ( Σ C V O t ) is created for further analysis with respect to the contextual metrics.
The identified contextual data quality metric parameters are filtered by the contextual metric parameter filtration function in order to transport the relevant metric parameters. The completeness procedure takes the input as a contextual metric parameter object ( Σ C V O t ) and the total number of values ( Σ T v ) in VOi in the current context. In order to get the incomplete data values in the VOi the method getInCompletenessFeatures is designed. This method returns all the missing data with respect to the VOi to the Σ Rs and the final completeness score of VOi in the respective CVO is returned as output. The completeness procedure considers the CVOi aggregated data quality as one, therefore the ratio of incomplete data is subtracted from the total quality. In a similar way, the other data quality metric parameters are identified for the value added, relevancy, and appropriate amount of data quality metrics. The output of CVO aggregated data quality metadata is given as the input to the service quality configuration manager. This functional component is used to manage the service execution based on the available CVOs data quality. If the assessed data quality is below the defined threshold, then the service can be executed partially or otherwise. All the procedures shown in the pseudo code have been developed using the microservices pattern.

4.5. Data Quality Assessment for WoO Enabled Applications

To perform contextual data quality assessment over the CVOs data, the communication between the WoO enabled ASC and TMC healthcare application model and data quality layer functions (see 
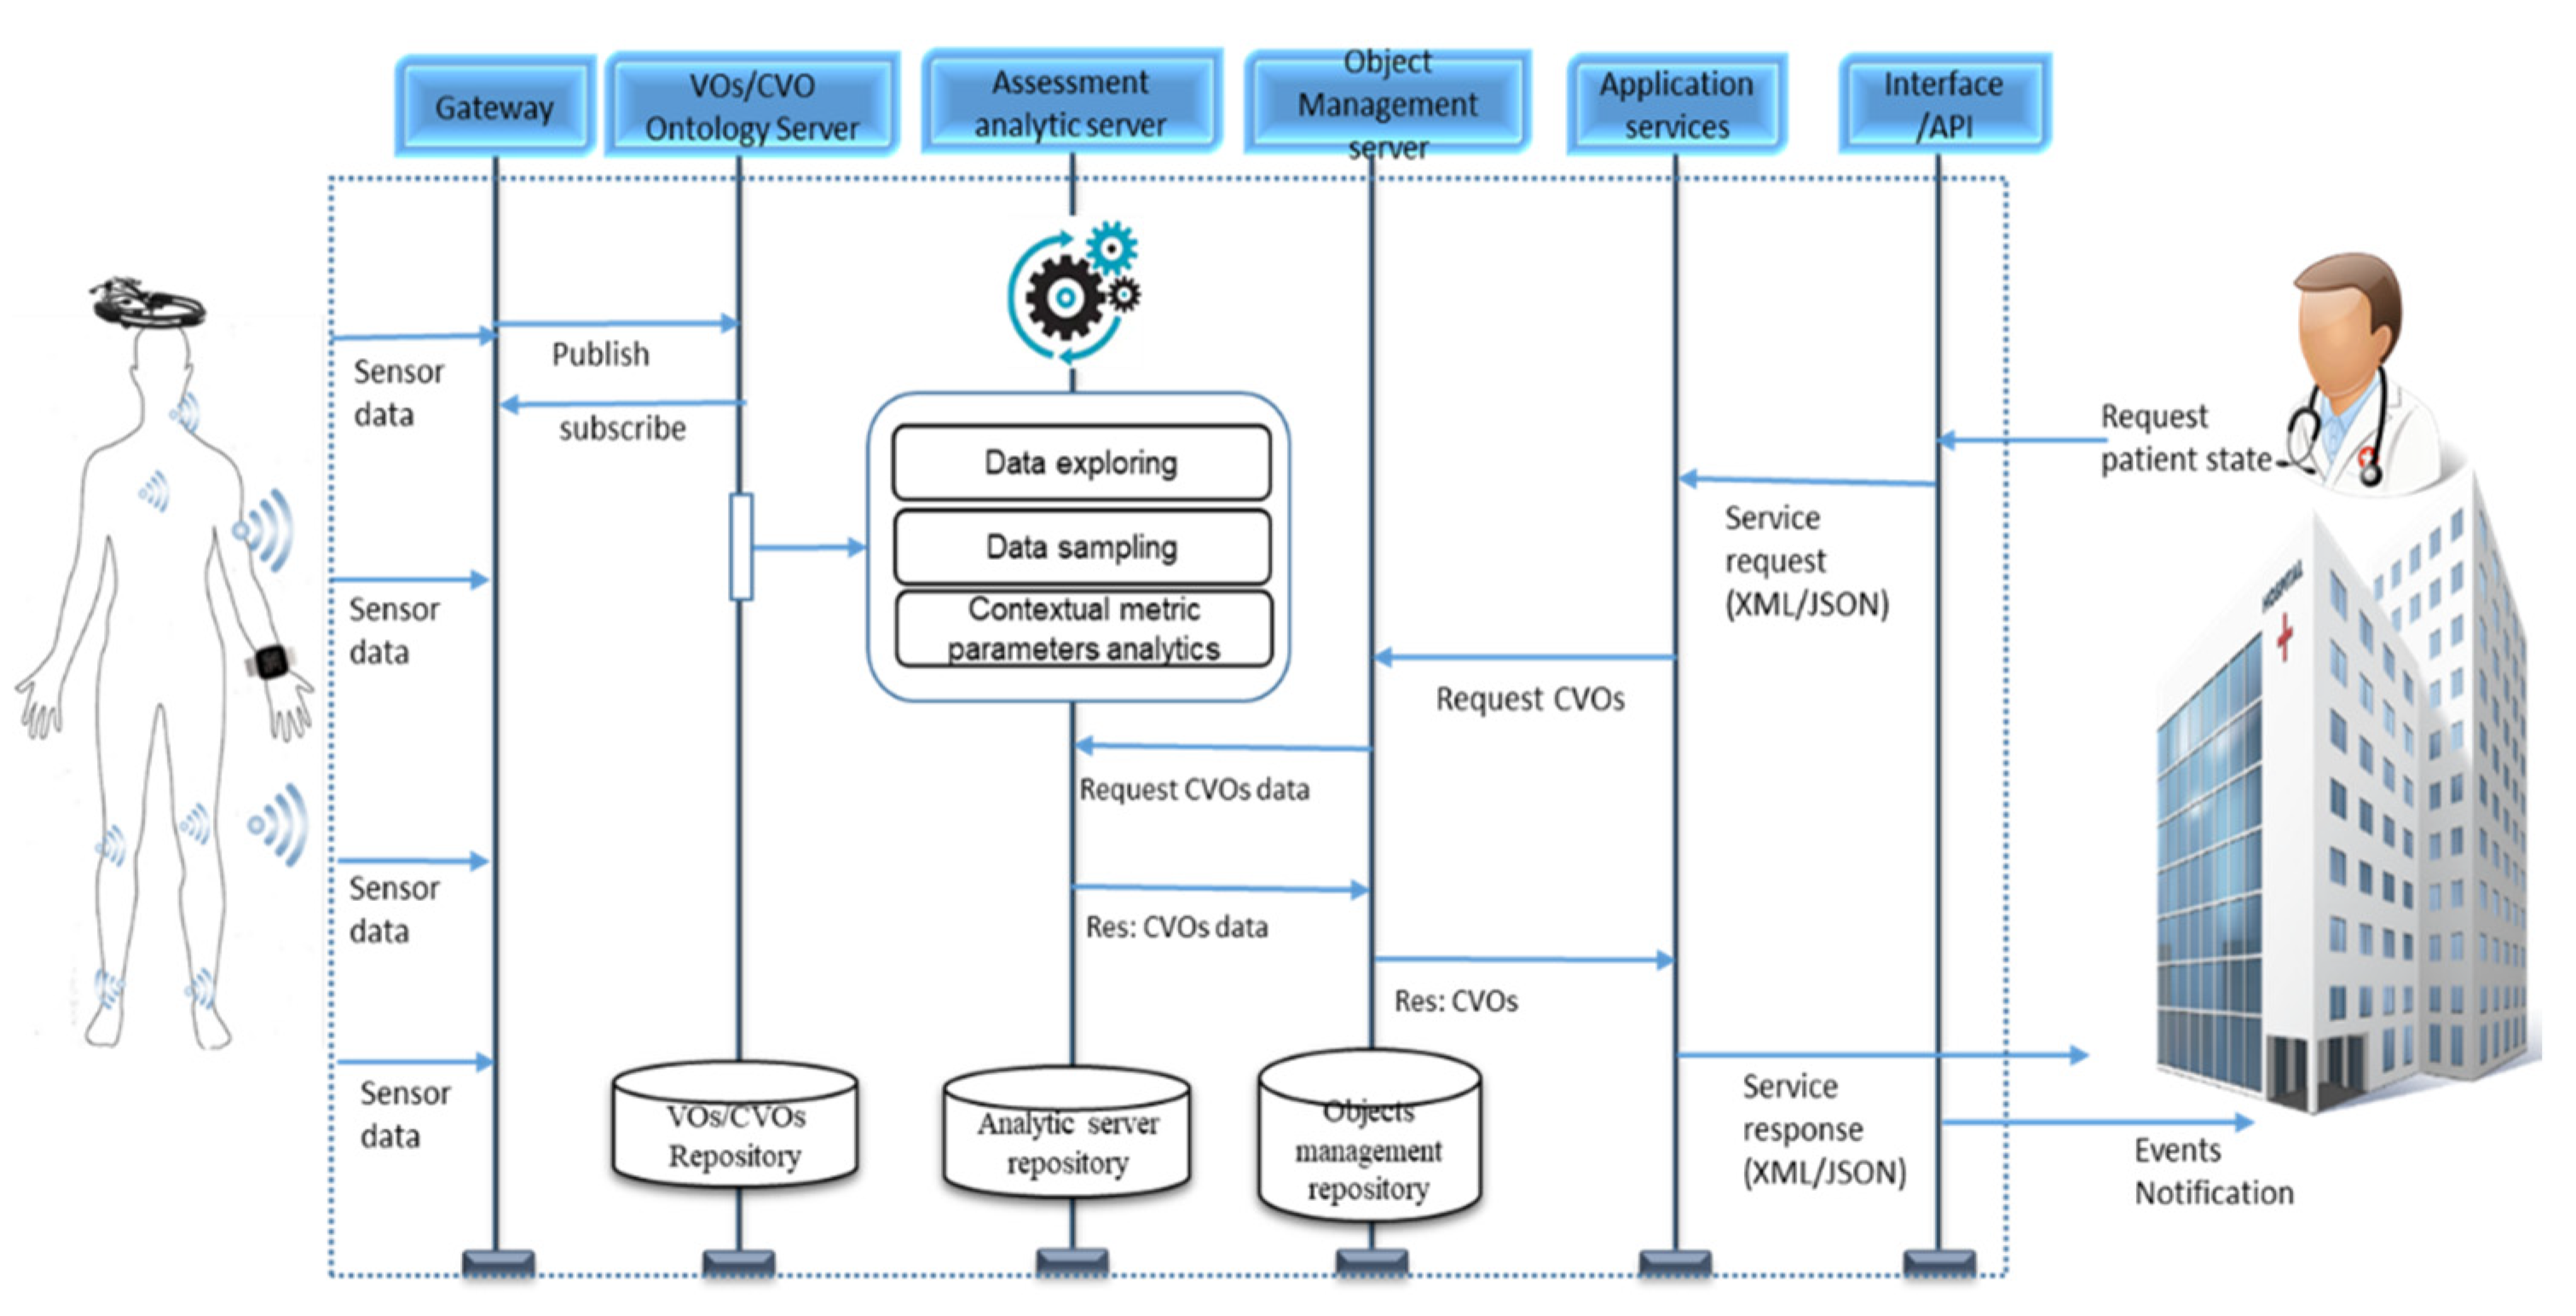
Figure 8 for WoO and data quality layer to layer communications) have been done through the specially designed API interfaces. These API interfaces have been developed with HTTP REST protocol and the communication with CVOs repositories has been done through the secure SPARQL endpoints. When the CVO (i.e., stress monitoring and mood monitoring CVO) has been composed from the relevant VOs data, then the CVOs data quality analytic request has been sent through HTTP REST interface protocol to the data quality assessment layer. In order to analyze the contextual data quality as requested by the WoO healthcare application; initially, the contextual assessment deep learning models have been trained at the assessment analytics server based on the CVOs’ historical data. For the future CVOs data event only the new incoming data have been validated through contextual assessment functions. The implemented contextual assessment model’s sequence diagram is shown in Figure 15.
As shown in Figure 15, the physiological sensor data has been received from users at the VOs/CVOs ontology server by publishing and subscribing (HTTP REST) interfaces. Then this data has been checked and harmonized with VOs ontologies. Later based on the service request, the CVOs are composed of the VOs data and analyzed through contextual data quality assessment functions. In this contextual data quality, metric parameters are applied at the data quality assessment layer. The communication between the VOs/CVOs ontology servers and the assessment analytic server is done through HTTP REST interfaces. The data quality assessment server performs various operations before analyzing the CVOs data with deep learning models. These operations include data querying, exploring, matching and sampling. After the contextual analytics, the data quality result metadata along with CVOs data have been stored at the object management server for further using it in the services.
We developed many databases and servers in order to perform data quality assessment of the WoO enabled healthcare applications. We implemented the VOs and CVOs repository by using the apache Jena triple store. This database contains VOs and CVOs ontologies along with its data and metadata. We developed the data quality assessment analytic server database on OpenTSDB, which is suitable for the scalability and massive amount of analytic data assessment. We developed the objects management database in which the object management server stores the contextual analyzed CVOs results for further using it in the services.

4.6. Microservices for Data Quality Assessment

This section describes the modeling microservices for the contextual data quality assessment statistics and implementation aspect of web objects healthcare applications. The modeling microservices performs various types of data quality computation and statistics tasks. These tasks have been distributed into data quality classification types such as intrinsic, contextual, and representational. The data quality assessment statistics tasks through modeling microservices have been illustrated in Figure 16.
Initially, the incoming healthcare data have been analyzed at the data acquisition level with data quality representational metrics microservices. This microservices group contains four microservices such as data uniformity, consistency, interpretability assessment, and data cleaning and preprocessing. The common data quality metric parameters are assessed only one time and the value of these parameters are shared among the microservices for metric level data quality assessment and statistics. The data quality assessment model functions such as data leakage, data retrieval efficiency and data storage efficiency checking functions have been implemented as microservices. The common parameters assessment microservices results are shared among the metrics and data quality analytic functions.
After the representational statistics checking the data has been analyzed by the intrinsic microservices for the intrinsic data quality statistics. The intrinsic statistics microservice used the machine learning and deep learning model to find a more accurate data quality level with respect to raw data. In the learning, history data and validation data are used for the model statistics validation.
The other modeling microservices learn the statistics of data quality in terms of contextual aspects such as completeness, relevancy and value added. The statistical measure such as standard deviation, moving average and mean are used in the model to learn the contextual level feature of data quality. Finally, the data quality results are distributed into high, medium and low scale with respect to the data classification categories and application requirements. The statistical microservices use microcode and deep learning libraries to learn data quality classification and statistics.

5. Use Case and Experimental Detail

5.1. Use Case Detail and Semantic Data Applications Ontologies

To perform WoO based contextual data quality analytics, we designed two healthcare applications using VOs and CVOs semantic ontologies. The reason to design two applications is to compare the contextual data quality assessment results, because these applications are using the same datasets with different VOs/CVOs semantic ontologies.

5.1.1. Affective Stress Care (ASC) Semantic Data Application

The ASC is a WoO enabled application in which the various symptoms (i.e., sadness, grief, anger, high blood pressure) of youth have been monitored from physiological sensors and based on his/her current state the recommendation services are provided. This application uses various types of VOs, CVOs, and services. In order to provide quality services, we designed the contextual data quality analytics mechanism for the VOs and CVOs data respectively.
The WoO application model for the ASC contains various VOs and CVOs. In the list of CVOs and VOs, Stress_monitoring_CVO data is used to monitor the stress symptoms such as sadness, grief, boring, scary. The Vital_health_CVO data is used to check vital health status individually. The vital health status includes body temperature, blood pressure, heart rate, respiratory rate, etc. ASC WoO model contains various VOs such as VO_PID receives the value for a person’s information such as weight, location, age, etc.; VO_BVP receive the data values from the blood pressure sensors, VO_skin_temp receive the value from the skin temperature sensor and VO_heart_rate receive the data of person from the heart rate measurement sensor. The ontology model for the ASC applications VOs and CVOs is shown in Figure 17 and the excerpt view of the OWL/XML code of Stress_monitoring_CVO is shown in Figure 18.

5.1.2. Teens’ Mood Care (TMC) Semantic Data Application

The TMC is also a WoO based semantic data application that collects data from teens through physiological sensors and provides various services in order to care of teens’ mood. The data has been collected from teens while they are at home or school. Then the data has been transported to the cloud platform for the analytics and provisioning of services. Teens have various mood swings based on their situation. When they face a different type of situation in the school or home, their body generates various types of electrodermal activity signals. Based on this activity, the current state of teens’ mood can be obtained. This application contains various VOs and CVOs with different contextual data quality requirements. In this application, CVOs include Mood_monitoring_CVO, Sleep_monitoring_CVO, etc., and relevant VOs and other semantic concepts to support application features. We developed the VOs and CVOs ontology model for TMC as shown in Figure 19 and Figure 20.
The TMC CVOs ontology model contains various types of VOs that harmonize the physiological sensor data. The TMC application VOs and CVOs have data quality threshold classes with respect to the required accuracy level, missing data range level, etc. for example the Mood_monitoring_CVO has various data quality threshold values and rules in order to process aggregated data from the VOs. These mood state rules include hasMoodState some Grief, hasMoodState some Boring, hasMoodState some Scary, hasMoodState some Happy, and hasMoodState some Hate. The sample of measurement rules include (measureBy some Plus_VO) and (SomeValue some xsd: float [>1.01f]), (measureBy some Blood_pressure_VO) and (SomeValue some xsd: float [>2.01f]). The data quality requirement rule includes (hasAggregatedQualityRequirement some DataQuality) and (thresholdvalue some xsd: float [>90.0%1f]).

5.2. Data Quality Processing and Learning for Semantic Data Applications

5.2.1. Datasets Descriptions

In order to validate the WoO based contextual data quality assessment metric parameters with VOs and CVOs of ASC and TMC applications, the benchmark datasets have been obtained and transformed into semantic data. These datasets [53,54] have been used in many studies for the monitoring of stress and emotions. For the experiments, both datasets have been preprocessed, and the dimensions of dataset A [53] (31,983 × 4) and B [54] (7,444,710 × 8) are used in the data quality assessment learning model along with semantic data application ontologies. We developed the semantic ontology of datasets A and B, in order to map the ASC and TMC applications VOs and CVOs for the harmonization of services and contextual data quality analytics. The semantic ontologies for both datasets are shown in Figure 21 and Figure 22.
The original datasets do not contain contextual data and metadata. Therefore, to perform experiments, we created context classes in the dataset model along with synthesis data. The context classes include location, time, activity, and schedule of a person to whom and when the data has been harvested. This contextual dataset contains metadata of physiological sensors, persons meta information, and dataset features. It contains various threshold values for different types of physiological sensors and state classification in the context. The reason to represent a dataset to ontological data is to convert the receiving data to the semantic data at the acquisition level for further using it in WoO model VOs, CVOs, and services. The dataset contains many concepts, object and data properties in order to show the contextual relation among the classes and tuples.

5.2.2. Deep Learning Model Description

To validate the WoO based contextual data quality assessment model, various deep learning models such as Multi Layer Perceptron (MLP), Recurrent Neural Networks (RNNs), and Convolution Neural Network (CNN) are investigated, because the researchers have been using these models for decades for time series data, textual data such as text generation, sentiment classification, invalid text detection, etc. All these models need a large amount of data to perform the designated task, except the MLP because it can work with a small amount of data. However, MLP takes constant input and performs the analysis on a current instance only. Another deficiency in this model is that it does not supports the contextual information and variable input sequence length. The CNN model uses the fixed size of a window; which moves over the time series semantic data and ontologies in order to extract the relevant features. However, it is insufficient to extract the contextual features from the ontologies and time series data. Authors in studies [55,56,57] stressed that the RNNs based models are more suitable for the textual data analytics tasks, time series data processing, sequence modeling, machine translation, error detection, and action recognition. Long Short-Term Memory (LSTM) is based on the RNNs architecture that relatively has better support for sequence and time dependent data and it is an artificial neural network with feed forward connections [58]. These features are more suitable for contextual data quality assessment of semantic data applications [59]. We choose the bidirectional LSTM model along with autoencoders in order to extract contextual features from the history and current data in an unsupervised mode. The other reason to use bidirectional LSTM-autoencoder is that the datasets A and B contain time series data, that have been used along with the VOs and CVOs ontologies for WoO enabled services [60]. Therefore, the training and testing data contains numeric data with temporal features and ontologies as textual data. When the data includes numeric and textual input, the bidirectional LSTM-autoencoder could be used with different modalities. The VOs and CVO data has been given as input in a vector format to the model input layer.
The designed bidirectional LSTM architecture contains two parts, the autoencoder, and LSTM. Therefore, first, we briefly explain the autoencoder design and then we cover the LSTM part. In the LSTM-autoencoder model, the input data are the bags of words that have been extracted from the ASC and TMC application VOs and CVOs ontologies. The design model supports the ability to learn the data quality patterns without any labeled data, because we used autoencoders with the LSTM, as the autoencoder enabled self-supervised learning from the given data representation of VOs and CVOs.
The functional feature of designed autoencoder learning is represented mathematically as in Equation (1). The autoencoder supports two parts, the encoder Equation (2) and the decoder Equation (3). The encoders perform the conversion of data to the concise representation and the decoder inverse the concise representation in order to convert the input data to the original data. The transition from the encoder Equation (2) to a decoder Equation (3) is represented as a function shown in Equation (4). In a single hidden layer case, autoencoder receives the input VOs and CVOs data as mathematically represented in Equation (5) and maps it to the function as in Equation (6); where the value of z is represented as in Equation (7), and at the construction side, it is represented as Equation (8). In Equations (7) and (8) formulation σ is an activation function (i.e., ReLU or sigmoid), z is a latent variable, b is the bias vector. The latent variable could not be observed directly but it can be deduced from the related variables. The basic unit of LSTM is illustrated in Figure 23 [59]. In the basic architecture of LSTM unit, Ct Equation (9) is the current memory cell or current continuous state, ht is the current hidden state, ht−1 is a previous hidden state, ft Equation (10) is the forget state, it Equation (11) is the input gate and Ot Equation (12) is the output get. The final output (ht) is obtained with the input feature matrix of a cell state and feature matrix of the output gate during the current time as shown in Equation (13). The input to the model is VOs and CVOs data which are represented as xt. The designed LSTM-autoencoder architecture is shown in Figure 24.
f : x x
ψ : x f
Ø : f x
a r g min ψ , Ø | | X ( ψ 0   Ø ) X | | 2
x R d = X
z R q = f
z = σ   ( w x + b )
x = σ   ( w z + b )
C t = σ   ( W c · [ h t 1 ,   x t ] + b c )
f t = σ   ( W f · [ h t 1 ,   x t ] + b f )
i t = σ   ( W i · [ h t 1 ,   x t ] + b i )
O t = σ   ( W O · [ h t 1 ,   x t ] + b O )
h t = O t · t a n h   C t
y = max ( 0 , z )
M A E = 1 N i = 0 N ( x y ) 2
The LSTM-autoencoder model takes a sequence of VOs and CVOs data in the batches and feeds to the cells in a sequential order. The designed deep learning LSTM-autoencoder model contains input and output layers, and four hidden layers. Among the hidden layers, two hidden layers are used as the encoder and the remaining two used as decoder layers. The ReLU (rectified linear unit) activation function Equation (14) is used in the encoder and decoder layers. We configured 32 and 16 as the size of hidden nodes in the first and second layers along the encoder side, and 16 and 32 in the decoder side. The adam and mean squared error Equation (15) are used in the LSTM-autoencoder as optimizer and loss function respectively. The designed LSTM-autoencoder model does not use the data augmentation because the downloaded benchmarked datasets are enough to evaluate the proposed data quality assessment mechanism.

5.2.3. Contextual Data Quality Processing and Learning

We applied our developed enhanced bidirectional LSTM-Autoencoder model for the contextual data quality analytics. The size of incoming data from a large healthcare industry does not affect the data quality assessment processing mechanism negatively because we are using microservices-based scalable and distributed data quality assessment processing and learning mechanism. Moreover, the deep data quality assessment learning model quality will be better, if we train the model with a huge amount of healthcare data. The detail of contextual data quality processing methodology is shown in Figure 25.
At step one, the datasets A and B are the input. In step two, the related required data quality parameters pattern has been embedded in the data or the data can be manipulated according to the metric parameters and data quality analytics function. At step three, the manipulated data is converted to semantic data with dataset ontologies as described in Section 5.2.1. This semantic data values and properties have been mapped with WoO enabled ASC and TMC application VOs/CVOs. At step four, the VOs/CVOs classes, object properties, and data properties are extracted along with its individual data instances. Then the tokens have been created and transformed to word2vector for that application and data ontologies. In steps five to seven the features from VOs/CVOs data are sent to the model for the classification of contextual data quality.
The contextual data quality assessment functions for the ASC and TMC applications have been applied to the VOs aggregated data in the CVOs context. For this type of analytics, we used completeness and the appropriate amount of data quality metric parameters over the VOs data. Because the multiple VOs data have been used in the Stress_monitoring_CVO and Mood_monitoring_CVO context. We analyzed the contextual aspects of data quality classification for the ASC and TMC semantic data applications by creating four test cases from dataset A and B. The total sample size of dataset A and B after data cleaning was 127,932 and 59,557,680 cells respectively. We used a random sampling method to create four test cases’ datasets. The reason to create four test cases is to perform contextual analytics that whether the deep learning model can detect data quality errors and perform the assessment according to the given metric parameters data representation. In the first test case, we use original datasets A and B total samples without any manipulation with the ASC and TMC applications VOs and CVOs ontology. It is assumed that VOs and CVOs data quality with respect to analytics metric is 100%. For the second test case, we manipulated data of dataset A and B 10% randomly and then used this data with ASC and TMC VOs and CVOs ontologies. In the second test case, the randomly manipulated sample size in dataset A and B was 12,793.2 and 5,955,768 respectively. In the third and fourth cases, 40% and 60% of data from dataset A and B have also been manipulated randomly with respect to data quality metric parameters respectively. The random sampling size of manipulated data for the third and fourth cases was 51,172.8, 76,759.2; 23,823,072 and 35,734,608 in dataset A and B respectively. The brief description of experimental test cases is presented in Table 1.

6. Result and Discussion

To evaluate the proposed data quality assessment model, an ample number of experiments have been conducted and repeated in order to reduce the chance of errors. In the first experiment, we analyzed the ASC and TMC applications CVOs’ contextual data quality assessment with respect to the completeness metric parameters. In the second experiment, we perform the data quality assessment with respect to the appropriate amount of data quality metrics parameters and in the third experiment, the overall data quality assessment of ASC and TMC VOs and CVOs semantic data has been performed. We also analyzed the data acquisition cost for the semantic data of VOs and CVOs. These data acquisition functions have been implemented with containerized microservices that have many numbers of instances to process semantic VOs and CVOs data from the repositories. The VOs and CVOs semantic data repository has been created using the apache Jena triple store [61]. In all the experiments of data quality assessment learning model, the datasets have been distributed into 80% and 20%. The 80% data is used in the model training and tuning the parameters; and the samples from 20% data is utilized in the model testing and evaluation, because to keep the testing and evaluation dataset samples away from the training and tuning samples is an independent evaluation approach [62,
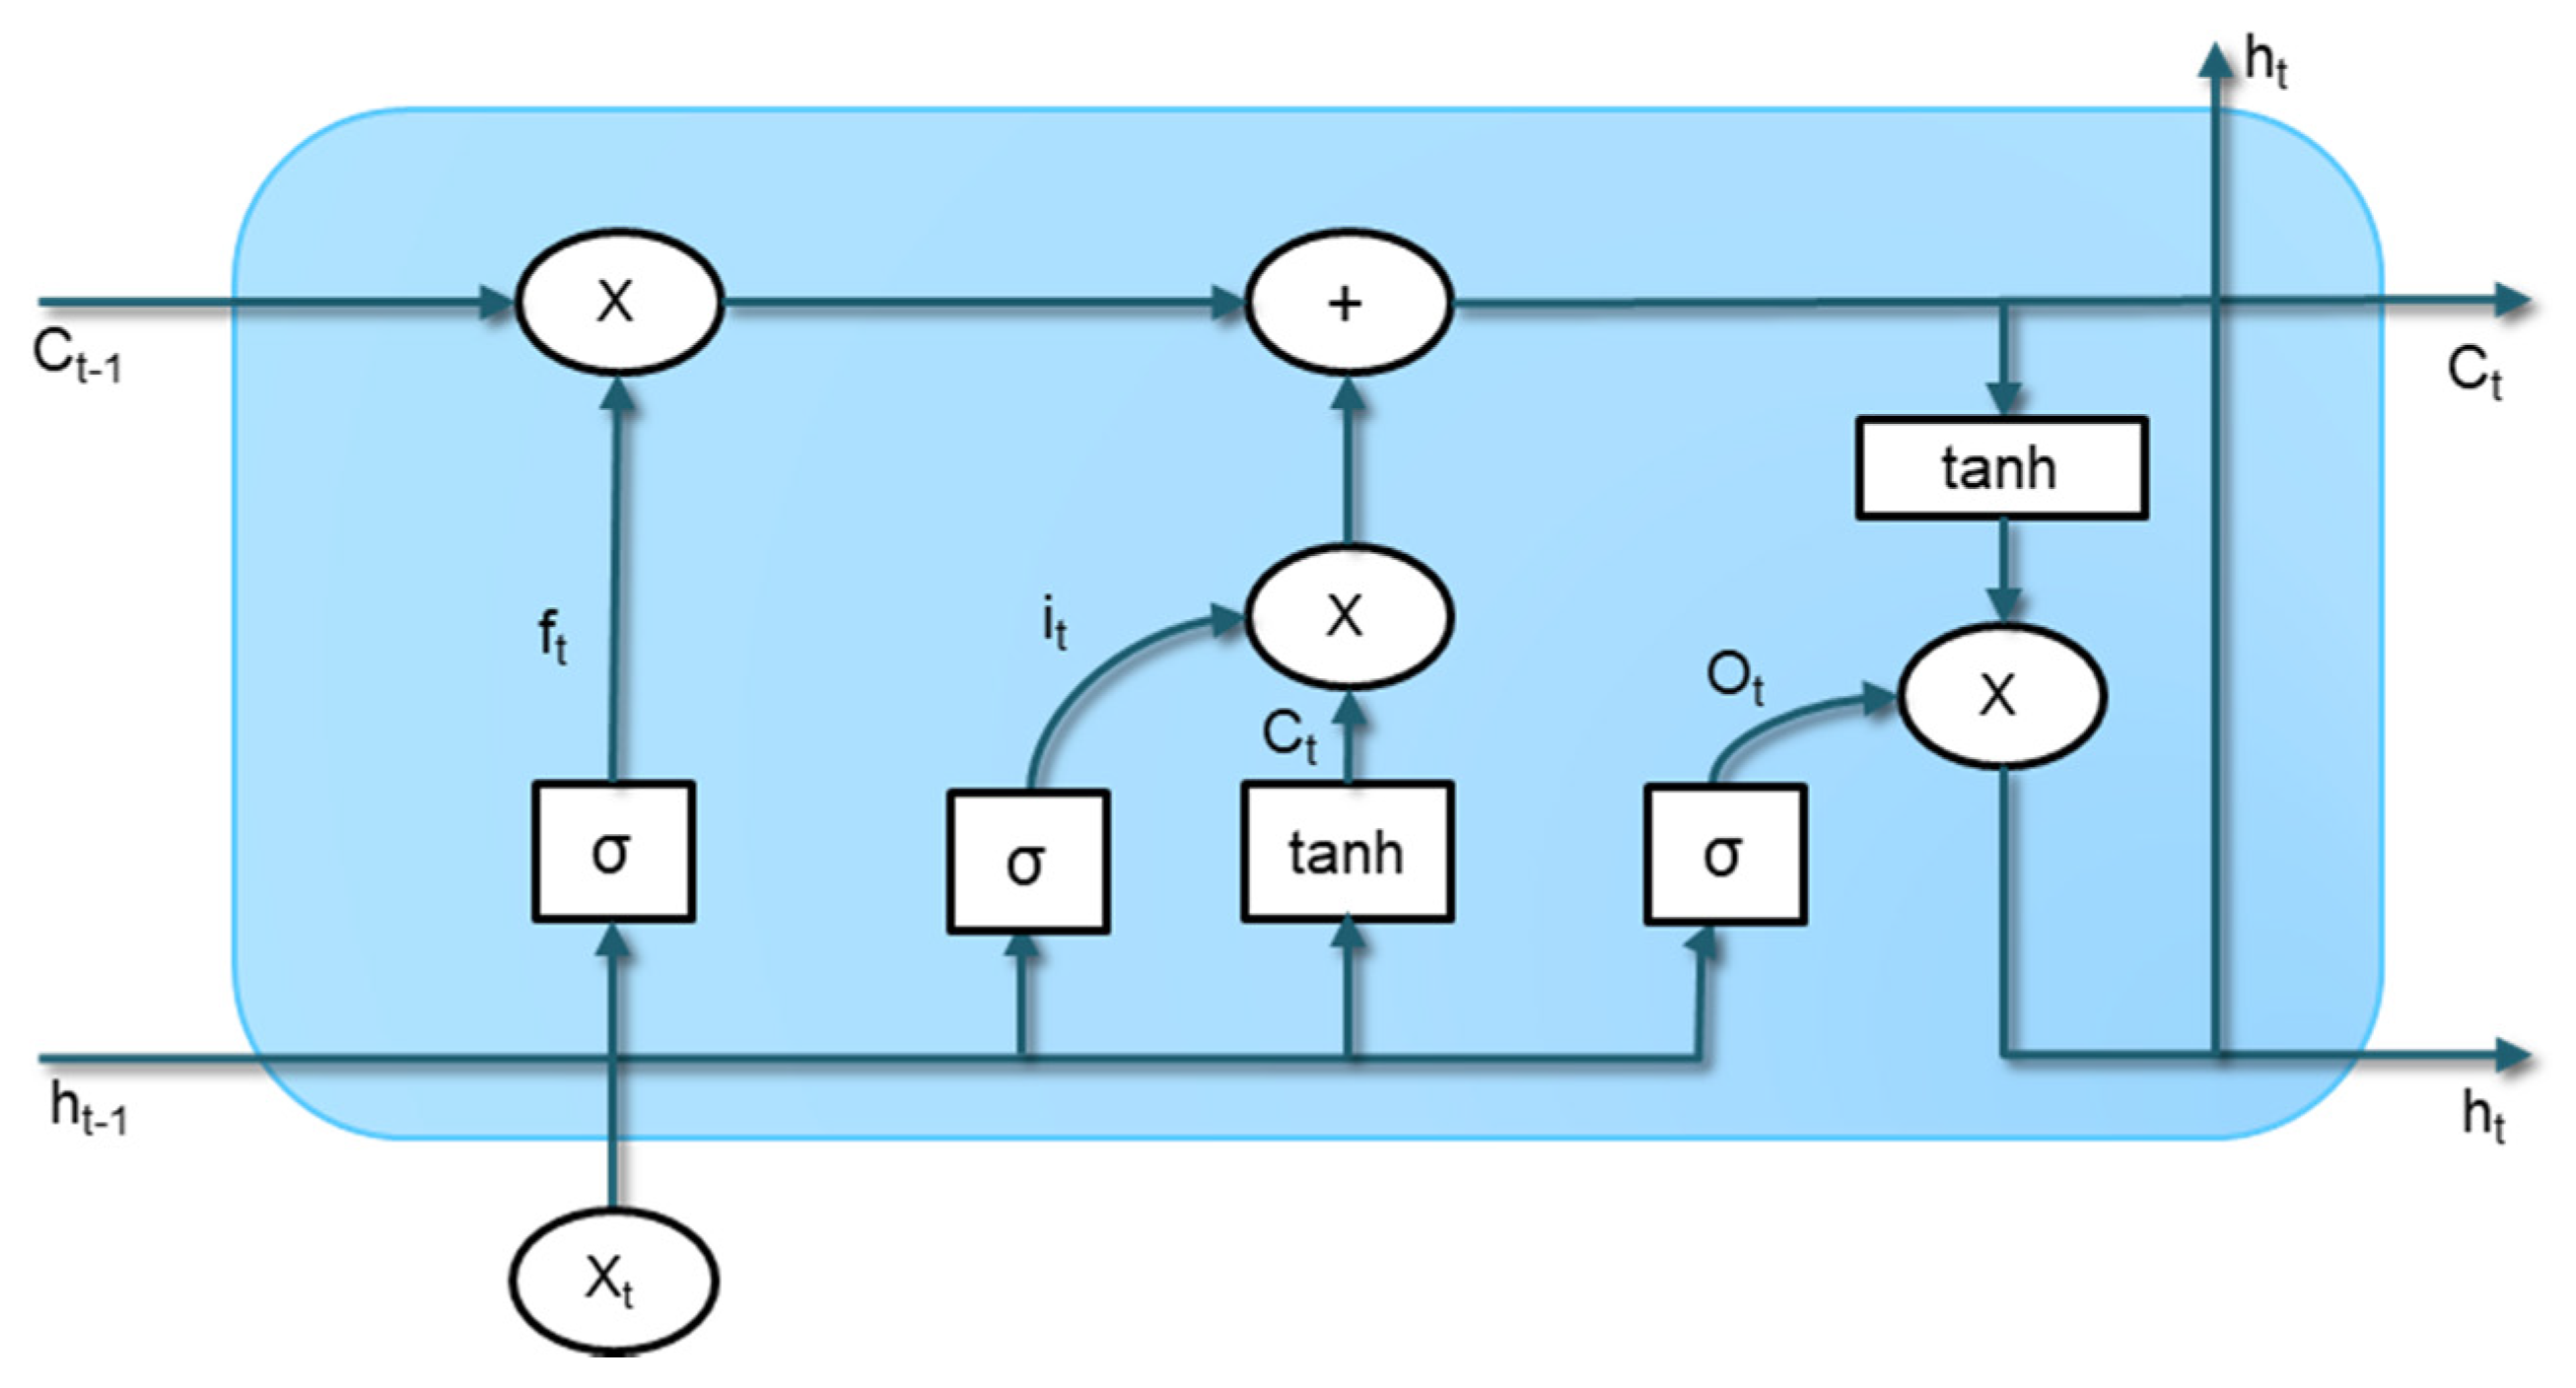
63]. The deep learning model has been configured to 100 epochs with an early stopping parameter setting as used in [64] and in this setting the developed model converged quite well. We evaluate our data quality assessment deep learning models efficiency based on the f-measure, mean absolute error (MAE), root mean square error (RMSE), and Pearson correlation coefficient (PCC) metrics. The deep data quality assessment model average f-measure, MSE, RMSE, and PCC were 0.98, 0.00079, 0.0089, and 0.97 respectively on both applications (i.e., ASC and TMC) semantic data quality assessment. The data quality assessment learning model has been implemented using TensorFlow. In the experimental model, we used a machine with configuration including Intel Core i7 with 3.4 GHz clocked, 32 GB RAM and NVIDIA GeForce GTX configuration.
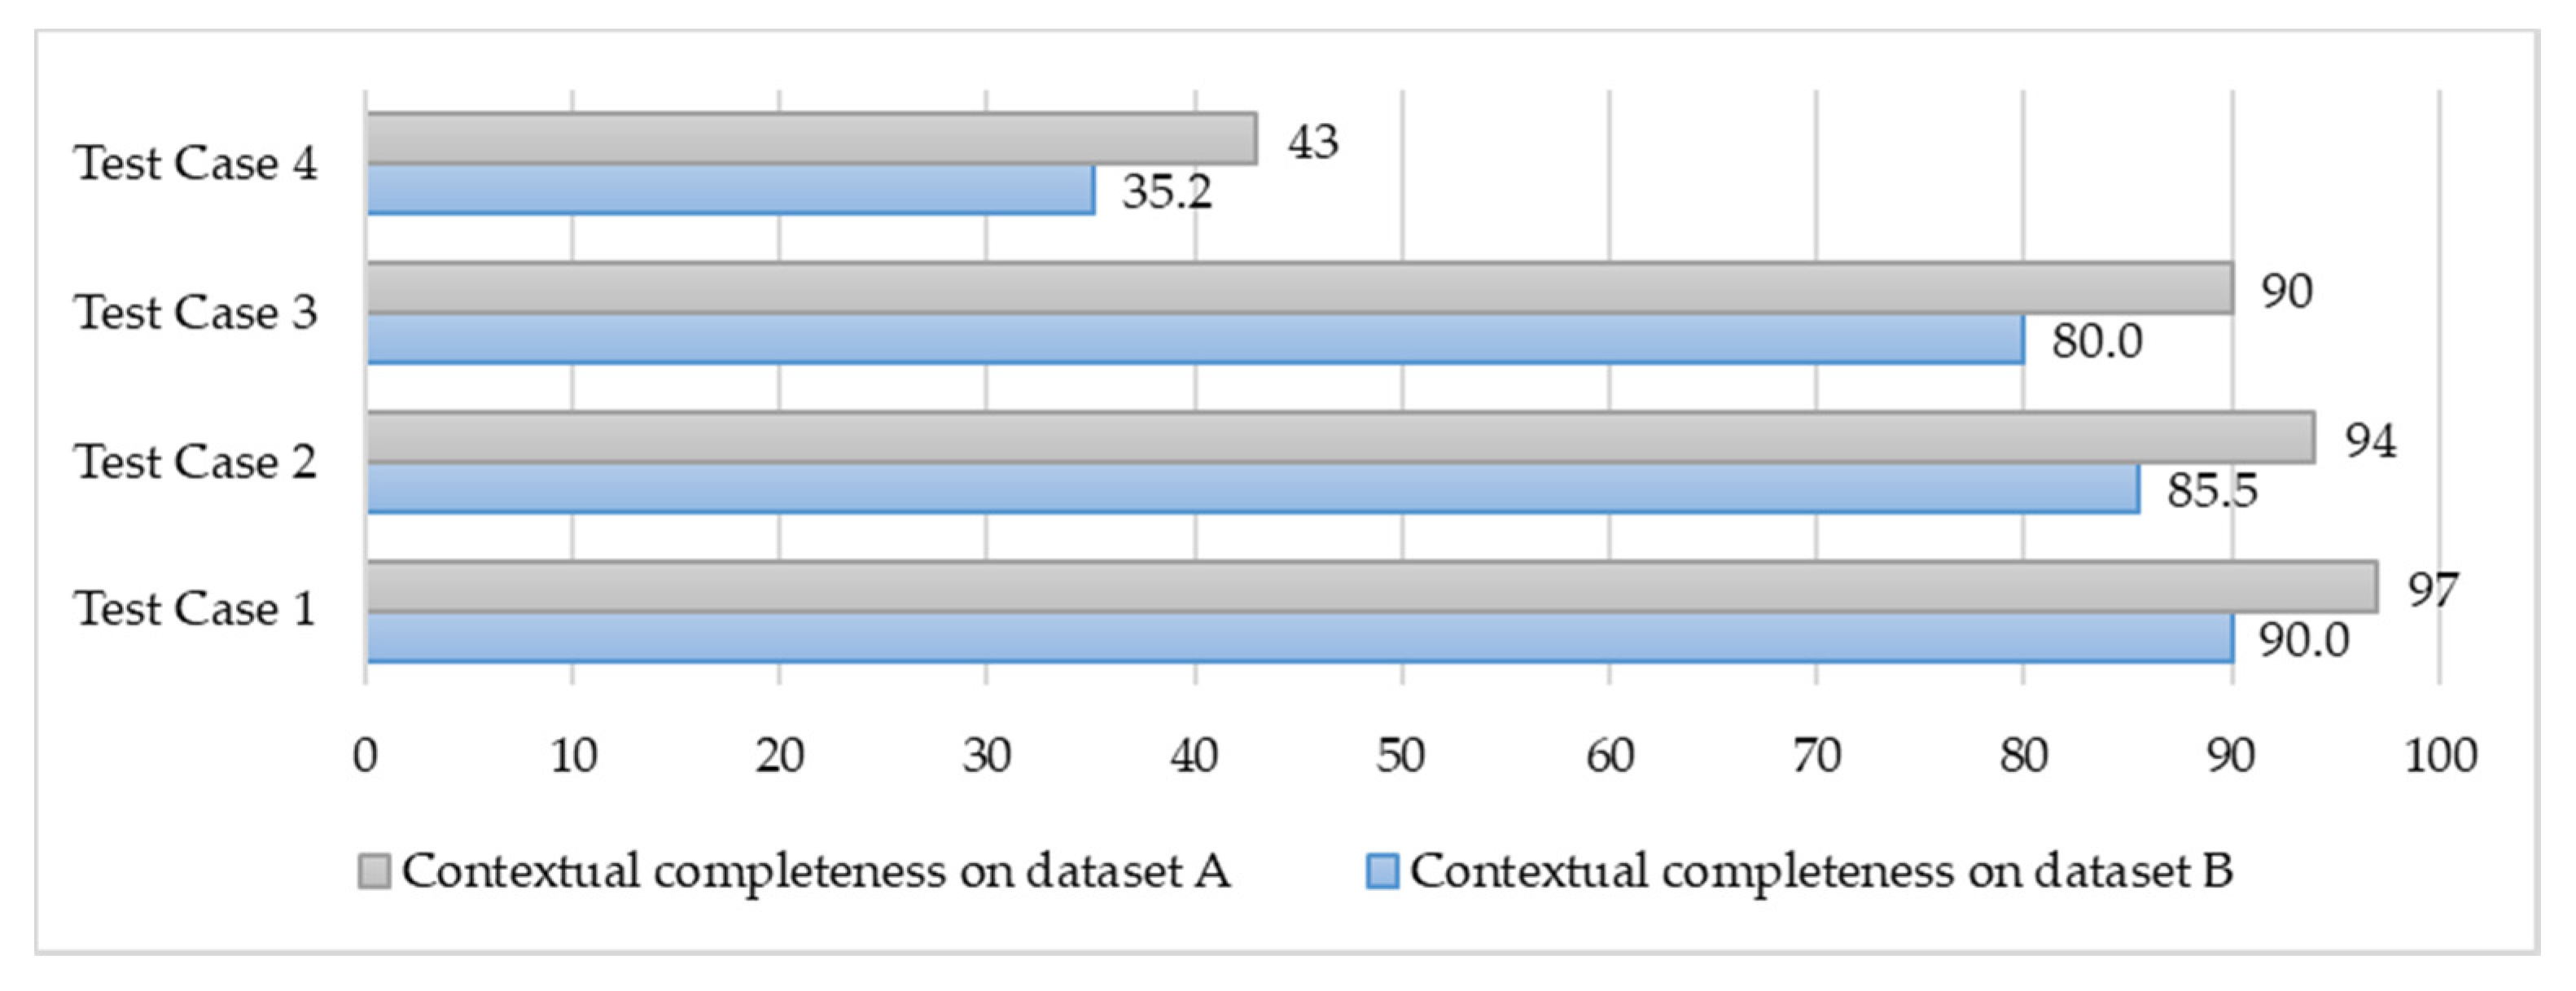
The contextual data quality assessment has been analyzed with aggregated data assessment functions. In the contextual data quality analytics, the VOs (VO_BVP, VO_ECG, VO_Skin_temp, and VO_RES) data have been aggregated and harmonized in a Stress_monitoring_CVO and Mood_monitoring_CVO context by using aggregated assessment function. Therefore, this type of assessment may also be called as aggregated assessment. In Figure 26 the data values at the x-axis show the model prediction capability with respect to four test cases for the ASC application CVOs with semantic data from dataset A and B. For the contextual completeness assessment, the Stress_monitoring_CVO with four VOs data has been analyzed. In the test case one, VO_BVP, VO_ECG, VO_Skin_temp, and VO_RES data have been considered as 100% complete and we received the model learning capability 97% and 90% with dataset A and B respectively. In the second test case, the Stress_monitoring_CVO data reduced to 90% by manipulating 10% of data from all the relevant VOs. In this case, we received 94% and 85.5% model learning capability with dataset A and B respectively. During the third case, the Stress_monitoring_CVO completeness remains at 60% because we intentionally add 40% invalid data with respect to metric parameters. And in this case, we received 90% and 80% results. In the last fourth case, the Stress_monitoring_CVO completeness model learning capability remains at 43% and 35.2% on dataset A and B respectively.
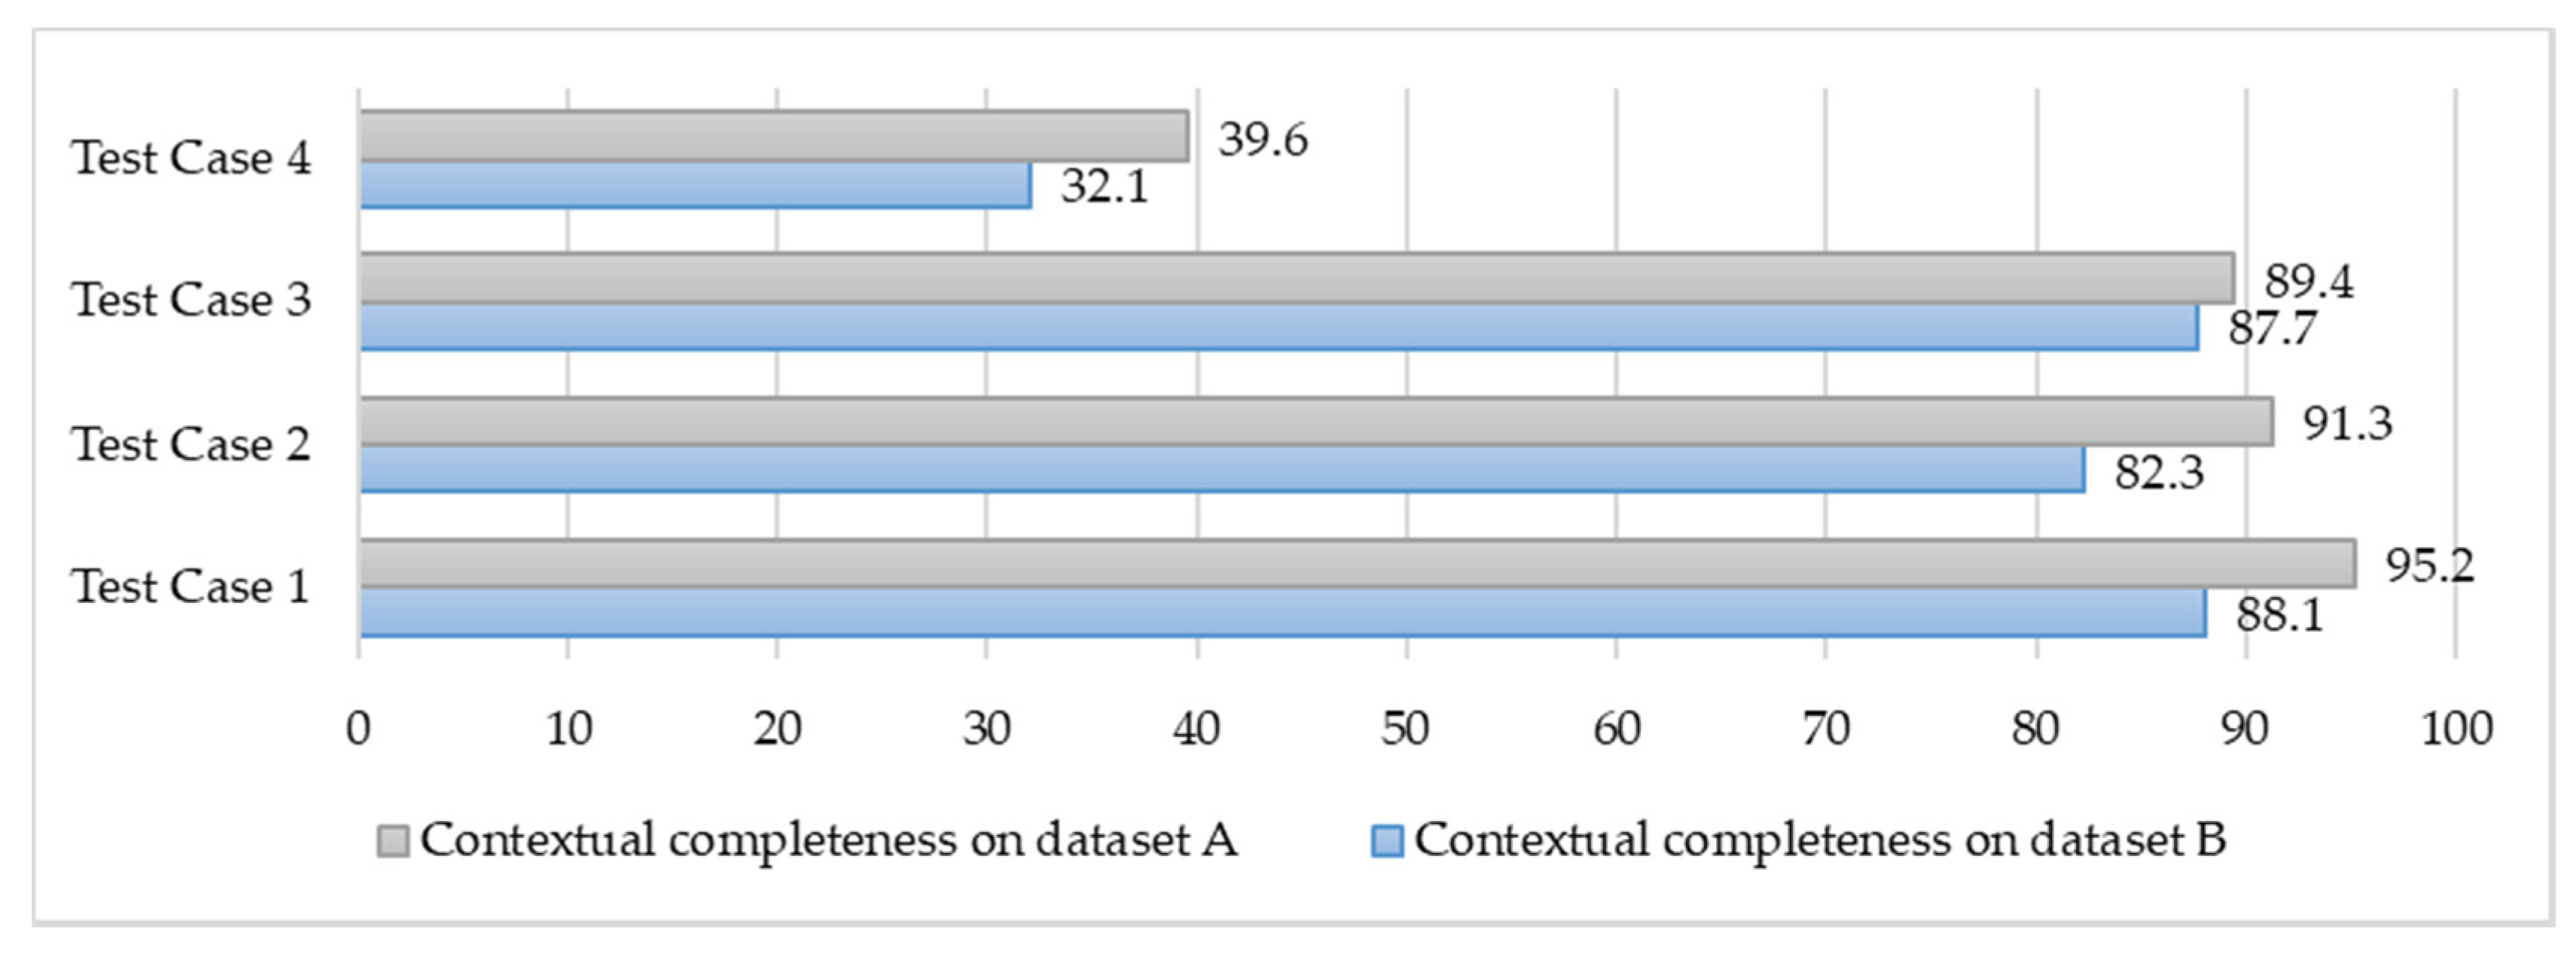
The TMC application’s Mood_monitoring_CVO has been analyzed in the contextual data quality assessment. In the TMC Mood_monitoring_CVO context, VOs (Plus_VO, Skin_temperature_VO, Heart_rate_VO, and Facial_muscle_VO, Blood_presure_VO) data have been aggregated and analyzed simultaneously with a deep learning model. The relevant VOs data for a CVO have been distributed into four test cases as we did for the ASC application, however this time the application ontology is different. As shown in Figure 27, during the contextual analytics we received the highest classification capability as 95.2% and 88.1% with semantic data from dataset A and B respectively. In this case, we used the master dataset along with VOs (Plus_VO, Skin_temperature_VO, Heart_rate_VO, Facial_muscle_VO, and Blood_presure_VO) in the context of Mood_monitoring_CVO ontology. In the second case, the deep learning model was able to detect the Mood_monitoring_CVO completeness with 91.3% and 82.3% on dataset A and B respectively. In the last test case, the model only received detection capability of 39.6% and 32.1% on dataset A and B respectively. Hence, it has been observed that when there are many invalid data quality metric parameters of completeness metric, the contextual quality of Mood_monitoring_CVO has been decreased significantly.
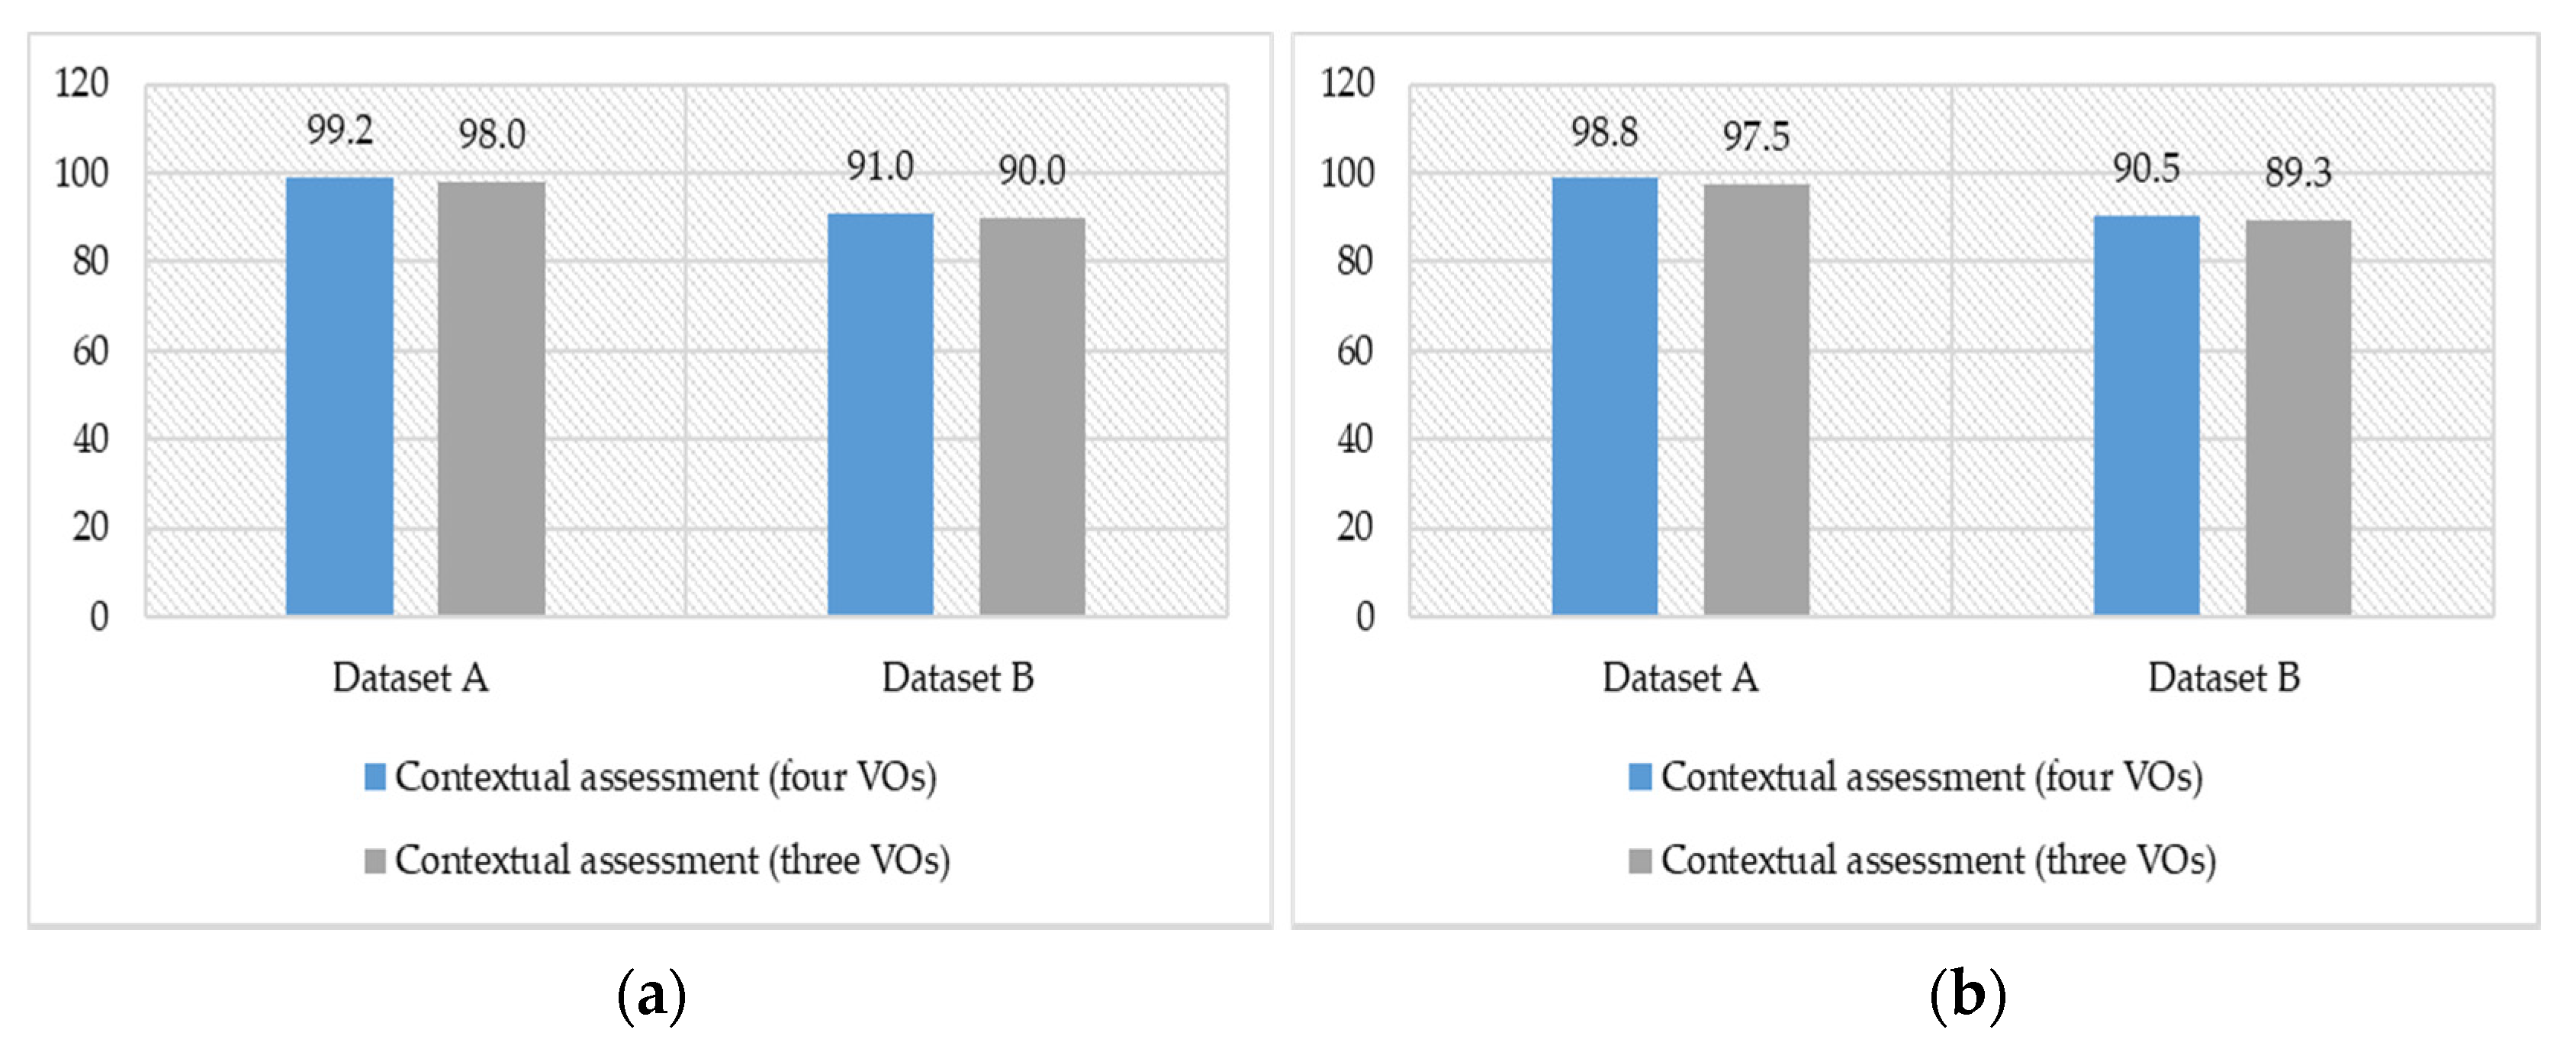
In the second experiment, we applied the appropriate amount of data quality metric parameters and create the representation of semantic data input to the deep learning model. To create the features and data representation of this metric, we applied the aggregated data quality assessment function over the VOs semantic data that have been composed in the CVO context. We also analyzed this metric with four test cases and the average results on both datasets are shown in Figure 28. In this experiment, two sets of CVOs for ASC and TMC applications have been created. The first set of CVOs includes four VOs and the second one received data from the three VOs. For the ASC application set, the model classification quality assessment with four and three VOs was 99.2% and 98.0% on dataset A and 91% and 90% on dataset B respectively. In the TMC application set, the model classification capability with respect to the appropriate amount of data quality metric is 98.8% and 97.5% for three VOs set and four VOs set respectively when the input data was from dataset A.
During the data quality analytics experimentations, the semantic data repositories of VOs, CVOs, and services have been created. The instances of dataset A and B have been transformed and represented as semantic data with VOs and CVOs ontologies [52] and stored in the repositories. Then this data has been collected and analyzed in terms of contextual data quality. The results of semantic data acquisition costs are shown in Figure 29. To demonstrate the features in data acquisition and analytics we simulated semantic data up to 800 CVOs and 1000 VOs. On 600 CVOs and 600 VOs semantic data, the acquisition cost has been observed averagely at 14.45 s and 12.2 s respectively. The data acquisition model for retrieving of VOs and CVOs data have been tested with many concurrent requests by using the Apache HTTP server benchmarking tool [65].
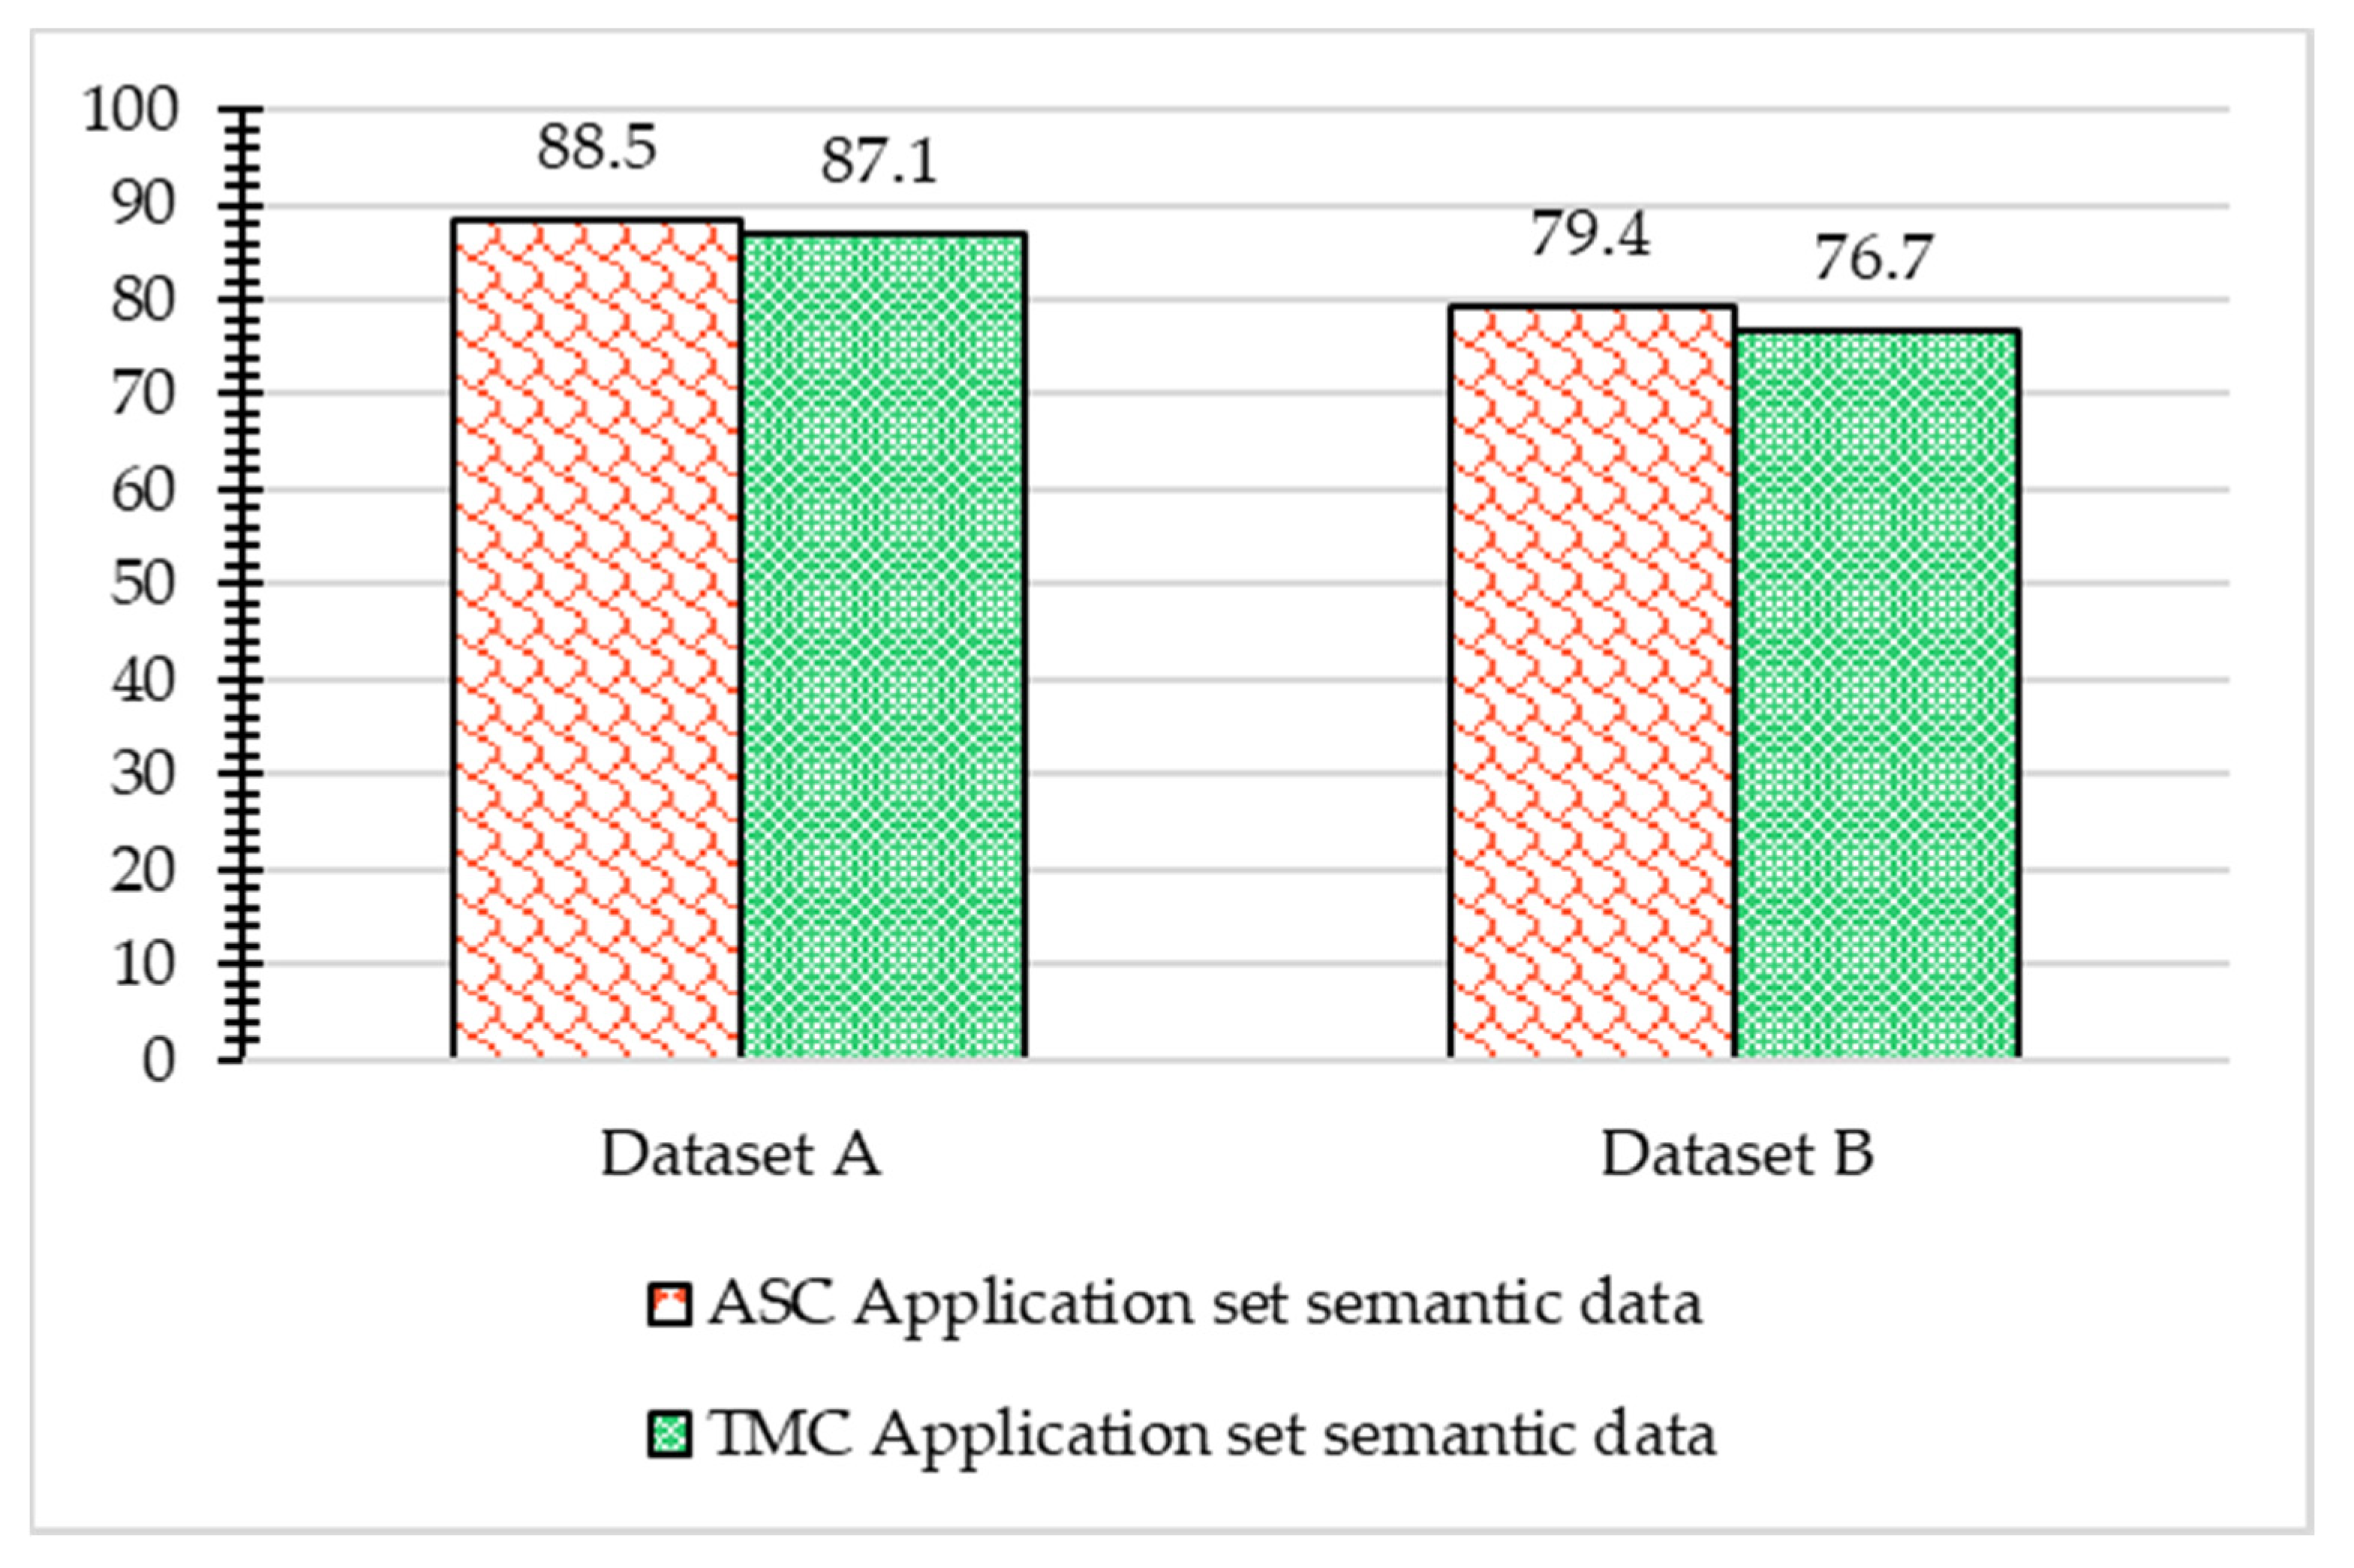
The developed data quality assessment mechanism has also been analyzed with respect to the overall data quality analytics of developed WoO enabled ASC and TMC healthcare applications. The CVOs semantic data of both applications have been evaluated with the incoming data from dataset A and B; The average of all analyzed data quality metric parameters and data transformation and acquisition cost on VOs and CVOs has been considered in the overall data quality of the ASC and TMC applications as shown in Figure 30.
The ASC application VOs and CVOs semantic data quality remains at 88.5% and 79.4% with dataset A and B respectively and for the TMC applications, the data quality was 87.1% and 76.7% respectively. The trend of data quality assessment results of the ASC and TMC application remains the same in all the data quality metric parameters analytics. Assessment results of both applications re different although the data is similar, because both applications are using different ontology set of VOs, and CVOs with respect to the data quality usage context and requirements. The results of our approach prove that once a deep learning model is trained on high quality semantic data, it can be used to classify the incoming data quality for the task in hand. Moreover, when the quality of data decreases to a certain level, the model’s learning quality also decreases.

7. Conclusions

Due to the technological advancement in Internet of Things (IoT) and Artificial Intelligence (AI), a gigantic amount of data is generated, integrated, and analyzed for the provision of services. Similarly, because of the convergence of these state-of-the-art technologies, a healthcare system accumulates data from numerous heterogeneous sources in a large quantity. The efficient usage of this data can increase the impact and improve the healthcare services quality. However, the quality of that data is questionable due to associated risks. The data quality is a multidimensional concept and the exact meaning of quality of data can be perceived in the application context. Therefore, the data quality should be analyzed in the application aspect. To analyze the quality of data we need many data quality metric parameters and mechanisms to find out the relation among the various types of data and its quality requirement. In this article, we proposed the WoO based data quality assessment classification and analytics mechanism with various data quality metric parameters, VOs and CVOs semantic ontologies. The novelty of this article is the development of data quality assessment metric parameters and assessment mechanisms for WoO enabled healthcare applications. Another important contribution is the advanced semantic ontology based data quality analytics at the data acquisition and assessment level. This model supports the learning of data quality analytics for domain applications such as WoO enabled healthcare applications. The functionality of a proposed data quality assessment mechanism can be generalized to other industry domains by incorporating data quality requirements and contextual services threshold values. For this purpose, the same VOs and CVOs ontologies can be reused; however, the data quality assessment business rules should be changed accordingly. The data quality assessment mechanism proposed in this paper is more useful for a noncapital intensive industry rather than a capital intensive industry, because to deploy high quality data sensing nodes and data quality assessment mechanism at the edge level requires a huge investment. In the future, we would like to evaluate the data quality assessment model with other deep learning models such as transfer learning, etc., and the development of a mechanism for the selection of contextual data quality metric parameters automatically based on the nature of incoming data and applications domain.

Author Contributions

The research work was conducted in collaboration with all authors. M.A.J. and I.C. defined the research theme and designed the proposed model; M.A.J. implemented the prototype and wrote the article; M.A.J. and I.C. discussed and evaluated the prototype outcomes. Both authors have thoroughly contributed to reading and validating the manuscript. All authors have read and agreed to the published version of the manuscript.

Funding

This work was supported by the National Research Foundation of Korea (NRF) grant funded by the Korea government (MSIT) (No. 2019R1F1A1063720).

Conflicts of Interest

The authors declare no conflict of interest.

References

  1. Côrte-Real, N.; Ruivo, P.; Oliveira, T. Leveraging internet of things and big data analytics initiatives in European and American firms: Is data quality a way to extract business value? Inf. Manag. 2020, 57, 103141. [Google Scholar] [CrossRef]
  2. Srivastava, D.; Scannapieco, M.; Redman, T.C. Ensuring high-quality private data for responsible data science: Vision and challenges. J. Data Inf. Qual. 2019, 11, 1–9. [Google Scholar] [CrossRef]
  3. Banerjee, T.; Sheth, A. IoT Quality Control for Data and Application Needs. IEEE Intell. Syst. 2017, 32, 68–73. [Google Scholar] [CrossRef]
  4. Friedman, T.; Smith, M. Measuring the Business Value of Data Quality; Gartner: Stamford, CT, USA, 2011. [Google Scholar]
  5. Fox, C.; Levitin, A.; Redman, T. The notion of data and its quality dimensions. Inf. Process. Manag. 1994, 30, 9–19. [Google Scholar] [CrossRef]
  6. Redman, T.; Blanton, A. Data Quality for the Information Age; Artech House Inc.: Norwood, MA, USA, 1997. [Google Scholar]
  7. IDC: The Premier Global Market Intelligence Firm. Available online: https://bit.ly/2uRANkS (accessed on 20 January 2020).
  8. Bad Data Costs the, U.S. $3 Trillion Per Year. Available online: https://bit.ly/2UTaxRM (accessed on 16 February 2020).
  9. Laranjeiro, N.; Soydemir, S.N.; Bernardino, J. A Survey on Data Quality: Classifying Poor Data. In Proceedings of the 2015 IEEE 21st Pacific Rim International Symposium on Dependable Computing (PRDC 2015), Zhangjiajie, China, 18–20 November 2015. [Google Scholar]
  10. Sadiq, S.; Indulska, M. Open data: Quality over quantity. Int. J. Inf. Manag. 2017, 37, 150–154. [Google Scholar] [CrossRef]
  11. Vaziri, R.; Mohsenzadeh, M.; Habibi, J. Measuring data quality with weighted metrics. Total Qual. Manag. Bus. Excell. 2019, 30, 708–720. [Google Scholar] [CrossRef]
  12. Quality | Definition of Quality in English by Oxford Dictionaries. Available online: https://bit.ly/2STiPWX (accessed on 5 January 2020).
  13. Knight, S.; Burn, J. Developing a framework for assessing information quality on the World Wide Web. Inform. Sci. 2005, 8, 160–172. [Google Scholar]
  14. Abdullah, M.Z.; Arshah, R.A. A Review of Data Quality Assessment: Data Quality Dimensions from User’s Perspective. Adv. Sci. Lett. 2018, 24, 7824–7829. [Google Scholar] [CrossRef]
  15. Zaveri, A.; Rula, A.; Maurino, A.; Pietrobon, R.; Lehmann, J.; Auer, S. Quality assessment for Linked Data: A Survey. Semant. Web 2015, 7, 63–93. [Google Scholar] [CrossRef]
  16. Heinrich, B.; Hristova, D.; Klier, M.; Schiller, A.; Szubartowicz, M. Requirements for data quality metrics. J. Data Inf. Qual. 2018, 9, 1–32. [Google Scholar] [CrossRef]
  17. Jarwar, M.A.; Ali, S.; Chong, I. Microservices based Linked Data Quality Model for Buildings Energy Management Services. In Proceedings of the KICS Winter Conference, Pyeongchnag, Korea, 23–25 January 2019. [Google Scholar]
  18. Bertossi, L.; Milani, M. Ontological multidimensional data models and contextual data quality. J. Data Inf. Qual. 2018, 9, 1–36. [Google Scholar] [CrossRef]
  19. Taleb, I.; El Kassabi, H.T.; Serhani, M.A.; Dssouli, R.; Bouhaddioui, C. Big Data Quality: A Quality Dimensions Evaluation. In Proceedings of the 2016 Intl IEEE Conferences on Ubiquitous Intelligence & Computing, Advanced and Trusted Computing, Scalable Computing and Communications, Cloud and Big Data Computing, Internet of People, and Smart World Congress (UIC/ATC/ScalCom/CBDCom/IoP/SmartWorld), Toulouse, France, 18–21 July 2016; IEEE: Piscataway, NJ, USA, 2016; pp. 759–765. [Google Scholar]
  20. Jarwar, M.; Kibria, M.; Ali, S.; Chong, I. Microservices in Web Objects Enabled IoT Environment for Enhancing Reusability. Sensors 2018, 18, 352. [Google Scholar] [CrossRef] [PubMed] [Green Version]
  21. Ali, S.; Jarwar, M.A.; Chong, I. Design Methodology of Microservices to Support Predictive Analytics for IoT Applications. Sensors 2018, 18, 4226. [Google Scholar] [CrossRef] [Green Version]
  22. Jarwar, M.A.; Ali, S.; Chong, I. Microservices model to enhance the availability of data for buildings energy efficiency management services. Energies 2019, 12, 360. [Google Scholar] [CrossRef] [Green Version]
  23. Jarwar, M.A.M.A.; Ali, S.; Kibria, M.G.M.G.; Kumar, S.; Chong, I. Exploiting interoperable microservices in web objects enabled Internet of Things. In Proceedings of the 2017 Ninth International Conference on Ubiquitous and Future Networks (ICUFN), Milan, Italy, 4–7 July 2017; pp. 49–54. [Google Scholar]
  24. Sebastian-Coleman, L. Measuring Data Quality for Ongoing Improvement: A Data Quality Assessment Framework; Elsevier Science: Amsterdam, The Netherlands, 2013; ISBN 0123977541. [Google Scholar]
  25. Carlo, B.; Daniele, B.; Federico, C.; Simone, G. A data quality methodology for heterogeneous data. Int. J. Database Manag. Syst. 2011, 3, 60–79. [Google Scholar] [CrossRef]
  26. Radulovic, F.; Mihindukulasooriya, N.; García-Castro, R.; Gómez-Pérez, A. A comprehensive quality model for Linked Data. Semant. Web 2018, 9, 3–24. [Google Scholar] [CrossRef]
  27. Pipino, L.L.; Lee, Y.W.; Wang, R.Y. Data quality assessment. Commun. ACM 2002, 45, 211. [Google Scholar] [CrossRef]
  28. Batini, C.; Cappiello, C.; Francalanci, C.; Maurino, A. Methodologies for data quality assessment and improvement. ACM Comput. Surv. 2009, 41, 1–52. [Google Scholar] [CrossRef] [Green Version]
  29. Wang, R.Y.; Strong, D.M. Beyond Accuracy: What Data Quality Means to Data Consumers. J. Manag. Inf. Syst. 1996, 12, 5–33. [Google Scholar] [CrossRef]
  30. Karkouch, A.; Mousannif, H.; Al Moatassime, H.; Noel, T. Data quality in internet of things: A state-of-the-art survey. J. Netw. Comput. Appl. 2016, 73, 57–81. [Google Scholar] [CrossRef]
  31. Jarwar, M.A.; Chong, I. Technical Specification D4.4—Framework to support data quality management in IoT. Available online: https://bit.ly/38BuXmd (accessed on 10 January 2020).
  32. Cichy, C.; Rass, S. An Overview of Data Quality Frameworks. IEEE Access 2019, 7, 24634–24648. [Google Scholar] [CrossRef]
  33. Huzooree, G.; Khedo, K.K.; Joonas, N. Data Reliability and Quality in Body Area Networks for Diabetes Monitoring; Springer: Cham, Switzerland, 2019; pp. 55–86. [Google Scholar]
  34. Mylavarapu, G.; Thomas, J.P.; Viswanathan, K.A. An Automated Big Data Accuracy Assessment Tool. In Proceedings of the 2019 IEEE 4th International Conference on Big Data Analytics (ICBDA), Suzhou, China, 15–18 March 2019; pp. 193–197. [Google Scholar]
  35. Ben Amor, L.; Lahyani, I.; Jmaiel, M. Data accuracy aware mobile healthcare applications. Comput. Ind. 2018, 97, 54–66. [Google Scholar] [CrossRef]
  36. Purushotham, S.; Meng, C.; Che, Z.; Liu, Y. Benchmarking deep learning models on large healthcare datasets. J. Biomed. Inform. 2018, 83, 112–134. [Google Scholar] [CrossRef] [PubMed]
  37. Schelter, S.; Lange, D.; Schmidt, P.; Celikel, M.; Biessmann, F.; Grafberger, A. Automating large-scale data quality verification. In Proceedings of the VLDB Endowment, Rio de Janeiro, Brazil, 27–31 August 2018; Volume 11, pp. 1781–1794. [Google Scholar]
  38. Rahman, A.; Smith, D.V.; Timms, G. A novel machine learning approach toward quality assessment of sensor data. IEEE Sens. J. 2014, 14, 1035–1047. [Google Scholar] [CrossRef]
  39. Gürdür, D.; El-khoury, J.; Nyberg, M. Methodology for linked enterprise data quality assessment through information visualizations. J. Ind. Inf. Integr. 2019, 15, 191–200. [Google Scholar] [CrossRef] [Green Version]
  40. Rajan, N.S.; Gouripeddi, R.; Mo, P.; Madsen, R.K.; Facelli, J.C. Towards a content agnostic computable knowledge repository for data quality assessment. Comput. Methods Programs Biomed. 2019, 177, 193–201. [Google Scholar] [CrossRef]
  41. Sundararaman, A. A framework for linking Data Quality to business objectives in decision support systems. In Proceedings of the 3rd International Conference on Trendz in Information Sciences & Computing (TISC2011), Chennai, India, 8–9 December 2011; pp. 177–181. [Google Scholar]
  42. Bicevskis, J.; Bicevska, Z.; Nikiforova, A.; Oditis, I. Towards Data Quality Runtime Verification. In Proceedings of the 2019 Federated Conference on Computer Science and Information Systems, Leipzig, Germany, 1–4 September 2019; pp. 639–643. [Google Scholar]
  43. Data Quality Vocabulary. Available online: https://bit.ly/3bOPrKv (accessed on 2 January 2020).
  44. Universidad Politécnica de Madrid the Quality Model Ontology. Available online: https://bit.ly/2UWk4Y7 (accessed on 1 January 2020).
  45. The Evaluation Result Ontology. Available online: https://bit.ly/2uSQ30H (accessed on 1 January 2020).
  46. Debattista, J.; Lange, C.; Auer, S. daQ, an Ontology for Dataset Quality Information. In Proceedings of the LDOW 2014, Seoul, Korea, 7–11 April 2014. [Google Scholar]
  47. IBM InfoSphere Information Server for Data Quality—Details—United States. Available online: https://ibm.co/321GDMu (accessed on 1 February 2020).
  48. Data Quality Scorecard—measurable data quality with Uniserv. Available online: https://bit.ly/2Huw1ML (accessed on 17 February 2020).
  49. Talend Data Quality—Deliver Trusted Data for The Insights You Need. Available online: https://bit.ly/321Fjt3 (accessed on 18 February 2020).
  50. Data Quality and Data Governance Equal More Business Value | Collibra. Available online: https://bit.ly/3bM4yE8 (accessed on 17 February 2020).
  51. Functional framework of web of objects. Available online: https://bit.ly/3baWEDa (accessed on 2 February 2020).
  52. Kibria, M.G.; Ali, S.; Jarwar, M.A.; Kumar, S.; Chong, I.; Kibria, M.G.; Ali, S.; Jarwar, M.A.; Kumar, S.; Chong, I. Logistic Model to Support Service Modularity for the Promotion of Reusability in a Web Objects-Enabled IoT Environment. Sensors 2017, 17, 2180. [Google Scholar] [CrossRef]
  53. Picard, R.W.; Vyzas, E.; Healey, J. Toward machine emotional intelligence: Analysis of affective physiological state. IEEE Trans. Pattern Anal. Mach. Intell. 2001, 23, 1175–1191. [Google Scholar] [CrossRef] [Green Version]
  54. Sharma, K.; Castellini, C.; van den Broek, E.L.; Albu-Schaeffer, A.; Schwenker, F. A dataset of continuous affect annotations and physiological signals for emotion analysis. Sci. Data 2019, 6, 196. [Google Scholar] [CrossRef] [Green Version]
  55. Lipton, Z.C.; Kale, D.C.; Elkan, C.; Wetzel, R. Learning to Diagnose with LSTM Recurrent Neural Networks. arXiv 2015, arXiv:1511.03677. [Google Scholar]
  56. Chung, J.; Gulcehre, C.; Cho, K.; Bengio, Y. Empirical evaluation of gated recurrent neural networks on sequence modeling. arXiv 2014, arXiv:1412.3555. [Google Scholar]
  57. Karim, F.; Majumdar, S.; Darabi, H.; Harford, S. Multivariate LSTM-FCNs for time series classification. Neural Netw. 2019, 116, 237–245. [Google Scholar] [CrossRef] [PubMed] [Green Version]
  58. Hochreiter, S.; Schmidhuber, J. Long Short-Term Memory. Neural Comput. 1997, 9, 1735–1780. [Google Scholar] [CrossRef]
  59. Lamurias, A.; Sousa, D.; Clarke, L.A.; Couto, F.M. BO-LSTM: Classifying relations via long short-term memory networks along biomedical ontologies. BMC Bioinform. 2019, 20, 10. [Google Scholar] [CrossRef] [Green Version]
  60. Hua, Y.; Zhao, Z.; Li, R.; Chen, X.; Liu, Z.; Zhang, H. Deep Learning with Long Short-Term Memory for Time Series Prediction. IEEE Commun. Mag. 2019, 57, 114–119. [Google Scholar] [CrossRef] [Green Version]
  61. Apache Jena—Triple Store. Available online: https://jena.apache.org/ (accessed on 8 February 2020).
  62. Kuhn, M.; Johnson, K. Applied Predictive Modeling; Springer: New York, NY, USA, 2013; ISBN 978-1-4614-6848-6. [Google Scholar]
  63. James, G.; Witten, D.; Hastie, T.; Tibshirani, R. An introduction to Statistical Learning; Springer Texts in Statistics; Springer: New York, NY, USA, 2013; Volume 103, ISBN 978-1-4614-7137-0. [Google Scholar]
  64. Gal, Y.; Ghahramani, Z. A theoretically grounded application of dropout in recurrent neural networks. In Proceedings of the Advances in Neural Information Processing Systems 29, Barcelona, Spain, 5–10 December 2016. [Google Scholar]
  65. Apache Foundation Apache HTTP Server Benchmarking Tool—Apache HTTP Server Version 2.4. Available online: https://bit.ly/2AbEUXr (accessed on 18 February 2020).
Figure 1. Contextual data quality environment in the healthcare domain.
Applsci 10 02181 g001
Figure 2. Conceptual map of study.
Applsci 10 02181 g002
Figure 3. Layered model of data quality assessment.
Applsci 10 02181 g003
Figure 4. Assessment of aggregated data.
Applsci 10 02181 g004
Figure 5. Intrinsic data quality metric parameters.
Applsci 10 02181 g005
Figure 6. Contextual data quality metric parameters.
Applsci 10 02181 g006
Figure 7. Web objects functional model.
Applsci 10 02181 g007
Figure 8. Web objects based data quality assessment model for semantic data application.
Applsci 10 02181 g008
Figure 9. Value added metric assessment mechanism.
Applsci 10 02181 g009
Figure 10. Relevancy metric learning mechanism.
Applsci 10 02181 g010
Figure 11. Timeliness metric assessment mechanism.
Applsci 10 02181 g011
Figure 12. Completeness metric assessment.
Applsci 10 02181 g012
Figure 13. Appropriate amount of data metric assessment.
Applsci 10 02181 g013
Figure 14. Flow diagram to obtain the features for contextual data quality assessment.
Applsci 10 02181 g014
Figure 15. Sequence diagrams for contextual data quality assessment of semantic data applications.
Applsci 10 02181 g015
Figure 16. Modeling microservices to perform data quality assessment.
Applsci 10 02181 g016
Figure 17. Affective Stress Care (ASC) application Virtual Objects (Vos) and Composite Virtual Objects (CVOs) ontology model.
Applsci 10 02181 g017
Figure 18. ASC CVO ontology OWL/XML code (excerpt view).
Applsci 10 02181 g018
Figure 19. TMC application ontology model classes hierarchy.
Applsci 10 02181 g019
Figure 20. TMC application VOs and CVOs ontology model.
Applsci 10 02181 g020
Figure 21. Semantic dataset A ontology.
Applsci 10 02181 g021
Figure 22. Semantic dataset B ontology.
Applsci 10 02181 g022
Figure 23. Architecture of basic Long Short-Term Memory (LSTM) unit.
Applsci 10 02181 g023
Figure 24. Architecture of designed LSTM-Autoencoder.
Applsci 10 02181 g024
Figure 25. Contextual data quality processing workflow.
Applsci 10 02181 g025
Figure 26. ASC application contextual data quality assessment with respect to completeness aspect.
Applsci 10 02181 g026
Figure 27. Completeness assessment of Teens’ Mood Care (TMC) application semantic data.
Applsci 10 02181 g027
Figure 28. Appropriate amount of data for the ASC (a) and TMC (b) applications CVOs.
Applsci 10 02181 g028
Figure 29. Semantic CVOs (a) and VOs (b) ontological data acquisition cost during the analytics.
Applsci 10 02181 g029
Figure 30. Overall data quality assessment for the ASC and TMC application.
Applsci 10 02181 g030
Table 1. Experimental test cases datasets detail.
Test CaseManipulation PercentageRandom Sample Size of Manipulated DataDescription
Dataset ADataset B
1000The original datasets A and B samples have been used without any manipulation with the ASC and TMC applications VOs and CVOs ontology. It is assumed that VOs and CVOs data quality with respect to contextual metric parameters is 100%.
21012,793.2 5,955,768For the second test case, the 10% data has been randomly selected for the manipulation process and then used with ASC and TMC VOs and CVOs ontologies in the data quality analytic model.
34051,172.823,823,072In the third case, 40% random samples of data dataset A and B have been manipulated with respect to data quality analytic metric parameters and then harmonized with VOs and CVOs ontologies for further data quality analytics using deep learning model.
46076,759.235,734,608Similarly, to analyse VOs and CVOs data quality, we manipulate dataset A and B data up to 60% based on the respective data quality metric parameters.

