Article

Using Virtual Soundwalk Approach for Assessing Sound Art Soundscape Interventions in Public Spaces

by
Tin Oberman
1,2,*,
Kristian Jambrošić
3,
Marko Horvat
3 and
Bojana Bojanić Obad Šćitaroci
1
1
Faculty of Architecture, University of Zagreb, Kačićeva 26, 10000 Zagreb, Croatia
2
UCL Institute for Environmental Design and Engineering, the Bartlett, University College London (UCL), Central House, 14 Upper Woburn Place, London WC1H 0NN, UK
3
Faculty of Electrical Engineering and Computing, University of Zagreb, Unska 3, 10000 Zagreb, Croatia
*
Author to whom correspondence should be addressed.
Appl. Sci. 2020, 10(6), 2102; https://doi.org/10.3390/app10062102
Submission received: 22 February 2020 / Revised: 11 March 2020 / Accepted: 12 March 2020 / Published: 20 March 2020
(This article belongs to the Special Issue Soundscape in Architecture and Urban Planning)

Abstract

:
This paper discusses the soundscape assessment approaches to soundscape interventions with musical features introduced to public spaces as permanent sound art, with a focus on the ISO 12913 series, Method A for data collection applied in a laboratory study. Three soundscape interventions in three cities are investigated. The virtual soundwalk is used to combine the benefits of the on-site and laboratory settings. Two measurement points per location were recorded—one at a position where the intervention was clearly perceptible, the other further away to serve as a baseline condition. The participants (N = 44) were exposed to acoustic environments (N = 6) recorded using the first-order Ambisonics microphone on-site and then reproduced via the second-order Ambisonics system in laboratory. A series of rank-based Kruskal–Wallis tests were performed on the results of the subjective responses. Results revealed a statistically significant positive effect on soundscape at two locations, and limitations related to sound source identification due to cultural factors and geometrical configuration of the public space at one location.

1. Introduction

This study was conducted with the aim to investigate how a range of sound art installation techniques (passive and active) introduced to public spaces can be assessed using the framework outlined by the ISO 12913 Acoustics-Soundscape series and post hoc laboratory listening tests. So far, soundscape interventions have been extensively looked into when introducing natural sounds [1,2,3] or generic music [4,5], while sound-art-focused studies often featured electroacoustic installations commissioned for the research purposes without a detailed report on the acoustic and psychoacoustic characteristics of the very sound sources introduced [6,7,8,9]. On the other hand, it is not always feasible to conduct a soundscape assessment in the design stage. Therefore, this study proposes a simulated soundwalk as a tool for exploring soundscape interventions which are already built, where a baseline condition equivalent is achieved by selecting a measurement point further away from the intervention position.
The ‘soundscape approach’ was developed complementary to the ‘noise mitigation approach’, focused on resolving serious environmental noise issues which affect population health [10] (including sleep disorder [11], learning impairment [12], heart diseases [11,13], increased diabetes risk [14], and annoyance [15]) and economic factors, such as real estate value [16]. Still, the connections between soundscape as a perceptual construct [17] and health effects are under investigated [18]. Quality of urban open spaces is an indicator for quality of city life [19], yet urban spaces are generally highly exposed to urban noise sources, i.e., the streets often being the very source of motor traffic noise, which is also the source which has the highest impact on population’s health [20,21]. On the other side, lowering sound pressure levels were proved to be insufficiently effective for achieving acoustic comfort [22]. For these reasons, analyzing perception of both positive and negative sound sources, overall quality of acoustic environments and its relations with non-auditory factors has been largely investigated within the soundscape discourse [23,24,25]. Recently, it has also been looked into finding means of successfully using qualitative and quantitative indicators to achieve acoustically pleasing spaces [6,26,27].
The psychological tool for soundscape assessment widely spread amongst the soundscape research community is a Swedish Soundscape Quality Protocol (SSQP) [28], built in the Method A for soundscape data collection of the ISO/TS 12913-2:2018 [29,30]. In its structure and concept, it is identical to the SSQP [31]. It was structured to: (1) identify sound source types (human, natural and noise) present by assessing their perceived dominance; (2) define the main perceptual quality of the soundscape in question; (3) define the appropriateness of the acoustic environment to the visual experience; (4) assess the overall quality of the place.
Method A relies on a soundwalk in situ, one of the main soundscape research tools [6,25,26,32]—an act of walking through a setting with a focus on critical listening to the sounds that can be heard there [33]. In an urban environment, its aim is to collect audio data and grasp a mental representation of a city and its public space by combining soundscape with urban morphological features [34,35]. It is used for both quantitative and qualitative analyses, by conducting soundscape assessment questionnaires and sound measurements and recordings, for further analysis [26]. It is considered to provide consistent data across different participant groups and across time [36], while applying approaches such as a two-directional path to reduce bias [37]. It can be conducted on-site [32] or in a simulated environment [38,39].
It is not unusual that public space (especially closed commercial space) contains intentionally added sound sources to influence the mood of passers-by or to enhance its commercial appeal [40]. With cafes and shops entering the competitive urban open space acoustic arena, along with the functional sounds (such as traffic signalization sounds), the issue here is that such acoustic environment is not designed, nor planned as a whole. In such a public space, the whole is instead a by-product, similarly as noise. Even if it includes some musical features, they are often mismatched.
One of the major goals for soundscape planning and design is to achieve congruence between aural stimuli and context within a place [23,41], where a soundscape intervention might be capable of augmenting ‘the pre-existing spirit of place’ [42]. It is considered that learning about the perception of integrally designed urban open spaces with musical features would help defining the key design factors influencing the perceived congruence, i.e., if the perceived acoustic environment is appropriate to the corresponding visual experience.
Most commonly investigated characteristics of musical content in the soundscape research literature are dynamics, tempo, genre, context, and familiarity [43]. They cover approaches such as generic popular music introduced to facilitate activities in public spaces [4,43,44], participatory music selection [5], sound art installations combined with active noise cancellation (ANC) for ‘creative noise masking’ [7] and sound art installations conceived as sonic sculptures [8,45]. However, the theory of music adopted a framework that is looser in categorizing musical content. For instance, John Cage’s 4′33″ piece is a well-known cornerstone of contemporary music featuring musicians performing only tacet [46]. Steve Reich’s tape music, such as the piece entitled Come Out, also relies more on the effect of blurring the boundaries between individual samples by inducing phasing effect between several tape machines as a main tool of musical expression instead of using melody and harmony [47]. The contemporary music of the 20th century often blurred the boundaries which used to define music from other auditory content, or even noise. It may be argued that an (electro)acoustic effect can have an equally important role within a musical piece as the tempo or the melody [48] so they cannot be regarded as an exclusive indicator of musical features. The author’s intent and listener’s willingness might be the only two keys for defining musical features, indeed.
With internet portals, such as ArchDaily or DesignBoom (featuring sections oriented towards reporting new public space projects), revealing a new temporary or permanent design project featuring sound art every few months, more than 100 of such urban open spaces can be recognized all over the world [49] just by using common web browsers. Nearly half of them contain architecturally and/or artistically added sound sources. Amongst them, to mention a few for the purpose of clarity, are the sound system at the Lincoln Square in Miami Beach designed by West 8, sound sculpture at Times Square in New York designed by Max Neuhaus; Sea Organ installation in Zadar designed by Nikola Bašić and Ivan Stamać; sound system-equipped Le Cilyndre Sonore pavilion in Paris designed by Bernhard Leitner; The Federation Bells installation at Birrarung Marr Park in Melbourne designed by Anton Hassel, Neil McLachlan, and Swaney Draper Architects [49].
Musical content, when considered pleasant and if culturally approved, proved to enhance the acoustic comfort in a public space and lower the influence of the sound pressure level (SPL) on perception [5,8,22]. It was showed in in situ experiments (conducted as behavioral observation) how inducing musical features into urban soundscape can mitigate antisocial behavior, reduce loitering and influence the walking speed of passers-by, depending on the characteristics of the musical content [4,50]. Furthermore, it was found out that adding musical features in public spaces changes behavior of people depending on their activity and intent, i.e., extending their stay if they are just strolling around [43]. More specifically, Jambrošić et al. [45] found out that a unique integrally designed soundscape intervention can lead to an almost enthralled assessment, which included the Sea Organ installation in Zadar. Their results showed high ratings of presumably opposite positive soundscape perception descriptors—calmness and excitement. By using laboratory listening tests based on in situ measurements, Oberman et al. [44] acknowledged a significant shift towards ‘positive soundscape descriptors’ when generic music was introduced during the festive season in urban open spaces otherwise monotonous and characterized mainly by traffic noise. Steele et al. [8] acknowledged the positive influence sound art interventions in a public space in Montreal had on the perceived calmness and pleasantness. However, while acoustic and psychoacoustic properties of water features added to public spaces were often in the focus of soundscape researchers [22,51,52], none of the studies reported in depth on the psychoacoustic properties of the added musical sound sources.
Soundscape interventions investigated in literature featured case studies surveyed on-site and others recreated through laboratory simulations, covering both suppressing sounds (i.e., testing different noise barrier characteristics using virtual reality [38]) and adding sound sources. Laboratory studies are generally considered an ecologically valid tool for soundscape assessments per ISO/TS 12913-3: 2019, especially when using Ambisonics reproduction [53,54], despite limitations and concerns raised by some researchers [25]. Moreover, reproduction techniques in laboratory conditions proved to have a negligible effect on the essential soundscape descriptors featured in ISO/TS 12913-2: 2018 [30,55,56].
Some of the above-mentioned studies were looking into the soundscape interventions ‘as they are’ [42,45]. Other were trying to assess their impact by defining a baseline condition and then looking into the conditions such as ‘on and off’/‘with or without’ [44,57], ‘before and after’ [1,7] or comparing different scenarios and exposure conditions [4,5,38,58]. In terms of selecting key conditions, different time frames were featured, spanning from several years between the conditions [36,44] to several minutes in the same time of day [4]. In the case of soundscape interventions that are built as an integral part of an architectural design, perhaps the ‘before and after’ scenario might not be appropriate, as it is implied that context as a whole changes significantly during the design process which would then take the focus away from the acoustic environment. On the other side, some soundscape interventions, such as the Sea Organ in Zadar, cannot be easily switched off. Finding an optimal, most ecologically valid way to assess soundscape interventions remains an open task, crucial for future soundscape planning and design. This study is looking at the effectiveness of a virtual soundwalk approach [39]. In a virtual soundwalk, participants keep a clear understanding of the spatial relation between the measurement points as in a soundwalk in situ, while the research benefits from the convenience and high level of standardization of test conditions ensured in the laboratory environment. This study aims to test:
  • if the SSQP is effective for assessing impact of a soundscape intervention featuring sound art in terms of: (1) sound source identification, (2) perceptual attributes, and (3) appropriateness;
  • if a virtual soundwalk with two measurement points within a single urban open space approach is appropriate to figure as a tool for an experiment featuring baseline and exposure conditions;
  • psychoacoustic properties of sound sources added within the ‘musical soundscape intervention’ in an urban open space.

2. Materials and Methods

2.1. Selected Urban Open Spaces

Three case study sites were chosen to reflect a variety of approaches to interpretation of soundscape interventions with musical features. The musical features investigated include traditional harmonies (location A: Obala Petra Krešimira IV seaside promenade in Zadar, Croatia), a synthesized cluster chord (location B: Kunsthaus Graz plaza in Graz, Austria;) and an architecturally designed echo effect (location C: Maksimir Park in Zagreb, Croatia). The soundscape intervention at locations A and C are fully dependent on the environmental conditions (A) and users (C) and driven by them so they do not require electrical power to work, while the sound art installation at the location B functions much more independently in relation to the context but requires a constant power supply.
The three urban open spaces chosen for this study were considered to be integrally designed as a “soundscape application” in the initial phase of the architectural and/or urban design. All three sites were considered to be attractive and well used public spaces. The analyzed projects were not conceived as a noise mitigation measure and the sites were not treated for lowering the noise level in the time of the recordings. The sites and the locations of the measurement points are shown in the Figure 1.
Two selected urban open spaces are situated in a historical city centre (Zadar and Graz) and were designed within its revitalization (Graz) and reconstruction (Zadar) plans. One of the selected urban open spaces—Maksimir Park in Zagreb—is the cultural heritage site, a historical park located 1.9 km east to the historical center. All three locations are typologically different (a seaside promenade, an urban park, and a museum plaza) and they significantly differ in their area size, but they all feature a measurement point with clearly perceptible musical elements, as shown in Figure 2.

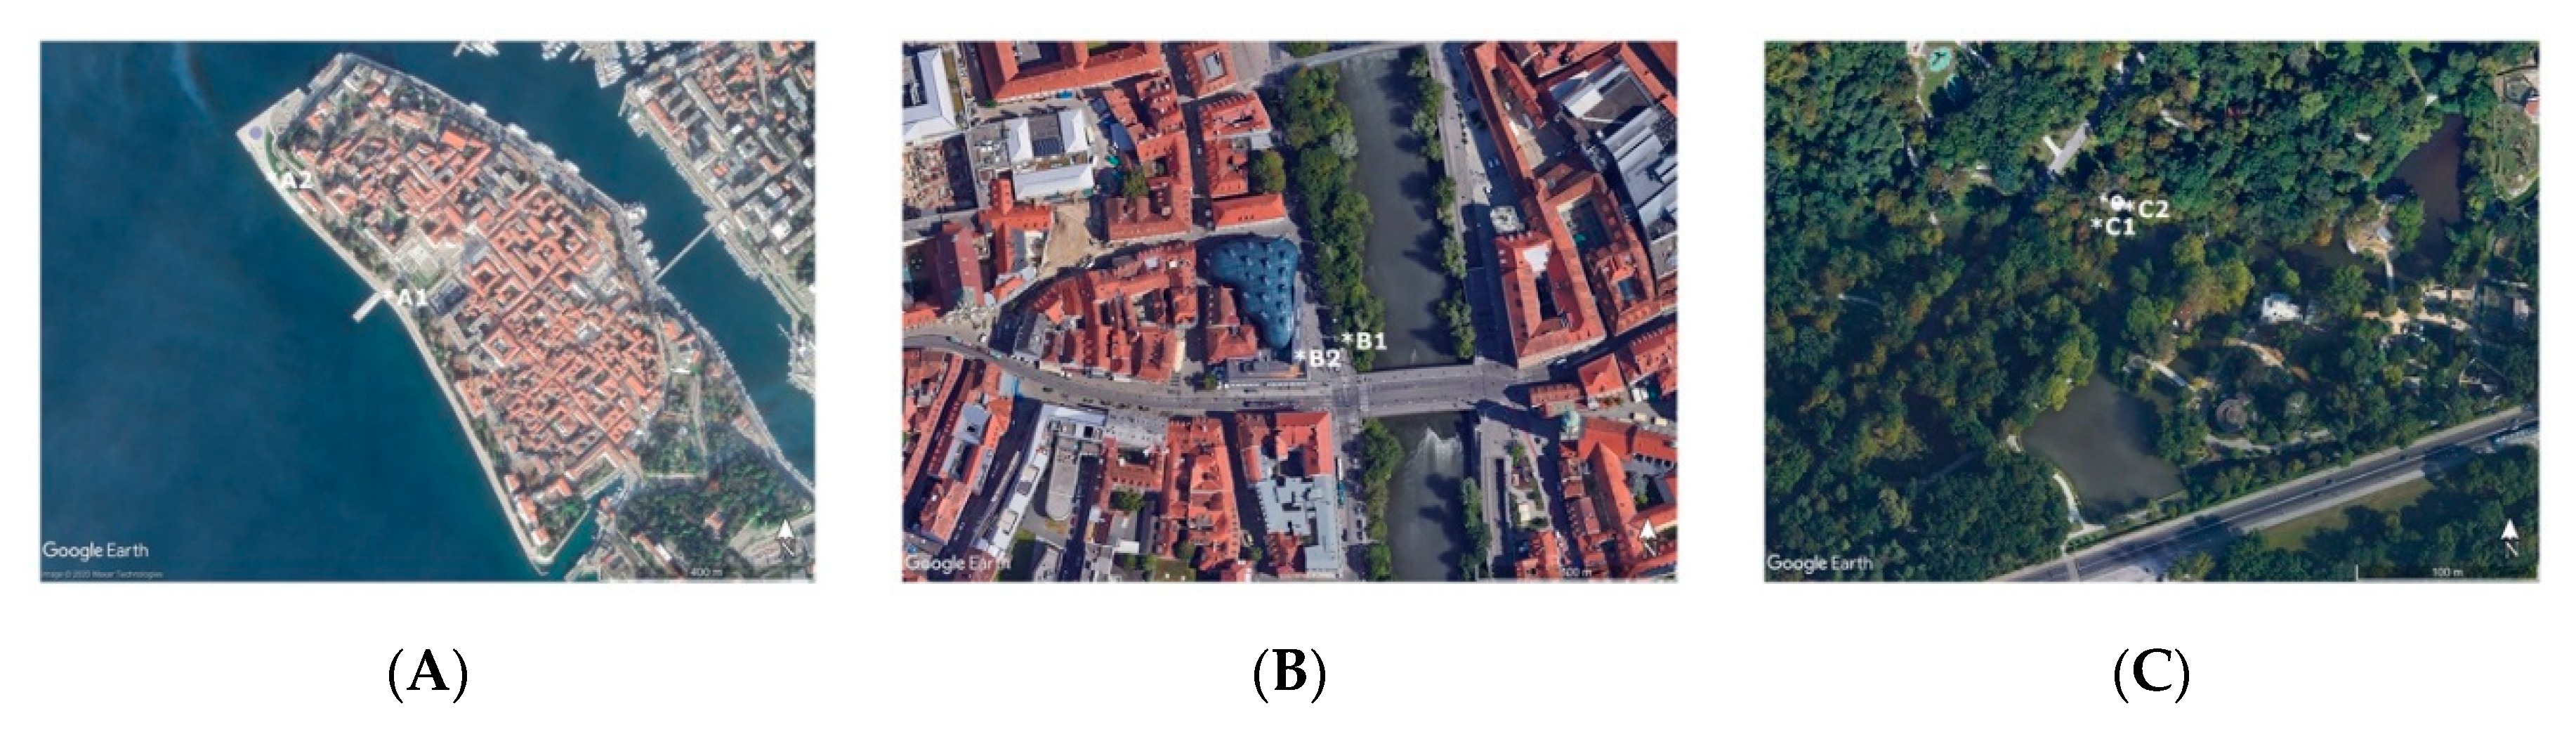
2.1.1. Obala Petra Krešimira IV, Zadar (Location A)

Obala Petra Krešimira IV seaside promenade is situated along the southern waterfront of the cca. 54 ha large Zadar peninsula which is continuously inhabited since the 9th century BCE. The installation was designed within the promenade revitalization project and can be considered a revitalization of the northern top of the historical city center that was neglected during the reconstruction conducted after the World War II.
The Sea Organ - Morske orgulje, is an architectural installation conceived as a wave driven organ. It is located at the northern end of the Obala Petra Krešimira IV seaside promenade. This mechanical sound art installation with musical features is based on sound sources—organ pipes which are hidden under the stone pavement, played by the sea waves similar to the way of the blues harp [59]. The resulting sound is highly dependent in dynamics on the movement of waves caused by the wind and the sea traffic, while its pitch is fixed by the design of the pipes.
The Sea Organ project was developed as a cooperation between architectural studio Nikola Bašić, acoustician and composer Ivan Stamać, and organ restoration company Heferer [59]. It was built between 2005 and 2008 and it quickly became one of the city’s landmarks [60,61]. The design was chosen at a public design competition held in 2004 by the City of Zadar and the Port authority of Zadar). One of the prime reasons for the project was the design of a new dock for cruise ships as a new attractive entry point into the historic city.
The installation produces organ-like sounds designed to play continuous endless harmonic progression between G major and C major with added sixth in the range between 65 Hz and 250 Hz [45].
This urban open space illustrates: (1) application of the principle of adding desirable soundscape components to an urban open space (acoustic sound art installation of the Sea Organ), (2) application of principles of promoting an existing desirable component of a sound environment (sounds of the sea and waves), (3) impact of laws and regulations on noise mitigation in Croatia and the standard ISO 1996-1: 2003 [62] on the integral design (orientation of organ pipes of the acoustic installation towards the sea instead to the city and shaping of the triangle resting area influenced by the nearby residential building) [63].

2.1.2. Kunsthaus Graz, Lendkai, Graz (Location B)

The electroacoustic sound art installation with musical features—Time Piece Graz is located at the Kunsthaus Graz contemporary art museum site. The electro acoustic system is placed on the roof of the museum, intended to be heard in the adjacent plaza and street, and the neighboring riverbank [64]. Permanent electro acoustic art installation was conceived with the aim of playing a synthesized sound for 5 min every hour regardless of the changing external factors. It is a sound art piece by Max Neuhaus—Time Piece Graz designed for a large public space [65]. The track contains a continuous crescendo of one tone cluster roughly between 92 Hz and 352 Hz, as observed in the spectrogram shown in Figure 2. In 2004, it was reprogrammed so its schedule fits the requirements of the law on noise mitigation (the installation is silent between 21:50 and 8:50) [64].
The museum was built from 1999 until 2003 for the Kulturstadteuropas campaign in 2003 as a part of the revitalization of the historical city center. The design was chosen at a public design competition. The sound art installation is a product of the cooperation between architectural studio Fournier & Cook and sound artist Max Neuhaus.
South end of the Lendkai street and promenade at the joint with bridge Hauptbrücke is visually and aurally emphasized by the unusual corner building of the museum of modern art Kunsthaus Graz. The electroacoustic system placed on the rooftop of the prominent part of the volume of the museum (the so-called Needle; the unusual architectural composition consists of three components: the iron house—existing building originally constructed in 1848, the bubble—distinctive rounded glass structure, the needle—elongated volume ‘hovering’ over the plaza and the street) contains the sound source directed at the immediate urban area [66].
The museum building is located on the crossroad, with one of the streets featuring tram lines and the other (one-way) car lanes. The second road, Lendkai features a river side promenade and densely planted high trees. Next to the promenade, down below is the river Mur, classified as a mountainous river [67], usually generating loud water sound.

2.1.3. Pavilion of Echo(es) in Maksimir Park, Zagreb (Location C)

The Pavilion of Echo(es)—Paviljon Jeka, is situated in the large 19th century urban park Maksimir in Zagreb. Acoustical effect of flutter echo of 78 ms (as observed on the spectrogram in Figure 2) was designed to be experienced within the pavilion. Sound sources in the strict sense are passers-by themselves. Sound source of the (so-called ‘wet’) effect itself can be considered the floor and the ceiling of the pavilion which are causing the echo.
The historical urban park was situated on the outskirts of the 19th century Zagreb, on the grounds owned by the archdiocese of Kaptol. It was conceived by the archbishop Maksimilijan Vrhovac in the late 18th century and finished during the archbishop Juraj Haulik in the first half of the 19th century. Although being an episcopal park, the archbishop Haulik had intended it for public use [68]. It is characterized by large forest areas and several lakes. Nowadays, it is a protected cultural heritage site and it hosts a zoo in its southern part.
The Pavilion of Echoes itself was built in 1840 by the design of Franz Schücht, Austrian architect, most probably according to the Haulik’s plan, which is lost. It is placed next to the main path leading from the main entrance to the Belvedere (Kiosk), which is the focal point of the park’s floor plan/composition [69]. One of the many park’s footpaths leads from the aforementioned main axis, through the Pavilion of Echoes to the main entrance in the Zoo.
The pavilion was restored in 1986 and later in 2001 by an interdisciplinary team. The reconstruction of the echo effect was the prime goal of the restoration since the effect was lost after the first restoration [70].

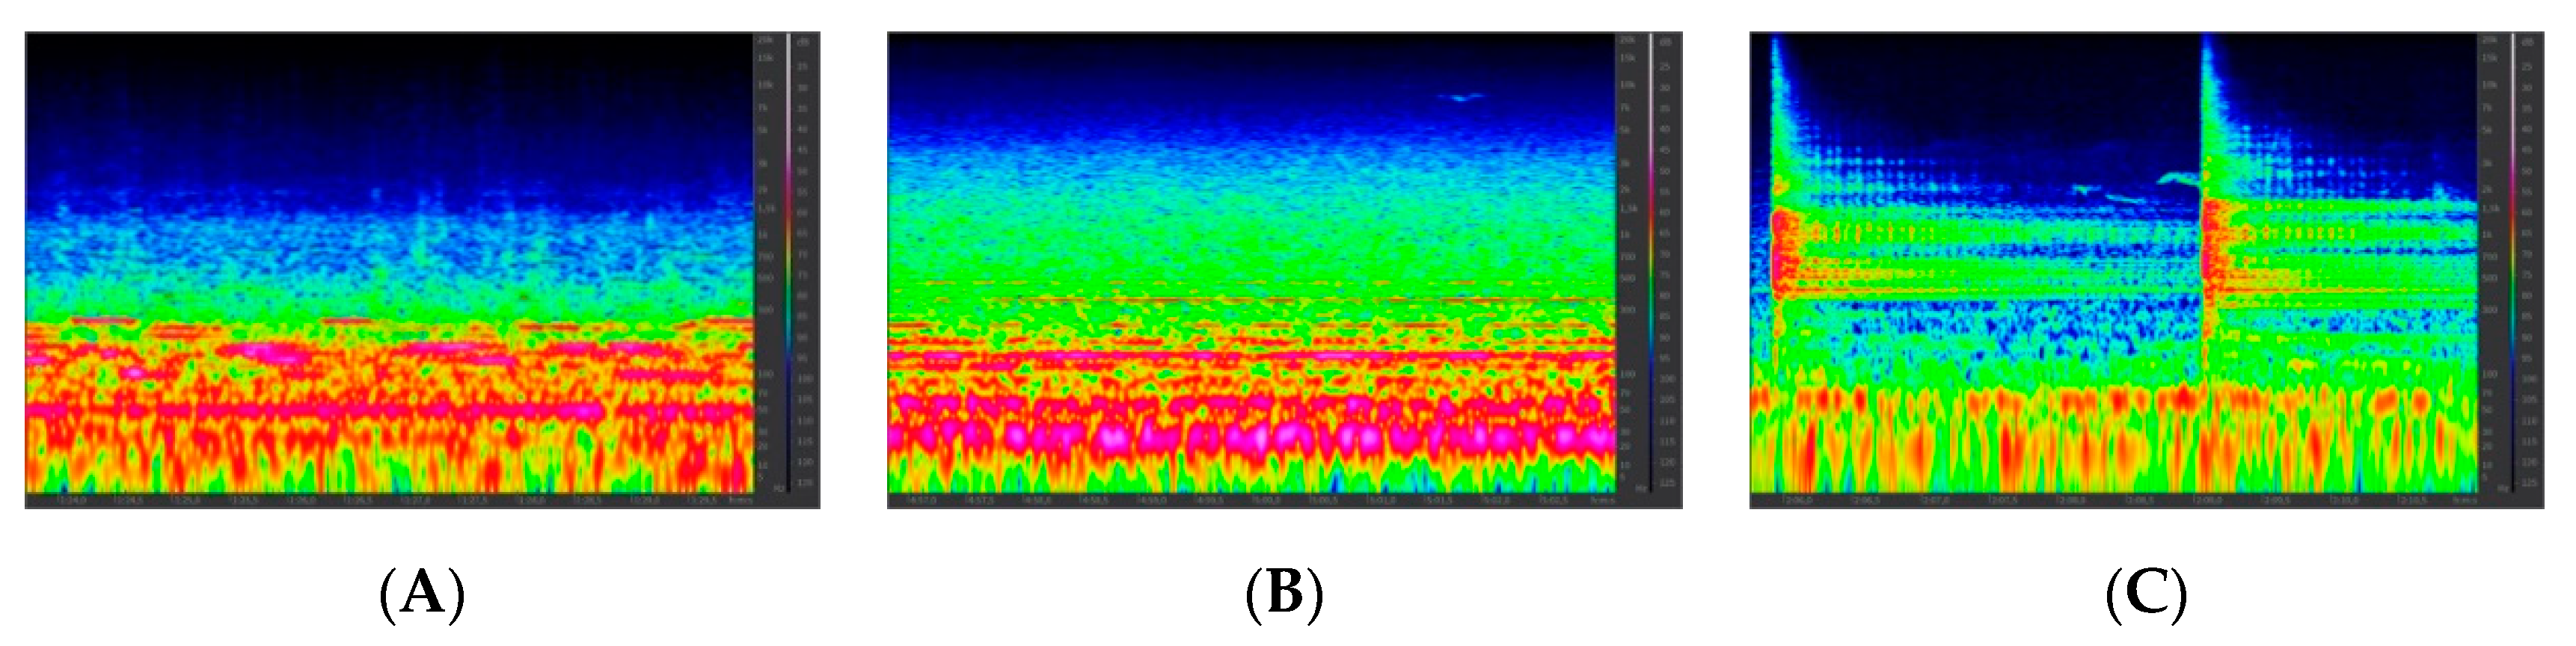
2.2. Field Recordings and Measurements

The on-site collection of the data on the acoustic environment consisted of environmental noise measurements, three-dimensional audio recordings and panoramic pictures, intended for laboratory use, as recommended by the ISO/TS 12913-3: 2019 and applied in recent soundscape studies [39,71,72,73]. The soundscape assessments were made in laboratory conditions. Quantitative analysis was performed using the ArtemiS psychoacoustic analysis software, while the qualitative one was based on listening experiments in Auralization laboratory conducted using the questionnaire based on the SSQP (Appendix B) and the virtual soundwalk approach. The semantic differential method was chosen due to the built-in relation with the component model for soundscape quality prediction based on connection between types of sound sources and soundscape perception descriptors by Axelsson et al. [74]. A series of rank-based Kruskal–Wallis tests was performed as the non-parametric equivalent of one-way ANOVA on the results of the subjective responses to determine the statistical significance of the subjective responses, looking at the difference between the ‘baseline’ and ‘intervention’ conditions.
Field recordings and measurements were conducted as a part of the monitoring of the selected urban open spaces within the framework of a wider research project. The recordings used for the research in the Auralization laboratory were made in the early afternoons as reported in the Table 1. Weather conditions at the time of the recordings were within the following span: 10 degrees Celsius, wind 6 km/h, partially cloudy; 20 degrees Celsius, wind 9 km/h and sunny.
Ten-minute intervals were recorded in order to capture usual sonic event circles (containing several road traffic circle exchanges) [33]. All analyzed sound sources produced sounds characterized by different temporal alterations: (1) Sea Organ were continuous during the whole recording due to the consistent wind speed; (2) Time Piece Graz repeats itself hourly, lasting for five minutes; (3) the echo effect in Maksimir depends entirely on impulse sounds generated within the pavilion. Five-minutes-and-15-seconds-long excerpts were selected from each recording as the only predefined factor was the designed length of the sound art piece in Graz (five minutes).

2.2.1. Equipment Used

Recording system consisted of: (1) battery powered six-channel recorder (model Tascam DR 680), set for recording at 24 bit/44.1 kHz; (2) first-order Ambisonics (FOA) microphone, model Core Sound TetraMic, (3) measurement condenser omnidirectional microphone, (4) microphone stand set at the approximate height of average listener’s ears (150–160 cm) and (5) sound level calibrator, model ND9. The FOA recording was intended for listening tests, while the calibrated monaural recording was intended for quantitative analyses.
At every measuring point, the visual setting was documented by digital panoramic photographs taken using the smartphone device, model iPhone 5. The process of shooting photos admittedly does not allow visual capturing of every mobile sound source (i.e., passers-by and vehicles), such as would be the case with the video recording, but it provides insight into the analyzed ambiance/environment and key non-auditory factors such as presence of foliage or people. The photos were taken at the measurement points about the same place and height as where the microphone capsules were positioned. Panoramic photos were used for the tests in the Auralization laboratory, on the basis of which respondents gave an opinion on the appropriateness of the related sound environment.

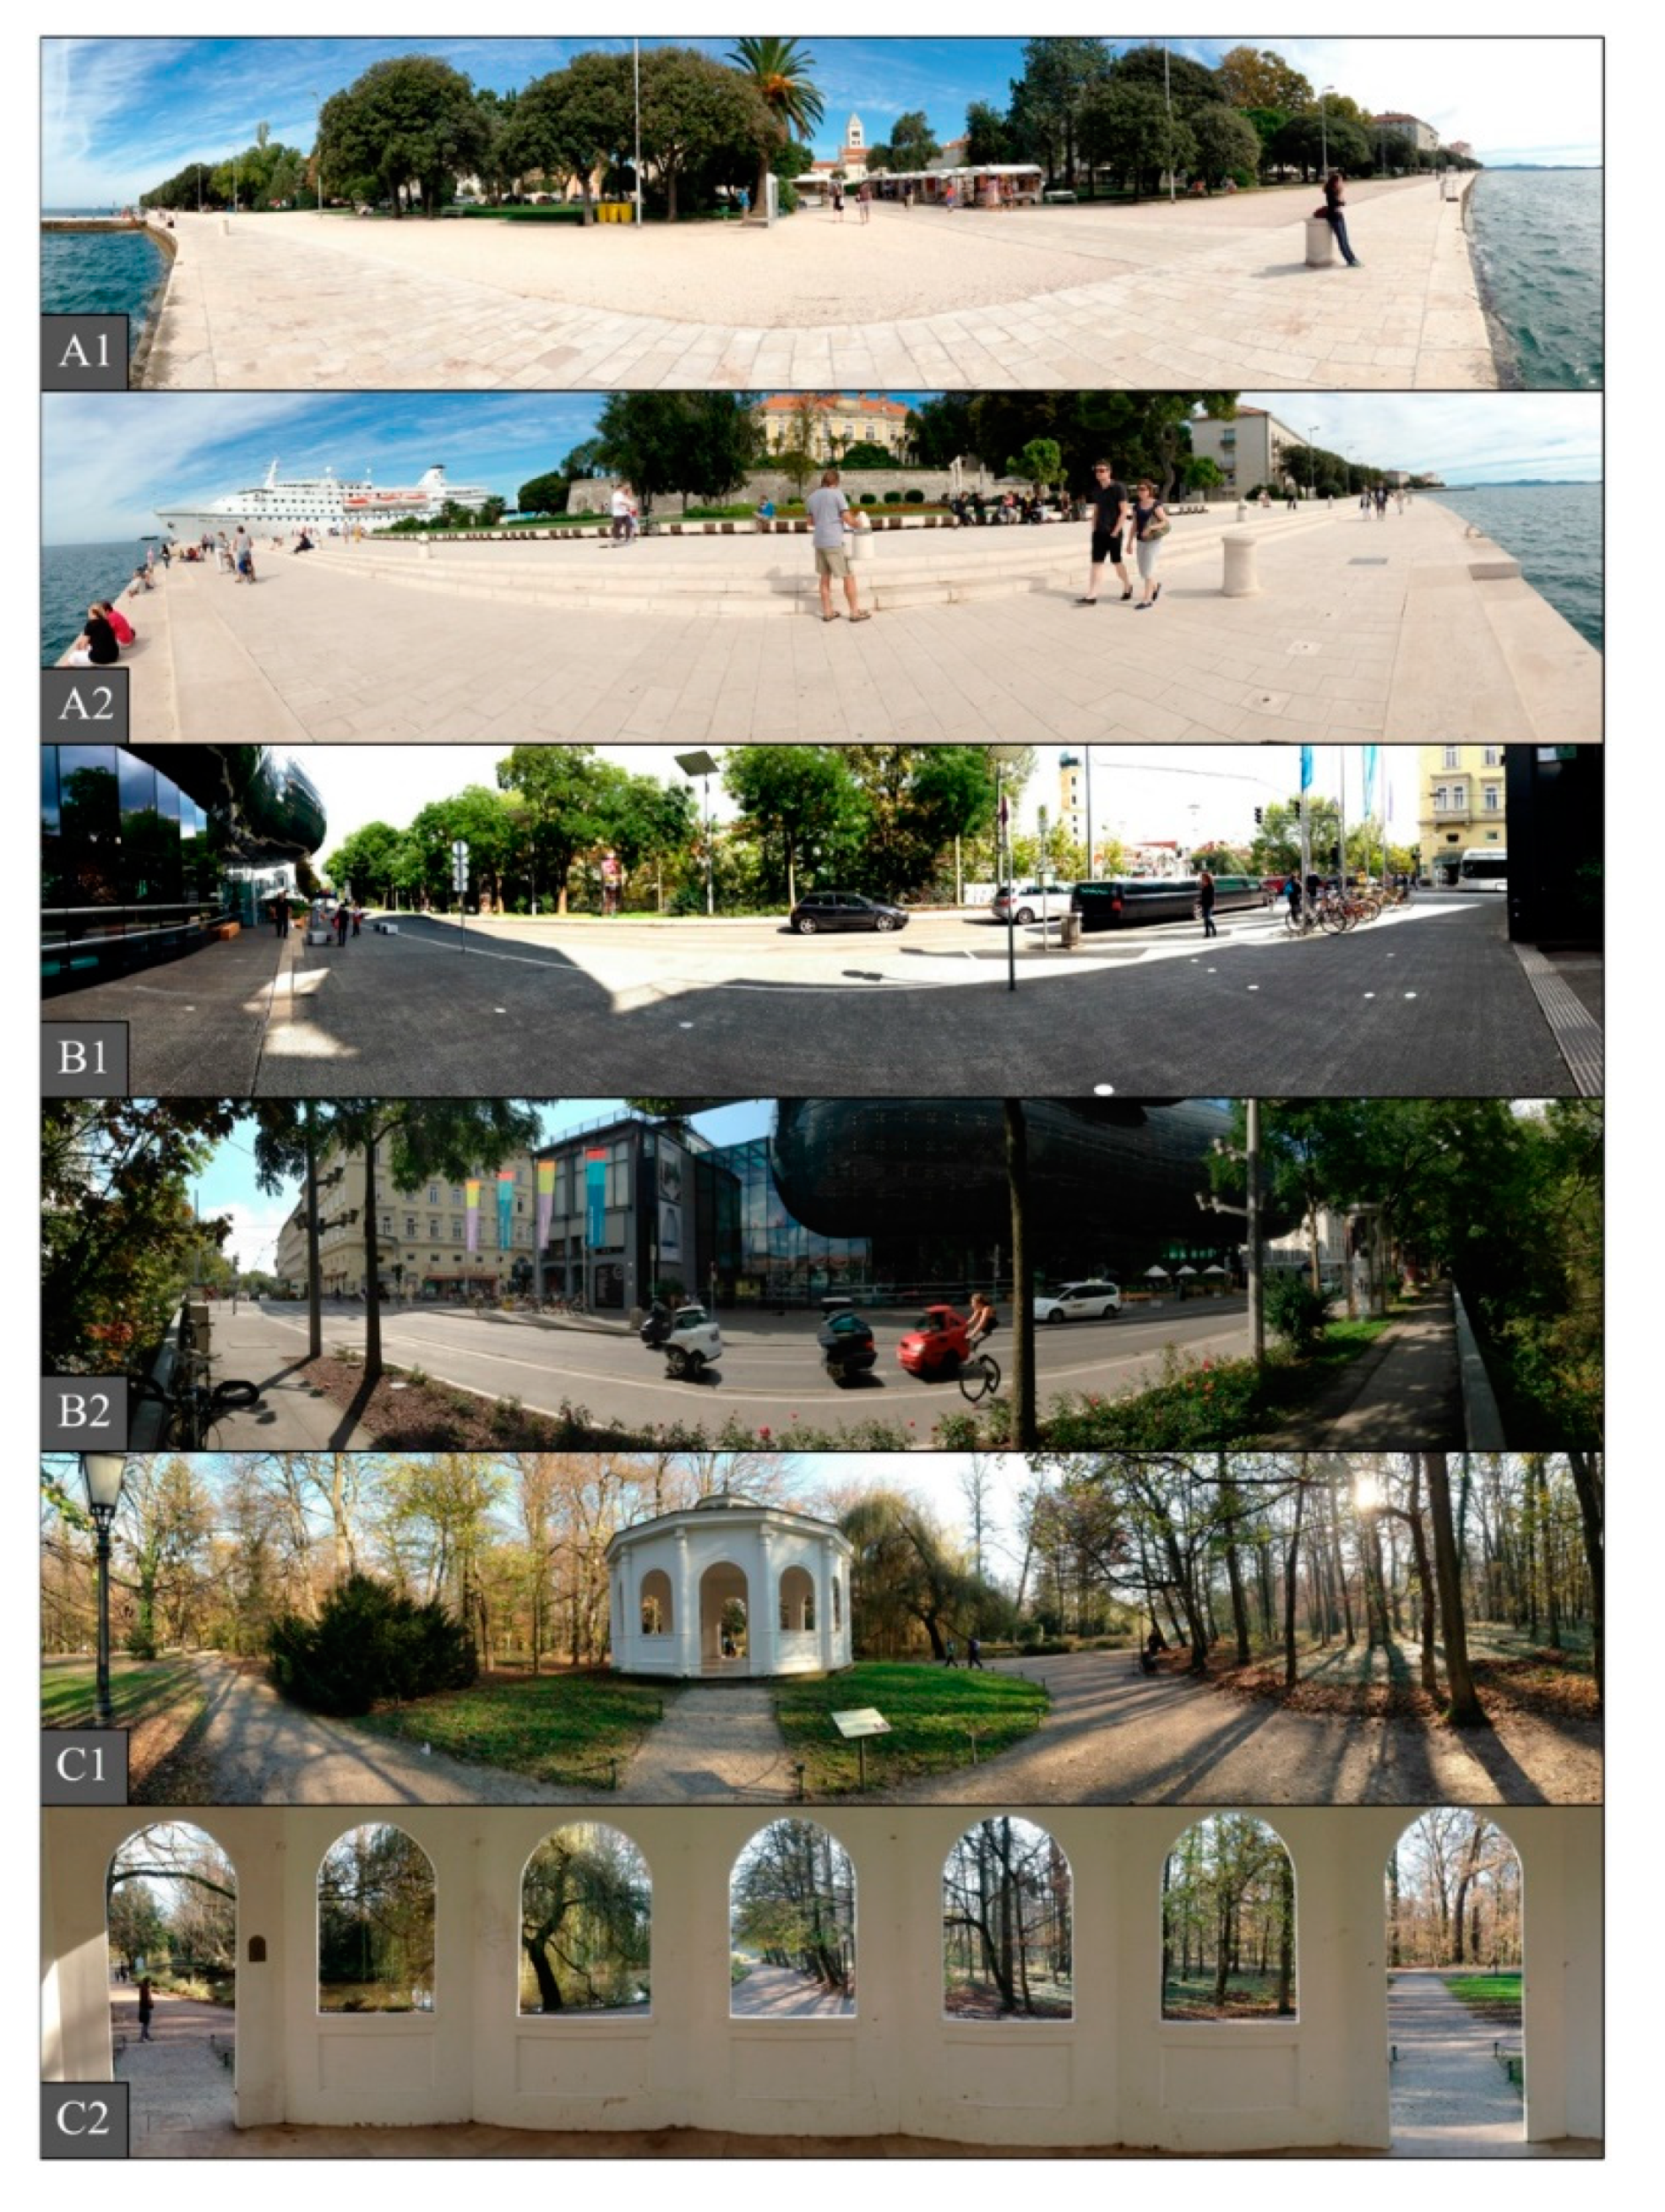
2.2.2. Selection of Measurement Points and Visual Stimuli Recorded

Within each analyzed urban open space, two measurement points within the short or immediate walking distance were selected: first on a position at a significant distance from the analyzed sound source(s) but within the same urban open space; second at the position where the sound of the analyzed sound source is clearly audible, while the visual setting remained similar (as reported in the Figure 3 and Figure 4). All the recordings were made while the sound sources investigated were active, so distance was the only factor influencing its level to achieve a measurement point equivalent to the baseline condition, while the distance itself was limited by the geometrical configuration of the public space. In the case of the Kunsthaus Graz plaza at Lendkai in Graz (location B), where the plaza itself is so small that the sound sculpture Time Piece Graz is audible in the whole area, the first measurement point was chosen beneath the expressive glass volume of the museum building, while the second measurement point was chosen on the outer rim of the plaza. The pictures taken at measurement points and presented to participants are shown in Figure 3.

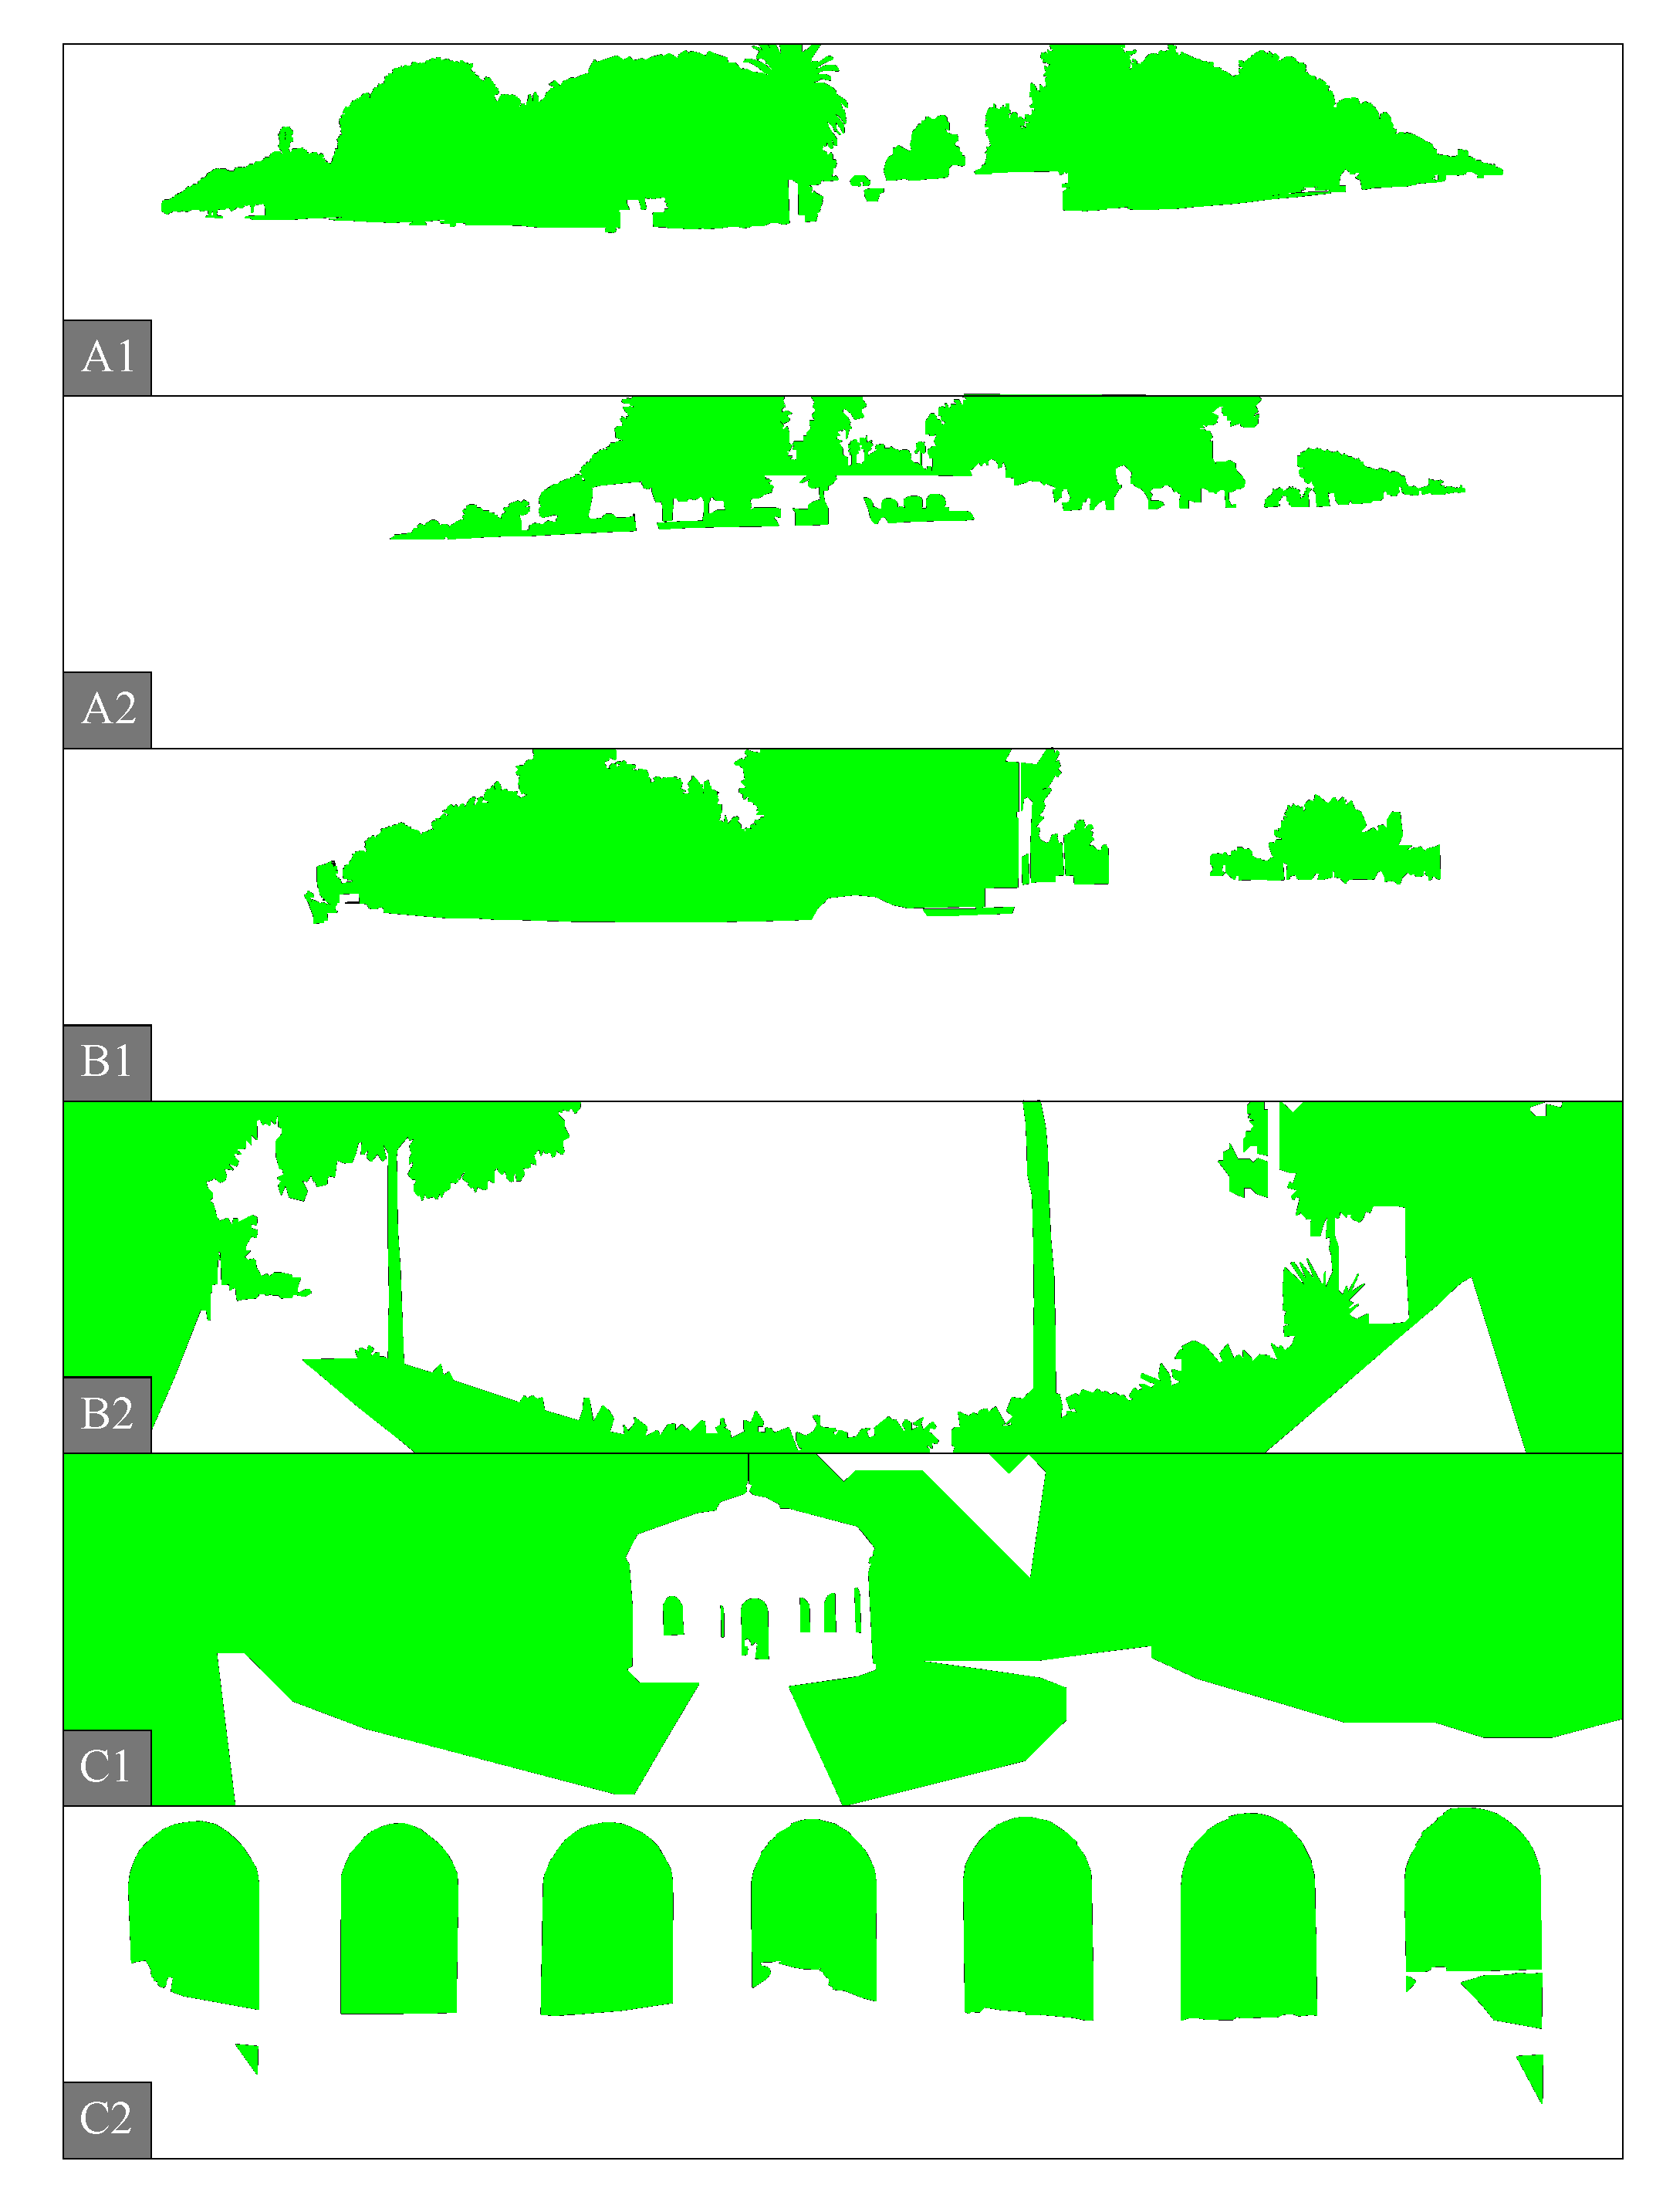
2.2.3. Visual Stimuli Analysis

Following the method used by Sun et al. [72] and having in mind the significance of the foliage visible to participants noted by Watts et al. [75], the image area covered by pixels showing foliage was calculated, as shown in Figure 4. All pictures are featuring clearly noticeable foliage.

2.3. Experiment in the Auralisation Laboratory

2.3.1. Advantages of the Research in Laboratory Conditions Instead of the Soundwalk In Situ

The two most common soundscape analysis methods are based on soundwalks or laboratory experiments via listening tests backed up with questionnaires, semantic scales, behavioral observation protocols, or interview protocols [26]. Both approaches are considered reliable for soundscape assessment [53,54]. For this study laboratory experiments were chosen while attaining some of the beneficial characteristics of the soundwalk approach.
Laboratory conditions allow for critical listening as opposed to selective listening [76]. However, Kang and Zhang [77] point out the deficiencies of the laboratory approach because of the difficulty in simulating complex spatial relationships between sound sources and listener, and the interrelationship between micro-climate and socio-cultural factors. Tests in situ, based on the soundwalk method, automatically take into account those factors as well as meteorological conditions, which can distort the results when compared to the research in laboratory conditions. On the other side, Hong et al. [56] found high correlations in sound source recognition and soundscape assessments between laboratory soundscape research featuring different sound reproduction techniques and on-site surveys. In this study the impact of the overall environment in which the analyzed acoustic environment was recorded was taken into account, in particular: (1) spatial interrelationships of sound sources (including their movement)—by recording using the FOA microphone, (2) meteorological conditions—by running the recording sessions in as similar (and moderate) weather conditions as possible, (3) socio-cultural factors—by controlling the socio-cultural structure of the group of respondents, (4) the interrelationship between the acoustic and visual experience—by including the recorded visual material in the test.
On the other hand, testing in situ inevitably prevents a precise comparison of key/selected measurement points, due to the large number of external factors which the respondents experience while passing from one measurement point to another and the inability for each participant to experience the exact distance and orientation to the sound sources in question [53]. Benefits of tests in laboratory conditions that contribute to the comparison (of different soundscapes) are:
  • accurate, efficient, and fast exchange between multiple sound environments (recorded at geographically considerable distances);
  • repeatable conditions for listening to multiple locations;
  • repeatable conditions for multiple participants for the same recorded location/acoustic environment.
The laboratory approach was chosen so that the same group of participants could (easily) assess urban open spaces located in different cities, while spatial relation between the listener and analyzed sound sources was preserved. As the same group of participants remained unchanged across the locations, the impact of socio-cultural factors (i.e., translation of the questionnaire since chosen locations are in different countries) was minimized.
Furthermore, per ISO/TS 12913-3:2018, the upper limit of the participants number per soundwalk is suggested to be around 20 people as it is considered that a higher number will start to significantly influence the assessment results by reducing calmness and increasing the perceived eventfulness as the participants on their own will start to be perceived as a crowd [29].
The virtual soundwalk approach was used since it was considered that retaining an insight into spatial relations within a spatial sequence provides results vital for possible application in design. Therefore, while experiencing the excerpts randomized by location (A, B, and C), the participants were able to understand the spatial relationship between the measurement points [39].

2.3.2. Auralization Laboratory Setup

In order to further compensate for the drawbacks of the soundscape assessment in laboratory conditions following steps were conducted:
  • the auralization laboratory was equipped with second-order Ambisonics (SOA) system to enable reproduction of three-dimensional spatial relations of both static and dynamic sound sources;
  • panoramic photographs taken at the exact position of the microphone were reproduced on screen placed in front of the listeners simultaneously with the corresponding audio track;
  • an interface was programmed on a tablet to simulate virtual walk and provide intuitive understanding of spatial relations characteristic for urban open spaces in question.
Digital audio workstation running the application Reaper and the Ambisonics decoder plug-in DecoPro was used for playback, as well as to simultaneously display the panoramic pictures using the VLC plugin. Audio and video playback from the computer were operated by the participant via the tablet, running the DAWOSC application showing a map of the location with measurement points marked and using OSC messages via the wireless computer network, similarly as described in [39]. The auralization room comprised 16 + 1 active speaker system, models Yamaha HS50 and Yamaha SW10 and a 27-inch monitor.
A common comment was that respondents, when focused on the aural experience, find all sounds in laboratory conditions louder than usually experienced in the city, although the listening level was carefully matched using the sound level meter (SLM) and the SPL values measured in situ. Hong et al. [78] noted good immersion but poor localization when using an Ambisonics system and a FOA microphone with coincident capsules for soundscape assessment. Accordingly, several participants positively commented on the experienced spatial impression.

2.3.3. Participants

A total of 44 respondents, mean age 27.6 years (19–37 years old), 22 female and 22 male, mainly students and university staff, participated in the questionnaire. No participant reported any hearing problems.
Considering the participants’ background, the majority of respondents come from technical areas related to architecture and urban planning (71%). Other respondents came from arts (music—11%), humanities and social sciences background (11%), and 7% had backgrounds related to the electrical engineering and computer sciences.
Given the limitations of the sample (number and age restriction), the test results must be interpreted in the spirit of qualitative rather than quantitative analysis—the results speak on the nature of the studied phenomena and related trends, but do not serve the adoption of the final value judgements [79].
All 44 participants answered the questionnaire related to the sites A and B. 93% of them visited site A, while the majority (43%) were there only once or twice. Only 2% reported regular and often visits and even the ones who never experienced it live (7%) were familiar with it. On the other hand, 23% never heard of the site B and no participants reported using it frequently. 34% reported being there once or twice.
In examining the location C, 40 respondents participated out of total 44 respondents who participated in the entire study (88%). In doing so, 52.5% were female and 47.5% male. The age range from the overall sample was retained. Of the share of respondents who answered the questionnaire related to the location C, only one respondent (2.5%) answered that is not familiar with the urban open space, while only two respondents (5%) have used the space frequently. The largest number of respondents rarely visit Echo Pavilion in Zagreb’s Maksimir (37.5%), and 20% occasionally. 22.5% of respondents said that they visited Pavilion once or twice in their lives, while 17.5% of respondents had heard of this place, but had never visited it.

2.3.4. Questionnaire

The SSQP used (Appendix B) was translated to Croatian (Appendix A), following the work conducted within the study by Jambrošić et al. [45]. To understand whether the soundscape interventions investigated feature clearly perceived sound sources, two questions about sound source types were added to the part of the SSQP which aims to identify the sound source types:
  • How dominant (and clear) can you hear designed sound sources (intentionally added to the environment)?
  • How dominant (and clear) can you hear an acoustic effect (echo, reverberation)?
Before being asked to assess the acoustic environments presented, the participants were offered questions to report on the familiarity with the locations investigated, age, and gender. No personal or sensitive data were collected within the questionnaire.

2.4. Statistical Analysis

It cannot be claimed beyond any doubt that the intervals between the adjacent categories would be perceived as equal by the test subjects. Furthermore, the normality tests performed on raw data revealed that the distributions of observations are not normal in most cases. To address these issues, a series of rank-based Kruskal–Wallis tests was performed. The factors investigated were sound source recognition, soundscape descriptors, and appropriateness of the acoustic environment. To make the handling of the data easier, the verbally described observations were converted into numerical grades from 1 to 5, respective to the order of the categories listed in previous paragraphs.
The goal of these tests was to determine whether the designed sounds introduced on all three investigated locations lead to significant changes in the perception of the sound environment. To achieve this, the groups of observations obtained for each variable were statistically tested for the corresponding locations on each test site. Specifically, locations A1 and A2, B1 and B2, and C1 and C2 were tested against each other, respectively. The statistical significance level was set to 0.05 in all tests. It was considered that this would allow for drawing conclusions on the effectiveness of the virtual soundwalk for assessing soundscape interventions.

3. Results

3.1. Results of the Quantitative Data Analysis—Characterisation of the Acoustic Environment per ISO/TS 12913-2:2018

The participants were exposed to acoustic environments recorded using the FOA microphone on-site and then reproduced via the SOA system in the laboratory. Exposure conditions were matched by SPL, using a SLM positioned in the ‘sweet spot’.
As observed by the researchers, recordings at the location in Zadar (A) captured sounds from ship/sea traffic, road traffic, people talking and walking, church bells, music from stands, sound of the waves hitting the waterfront, sound of the Sea Organ installation. Recordings at the location in Graz (B) captured sounds created by road traffic, people talking and walking, sound of the river and sound of the electroacoustic installation Time Piece Graz. Recordings at the location in Zagreb (C) captured sounds from people walking, talking and clapping, echo, sounds of birds chirping, and sounds of road traffic.
The following parameters were calculated as suggested by ISO/TS 12913-2:2018 (Table 2): LAeq,T, LCeq,T, loudness (per ISO 532-1), sharpness (per ISO 532-1) and roughness. It should be taken into account that psychoacoustic parameters were initially conceived with the primary purpose of describing single sound sources [48,80], while urban open spaces are extremely complex acoustic environments.
Variation in the LAeq,5min between all sound excerpts was 27.6 dB(A), with large variations at the locations A (17.9 dB LAeq,5min) and C (15.2 dB LAeq,5min), while the location B was characterized by more consistent LAeq,5min (variation of 3.1 dB(A)).
Accordingly, the overall variation in average loudness was 27.7 sone, while the highest variation in average loudness was measured between the points C1 and C2 (15.3 sone). Also, the highest difference in N5 and N95 values was measured at the location C2 (25.2 sone).
High sharpness (3.1 acum) and roughness (0.214 asper) values were measured at the measurement point C2, which can be explained by the same signal being quickly repeated as part of the investigated flutter echo effect and the high frequency content preserved due to many flat surfaces in the pavilion.
All the measures observed were within the values usual for urban open spaces [29,81], with the exception of the before mentioned sharpness and roughness at C2.
Introduction of sound sources clearly distinguishable from the background is also visible in high N5 difference at locations A (11 sone) and C (19.7 sone), where the difference at the location B is 4.9 sone.

3.2. Results of the Qualitative Data Analysis

Ranked data was used in the statistical analysis, rather than raw results obtained from the SSQP. The results of the tests made to investigate the presence of certain types of sounds are shown in Table 3 for all three locations. The results of the tests made to investigate the change in the perception of sound environments are shown in Table 4, again for all three locations. The tables show mean ranks for each variable on location “1” and “2”, and the estimated true difference of these mean ranks, as well as the lower and the upper bound of the 95%-confidence interval of that estimation. Finally, the obtained p-value is shown in the right-most column. The difference is significant at the 0.05 confidence level if the confidence interval does not contain 0.

3.2.1. Change in the Dominantly Perceived Sound Sources

The results shown in the Table 3 reveal that at the location A the sound of the Sea Organ, described as ‘a designed sound source’, were indeed identified as a significant change in the acoustic environment (p = 0.041). Introduction of the Sea Organ might have also caused masking of the traffic and other noise as those sound sources are significantly less dominant at that location (p = 0.0004 for traffic noise and p = 0.0138 for other noise), although the measurement point itself is equally distant from the nearby road (30–35 m).
At the location B, the significant change in the sound sources perceived between measurement points B1 and B2 happened to be significantly fewer human sounds at the location nearer to the museum building (p = 0.0001). No other significant change in the presence of the investigated sound source types was noted.
At the location C, the introduction of the flutter echo was clearly recognized as the most significant change (p = 0.0000), which similarly to the location A might have led to other noise (p = 0.0029) and natural sounds (p = 0.0111) being perceived as less dominant.
All measurement points at the locations A and C are characterized by high presence of human and/or natural sound sources. Those close to the integrally designed sound sources are characterized by the clearly dominant integrally designed sound source (sound of the Sea Organ) or acoustic effect (the flutter echo effect at the Pavilion of Echoes).
The locations A1 and C1 featured significantly more dominantly perceived noise than A2 and C2.

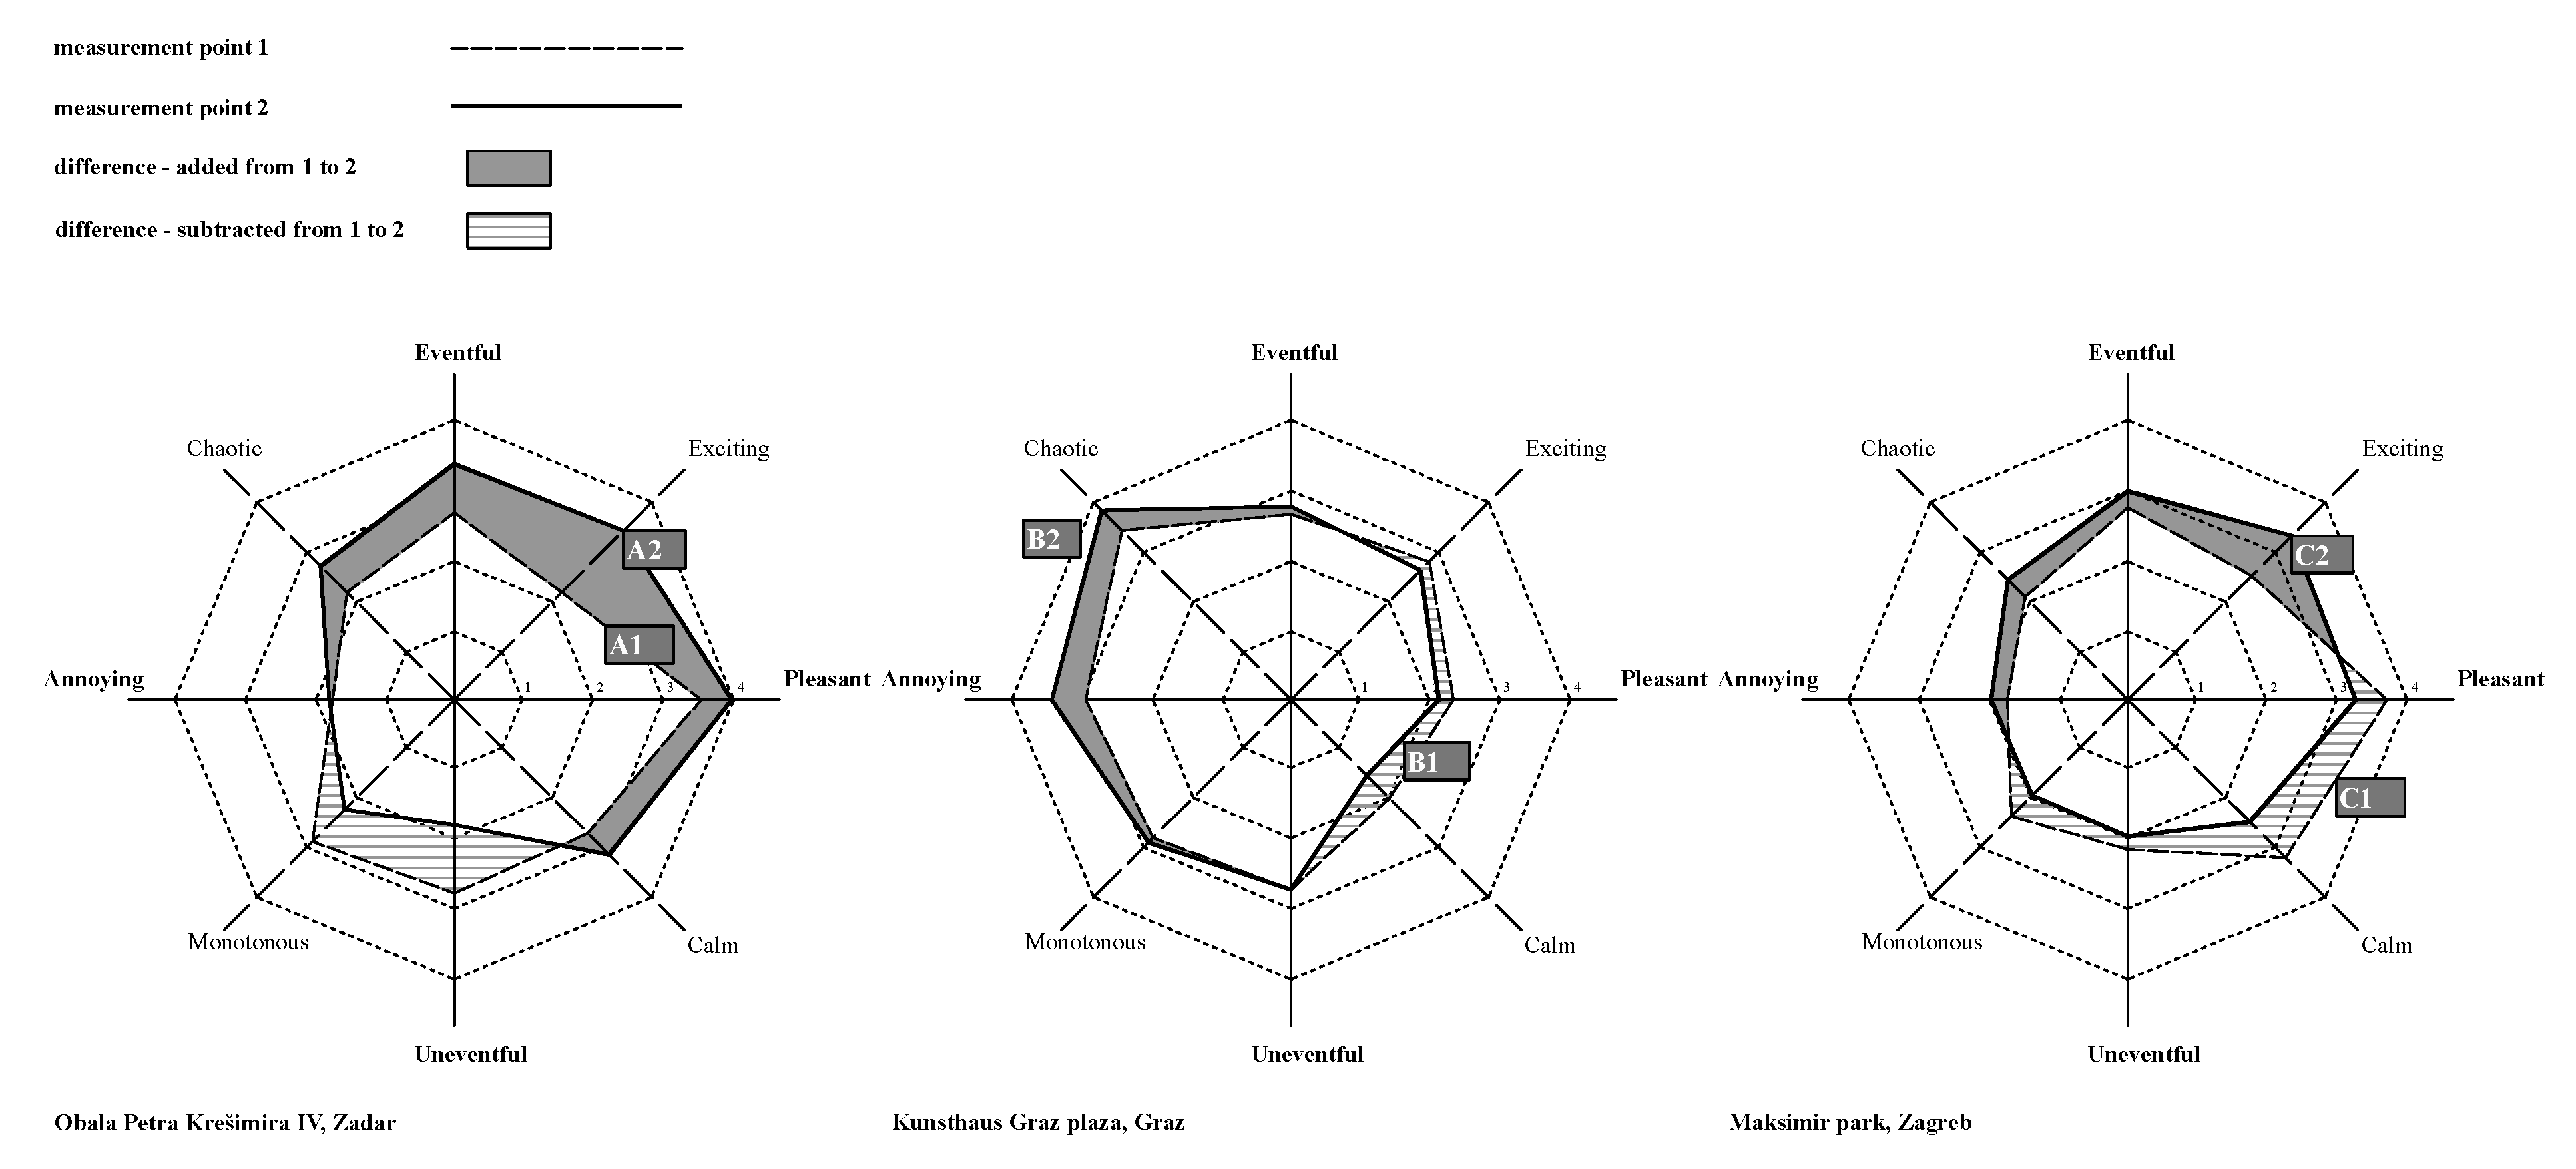
3.2.2. Soundscape Descriptors

The mean values of soundscape descriptors are shown in the Figure 5, while the statistical significance in change between the conditions 1 and 2 is shown in the Table 3. The only soundscape in this study characterized as clearly ‘negative’ would be at the location B. As observed in the Figure 5, the change from the condition 1 to the condition 2 introduced the following general changes in terms of the four quadrants (calm, vibrant, chaotic, and monotonous):
  • less monotonous and calmer and more vibrant at the location A
  • slightly less chaotic and calmer at the location B
  • less calm and more vibrant at the location C
As shown in Table 4, the series of rank-based Kruskal–Wallis tests performed for the change in soundscape descriptor values revealed the following results:
  • A2 significantly more pleasant than A1 (p = 0.0043)
  • B1 significantly calmer than B2 (p = 0.0068)
  • B2 significantly more unpleasant than B1 (p = 0.0032)
  • C1 significantly calmer than C2 (p = 0.0024)
  • C2 significantly more exciting than C1 (p = 0.0004)

3.2.3. Appropriateness of Integrally Designed Sound Sources

The congruence between aural and visual stimuli and activity, which is often considered as a goal for soundscape design [23], was assessed through questions on the overall visual setting and appropriateness of the acoustic environment for the analyzed place. The statistical test performed for the change in the perceived ratings between the two measurement points at each location proved that added designed sound sources significantly influenced that part of the assessment as following (Table 5): A2 was assessed as a more appropriate acoustic environment (p = 0.0146); B2 was assessed as less appropriate (p = 0.0002); A2 was assessed as visually more attractive (p = 0.0276).
Table 5 shows condensed results, i.e., only the p-values of the statistical tests connected to the changes in the perceived appropriateness of the sound environment, and in the overall visual setting.

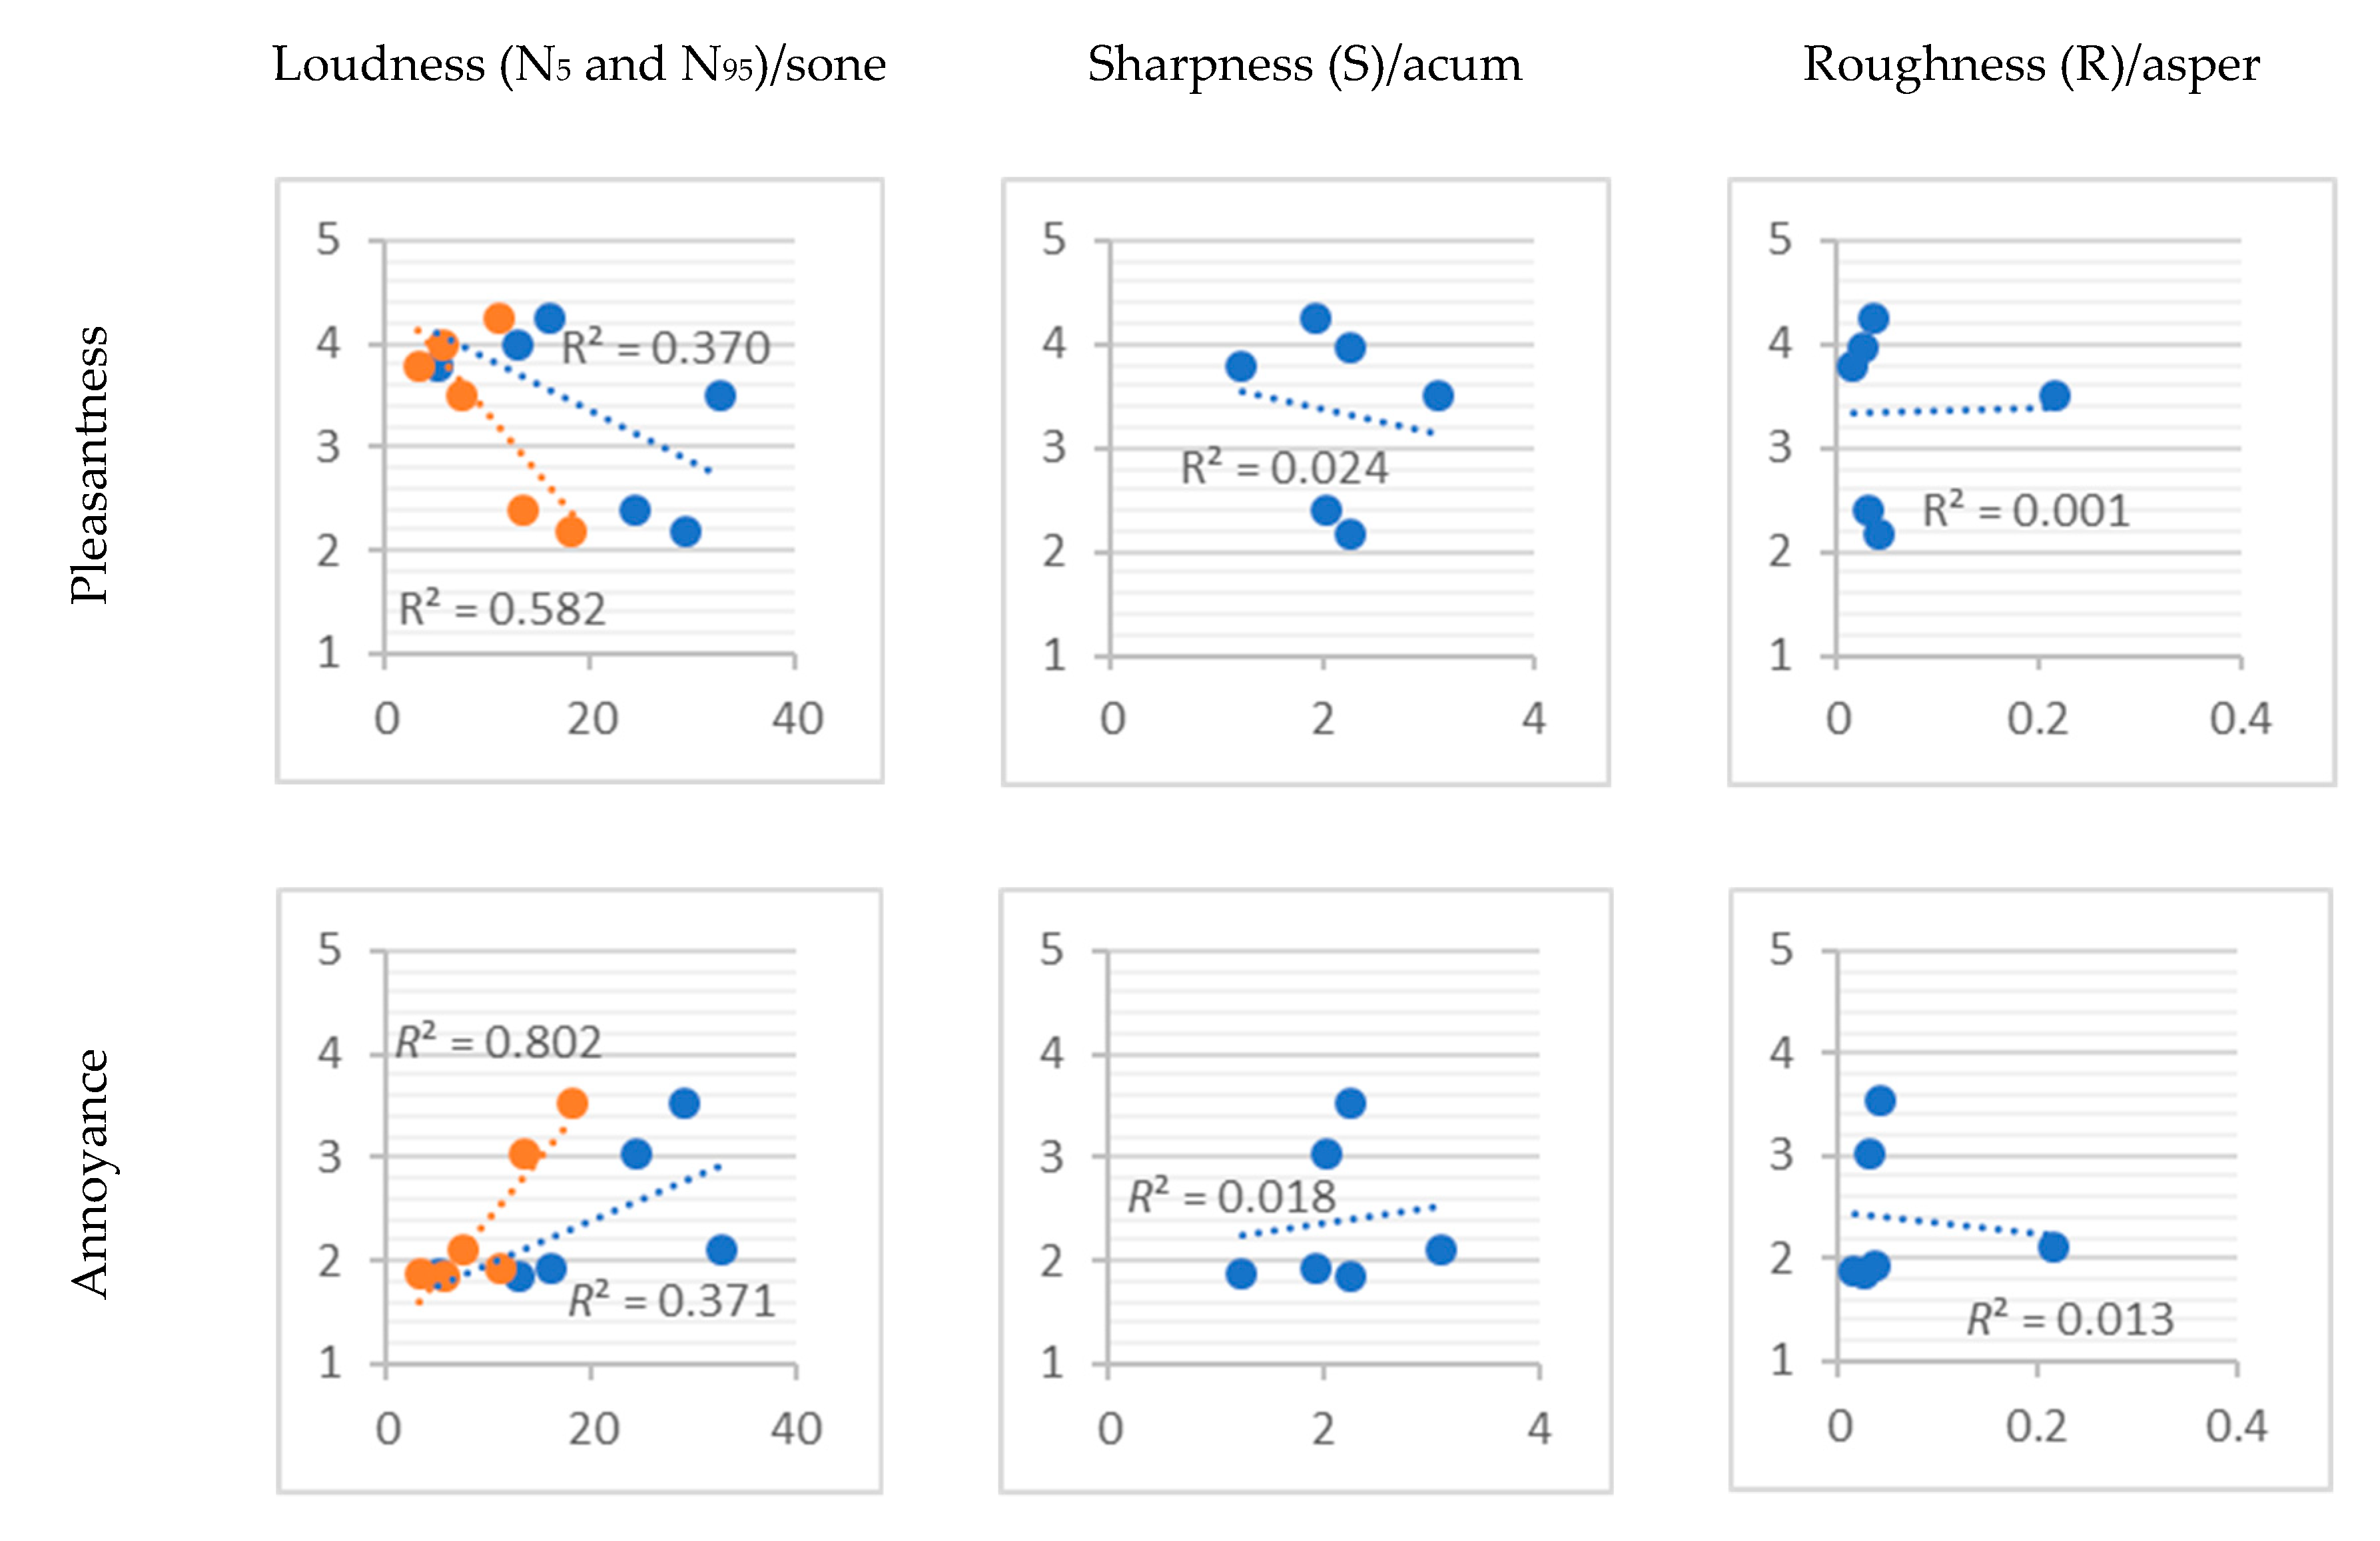
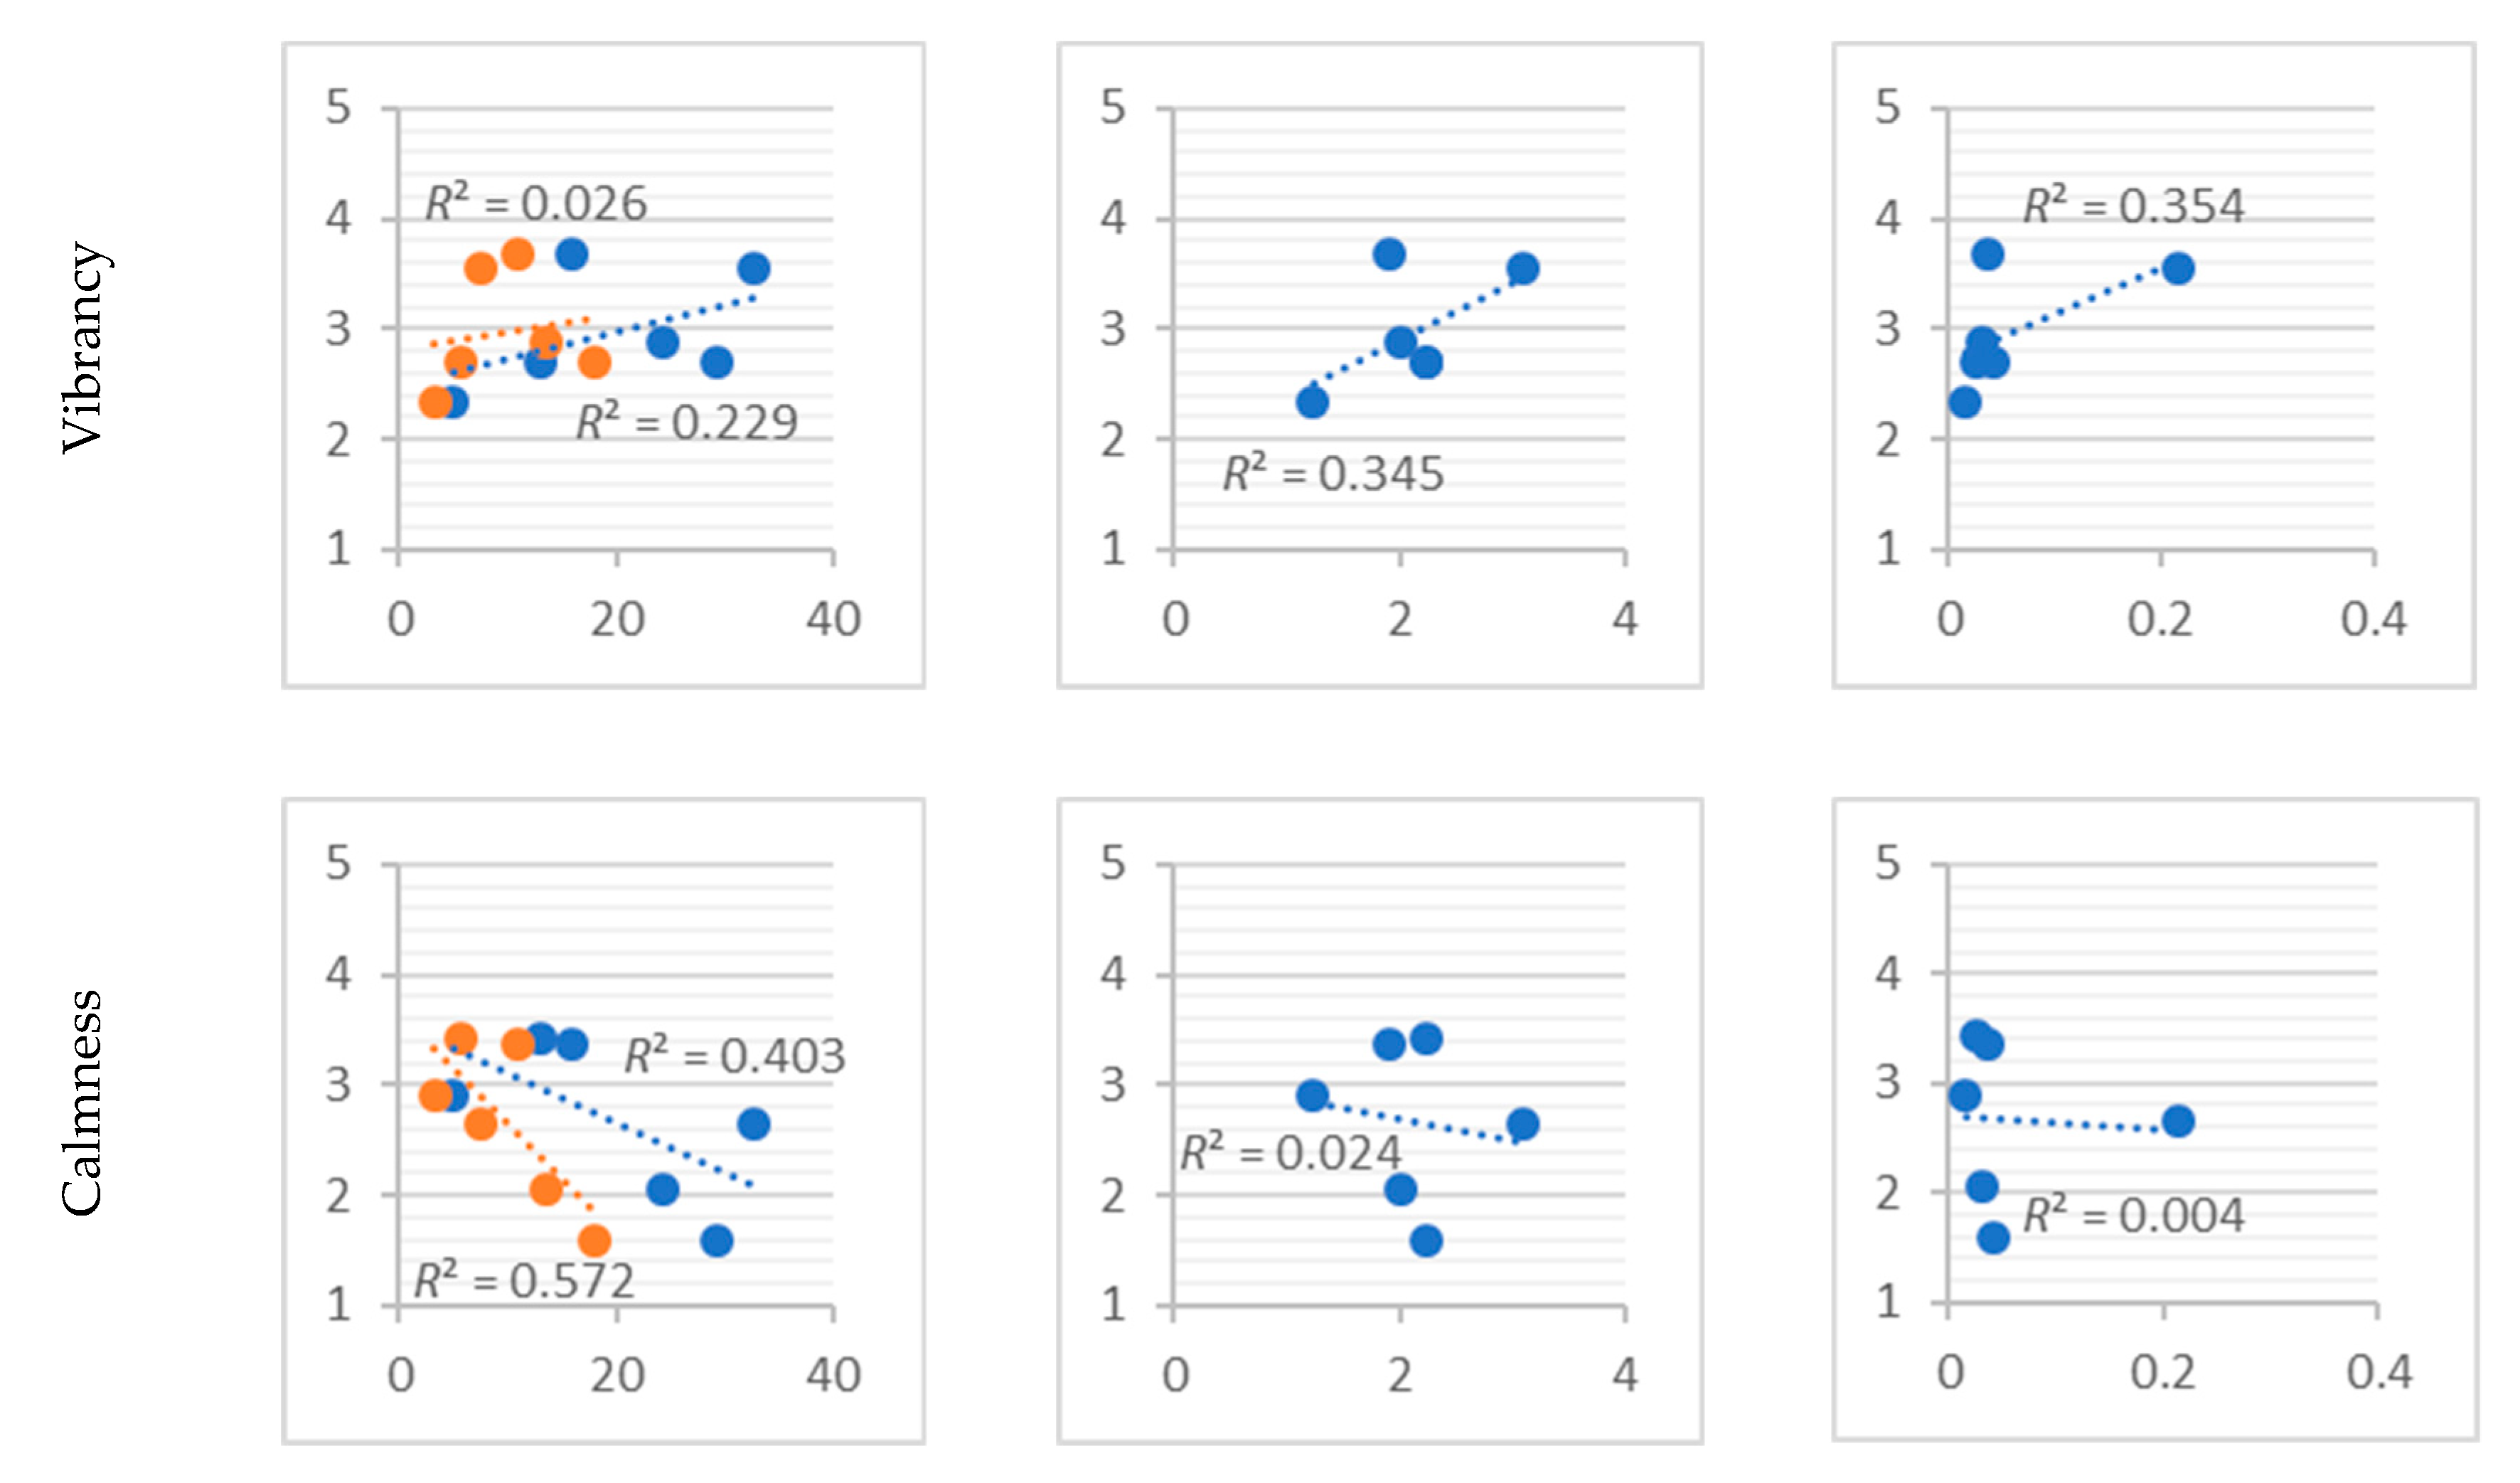
3.2.4. Soundscape Descriptors and Psychoacoustic Measures

As changes in pleasantness, annoyance, vibrancy, and calmness were proved to be statistically significant in the case of soundscape interventions investigated, their mean values across all measurement points were tested against the psychoacoustic measures (Figure 6).
As expected, it is indicated by high R2 values (R2 = 0.58 for pleasantness vs. N95, R2 = 0.80 for annoyance vs. N95 and R2 = 0.57 for calmness vs. N95) that higher loudness values contributed to lower pleasantness, higher annoyance and lower calmness. Accordingly, it seems that these trends are more pronounced for N95 values than N5. Higher sharpness and roughness might be contributing to higher vibrancy scores (R2 > 0.3), while no trend was detected in relation with other perceptive attributes (R2 < 0.1).

4. Discussion

4.1. Limitations of the Study

Limitations observed during this study consider ecological validity of laboratory environment, recording and reproduction techniques used, limitations imposed by site specific features of case sites, and issues in handling the temporal and cultural aspect of soundscape interventions investigated. Another limitation of the study is the characteristics of the sample which is skewed towards the younger and well-educated part of the population.

4.1.1. Sound Source Identification and Perceptual Attributes

The identification of sound sources added by soundscape interventions and natural sounds of flowing water proved to be an issue across all the locations where they were not perceived as dominant. Besides the electroacoustic intervention, the measurement point B2 was possibly influenced by some limitations of Ambisonics decoding and FOA recording, such as aliasing [82]. Although the researchers observed significantly more natural sounds at the point B2, the prominent sound of the rough river Mur probably contributed to the impression of noise and the participants most likely attributed it to traffic, despite of different localization (traffic in front, the sound of the rough river behind and below). This speaks against the use of FOA recordings in laboratory to assess water-based soundscape interventions distant from the listener, similar to findings by Axelsson et al. [83] and opposed to the findings by Hong et al. [84]. However, further research is needed on this as water features can vary greatly [51].
Results of the sound source identification revealed that the description of ‘designed sound source’ was occasionally misunderstood (location C), as well as the ‘acoustic effect’ (location A). Yet, the recognition of the echo effect at the measurement point C2 and the sound of the Sea Organ were successful and highly statistically significant, which led to the decision not to exclude any of the responses from the results. However, the ambiguous answers at other locations limited the possibility to investigate correlations between the recognition of these two sound source types and soundscape descriptors.
Moreover, 315 s can be considered an overly long exposure time for this kind of experiment. While such duration was chosen to present the full duration of the sound source at the location B, it is likely that this did not improve its recognizability. The participants were allowed to start filling in the questionnaire during exposure as it was considered that it is a routine which does not affect critical listening, but it might have slightly decreased a possibility to recognize the sound source in question. At the same time, judging by the change of the perceived dominance of human sound sources at the measurement point B2, it can be said that its soundscape was most probably more influenced by the perceived dominance of sound sources other than the soundscape intervention. The significantly increased unpleasantness and lower calmness at B2 can be explained by significantly less perceived human sounds. This is one of the reasons why it is not possible to make a judgement on the influence the soundscape intervention had at that location.
The changes in soundscape descriptor values were expected and they fit the model proposed by Axelsson et al. [74] as introduced new sound sources at locations B and C contributed to the soundscape being less calm—introducing new sounds made them more eventful. At the location A both vibrancy and calmness increased from measurement point 1 to 2. Here, it must be noted that eventfulness itself was not revealed explicitly as significantly changed but rather manifested through the change in values for calm and/or exciting. That might speak in favor of assessing directly vibrant, calm, monotonous, and chaotic dimensions instead of assessing all eight descriptors as proposed within the Method A of the ISO/TS ISO 12913-2:2018 [31]. As no soundscape descriptor was identified as statistically significant across all measurement points, the possibility to investigate correlations with psychoacoustic measures was limited.
Although the literature suggests that vibrant soundscape domain (eventful and pleasant) is often determined by non-auditory factors such as presence of people [85], it is interesting to note that this was not the case for the location C, where the social presence in both visual settings was very low (5 people visible at the picture representing C1 and 3 people visible at the C2). Interestingly enough, the highest loudness across all measurement points (N = 26.5 sone) was measured at C2.
The eventful dimension, which is orthogonal to the pleasant dimension, provided mostly ambiguous responses when addressed directly. While the statistically confirmed results prove that SSQP used in auralization laboratory can serve for assessing soundscape interventions, this advocates for further research on optimization of the soundscape assessment tools linked to the circumplex model featured in the Method A of the ISO/TS 12913-2:2018.

4.1.2. Limitations of the Laboratory Experiment

Compared to previous research results on the Zadar site that was performed in situ shows that the soundscape perception ratings were higher but soundscape dimensions were addressed similarly [39,45], which speaks in favor of the ecological validity of the approach used.
Furthermore, it is important to note that the temporal aspect of a soundscape intervention, such as the influence of prolonged exposure, is one of their key features which was not explored here. From the daily press, it is known that the permanent installation in Zadar is causing annoyance to the residents of the nearby building [86,87]. On the other side, the installation in Graz was programmed so it does not produce sound during the night for the same reason [64].

4.2. Potential Application of the Research Results in Urban Design

Noise sources in an urban environment range from road and railway to airborne traffic [88,89,90] and this study also speaks about the masking potential sound art can have. The virtual soundwalk was used in this study as a post hoc evaluation tool, but it goes without saying that consideration of a future acoustic environment in the early stage of planning and design process is highly recommended and a similar tool can be applied [39,91]. However, the approach demonstrated might be useful as it is not always feasible to conduct the assessment before the intervention takes place due to conditions in situ, time frame of the research, or planning and design process.

4.2.1. Cultural-Contextual Factors of a Soundscape Intervention

If declaring a value judgment on the suitability of a particular approach to enhance an acoustic environment of urban spaces based on this study, a foregone conclusion would be that the Sea Organ and Pavilion of Echo(es) are more successful than Time Piece Graz. However, such a conclusion would necessarily be wrong, or at least insufficiently correct. Consideration should be given to a completely different urban and aural context of the locations, although all three are located in the historical city centers. Also, one cannot say that art installation Time Piece Graz has no role to the enhancement of the street and plaza at the Kunsthaus Graz, since any form of artwork exhibited in city area itself contributes to the quality of urban spaces and city life. The fact is that its musical features were not as recognizable as these of Sea Organ or Pavilion of Echoes, and the concept of its musical and/or acoustic content is different than the other two sites surveyed. In addition, Time Piece Graz is conceived to encourage passers-by to think and act critically—the basic idea is to be noticed at the moment when it ceases to produce sound [92]. Such critical artistic stance in itself might affect the perception of chaos and unrest. On the other hand, the traditional harmonic sound of the sea organ contributes to pleasantness, and the echo that is suddenly experienced only by passing through the pavilion contributes to vibrancy and excitement. In addition, at none of the locations are traditional noise protection measures implemented and the studied ambiances greatly depended on the existing levels of road traffic noise, which was the most prominent sound source at the location in Graz. Therefore, as it lacks the insight in the cultural factors, the method used cannot be applied for (absolute) evaluation of an intervention, but to research influence and interrelations between individual components of the soundscape of an urban open space. Only a small share of respondents (N = 2) commented positively on the artistic value present at the location in Graz and rated the soundscape in question more positively.

4.2.2. Geometrical Configuration and Purpose of an Urban Open Space

The three case sites speak also about the challenges and opportunities an urban designer encounters when dealing with soundscape intervention tasks in urban open spaces of different sizes and shapes.
The almost 1000 m long seaside promenade, location A, allowed for the largest distance (360 m) between the measurement points. During the quieter periods of the day, the Sea Organ can be heard at that distance (350–400 m, as observed by authors), but this was not the case during the measurement session in question.
Perhaps the most challenging was the location B as it was impossible to find a measurement point where the sound art installation was not perceptible while playing. However, the principle of controlling the distance between the sound source and the measurement point was followed also at that location.
Larger urban open spaces offer the opportunity of including a spatial sequence characterized by the high value of the variance in the presence of the integrally designed sound source. This can contribute to a richer spatial experience and more positive assessment of the overall soundscape. The small difference in the distance between the measurement points in Maksimir indicates that even in the case of smaller urban open space, significant effect can be achieved if the added sound can be contained within a certain part of the space—i.e., the pavilion footprint—which then makes the experience less expected and the contrast higher. In the Maksimir case, it is achieved by acoustically limiting the experience of echo to the space between the two reflecting surfaces.
The experiment on the location C can be considered a successful example of a simulated soundwalk experience since the distinct change in the acoustic characteristics (pronounced flutter echo effect in the very pavilion) was statistically significant, and the particular experience fits the goal of what using the park should be—leisure, fun, and entertainment. Moreover, this speaks in favor of valuing ‘small acoustic imperfections’ such as accidental flutter echo or unusual frequency response occurring in urban spaces, as advocated by Cox [93].

5. Conclusions

Three soundscape interventions with musical features, located in three different cities, and designed to remain in an urban open space were investigated within this study. The sonic content introduced ranged from clear harmonies to acoustic effects. The virtual soundwalk approach was applied to combine benefits from on-site and laboratory-based methods. Two measurement points per location were used—one at the point where the intervention was clearly perceptible, another further away but within the same urban open space so it could be regarded as the baseline condition.
The soundscape intervention at two locations (A and C) proved to have the expected positive (perceptual attributes changed to more positive on the ‘pleasant side of the model’) effect, while the effect at one location (B) was not determined due to the low recognition of the sound source introduced by the intervention.
The series of rank-based Kruskal–Wallis tests identified statistically significant changes in:
  • sound source type recognition related to the soundscape intervention at the locations A (when the sound of Sea Organ was introduced, p = 0.0410) and C (when a flutter echo was added by architectural features of the pavilion, p = 0.0000);
  • ‘positive soundscape descriptors’ at all three locations, related to pleasant, calm, and vibrant dimensions;
  • ‘negative soundscape descriptor’ of annoyance/unpleasantness at one location (B);
  • appropriateness to the visual representation at two locations (A and B);
  • rating of the overall visual setting at one location (A).
No statistically significant changes were found in the following perceptual attributes: eventful, uneventful, chaotic, and monotonous.
The soundscape interventions investigated do not create an everyday soundscape and the SSQP does not reveal this per se. While the question about the presence of an acoustic effect provided statistically significant result at the location C, where it was clearly perceptible, it created confusion at the locations A and B. A similar result was gathered from the question on a designed sound source where it provided statistically significant results only at the location A (the sound of the Sea Organ installation). Therefore, further research is needed towards categorizing sounds with musical features, produced by sound art installations, which could be then addressed through a protocol. However, the statistically significant drop in the perceived dominance of noise sound sources while LAeq,5min and loudness values increased, speaks for the effective noise masking at locations A and C. At both locations A and C, traffic and other noise were perceived less prominent at the measurement points which featured a soundscape intervention.
Traffic noise was present at all locations but perceived as dominant only at one location (B), which was also the smallest in size and the closest to the road.
The statistically significant changes in sound source recognition were followed by statistically significant changes in the soundscape only at single locations as follows:
  • measurement point with lower perceived noise (locations A and C) featured a more pleasant soundscape (location A), a more exciting (location C) and a less calm soundscape (location C),
  • measurement point with lower perceived dominance of human sounds (location B) was less calm and more unpleasant,
  • measurement point with higher perceived dominance of a designed sound source (location A) featured a more pleasant soundscape,
  • measurement point with higher perceived dominance of acoustic effects (location C) featured a more exciting and a less calm soundscape.
The change in the perceived dominance of the sound source added by the intervention was followed by the statistically significant positive change on the positive side of the circumplex soundscape model.
Statistically significant results on the change in appropriateness at locations A (more appropriate at A2) and B (less appropriate at B2) point to the ecological validity of using the virtual soundwalk, even with the use of static pictures as visual stimuli.
Loudness (N95) was the only psychoacoustic measure which indicated connections with the soundscape interventions investigated.
The SSQP and the virtual soundwalk delivered statistically significant results describing the effect of soundscape interventions in public spaces, but this study also revealed limitations in terms of categorization of specific sound sources and geometrical configuration. Perhaps the most important finding from the aspect of planning and design is that adding a sound source influenced not only pleasantness but also appropriateness of the overall acoustic environment.
The effect sound art can have is highly sensitive on the overall context. Urban design and landscape architecture are providing a framework to ensure its representation which then in return increases the quality of the overall experience and consequently contributes to the quality of life in a city. This study showed the potential which public sound art has when applied integrally within urban design.

Author Contributions

Conceptualization, T.O. and K.J.; Methodology, T.O.; Software, K.J. and T.O.; Statistical analysis, M.H.; Resources, K.J.; Writing—original draft preparation, T.O.; Writing—review and editing, K.J., M.H., and B.B.O.Š.; Visualization, T.O.; Supervision, K.J. and B.B.O.Š.; Project administration, T.O. and B.B.O.Š. All authors have read and agreed to the published version of the manuscript.

Funding

This research was funded by the Croatian Science Foundation, grant number HRZZ-2032, led by Professor Mladen Obad Šćitaroci.

Acknowledgments

Resources of the Department for Electroacoustics at the Faculty of Electrical Engineering and Computing, University of Zagreb (HR) were provided by the courtesy of late Professor Hrvoje Domitrović. Analysis using the ArtemiS application was provided by the courtesy of Vojto Chmelík, Stavebná fakulta STU v Bratislave (SK). The Google Forms questionnaire was prepared with the help of Tamara Zaninović.

Conflicts of Interest

The authors declare no conflict of interest. The funders had no role in the design of the study; in the collection, analyses, or interpretation of data; in the writing of the manuscript, or in the decision to publish the results.

Appendix A. Questionnaire in the Croatian Language (As Used in the Study)

The following questionnaire has been used for each measurement point.
  • U kojoj mjeri čujete svaki od ovih zvukova?
    BUKA PROMETA = čamci, brodovi, automobili, sirene
    OSTALA BUKA = buka gradilišta, industrija, strojevi, neprikladna glazba, itd.
    ZVUKOVI KOJE PROIZVODE LJUDI = razgovor, smijeh, dječja igra, koraci i sl.
    ZVUKOVI PRIRODE = vjetar, šuštanje lišća, voda, valovi, ptice i sl.
    PROJEKTIRANI ZVUKOVI = namjerno dodani zvukovi u okoliš
    AKUSTIČKI EFEKTI = jeka, odjek, rezonancija
    Uopće ne čujemMaloUmjerenoJakoDominantno
    Buka prometa
    Ostala buka
    Zvukovi koje proizvode ljudi
    Zvukovi prirode
    Projektirani zvukovi
    Akustički efekti
  • U kojoj mjeri se slažete sa sljedećim tvrdnjama kojima je opisan zvučni okoliš?
    Cjelokupni zvučni okoliš je:
    Potpuno se slažemDjelomično se slažemNiti se slažem, nit se ne slažemDjelomično se ne slažemUopće se ne slažem
    Ugodan
    Kaotičan
    Uzbudljiv
    Pun sadržaja
    Smirujuć
    Neugodan
    Monoton
    Dosadan
  • Smatrate li da je ovakav zvučni okoliš prikladan za ovo mjesto?
    Da, u potpunosti
    Uglavnom da
    Više ne nego da
    Sigurno ne
  • Obrazložite prethodni odgovor prema želji (posebno prikladni zvukovi ili arhitektura).
        
  • Ukupno gledajući, kako biste opisali vizualni dojam okoliša?
    Vrlo dobar
    Dobar
    Ni dobar ni loš
    Loš
    Vrlo loš

Appendix B. Questionnaire in the English Language (Following the ISO/TS 12913-2:2018)

The following questionnaire has been used for each measurement point.
  • To what extent do you presently hear the following types of sound?
    TRAFFIC NOISE = boats, cars, sirens
    OTHER NOISE = construction noise, industry, machinery, inappropriate music, etc.
    SOUNDS FROM HUMAN BEINGS = conversation, laughter, children at play, footsteps, etc.
    NATURAL SOUNDS = singing birds, wind in vegetation, flowing water, sea waves etc.
    DESIGNED SOUNDS = sound intentionally added to the environment
    ACOUSTIC EFFECTS = echo, reverberation
    Not at AllA LittleModeratelyA LotDominates Completely
    Traffic noise
    Other noise
    Sounds from human beings
    Natural sounds
    Designed sounds
    Acoustic effects
  • For each of the 8 scales below, to what extent do you agree or disagree that the present sound environment is
    Strongly AgreeAgreeNeither Agree, nor DisagreeDisagreeStrongly Disagree
    Pleasant
    Chaotic
    Vibrant
    Eventful
    Calm
    Annoying
    Monotonous
    Uneventful
  • Overall, to what extent is the present sound environment appropriate to the present place?
    Perfectly
    Very
    Slightly
    Not at all
  • Feel free to elaborate the previous answer (especially appropriate sounds or architecture).
        
  • Overall, how would you describe the present visual environment?
    Very good
    Good
    Neither good, nor bad
    Bad
    Very bad

References

  1. Piwonski, M.; Schulte-Fortkamp, B. Audio-Islands am Nauener Platz—Eine technische Validierung. In Proceedings of the DAGA 2011, Dusseldorf, Germany, 21–24 March 2011; pp. 265–267. [Google Scholar]
  2. Cerwén, G. Urban soundscapes: A quasi-experiment in landscape architecture. Landsc. Res. 2016, 41, 481–494. [Google Scholar] [CrossRef]
  3. Cerwén, G. On the Intersection between Speaker Installations and Urban Environments: A Soundscape Design Perspective. In Handbook of Research on Perception-Driven Approaches to Urban Assessment and Design. Advances in Civil and Industrial Engineering; Aletta, F., Xiao, J., Eds.; IGI Global: Pennsylvania, PA, USA, 2018; pp. 23–45. ISBN 978-1-5225-3637-6. [Google Scholar]
  4. Aletta, F.; Lepore, F.; Kostara-Konstantinou, E.; Kang, J.; Astolfi, A. An Experimental Study on the Influence of Soundscapes on People’s Behaviour in an Open Public Space. Appl. Sci. 2016, 6, 276. [Google Scholar] [CrossRef] [Green Version]
  5. Steele, D.; Bild, E.; Tarlao, C.; Guastavino, C. Soundtracking the Public Space: Outcomes of the Musikiosk Soundscape Intervention. IJERPH 2019, 16, 1865. [Google Scholar] [CrossRef] [PubMed] [Green Version]
  6. Engel, M.S.; Fiebig, A.; Pfaffenbach, C.; Fels, J. A Review of Socio-acoustic Surveys for Soundscape Studies. Curr. Pollut. Rep. 2018, 4, 220–239. [Google Scholar] [CrossRef]
  7. Lacey, J.; Pink, S.; Harvey, L.; Moore, S. Noise transformation: A critical listening-based methodology for the design of motorway soundscapes. Qual. Res. J. 2019, 19, 49–64. [Google Scholar] [CrossRef]
  8. Steele, D.; Legast, É.; Trudeau, C.; Fraisse, V.; Guastavino, C. Sounds in the city: Improving the soundscape of a public square through sound art. In Proceedings of the ISCV 26 Montreal, Montreal, QC, Canada, 7–11 July 2019. [Google Scholar]
  9. Hellström, B.; Nilsson, M.E.; Axelsson, Ö.; Lundén, P. Acoustic Design Artifacts and Methods for Urban Soundscapes: A Case Study on the Qualitative Dimensions of Sounds. J. Archit. Plan. Res. 2014, 31, 57–71. [Google Scholar]
  10. Weltgesundheitsorganisation. Regionalbüro Für Europa Environmental Noise Guidelines for the European Region; Weltgesundheitsorganisation: Geneva, Switzerland, 2018; ISBN 978-92-890-5356-3. [Google Scholar]
  11. Sygna, K.; Aasvang, G.M.; Aamodt, G.; Oftedal, B.; Krog, N.H. Road traffic noise, sleep and mental health. Environ. Res. 2014, 131, 17–24. [Google Scholar] [CrossRef]
  12. Lercher, P.; Evans, G.W.; Meis, M. Ambient Noise and Cognitive Processes among Primary Schoolchildren. Environ. Behav. 2003, 35, 725–735. [Google Scholar] [CrossRef]
  13. Basner, M.; Babisch, W.; Davis, A.; Brink, M.; Clark, C.; Janssen, S.; Stansfeld, S. Auditory and non-auditory effects of noise on health. Lancet 2014, 383, 1325–1332. [Google Scholar] [CrossRef] [Green Version]
  14. Roswall, N.; Raaschou-Nielsen, O.; Jensen, S.S.; Tjønneland, A.; Sørensen, M. Long-term exposure to residential railway and road traffic noise and risk for diabetes in a Danish cohort. Environ. Res. 2018, 160, 292–297. [Google Scholar] [CrossRef]
  15. Licitra, G.; Fredianelli, L.; Petri, D.; Vigotti, M.A. Annoyance evaluation due to overall railway noise and vibration in Pisa urban areas. Sci. Total Environ. 2016, 568, 1315–1325. [Google Scholar] [CrossRef] [PubMed]
  16. Sklarz, M.; Miller, N. The Impact of Noise on Residential Property Value. Collat. Anal. 2019. Available online: https://www.collateralanalytics.com/wp-content/uploads/2018/10/CA-RESEARCH-The-Impact-of-Noise-on-Residential-Property-Values.pdf (accessed on 28 December 2019).
  17. ISO. ISO 12913-1:2014 Acoustics—Soundscape—Part 1: Definition and Conceptual Framework; International Organisation for Standardization: Geneva, Switzerland, 2014. [Google Scholar]
  18. Aletta, F.; Oberman, T.; Kang, J. Associations between Positive Health-Related Effects and Soundscapes Perceptual Constructs: A Systematic Review. IJERPH 2018, 15, 2392. [Google Scholar] [CrossRef] [Green Version]
  19. Wong, F.Y.; Yang, L.; Yuen, J.W.M.; Chang, K.K.P.; Wong, F.K.Y. Assessing quality of life using WHOQOL-BREF: A cross-sectional study on the association between quality of life and neighborhood environmental satisfaction, and the mediating effect of health-related behaviors. BMC Public Health 2018, 18, 1113. [Google Scholar] [CrossRef] [Green Version]
  20. Kephalopoulos, S.; Paviotti, M.; Anfosso-Lédée, F.; Van Maercke, D.; Shilton, S.; Jones, N. Advances in the development of common noise assessment methods in Europe: The CNOSSOS-EU framework for strategic environmental noise mapping. Sci. Total Environ. 2014, 482, 400–410. [Google Scholar] [CrossRef] [PubMed]
  21. Morel, J.; Marquis-Favre, C.; Gille, L.-A. Noise annoyance assessment of various urban road vehicle pass-by noises in isolation and combined with industrial noise: A laboratory study. Appl. Acoust. 2016, 101, 47–57. [Google Scholar] [CrossRef]
  22. Kang, J. Urban Sound Environment; Taylor & Francis: London, UK; New York, NY, USA, 2007; ISBN 978-0-415-35857-6. [Google Scholar]
  23. Brown, A.L. A Review of Progress in Soundscapes and an Approach to Soundscape Planning. Int. J. Acoust. Vib. 2012, 17, 73–81. [Google Scholar] [CrossRef]
  24. Kang, J.; Aletta, F.; Gjestland, T.T.; Brown, L.A.; Botteldooren, D.; Schulte-Fortkamp, B.; Lercher, P.; van Kamp, I.; Genuit, K.; Fiebig, A.; et al. Ten questions on the soundscapes of the built environment. Build. Environ. 2016, 108, 284–294. [Google Scholar] [CrossRef] [Green Version]
  25. Aletta, F.; Xiao, J. What are the Current Priorities and Challenges for (Urban) Soundscape Research? Challenges 2018, 9, 16. [Google Scholar] [CrossRef] [Green Version]
  26. Aletta, F.; Kang, J.; Axelsson, Ö. Soundscape descriptors and a conceptual framework for developing predictive soundscape models. Landsc. Urban Plan. 2016, 149, 65–74. [Google Scholar] [CrossRef]
  27. Kang, J.; Aletta, F.; Oberman, T.; Erfanian, M.; Kachlicka, M.; Lionello, M.; Mitchell, A. Towards soundscape indices. In Proceedings of the 23rd International Congress on Acoustics, Aachen, Germany, 9–13 September 2019; EAA, ICA, DEGA: Aachen, Germany, 2019; pp. 2488–2495. [Google Scholar]
  28. Axelsson, Ö.; Nilsson, M.E.; Berglund, B. The Swedish soundscape-quality protocol. J. Acoust. Soc. Am. 2012, 131, 3476. [Google Scholar] [CrossRef]
  29. Aletta, F.; Guattari, C.; Evangelisti, L.; Asdrubali, F.; Oberman, T.; Kang, J. Exploring the compatibility of “Method A” and “Method B” data collection protocols reported in the ISO/TS 12913-2:2018 for urban soundscape via a soundwalk. Appl. Acoust. 2019, 155, 190–203. [Google Scholar] [CrossRef]
  30. Fiebig, A. Soundscape standardization dares the impossible—Case studies valuing current soundscape standards. In Proceedings of the 23rd International Congress on Acoustics, Aachen, Germany, 9–13 September 2019; pp. 6116–6122. [Google Scholar]
  31. International Organisation for Standardization. ISO/TS 12913-2:2018 Acoustics—Soundscape—Part 2: Data Collection and Reporting Requirements; International Organisation for Standardization: Geneva, Switzerland, 2018. [Google Scholar]
  32. Radicchi, A. A Pocket Guide to Soundwalking: Some Introductory Notes on its Origin, Established Methods and Four Experimental Variations. In Stadtökonomie—Blickwinkel und Perspektiven Ein Gemischtwarenladen Perspectives on Urban Economics A General Merchandise Store Eine kleine Buchführung für den Ladeninhaber Dietrich Henckel a Brief Overview of the Accounts for the Shopkeeper Dietrich Henckel; Besecke, A., Meier, J., Pätzold, R., Thomaier, S., Eds.; Universitätsverlag der TU Berlin: Berlin, Germany, 2017; pp. 70–73. ISBN 978-3-7983-2919-5. [Google Scholar]
  33. Truax, B. Handbook for Acoustic Ecology; Cambridge Street Publishing: Cambridge, MA, USA, 1999. [Google Scholar]
  34. Venot, F.; Sémidor, C. The “soundwalk” as an operational component for urban design. In Proceedings of the 23rd International Conference on Passive and Low Energy Architecture, Geneva, Switzerland, 6–8 September 2006. [Google Scholar]
  35. Adams, M.; Bruce, N.; Davies, W.J.; Cain, R.; Jennings, P.; Carlyle, A.; Cusack, P.; Hume, K.; Plack, C. Soundwalking as a methodology for understanding soundscapes. In Proceedings of the Institute of Acoustics, Reading, UK, 10–11 April 2008; Volume 30. [Google Scholar]
  36. Fiebig, A. Does it make a difference to have soundscape standards? In Proceedings of the Euronoise 2018, Crete, Greece, 27–31 May 2018; AEA: Crete, Greece, 2018. [Google Scholar]
  37. Aletta, F.; Brambilla, G.; Maffei, L.; Masullo, M. Urban Soundscapes: Characterization of a Pedestrian Tourist Route in Sorrento (Italy). Urban Sci. 2016, 1, 4. [Google Scholar] [CrossRef] [Green Version]
  38. Echevarria Sanchez, G.M.; Van Renterghem, T.; Sun, K.; De Coensel, B.; Botteldooren, D. Using Virtual Reality for assessing the role of noise in the audio-visual design of an urban public space. Landsc. Urban Plan. 2017, 167, 98–107. [Google Scholar] [CrossRef] [Green Version]
  39. Oberman, T.; Bojanić Obad Šćitaroci, B.; Jambrošić, K. Towards a Virtual Soundwalk. In Handbook of Research on Perception-Driven Approaches to Urban Assessment and Design; IGI Global: Pennsylvania, PA, USA, 2018. [Google Scholar]
  40. Volcler, J. Zvučna mapa grada. Prema urbanizmu zvuka. In Le Monde Diplomatique—Hrvatsko Izdanje; KopMedija: Zagreb, HR, 2013; pp. 28–29. [Google Scholar]
  41. Aletta, F.; Filipan, K.; Puyana Romero, V. Urban Soundscape. In Urban Sound Planning—The Sonorus Project; Kropp, W., Forssen, J., Estevez Mauriz, L., Eds.; Chalmers University of Technology: Gothenburg, Sweden, 2016. [Google Scholar]
  42. Lacey, J. Sonic Placemaking: Three approaches and ten attributes for the creation of enduring urban sound art installations. Organ. Sound 2016, 21, 147–159. [Google Scholar] [CrossRef]
  43. Meng, Q.; Zhao, T.; Kang, J. Influence of Music on the Behaviors of Crowd in Urban Open Public Spaces. Front. Psychol. 2018, 9, 596. [Google Scholar] [CrossRef] [Green Version]
  44. Oberman, T.; Bojanić Obad Šćitaroci, B.; Jambrošić, K.; Kang, J. Winter Buzz and Summer Siesta in Zagreb—Perceptual Differences in Soundscape of the Sequence of Urban Open Spaces; Instituto de Geografia e Ordenamento do Territorio: Lisbon, Portugal, 2017. [Google Scholar]
  45. Jambrošić, K.; Horvat, M.; Domitrović, H. Assessment of urban soundscapes with the focus on an architectural installation with musical features. J. Acoust. Soc. Am. 2013, 134, 869–879. [Google Scholar] [CrossRef]
  46. Fetterman, W. John Cage’s Theatre Pieces, 1st ed.; Routledge: London, UK, 2012; ISBN 978-0-203-05944-9. [Google Scholar]
  47. Cox, C.; Warner, D. (Eds.) Audio Culture: Readings in Modern Music; Continuum: New York, NY, USA, 2004; ISBN 978-0-8264-1614-8. [Google Scholar]
  48. Terhardt, E. Psychoacoustic evaluation of musical sounds. Percept. Psychophys. 1978, 23, 483–492. [Google Scholar] [CrossRef] [Green Version]
  49. Oberman, T. Soundscape of Urban Open Spaces—Factors and Models in Urban Sound Planning and Design; University of Zagreb: Zagreb, Croatia, 2015. [Google Scholar]
  50. Lavia, L.; Dixon, M.; Witchel, H.J.; Goldsmith, M. Applied Soundscape Practices. In Soundscape and the Built Environment; Kang, J., Schulte-Fortkamp, B., Eds.; Taylor & Francis: London, UK, 2016. [Google Scholar]
  51. Galbrun, L.; Ali, T.T. Acoustical and perceptual assessment of water sounds and their use over road traffic noise. J. Acoust. Soc. Am. 2013, 133, 227–237. [Google Scholar] [CrossRef] [Green Version]
  52. Rådsten Ekman, M. Unwanted Wanted Sounds Perception of Sounds from Water Structures in Urban Soundscapes; Department of Psychology, Stockholm University: Stockholm, Sweden, 2015. [Google Scholar]
  53. Davies, W.J.; Bruce, N.S.; Murphy, J.E. Soundscape Reproduction and Synthesis. Acta Acust. United Acust. 2014, 100, 285–292. [Google Scholar] [CrossRef] [Green Version]
  54. Guastavino, C.; Katz, B.F.G.; Polack, J.-D.; Levitin, D.J.; Dubois, D. Ecological Validity of Soundscape Reproduction. Acta Acust. United Acust. 2005, 91, 333–341. [Google Scholar]
  55. Xu, C.; Kang, J. Soundscape evaluation: Binaural or monaural? J. Acoust. Soc. Am. 2019, 145, 3208–3217. [Google Scholar] [CrossRef] [PubMed]
  56. Hong, J.Y.; Lam, B.; Ong, Z.-T.; Ooi, K.; Gan, W.-S.; Kang, J.; Feng, J.; Tan, S.-T. Quality assessment of acoustic environment reproduction methods for cinematic virtual reality in soundscape applications. Build. Environ. 2019, 149, 1–14. [Google Scholar] [CrossRef]
  57. Xiao, J.; Hilton, A. An Investigation of Soundscape Factors Influencing Perceptions of Square Dancing in Urban Streets: A Case Study in a County Level City in China. IJERPH 2019, 16, 840. [Google Scholar] [CrossRef] [Green Version]
  58. Calleri, C.; Astolfi, A.; Pellegrino, A.; Aletta, F.; Shtrepi, L.; Bo, E.; Di Stefano, M.; Orecchia, P. The Effect of Soundscapes and Lightscapes on the Perception of Safety and Social Presence Analyzed in a Laboratory Experiment. Sustainability 2019, 11, 3000. [Google Scholar] [CrossRef] [Green Version]
  59. Stamać, I. Acoustical and Musical Solution to Wave—Driven Sea Organ in Zadar. In Proceedings of the 2nd Congress of Alps-Adria Acoustics Association, Opatija, Croatia, 23–24 June 2005. [Google Scholar]
  60. Zanki, J. Promjene identiteta grada. Zarez 2013, 362, 2. [Google Scholar]
  61. Jergović, M. Nije problem u degeneriku koji razbija, problem je u degeneriranom društvu. Buka 2019. [Google Scholar]
  62. ISO. ISO 1996-1:2016 Acoustics—Description, Measurement and Assessment of Environmental Noise—Part 1: Basic Quantities and Assessment Procedures; Organisation for Standardization: Geneva, Switzerland, 2016. [Google Scholar]
  63. Oberman, T.; Bojanić Obad Šćitaroci, B.; Jambrošić, K. Integral approach to enhancement of soundscape in urban open space. Prostor 2015, 23, 118–129. [Google Scholar]
  64. Holzer-Kernbichler, M.; Pakesch, P. Kunsthaus Graz—Architectural Guide; Kunsthaus Graz, Universalmuseum Joanneum: Graz, Austria, 2004. [Google Scholar]
  65. Neuhaus, M.; Cooke, L.; Kelly, K.J.; Schröder, B. Max Neuhaus: Times Square, Time Piece Beacon; Dia Art Foundation; Distributed by Yale University Press: New York, NY, USA; New Haven, CT, USA, 2009; ISBN 978-0-300-15167-1. [Google Scholar]
  66. Irnberger, W.; Ritsch, W. Timepiece—Server Linux Sound Server for Sound Installation from Max Neuhaus Kunsthaus Graz 2003; Graz, Austria, Technical report; 2013. [Google Scholar]
  67. Brilly, M.; Horvat, A.; Matthews, D.; Šraj, M. Climate change impact on mean annual river flows. In Impact of Climate Change on Water Resources—200 Years Hydrology in Europe: A European Perspective in a Changing World; Euraqua Symposium 9–10 November 2010, Koblenz; Bundesanstalt für Gewässerkunde, Symposium Impact of Climate Change on Water Resources—200 Years Hydrology in Europe—A European Perspective in a Changing World, Eds.; Veranstaltungen/Bundesanstalt für Gewässerkunde: Koblenz, Germany; BfG: Koblenz, Germany, 2011; pp. 62–70. ISBN 978-3-940247-03-2. [Google Scholar]
  68. Bojanić Obad Šćitaroci, B.; Obad-Šćitaroci, M. Gradski Perivoji Hrvatske u 19. Stoljeću: Javna Perivojna Arhitektura Hrvatskih Gradova u Europskom Kontekstu; Šćitaroci d.o.o.: Zagreb, Croatia, 2004; ISBN 978-953-97121-3-4. [Google Scholar]
  69. Obad Šćitaroci, M. Maksimir: A romantic episcopal park in Zagreb, Croatia. J. Gard. Hist. 1994, 28, 119–132. [Google Scholar] [CrossRef]
  70. Petričević. Obnova pavijona Jeka u Maksimiru. Društvo arhitekata Zagreba - Arhitektura i naslijeđe. Available online: http://www.d-a-z.hr/hr/vijesti/obnova-paviljona-jeka-u-maksimiru,626.html (accessed on 28 December 2019).
  71. De Coensel, B.; Kang, S.; Botteldooren, D. Urban Soundscapes of the World: Selection and reproduction of urban acoustic environments with soundscape in mind. In Proceedings of the INTER-NOISE 2017 46th International Congress and Exposition on Noise Control Engineering, Hong Kong, China, 27–30 August 2017. [Google Scholar]
  72. Sun, K.; De Coensel, B.; Filipan, K.; Aletta, F.; Van Renterghem, T.; De Pessemier, T.; Joseph, W.; Botteldooren, D. Classification of soundscapes of urban public open spaces. Landsc. Urban Plan. 2019, 189, 139–155. [Google Scholar] [CrossRef] [Green Version]
  73. Kogan, P.; Turra, B.; Arenas, J.P.; Hinalaf, M. A comprehensive methodology for the multidimensional and synchronic data collecting in soundscape. Sci. Total Environ. 2017, 580, 1068–1077. [Google Scholar] [CrossRef] [PubMed]
  74. Axelsson, Ö.; Nilsson, M.E.; Berglund, B. A principal components model of soundscape perception. J. Acoust. Soc. Am. 2010, 128, 2836–2846. [Google Scholar] [CrossRef] [PubMed]
  75. Watts, G.R.; Pheasant, R.J.; Horoshenkov, K.V. Predicting perceived tranquillity in urban parks and open spaces. Environ. Plan. B 2011, 38, 585–594. [Google Scholar] [CrossRef]
  76. Hedfors, P. Site Soundscapes: Landscape Architecture in the Light of Sound; Sonotope Design Strategies; Acta Universitatis Agriculturae Sueciae Agraria; VDM: Saarbrücken, Germany, 2008; ISBN 978-3-639-09413-8. [Google Scholar]
  77. Kang, J.; Zhang, M. Semantic differential analysis of the soundscape in urban open public spaces. Build. Environ. 2010, 45, 150–157. [Google Scholar] [CrossRef]
  78. Hong, J.; He, J.; Lam, B.; Gupta, R.; Gan, W.-S. Spatial Audio for Soundscape Design: Recording and Reproduction. Appl. Sci. 2017, 7, 627. [Google Scholar] [CrossRef] [Green Version]
  79. Axelsson, Ö. Soundscape and Sociotope Mapping to Survey Brighton Residents. Presented at the Sounding Brighton, Brighton, UK, 18–19 June 2012. [Google Scholar]
  80. Zwicker, E.; Fastl, H. Psychoacoustics: Facts and Models, 2nd ed.; Springer: Berlin/Heidelberg, Germany; New York, NY, USA, 1999; ISBN 978-3-540-65063-8. [Google Scholar]
  81. Genuit, K.; Fiebig, A. Do we need psychoacoustics within soundscape? In Proceedings of the ICA 2016: Acoustics for the 21st Century, Buenos Aires, Argentina, 5–9 September 2016; ICA: Buenos Aires, Argentina, 2016. [Google Scholar]
  82. Daniel, J.; Nicol, R.; Moreau, S. Further Investigations of High Order Ambisonics and Wavefield Synthesis for Holophonic Sound Imaging. In Proceedings of the AES 114th Convention, Amsterdam, The Netherlands, 22–25 March 2003; AES: Amsterdam, The Netherlands, 2003. [Google Scholar]
  83. Axelsson, Ö.; Nilsson, M.E.; Hellström, B.; Lundén, P. A field experiment on the impact of sounds from a jet-and-basin fountain on soundscape quality in an urban park. Landsc. Urban Plan. 2014, 123, 49–60. [Google Scholar] [CrossRef] [Green Version]
  84. Hong, J.Y.; Lam, B.; Ong, Z.-T.; Ooi, K.; Gan, W.-S.; Kang, J.; Yeong, S.; Lee, I.; Tan, S.-T. The effects of spatial separations between water sound and traffic noise sources on soundscape assessment. Build. Environ. 2020, 167, 106423. [Google Scholar] [CrossRef]
  85. Aletta, F.; Kang, J. Towards an Urban Vibrancy Model: A Soundscape Approach. IJERPH 2018, 15, 1712. [Google Scholar] [CrossRef] [Green Version]
  86. Građanima s Rive Smeta Buka Treba li “ugasiti” Morske orgulje! Zadarski.hr. Available online: https://zadarski.slobodnadalmacija.hr/zadar/4-kantuna/gradanima-s-rive-smeta-buka-treba-li-ugasiti-morske-orgulje-455719 (accessed on 2 January 2020).
  87. Kalajžić, M. Pozivam gradske čelnike: Mijenjajmo se, dođite spavati u moj stan pa ćete vidjeti u kojim uvjetima mi živimo! Zadarski.hr. Available online: https://zadarski.slobodnadalmacija.hr/zadar/4-kantuna/pozivam-gradske-celnike-mijenjajmo-se-dodite-spavati-u-moj-stan-pa-cete-vidjeti-u-kojim-uvjetima-mi-zivimo-490028 (accessed on 2 January 2020).
  88. Bunn, F.; Zannin, P.H.T. Assessment of railway noise in an urban setting. Appl. Acoust. 2016, 104, 16–23. [Google Scholar] [CrossRef]
  89. Flores, R.; Gagliardi, P.; Asensio, C.; Licitra, G. A Case Study of the Influence of Urban Morphology on Aircraft Noise. Acoust. Aust. 2017, 45, 389–401. [Google Scholar] [CrossRef]
  90. Fredianelli, L.; Gallo, P.; Licitra, G.; Carpita, S. Analytical assessment of wind turbine noise impact at receiver by means of residual noise determination without the wind farm shutdown. Noise Control Eng. J. 2017, 65, 417–433. [Google Scholar] [CrossRef]
  91. De Coensel, B.; Bockstael, A.; Dekoninck, L.; Botteldooren, D.; Schulte-Fortkamp, B.; Kang, J.; Nilsson, M.E. The soundscape approach for early stage urban planning: A case study. In Proceedings of the Internoise, Lisbon, Portugal, 13–16 June 2010; Institute of Noise Control Engineering: Lisabon, Portugal, 2010. [Google Scholar]
  92. Pakesch, P.; Loock, U. A Talk between Peter Pakesch and Ulrich Loock about Max Neuhaus’s Time Pieces. In Max Neuhaus: Times Square, Time Piece Beacon; Dia Art Foundation; Distributed by Yale University Press: New York, NY, USA; New Haven, CT, USA, 2007; pp. 82–90. ISBN 978-0-300-15167-1. [Google Scholar]
  93. Cox, T.J. Sonic Wonderland: A Scientific Odyssey of Sound; Vintage: London, UK, 2014; ISBN 978-1-84792-210-6. [Google Scholar]
Figure 1. Satellite images of the case study sites (from left to right): (A) Obala Petra Krešimira IV seaside promenade in Zadar (HR), (B) Kunsthaus Graz plaza in Graz (AT), (C) Maksimir Park in Zagreb (HR). Measurement points are marked with a corresponding code. Satellite images obtained using the Google Earth Pro 7.3.2.5776 application.
Applsci 10 02102 g001
Figure 2. Spectrograms of 5 s-long excerpts, recorded as described in Section 2.2.1, with visible sound sources from soundscape interventions from the Locations (A), (B), and (C) (from left to right). Spectrograms were created using the application RX 6 Audio Editor v6.00.1210 (by iZotope).
Applsci 10 02102 g002
Figure 3. Panoramic pictures taken at each measurement point, used as visual stimuli for the experiment. The original pictures were 9756 × 2206 pixels large, displayed on a 27-inch screen. Locations A1 and A2: Obala Petra Krešimira IV, Zadar; locations B1 and B2: Kunsthaus Graz, Lendkai, Graz; locations C1 and C2: Pavilion of Echo(es) in Maksimir Park, Zagreb.
Applsci 10 02102 g003
Figure 4. The percentage of the picture showing foliage as follows: A1 25.2%, A2 11.7%, B1 20.0%, B2 39%, C1 70.9%, C2 27.6%.
Applsci 10 02102 g004
Figure 5. Mean values of soundscape descriptors quantified using a Likert scale where 1 represents the lowest and 5 the highest value. ‘Positive’ difference is marked in dark grey, while the ‘negative’ difference is marked by the line hatch. It is presumed that exciting–monotonous and calm–chaotic dimensions are perpendicular to each other and equidistant from eventful and pleasant dimensions, as this is a presumption widely spread in literature although not yet confirmed.
Applsci 10 02102 g005
Figure 6. Mean values of soundscape descriptors (on y-axes), shown against the psychoacoustic measures (on x-axes) across all measurement points. In the loudness-related graphs N5 values are represented by blue dots and trend curves, and N95 by the orange ones respectively.
Applsci 10 02102 g006aApplsci 10 02102 g006b
Table 1. Overview of the analyzed urban open spaces and recordings/measurement points. Weather conditions were noted on the day of the recording.
Urban Open Space Area (ha)Distance between the Selected Measurement PointsMeasurement PointDate and Time of the RecordingWeather Conditions at the Time of the Recording
Obala Petra Krešimira IV, Zadar4.73 ha360 mA1
Next to the Forum
24th of September 2014, 12:27—12:37 (10 min)20 °C/wind 9 km/h/sunny/1080.0 mb
A2
At the Sea Organ/next to-amongst the sound sources
24th of September 2014, 12:43—12:55 (12 min)20 °C/wind 9 km/h/sunny/1080.0 mb
Kunsthaus Graz plaza at Lendkai 1, Graz0.04 ha20 mB1
Kunsthaus Graz entrance/below the sound sources
17th of September 2014, 12:51—13:01 (10 min)18 °C/wind 6 km/h/partially cloudy/1018.0 mb
B2
Lendkai, next to the Mur river
17th of September 2014, 14:44—14:58 (14 min)18 °C/wind 6 km/h/partially cloudy/1019.0 mb
Pavilion of Echo(es) at Maksimir Park, Zagreb195 ha10 mC1
Next to the main axis
20th of November 2014, 13:08—13:18 (10 min)10 °C/wind 6 km/h/partially cloudy/1024.0 mb
C2
At the Pavilion of Echo(es)
20th of November 2014, 13:20—13:30 (10 min)10 °C/wind 6 km/h/partially cloudy/1024.0 mb
Table 2. Acoustic and psychoacoustic measures calculated using ArtemiS application (by Head Acoustics)
A1A2B1B2C1C2
Level LAeq,5min/dBA43.761.564.067.156.171.3
Level LCEQ,5min/dBC53.374.472.476.262.471.7
Loudness N/soneGF4.413.818.623.411.226.5
Loudness N5/soneGF5.016.024.329.213.032.7
Loudness N95/soneGF3.211.013.518.15.57.5
Sharpness S/acum1.21.92.02.32.33.1
Roughness R/asper0.0150.0360.0310.0420.0260.214
Table 3. Statistical significance in change of the perceived dominance in sound source types with (2) and without (1) the designed sound source introduced
Mean Value
LocationSound Source Type12Lower LimitDifferenceUpper Limitp-Value
ATraffic noise49.1131.897.7417.2326.710.0004
Other noise45.0333.132.4311.9021.370.0138
Human sounds40.9640.04−8.100.929.950.8408
Natural sounds35.6944.20−18.13−8.511.120.0832
Designed sound sources35.1044.78−18.95−9.67−0.390.0410
Acoustic effect39.5141.49−11.93−1.977.980.6974
BTraffic noise39.1243.88−12.84−4.763.330.2489
Other noise43.1037.90−4.595.2014.990.2979
Human sounds50.8131.439.9519.3928.820.0001
Natural sounds38.1044.90−16.22−6.802.610.1566
Designed sound sources43.2338.83−5.454.4014.240.3817
Acoustic effect38.2144.79−16.50−6.593.330.1928
CTraffic noise41.4439.56−7.491.8811.240.6948
Other noise46.2031.994.8614.2123.560.0029
Human sounds38.5442.46−13.41−3.935.560.4174
Natural sounds46.0533.792.8012.2621.710.0111
Designed sound sources37.2543.75−15.62−6.502.620.1626
Acoustic effect26.9554.05−36.99−27.10−17.210.0000
Table 4. Statistical significance of change in soundscape descriptors between the measurement points
Mean Value
LocationSoundscape Descriptor12 Difference p-Value
APleasant33.0345.97−21.83−12.95−4.070.0043
Calm36.3542.65−16.08−6.313.470.2059
Uneventful41.4037.60−5.743.7913.330.4355
Monotonous38.0041.00−12.71−3.006.710.5447
Unpleasant41.3237.68−5.843.6413.120.4515
Chaotic39.7339.27−9.120.4610.050.9248
Eventful39.3637.68−7.731.6911.100.7256
Exciting36.2442.76−16.20−6.513.180.1877
BPleasant42.6138.39−5.514.2213.960.3950
Calm47.0133.993.6013.0322.450.0068
Uneventful40.4940.51−9.95−0.039.900.9961
Monotonous39.6541.35−11.55−1.708.150.7352
Unpleasant35.2545.75−20.09−10.50−0.910.0320
Chaotic36.3144.69−17.98−8.381.230.0875
Eventful39.2941.71−12.31−2.437.460.6308
Exciting42.2638.74−6.333.5313.380.4833
CPleasant44.8536.15−0.758.7018.150.0712
Calm48.0632.945.3715.1324.880.0024
Uneventful43.4837.53−3.785.9515.680.2308
Monotonous45.0535.95−0.739.1018.930.0696
Unpleasant38.6842.33−13.25−3.655.950.4560
Chaotic37.1843.83−16.47−6.653.170.1845
Eventful38.2842.73−14.30−4.455.400.3759
Exciting30.6748.3327.40−17.67−7.930.0004
Table 5. Statistical significance of change in appropriateness and visual setting between measurement points.
A1 vs. A2/p-ValueB1 vs. B2/p-ValueC1 vs. C2/p-Value
Is the acoustic environment appropriate for this place?0.01460.00020.6609
How would you rate the overall visual setting?0.02760.18500.0784

