Article

Thermoelectricity Modeling with Cold Dipole Atoms in Aubry Phase of Optical Lattice

1
Budker Institute of Nuclear Physics, 630090 Novosibirsk, Russia
2
Department of Physics, Novosibirsk State University, 630090 Novosibirsk, Russia
3
Novosibirsk State Technical University, 630092 Novosibirsk, Russia
4
Institut UTINAM, OSU THETA, CNRS, Université Bourgogne Franche-Comté, 25000 Besançon, France
5
Laboratoire de Physique Théorique du CNRS, IRSAMC, Université de Toulouse, UPS, 31062 Toulouse, France
*
Author to whom correspondence should be addressed.
Appl. Sci. 2020, 10(6), 2090; https://doi.org/10.3390/app10062090
Submission received: 1 February 2020 / Revised: 6 March 2020 / Accepted: 17 March 2020 / Published: 19 March 2020
(This article belongs to the Special Issue Optical Trapping of Ions and Atoms 2020: Novel Advances and Prospects)

Abstract

:
We study analytically and numerically the thermoelectric properties of a chain of cold atoms with dipole-dipole interactions placed in an optical periodic potential. At small potential amplitudes the chain slides freely that corresponds to the Kolmogorov-Arnold-Moser phase of integrable curves of a symplectic map. Above a certain critical amplitude the chain is pinned by the lattice being in the cantori Aubry phase. We show that the Aubry phase is characterized by exceptional thermoelectric properties with the figure of merit Z T = 25 being 10 times larger than the maximal value reached in material science experiments. We show that this system is well accessible for magneto-dipole cold atom experiments that opens new prospects for investigations of thermoelectricity.

1. Introduction

The phenomenon of Aubry transition describes the transport properties of a chain of particles linked by linear springs in a periodic potential. At a small potential amplitude the chain slides freely while above a certain potential amplitude it is pinned by the potential. This system is known as the Frenkel-Kontorova model [1]. The transition takes place at a fixed incommensurate density of particles per period ν . In fact the equilibrium positions of particles are described by the Chirikov standard map [2,3,4] that represents a cornerstone model of systems with dynamical chaos and symplectic maps. Indeed, a variety of physical systems can be locally described by this map [5]. In the frame of map description a density of particles corresponds to a winding number of an invariant Kolmogorov-Arnold-Moser (KAM) curve. Such curves cover the main part of the phase space at small potential amplitudes (small kick amplitudes K of the map). At large amplitudes the main part of phase space becomes chaotic and the KAM curves are transformed into cantori invariant sets which correspond to the chain ground states at a given density, as it was proved by Aubry [6]. In addition to nontrivial mathematical properties, the Frenkel-Kontorova model represents a fundamental interest for incommensurate crystals of interacting particles [7].
An experimental realization of linear spring interactions between particles is not very realistic. Thus in [8] it was proposed to consider a chain of Coulomb charges placed in a periodic potential. It was shown that this system of a one-dimensional (1D) Wigner crystal in a periodic potential can be locally described by the Chirikov standard map and the Frenkel-Kontorova model. Thus the Aubry-like transition from the sliding KAM phase to the Aubry pinned phase takes place at a certain critical potential amplitude K c . The dependence of K c on the density ν is obtained by a local description in terms of the Chirikov standard map [8,9]. For an experimental realization of the Aubry-like transition it was proposed to use cold ions placed in both a periodic potential and a global harmonic trap [8]. The experimental studies of such a system had been started in [10,11]. The first signatures of the Aubry transition have been reported by the Vuletic group with up to five ions [12]. The chains with a larger number of ions are now under investigations in [13,14].
A significant interest for a Wigner crystal transport in a periodic potential is related to the recent results showing that the Aubry phase is characterized by remarkable thermoelectric properties with high Seebeck coefficient S and high figure of merit Z T [9,15]. The fundamental grounds of thermoelectricity had been established in far 1957 by Ioffe [16,17]. The thermoelectricity is characterized by the Seebeck coefficient S = Δ V / Δ T (or thermopower). It is expressed through a voltage difference Δ V compensated by a temperature difference Δ T . Below we use units with a charge e = 1 and the Boltzmann constant k B = 1 so that S is dimensionless ( S = 1 corresponds to S 88 μ V / K (microvolt per Kelvin)). The thermoelectric materials are ranked by a figure of merit Z T = S 2 σ T / κ [16,17] where σ is the electric conductivity, T the temperature, and κ the material thermal conductivity.
At present, the request for efficient energy usage stimulated extensive investigations of various materials with high characteristics of thermoelectricity as reviewed in [18,19,20,21,22]. The request is to find materials with Z T > 3 that would allow an efficient conversion between electrical and thermal forms of energy. The best thermoelectric materials created till now have Z T 2.6 . At the same time, the numerical modeling reported for a Wigner crystal in the Aubry phase reached values Z T 8 [9,15].
Thus, investigations of Wigner crystal transport in a periodic potential can help to understand the conditions favoring high Z T values. At present, a hundred of cold trapped-ions can be routinely kept for hours in experimental device [23] and thus such a system is promising for experimental investigations of thermoelectricity [9]. However, for a typical distance between charges being 1 μ m the Coulomb interactions are rather strong and very high amplitudes of optical lattice potential V A k B × 3 K (Kelvin) are required [9]. This is hard to reach experimentally since typical optical potential amplitudes are V A k B × 10 3 K [24]. Thus to find a more suitable experimental realization of Aubry transition we study here a chain of magneto-dipole atoms placed in an optical periodic potential. The strength of interactions between nearby magneto-dipole atoms on a distance of 1 μ m is significantly smaller compared to Coulomb interactions, and thus a significantly smaller amplitude of the optical potential is required for the observation of the Aubry-like transition. Indeed, the experimental investigations of quantum properties of cold magneto-dipole atoms allowed to observe a number of interesting many-body effects (see e.g., [25,26,27]).

2. Methods

The chain of atoms with magneto-dipole interactions in 1D periodic potential is described by the Hamiltonian:
H = i = 1 N P i 2 2 + V ( x i ) + U I , V ( x i ) = K cos x i , U I = i > j U d d x i x j 3
Here x i , P i are conjugated coordinate and momentum of atom i, and V ( x ) is an external periodic optical potential of amplitude K. The magneto-dipole-dipole interactions are given by the U I U d d = μ 2 / ( / 2 π ) 3 term with μ 10 μ B (for 164 Dy atoms) and μ B is the Bohr magneton (we assume all magnetic momenta to be polarized) [25]. The Hamiltonian is written in dimensionless units where the lattice period is = 2 π and atom mass is m = 1 . In the following we also take U d d = 1 so that K in (1) is the dimensionless amplitude of the periodic potential and thus the physical interaction is U A = U d d K . In these atomic-type units, the physical system parameters are measured in units of r a = / 2 π for length, and of ϵ a = μ 2 / r a 3 = U d d for energy. For = 1 μ m the dimensionless temperature T = 1 (or k B T ) corresponds to the physical temperature T = ϵ a / k B = 100 μ B 2 / ( k B ( / 2 π ) 3 ) 25 nK (nano-Kelvin) at μ = 10 μ B .
The thermoelectric properties of model (1) are determined in the framework of the Langevin approach [9,15] with the equations of motion: P i ˙ = v ˙ i = H / x i + f d c η P i + g ξ i ( t ) , x i ˙ = P i = v i . Here η describes phenomenologically the dissipative relaxation processes, and the amplitude of Langevin force g is given by the fluctuation-dissipation theorem g = 2 η T ; the random variables ξ i have normal distribution being δ -correlated, v i is atom velocity, f d c is a static force applied to atoms. As in [9,15], we use η = 0.02 , the results being not sensitive to this quantity. The computations of S are done as it is described in [9,15]. At fixed temperature T, we apply a static force f d c which creates an energy (voltage) drop Δ V = f d c 2 π L and a gradient of atom density ν ( x ) along the chain with L potential periods and N atoms. Then, for f d c = 0 within the Langevin equations, we impose a linear gradient of temperature Δ T along the chain, and in the stabilized steady-state regime, we determine the charge density gradient of ν ( x ) along the chain (see e.g., Figure 2 in [15]). The data are obtained in the linear regime of relatively small f d c and Δ T values. Then, the Seebeck coefficient, S = Δ V / Δ T , is computed using values of Δ V and Δ T for which the density gradient obtained from the application of a voltage Δ V compensates the one obtained from the application of a gradient of temperature Δ T . We used the computation times up to t = 10 8 to achieve the relaxation of the chain and to reach the required statistical accuracy.
We assume that the cold atoms are in contact with an external environment which is able to play the role of thermostat (e.g., residual gas). In order to compute Seebeck coefficient, we need a temperature gradient along the chain. In the Langevin equation, we can impose that the temperature T is a function of the atom position x along the chain, T = T ( x ) = T 0 + g x , where T 0 is the average temperature and g = d T / d x is a small temperature gradient. In cold atom experiments, such a temperature gradient can be setup by multiple laser beams generating a zero average fluctuating force f ( x ) . The average of the square of the force, f 2 ( x ) , should change linearly along the chain. Consequently, these laser beams induced fluctuating forces will create additional ion velocity fluctuations with ( δ v i ) 2 f 2 ( x ) ( T ( x ) T 0 ) = g x producing a temperature gradient along the ion chain.

3. Results

3.1. Ground State Properties

The equilibrium static atom positions are determined by the conditions H / x i = 0 , P i = 0 [6,8,9]. In the approximation of nearest neighbor interacting atom, this leads to the symplectic map for recurrent atom positions x i
p i + 1 = p i + ( K / 3 ) g ( x i ) , x i + 1 = x i + 1 / p i + 1 1 / 4 ,
where the effective momentum p i = 1 / ( x i x i 1 ) 4 is conjugated to x i and the kick function g ( x ) is such as K g ( x i ) / 3 = d V / d x x = x i / 3 = ( K / 3 ) sin x i . This map description assumes only nearest neighbor interactions. Below, we show that it well describes the real situation with interactions between all the atoms. This is rather natural since the nearest neighbor approximation worked already well for ions with Coulomb interactions [8,9], moreover for dipole atoms, the interactions drop even faster with the distance between atoms.
As in [9,15], the validity of the map (2) is checked numerically by finding the ground state configuration using numerical methods of energy minimization described in [6,8] and taking into account the long range nature of the interactions between all the atoms. The obtained ground state positions, x 1 , , x N , of the N atoms allows to recursively determine the N effective momenta, p 1 , , p N , by inverting the second equation of the map (2), p i = x i + 1 x i 4 . Once obtained, the effective momenta can be used to compute successively N values g ( x 1 ) , , g ( x N ) of the kick function g ( x ) , by using the first equation of the map (2), K / 3 g ( x i ) = p i p i + 1 . Figure 1 (top panels) shows that the map (2), obtained in the nearest neighbor approximation, is indeed valid since the g ( x 1 ) , , g ( x N ) values fall on the top of the function g ( x ) = sin x analytically obtained from the equations of motion derived from the Hamiltonian (1). This means that the description of the positions of the N atoms in the ground state can be mapped on a dynamical problem of a fictitious kicked particle taking successively the positions, x 1 , , x N , and the momenta, p 1 , , p N . The dynamics of the fictitious kicked particle is governed by the map (2). Phase space portraits of the map (2) is given in Figure 1 (middle panels). A phase space portrait (green points and curves) is obtained by taking many different initial conditions ( x 0 , p 0 ) and computing many of the corresponding successive phase space points ( x i , p i ) . In Figure 1 (middle panels), we show the phase space portrait for KAM phase ( K = 0.02 < K c , left panel) and for the Aubry phase ( K = 0.1 > K c , right panel). We observe that the ground state positions of the atoms (red circles) are located, for K = 0.02 (left panel), on the top of an invariant KAM curve which is a situation corresponding to a regular motion of the fictitious kicked particle, and, for K = 0.1 (right panel), in the chaotic component of the phase space portrait which is a situation corresponding to a chaotic motion of the fictitious kicked particle. All the chaotic dynamics concepts used in the article are well documented in the literature (see, for example, [3,4]). Figure 1 (bottom panels) shows the hull function h ( x ) = ( x i + π ) [ mod 2 π ] π with x = ( 2 π ( i 1 ) / ν + π ) [ mod 2 π ] π . Indeed, for K 0 , i.e., for a vanishing optical potential, we have h ( x ) = x . For K < K c , the hull function h ( x ) still follows this linear law with smooth deviations, while, for K > K c , we obtain the devil’s staircase corresponding to the fractal cantori structure of the chaotic phase space. The transition from the smooth hull function, which is typical for a sliding chain in the KAM phase, to the devil’s staircase, which is typical for a pinned chain in the Aubry phase, is visible in Figure 1 (bottom panels). Thus, with ν = 89 / 55 ν g = ( 1 + 5 ) / 2 = 1.618 , i.e., 89 atoms (in their ground state) distributed in 55 optical potential wells, the Aubry transition takes place at a certain K c inside the interval 0.02 < K c < 0.01 .
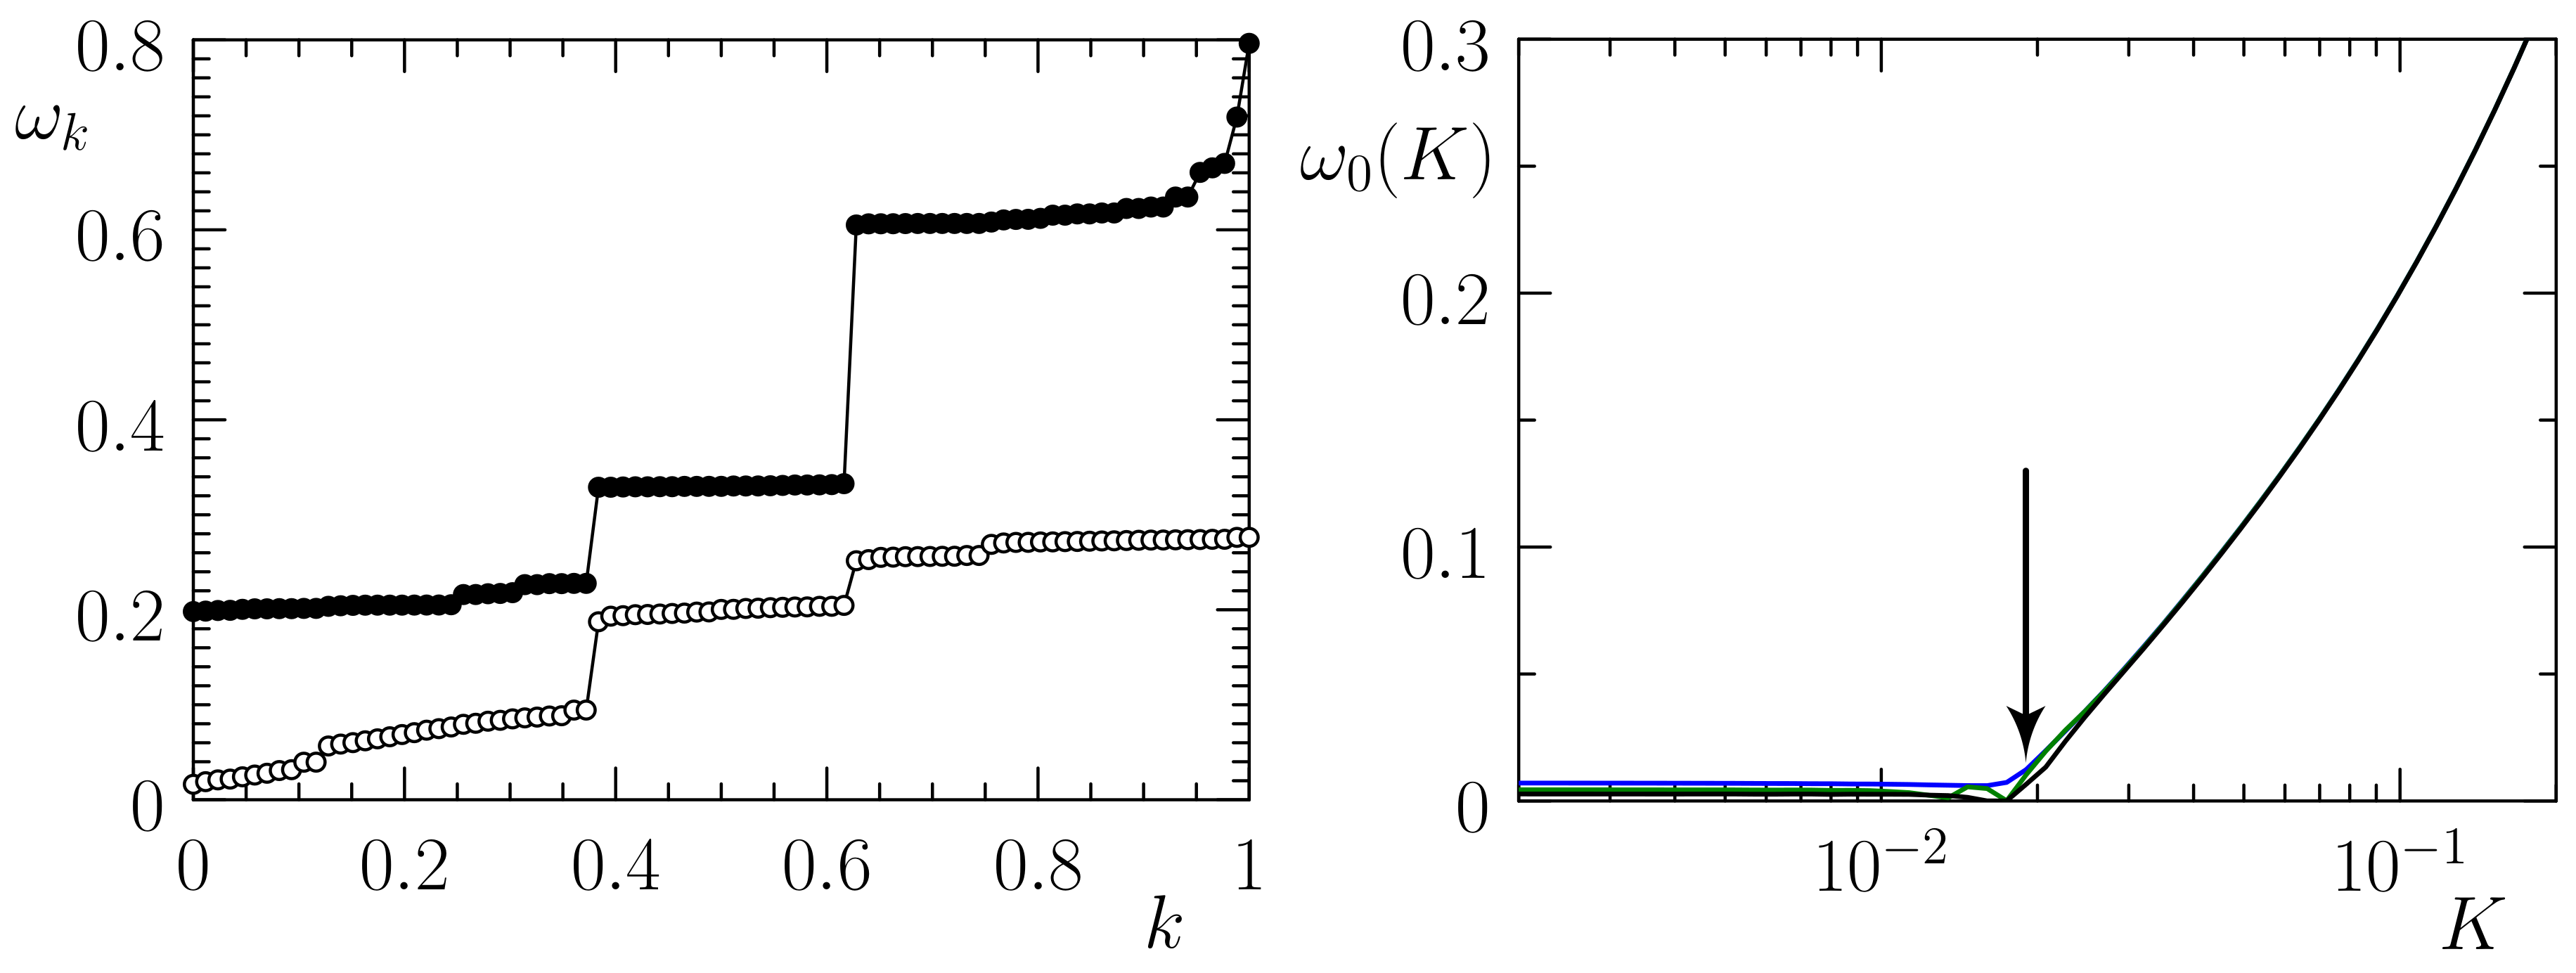
The equations of motion can be linearized in a vicinity of equilibrium positions and, in this way, we obtain the phonon spectrum ω ( k ) of small oscillations with k = i / N being a scaled mode number. The examples of spectrum are shown in Figure 2 (left panel). At K = 0.02 , in the KAM phase, we have ω k corresponding to the acoustic modes, while at K = 0.1 , inside the Aubry phase, we have appearance of an optical spectral gap related to the atomic chain pinned by the potential. Such a modification of the spectrum properties is similar to the cases of the Frenkel-Kontorova model [6] and the ion chain [8,9]. Figure 2 (right panel) shows that the minimal spectral frequency ω 0 ( K ) is practically independent of the optical potential amplitude K inside the KAM phase at K < K c (being close to zero with ω 0 1 / L ) and it increases with K inside the Aubry phase being independent of L for K > K c . Thus, the critical K c values can be approximately determined as an intersection of a horizontal line ω 0 = c o n s t with a curve of growing ω 0 ( K ) at K > K c . From these properties, we obtain numerically that K c 0.019 for the Fibonacci density ν ν g = 1.618 We obtained also K c 0.14 for ν = 2.618 , and K c 0.4 for ν = 3.618 .

3.2. Density Dependence of Aubry Transition

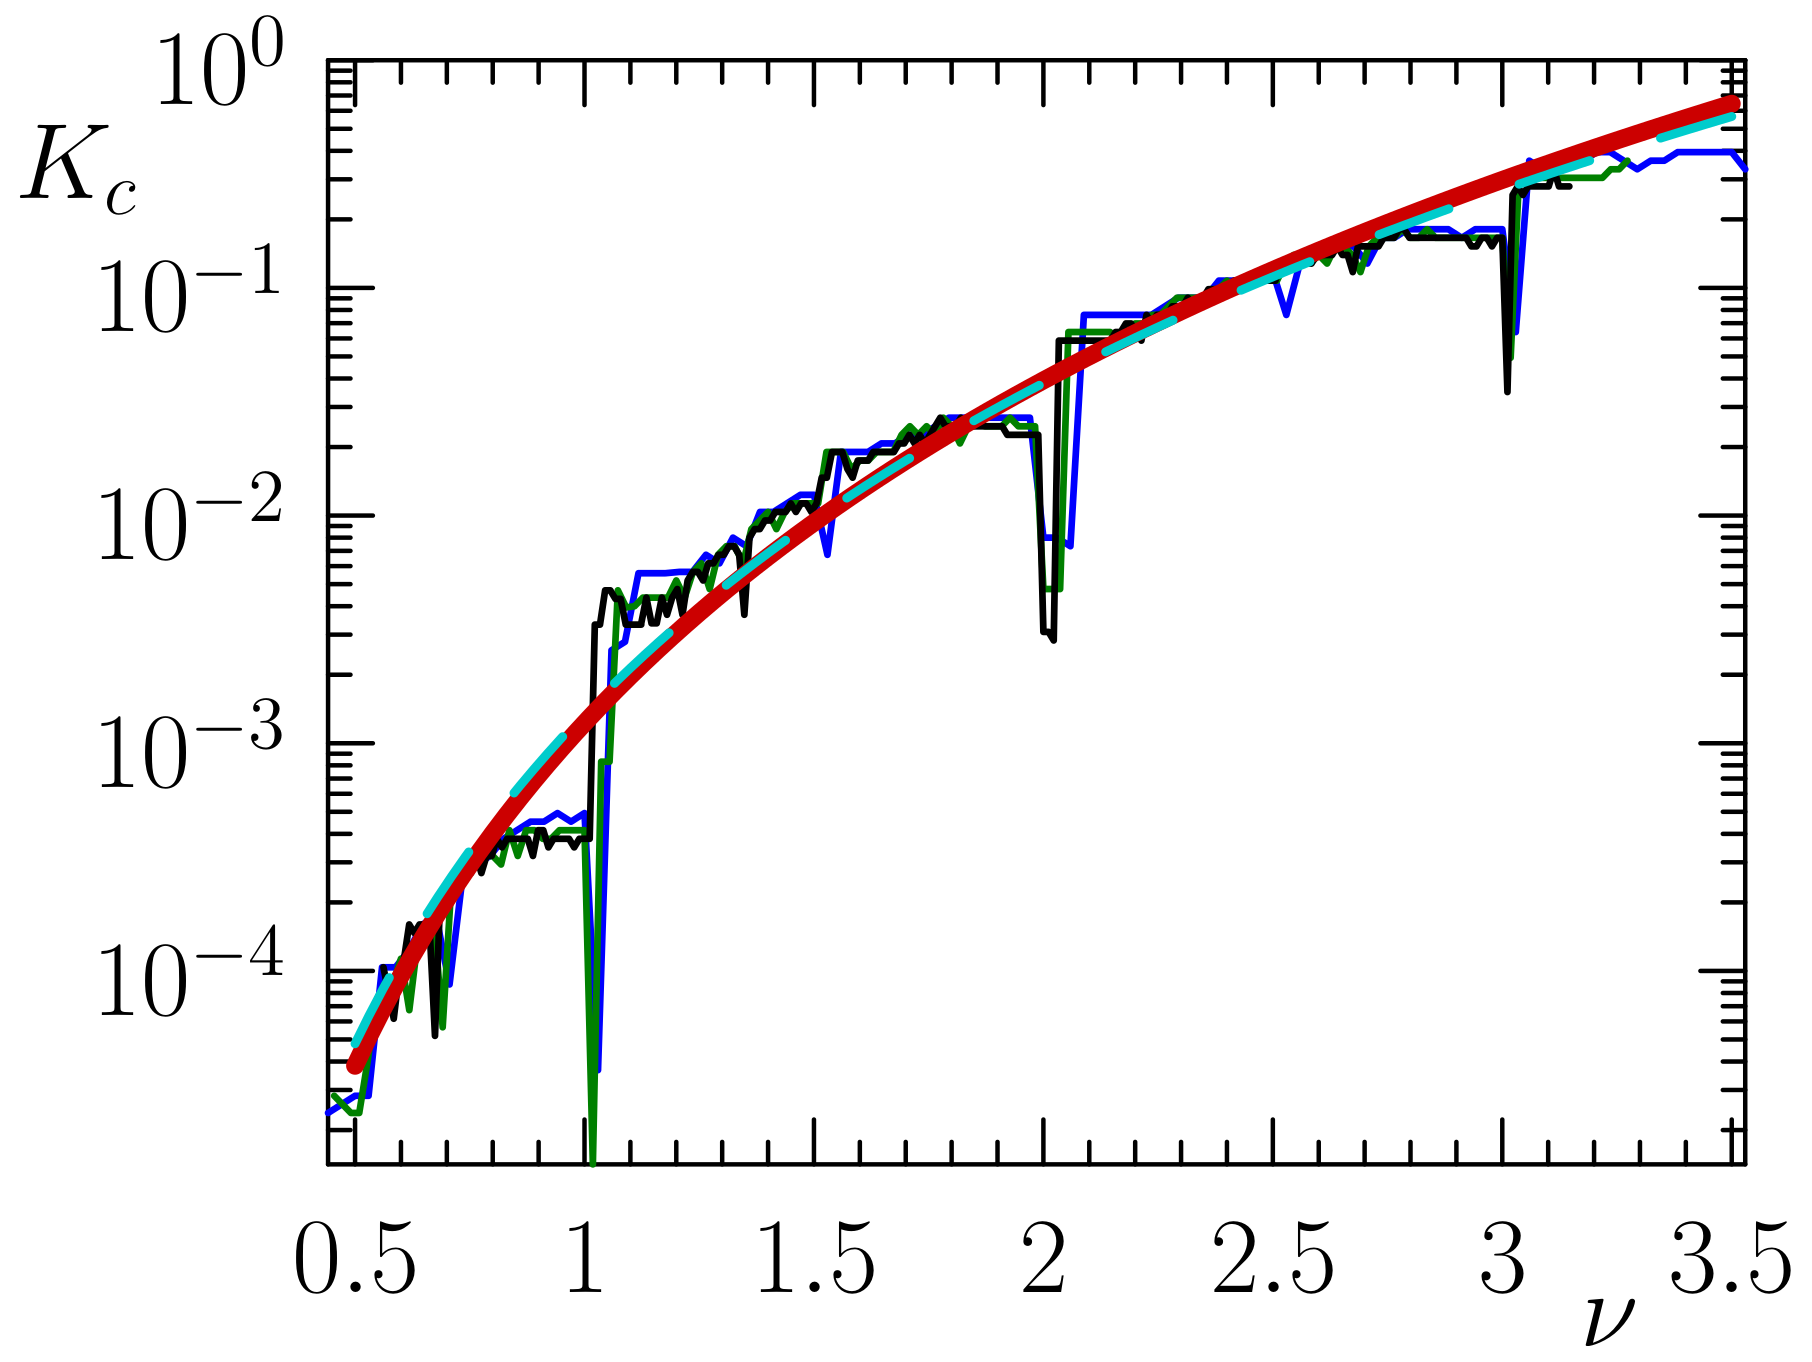
The dependence of Aubry transition point K c ( ν ) can be obtained from the local description of the map (2) by the Chirikov standard map. For that, the equation of x i + 1 in (2) is linearized in p i + 1 near the resonant value p r that leads to the standard map form y i + 1 = y i K eff sin x i , x i + 1 = x i y i + 1 with y i p i and K eff = ( 2 π ) 5 K / ( 12 ν 5 ) (see details in Appendix A and [9]). The last KAM curve is destroyed at K eff 1 [2,3] that gives
K c 12 ( ν / 2 π ) 5 0.0136 ( ν / ν g ) 5 , ν g = 1.618
The numerically obtained dependence K c ( ν ) is shown in Figure 3 for three different chain lengths L. On average, it is well described by the theory (3) taking into account that K c is changed by almost four orders of magnitude for the considered range 0.5 ν 3.5 . There are certain deviations in the vicinity of integer resonant densities ν = 1 , 2 , 3 which should be attributed to the presence of a chaotic separatrix layer at such resonances that reduces significantly the critical K c for KAM curve destruction (similar effect has been discussed for the ion chains [9]).

3.3. Seebeck Coefficient

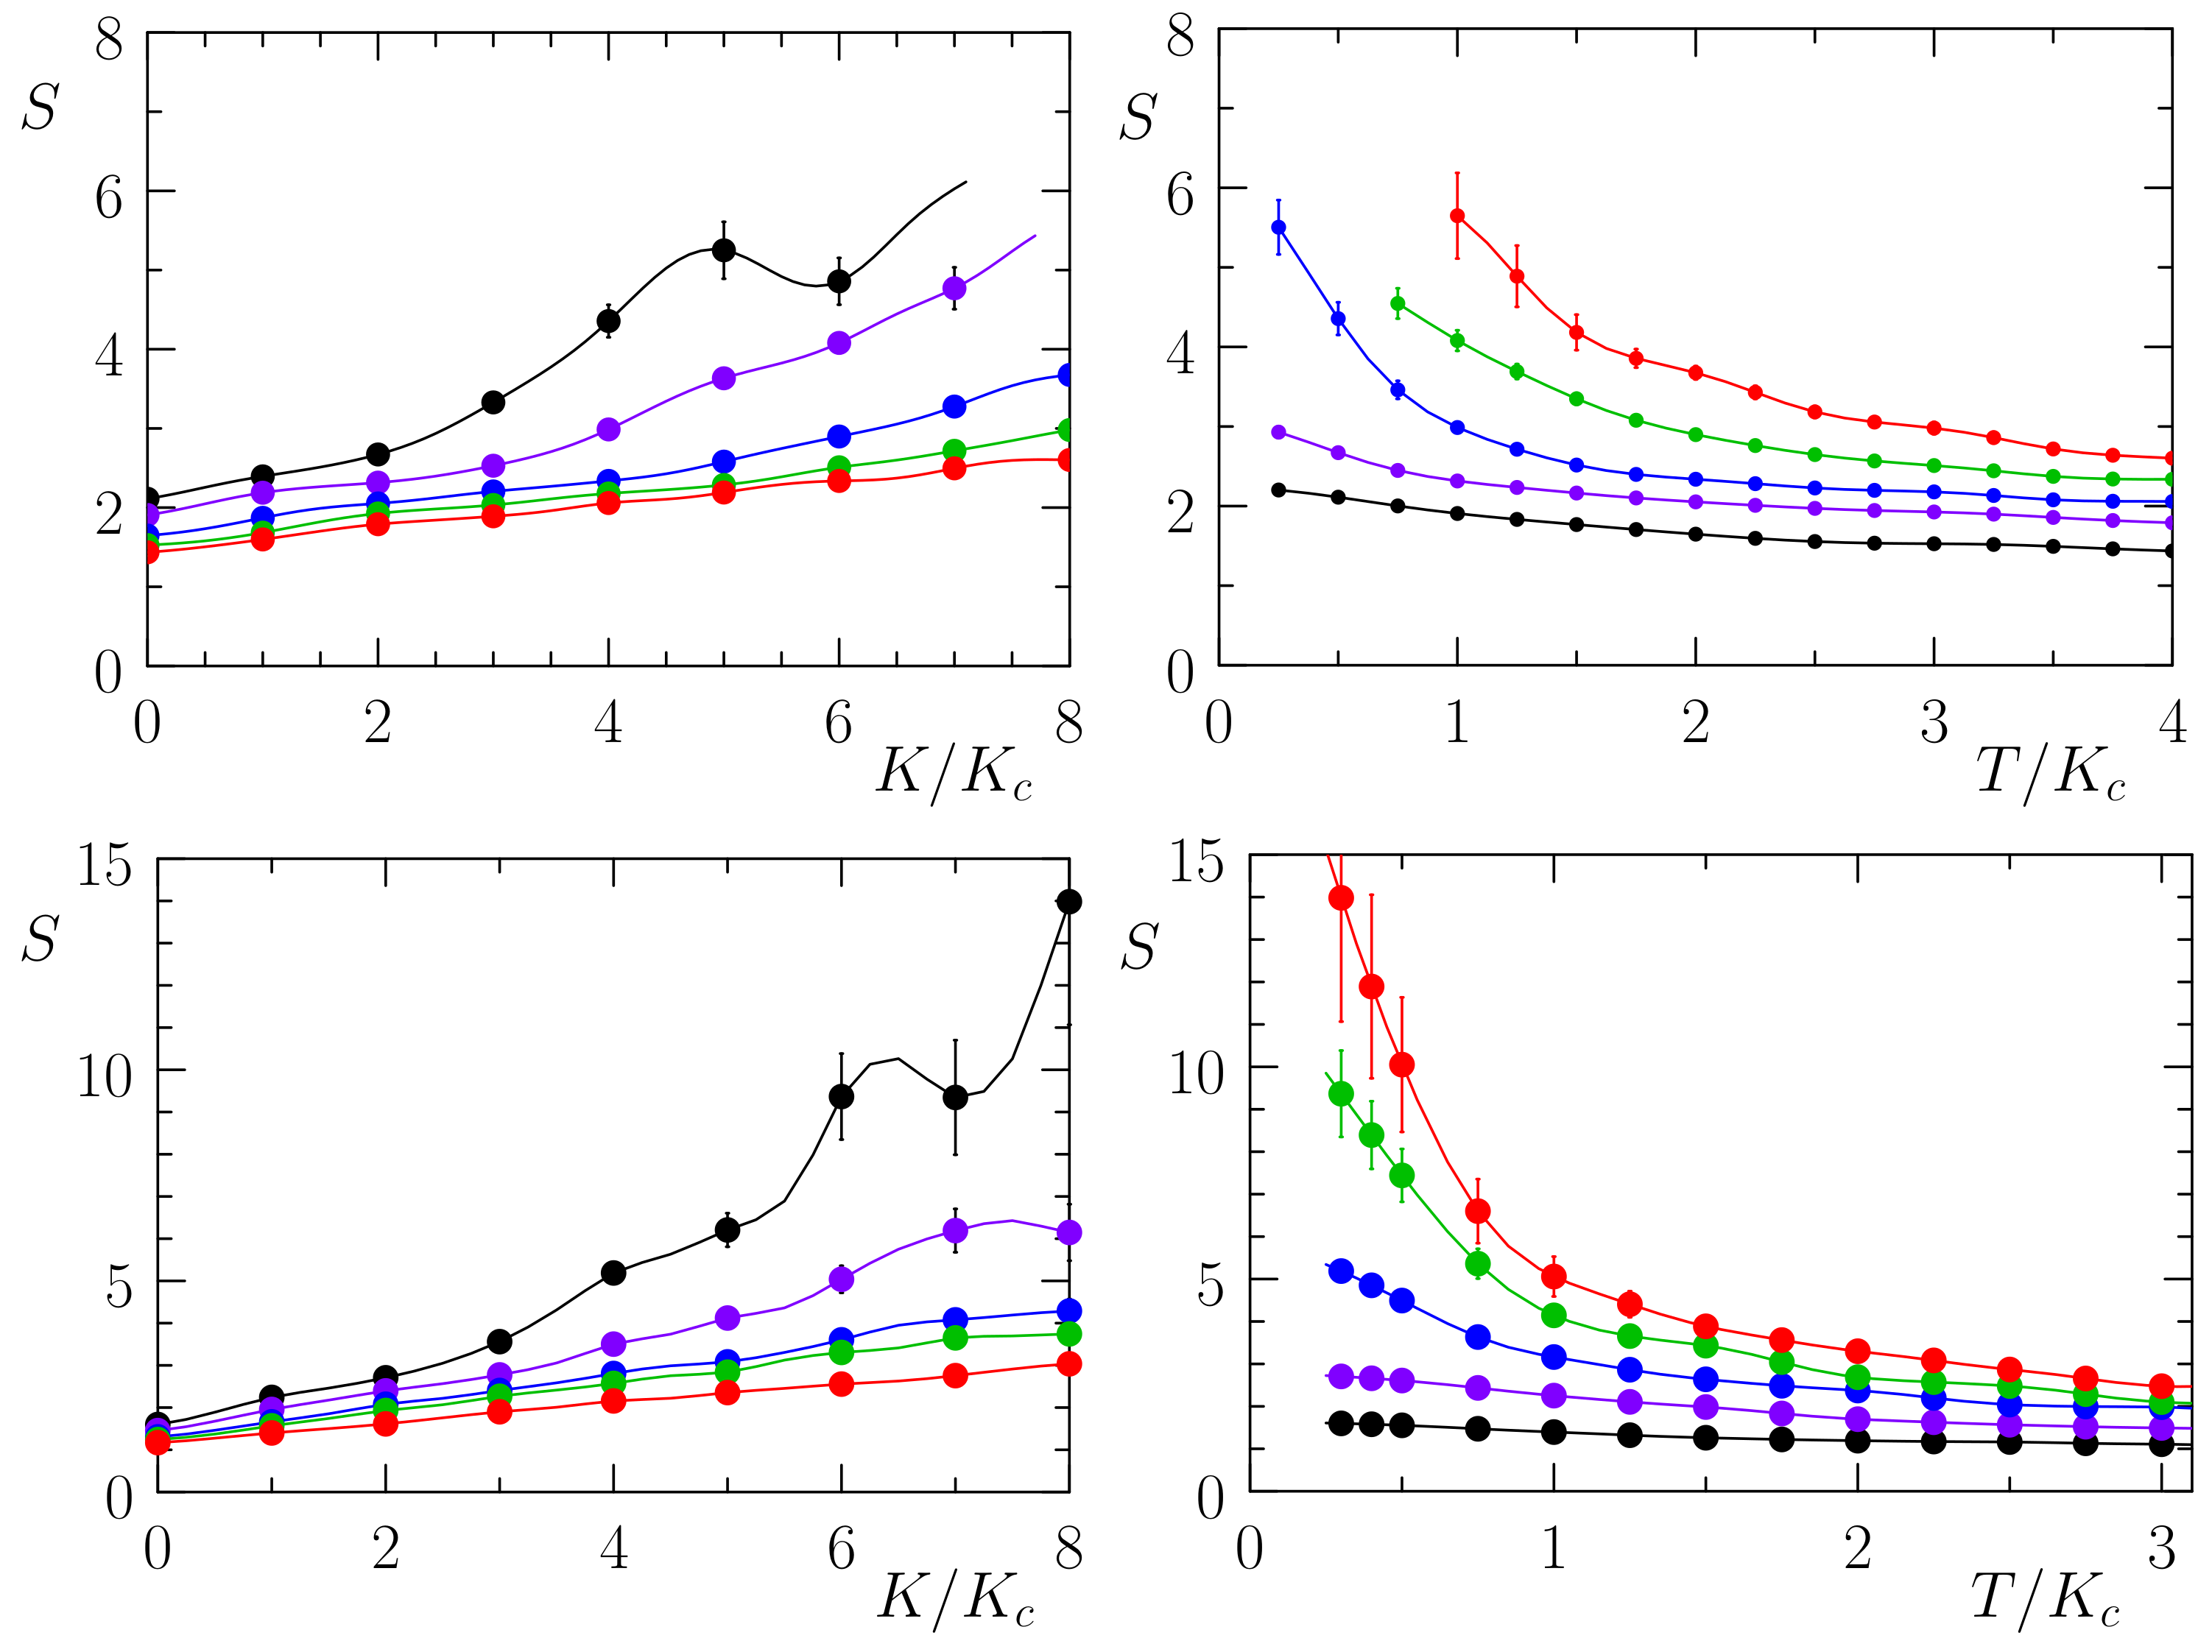
The dependencies of S on potential amplitude and temperature are shown in Figure 4 for two Fibonacci-like values of density ν 1.618 and ν 2.618 . The results clearly show that in the KAM phase K < K c we have only rather moderate values of S 1 being close to those value of noninteracting particles (a similar result was obtained in [9,15]). In the Aubry phase at K > K c , we have an increase of S with the increase of K / K c , and a decrease of S with the increase of T / K c . This is rather natural since at T K c the lattice pinning effect disappears due to the fact that the atom energies become significantly larger than the barrier height, and we approach to the case without potential corresponding to the KAM phase. The maximal obtained values are as high as S 10–15 being still smaller those obtained for ion chains [9,15]. Nevertheless, as shown below, we find very large figure of merit Z T values in this regime.

3.4. Figure of Merit

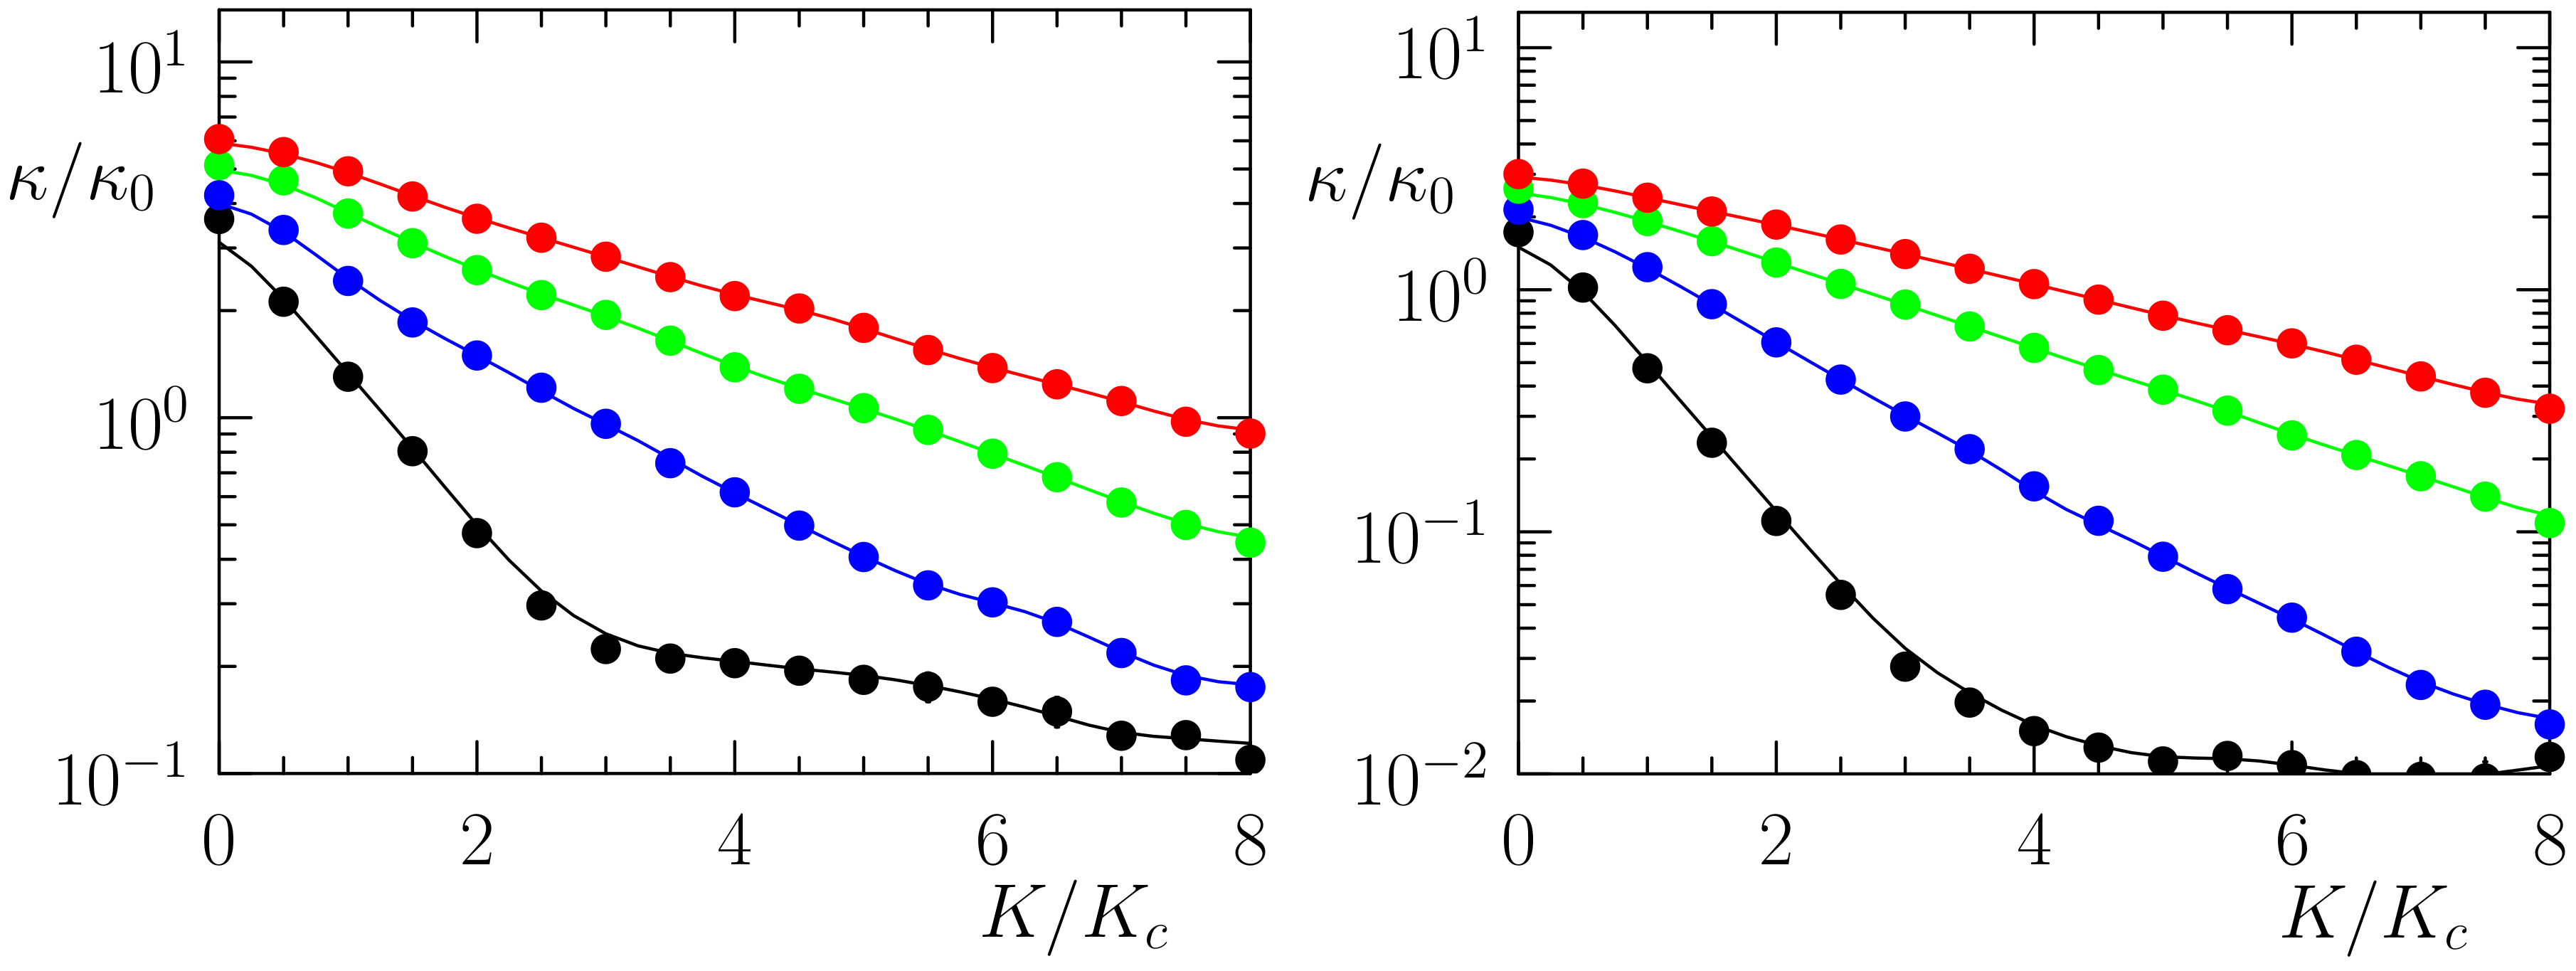
To obtain the value of Z T we need to compute the conductivity of atoms, σ , and their thermal conductivity, κ . The value of σ is defined through the current J of atoms induced by a static force f d c for a chain with periodic boundary conditions: j = ν v a t / 2 π where v a t is the average velocity of atoms and σ = j / f d c ; for K = 0 , we have σ = σ 0 = ν / ( 2 π η ) . The heat flow J is induced by the temperature gradient due to the Fourier law with the thermal conductivity κ = J / ( T / x ) . The heat flow is computed as it is described in [9,15] and in Appendix B. The values of σ and κ drop exponentially with the increase of K inside the Aubry phase at K > K c (see Figure A1 and Figure A2 in Appendix B). The computations performed for various chain lengths at fixed density confirm that the obtained values of S , σ , κ are independent of the chain length for T > K c confirming that the results are obtained in the thermodynamic limit (see Figure A3 in Appendix C). For T K c , the pinning is too strong and much larger computation times are needed for numerical simulations to reduce the fluctuations.
We note that, for cold atoms in an optical lattice, a static force can be created by a modification of the lattice potential or by lattice acceleration. There is now a significant progress with the temperature control of cold ions and atoms (see, for example, [28,29,30]) and we expect that a generation of temperature gradients for measurements of κ and S can be realized experimentally.
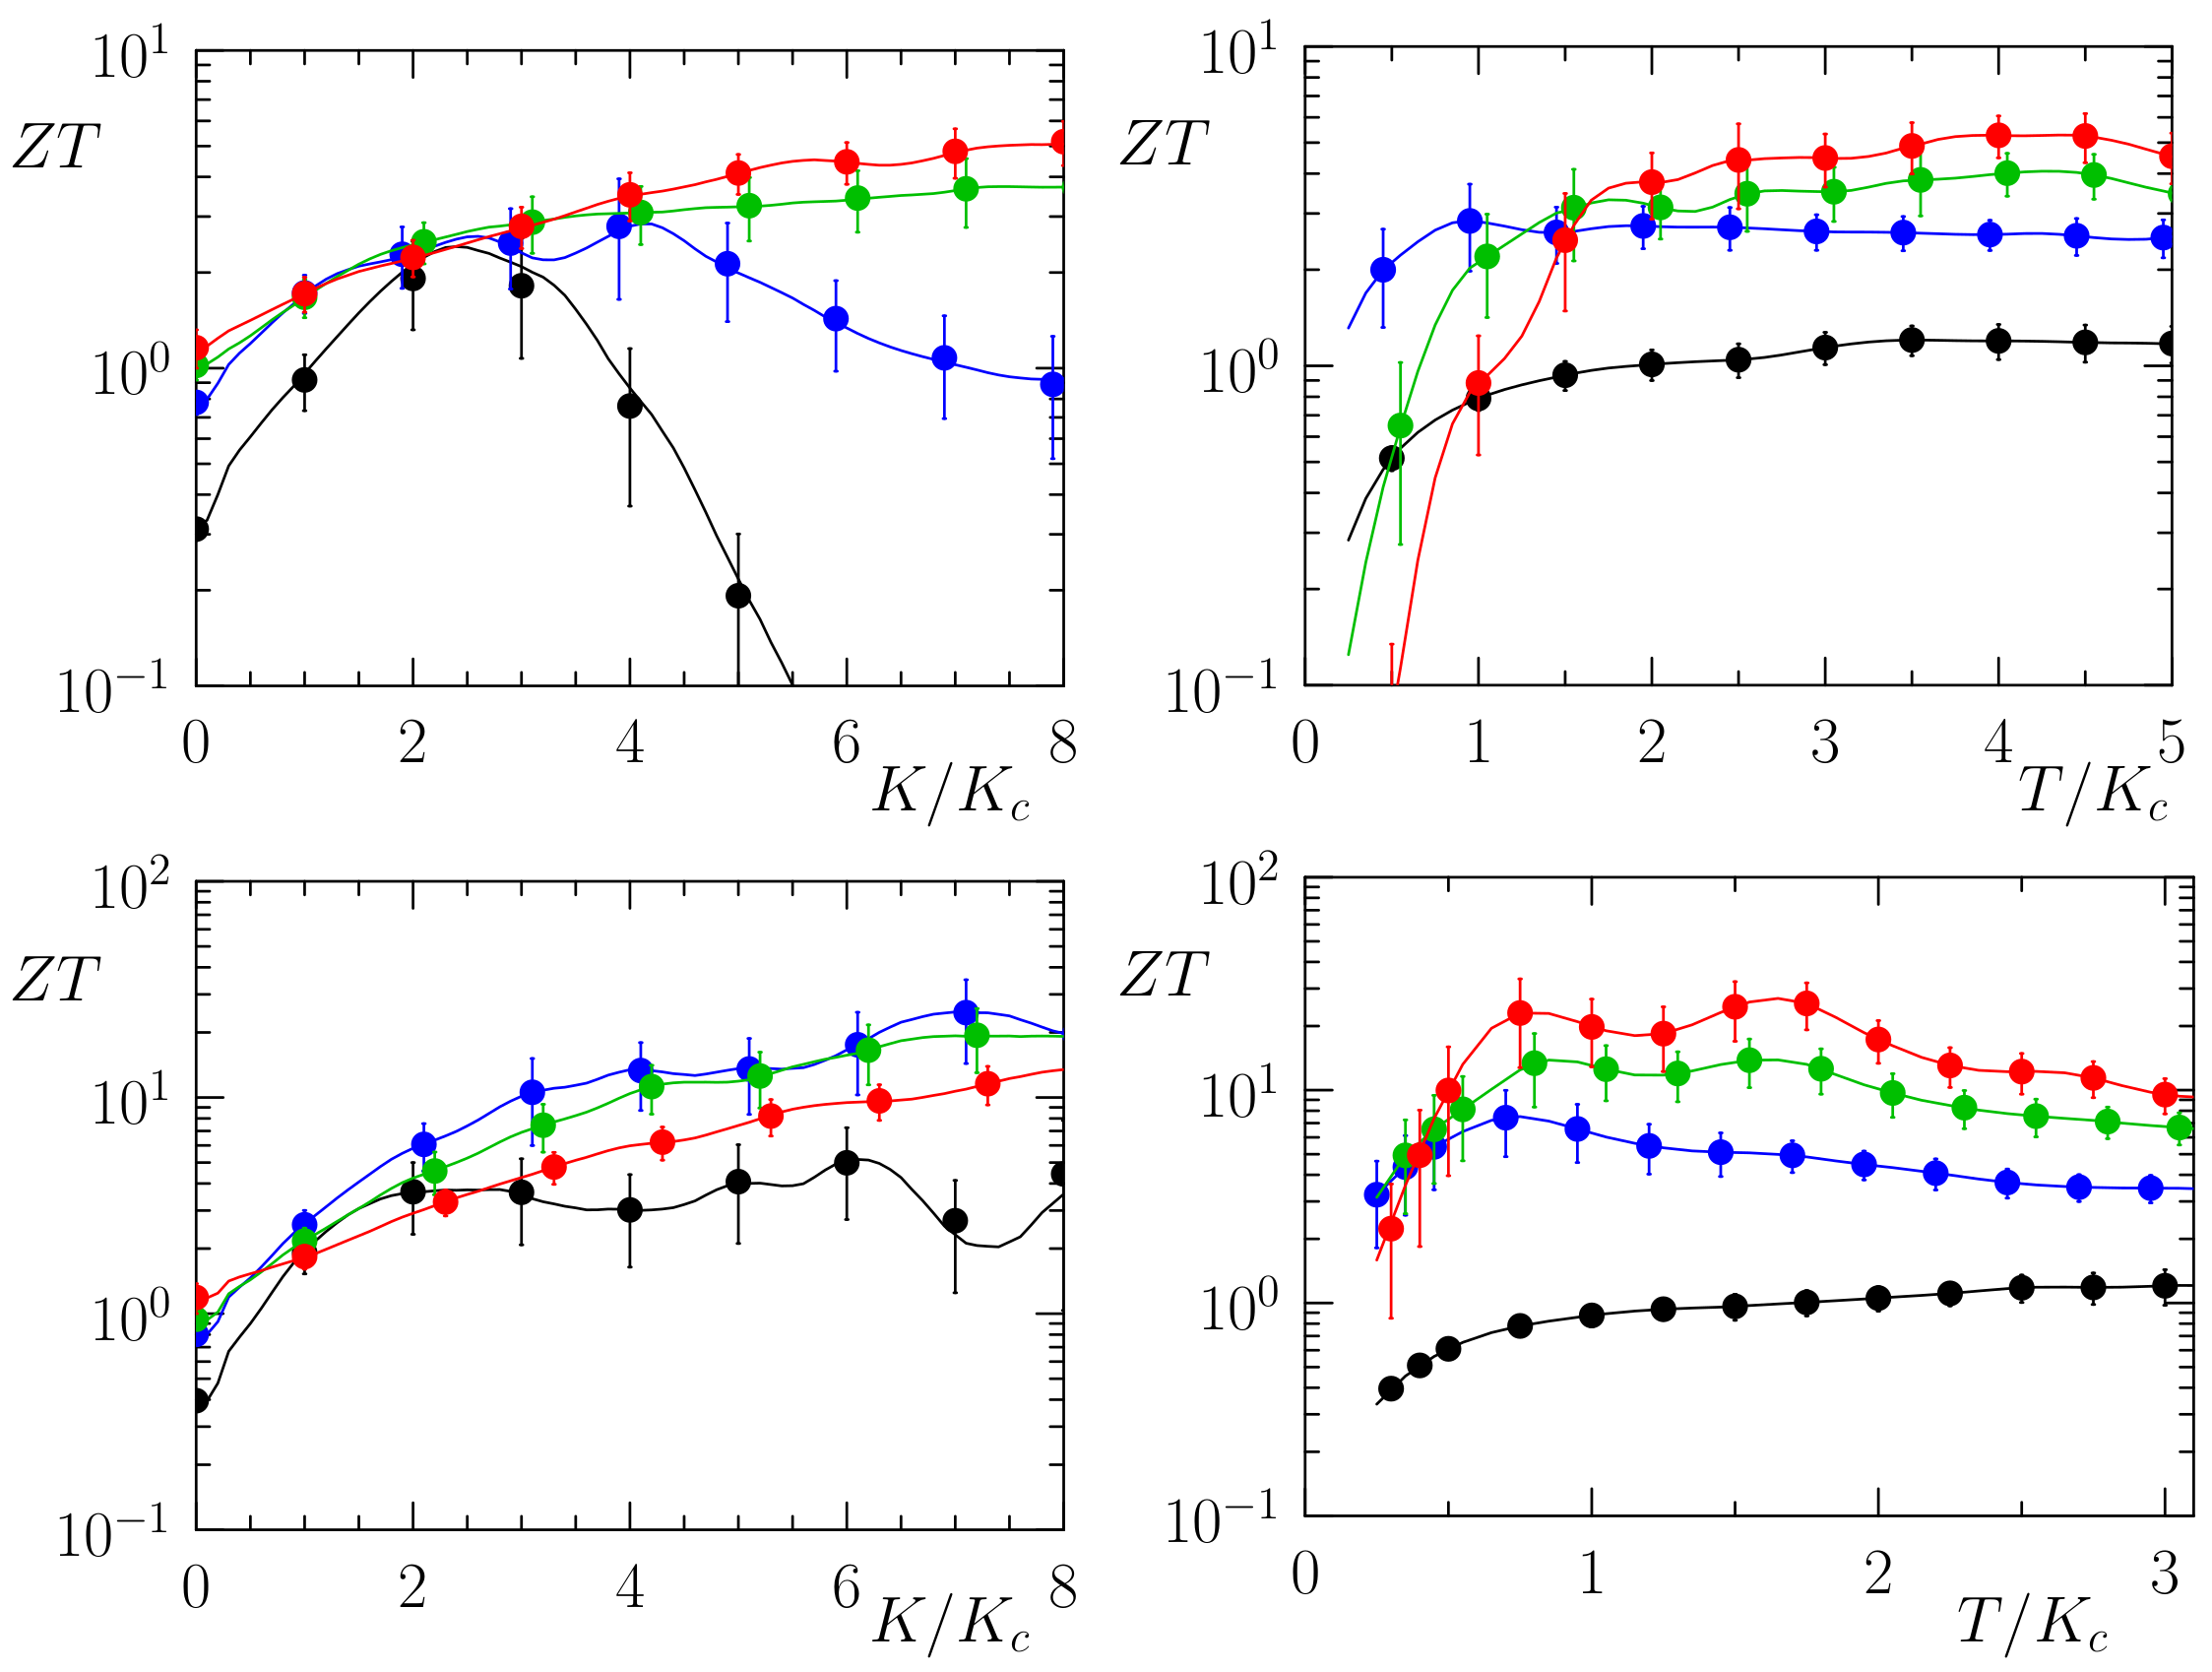
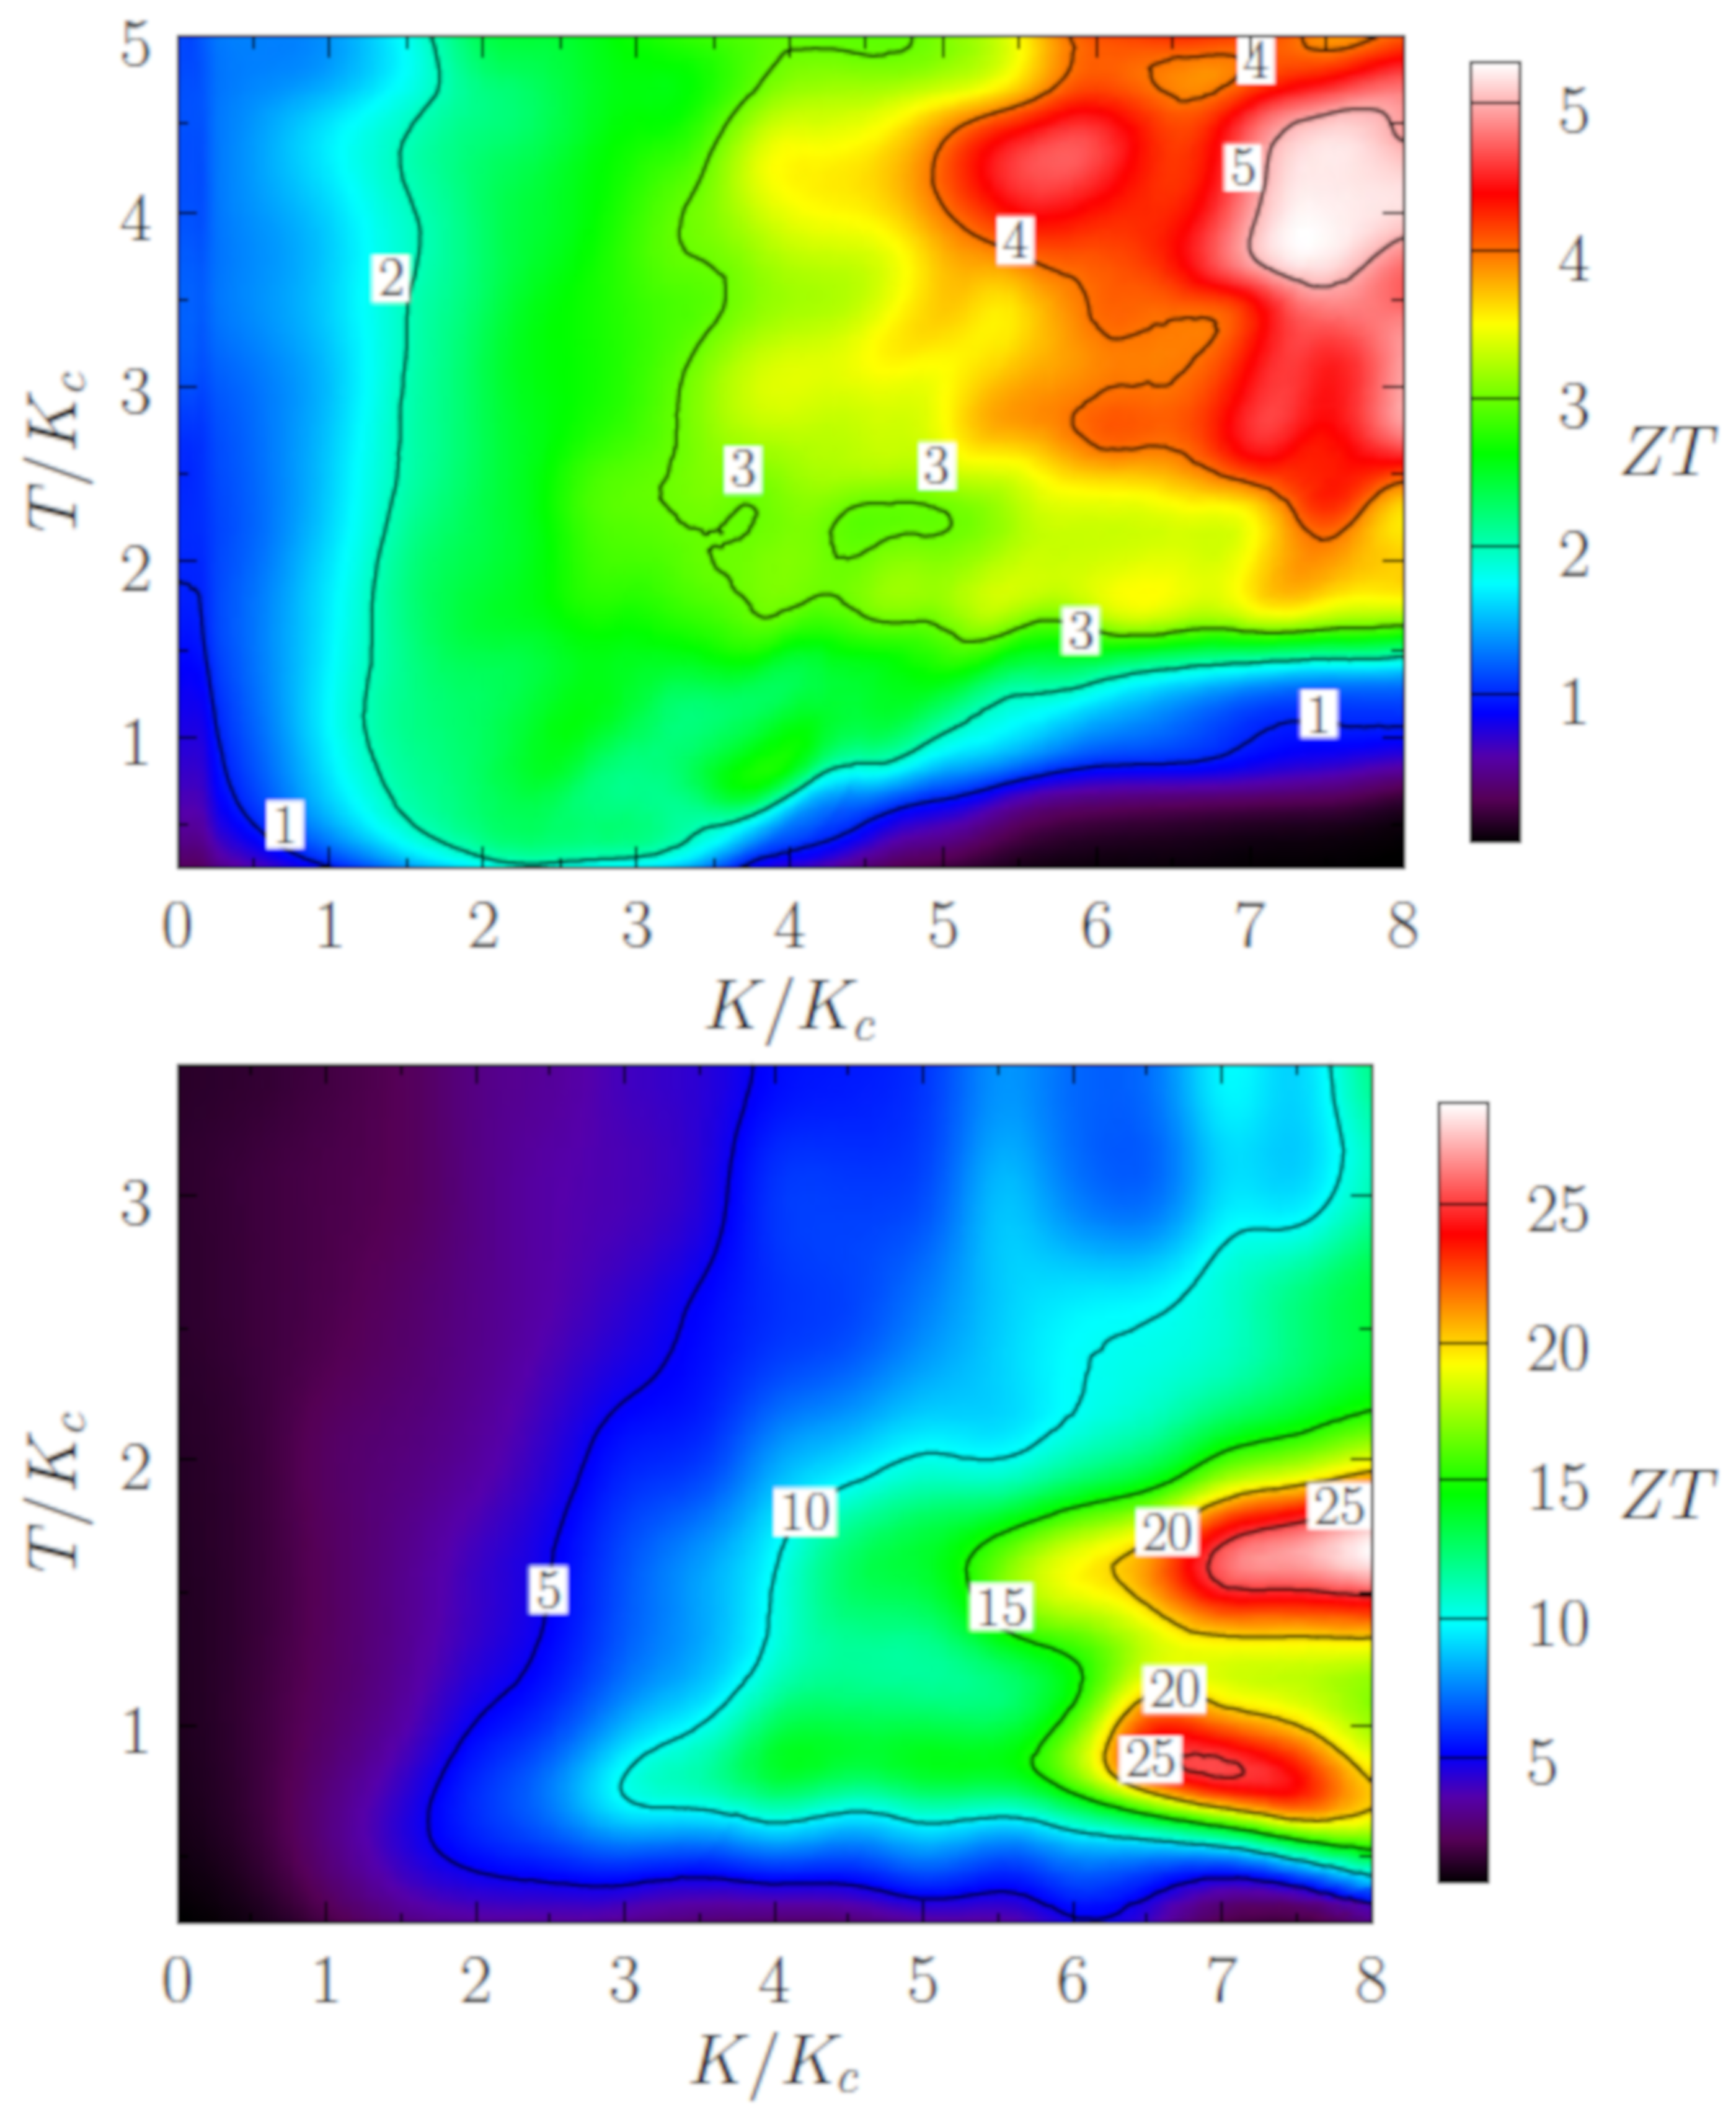
With the computed values of σ , κ , S , we determine the figure of merit Z T . Its dependence on K and T is shown in Figure 5 for ν 1.618 and 2.618 (additional data are given in Figure A4 and Figure A5 in Appendix D and Appendix E). For ν 1.618 , we obtain the maximal values Z T 5 being comparable with those of ion chain reported in [15]. However, for ν 2.618 , we find significantly larger maximal values with Z T 25 . We attribute such large Z T values to the significantly more rapid spatial drop of dipole interactions comparing to the Coulomb case, arguing that this produces a rapid decay of the heat conductivity with the increase of K > K c .

4. Discussion

The obtained results show that a chain of dipole atoms in a periodic potential is characterized by outstanding values of the figure of merit Z T 25 being by a factor 10 larger than the actual Z T values reached till present in material science [22]. Thus, the experiments with cold dipole atoms in the Aubry phase of an optical lattice open new prospects for experimental investigation of fundamental aspects of thermoelectricity.
We note that for a laser wavelength λ = 564 nm , the optical lattice period is = λ / 2 = 282 nm , and thus for ν 2.6 , we have the Aubry transition at the potential amplitude V A / k B = T A = 0.14 ϵ a / k B 200 nK . Such potential amplitude and temperature are well reachable with experimental setups at T 20 nK used in [27]. At the same time at T 200 nK the wave length of Dy atoms becomes λ Dy = ћ / 2 m Dy k B T 90 nm < being only a few times smaller than the lattice period . Thus the quantum effects can start to play a role. However, their investigations require a separate study.
Since such Aubry phase parameters are well accessible for experiments, it may be also interesting to test the quantum gate operations of atomic qubits, formed by two atomic levels, with dipole interaction between qubits. Such a system is similar to ion quantum computer in the Aubry phase discussed in [31]. As argued in [31,32], the optical gap of Aubry phase should protect gate accuracy.

Author Contributions

All the authors contributed equally to this work. All authors have read and agreed to the published version of the manuscript.

Funding

This research was funded in part by the Pogramme Investissements d’Avenir ANR-11-IDEX-0002-02, reference ANR-10-LABX-0037-NEXT (project THETRACOM). This research was also supported in part by the Programme Investissements d’Avenir ANR-15-IDEX-0003, ISITE-BFC (project GNETWORKS), and in part by the Conseil Regional Bourgogne-Franche-Comté 2017-2020 (project APEX).

Acknowledgments

We thank D. Guery-Odelin for useful discussions about dipole gases.

Conflicts of Interest

The authors declare no conflict of interest.

Appendix A. Local Description by the Chirikov Standard Map

The local description of the map (2) by the Chirikov standard map is done in the standard way: the second equation for the phase change of x i + 1 is linearized in the momentum p i + 1 near the resonances defined by the condition x i + m x i = m p r 1 / 4 = 2 π m where m and m are integers. This determines the resonance positions in momentum with p r ( ν ) = ( ν / 2 π ) 4 with ν = m / m . Then the Chirikov standard map is obtained with the variables y i = α r ( p i p r ) + p r 1 / 4 , α r = 1 / ( 4 p r 5 / 4 ) and K eff = K ( 2 π / ν ) 5 / 12 . The critical K eff value is defined by the condition K eff 1 that leads to the Equation (3).

Appendix B. Numerical Computation of Conductivity

The dependence of the rescaled effective conductivity σ / σ 0 is shown in Figure A1.
Figure A1. Dependence of the rescaled conductivity of the atom chain σ / σ 0 on the rescaled potential amplitude K / K c at different rescaled temperatures T / K c . Left panel: T / K c = 0.25 (black curve), 1 (blue curve), 2 (green curve), 3 (red curve), curves from bottom to top, ν = 34 / 21 1.618 , K c 0.019 . Right panel: same values of T / K c with the same order of curves, ν = 55 / 21 2.618 , K c 0.14 . Here σ 0 = ν / ( 2 π η ) .
Applsci 10 02090 g0a1
The heat conductivity is computed from the Fourier law J = κ ( T / x ) . Here J is the heat flow computed as described in [9,15]. Namely, it is computed from forces acting on a given atom i from left and right sides being respectively f i L = j < i 3 / | x i x j | 4 , f i R = j > i 3 / | x i x j | 4 . For an atom moving with a velocity v i , these forces create left and right energy flows J L , R = f i L , R v i t . In a steady state, the mean atom energy is independent of time and J L + J R = 0 . But, the difference of these flows gives the heat flow along the chain: J = ( J R J L ) / 2 = ( f i R f i L ) v i / 2 t . Such computations of the heat flow are done with fixed atom positions at chain ends. In addition, we perform time averaging using accurate numerical integration along atom trajectories that cancels contribution of large oscillations due to quasi-periodic oscillations of atoms. In this way, we determine the thermal conductivity via the relation κ = 2 π J L / Δ T . The obtained results for κ are independent of small Δ T . It is useful to compare κ with its value κ 0 = σ 0 K c . The dependence of κ / κ 0 on K at different T is shown in Figure A2.
Figure A2. Dependence of the rescaled heat conductivity of the atom chain κ / κ 0 on the rescaled potential amplitude K / K c at different rescaled temperatures T / K c . The rescaled parameters are the same as in Figure A1. Here σ 0 = ν / ( 2 π η ) , κ 0 = σ 0 K c .
Applsci 10 02090 g0a2

Appendix C. Independence of Chain Length
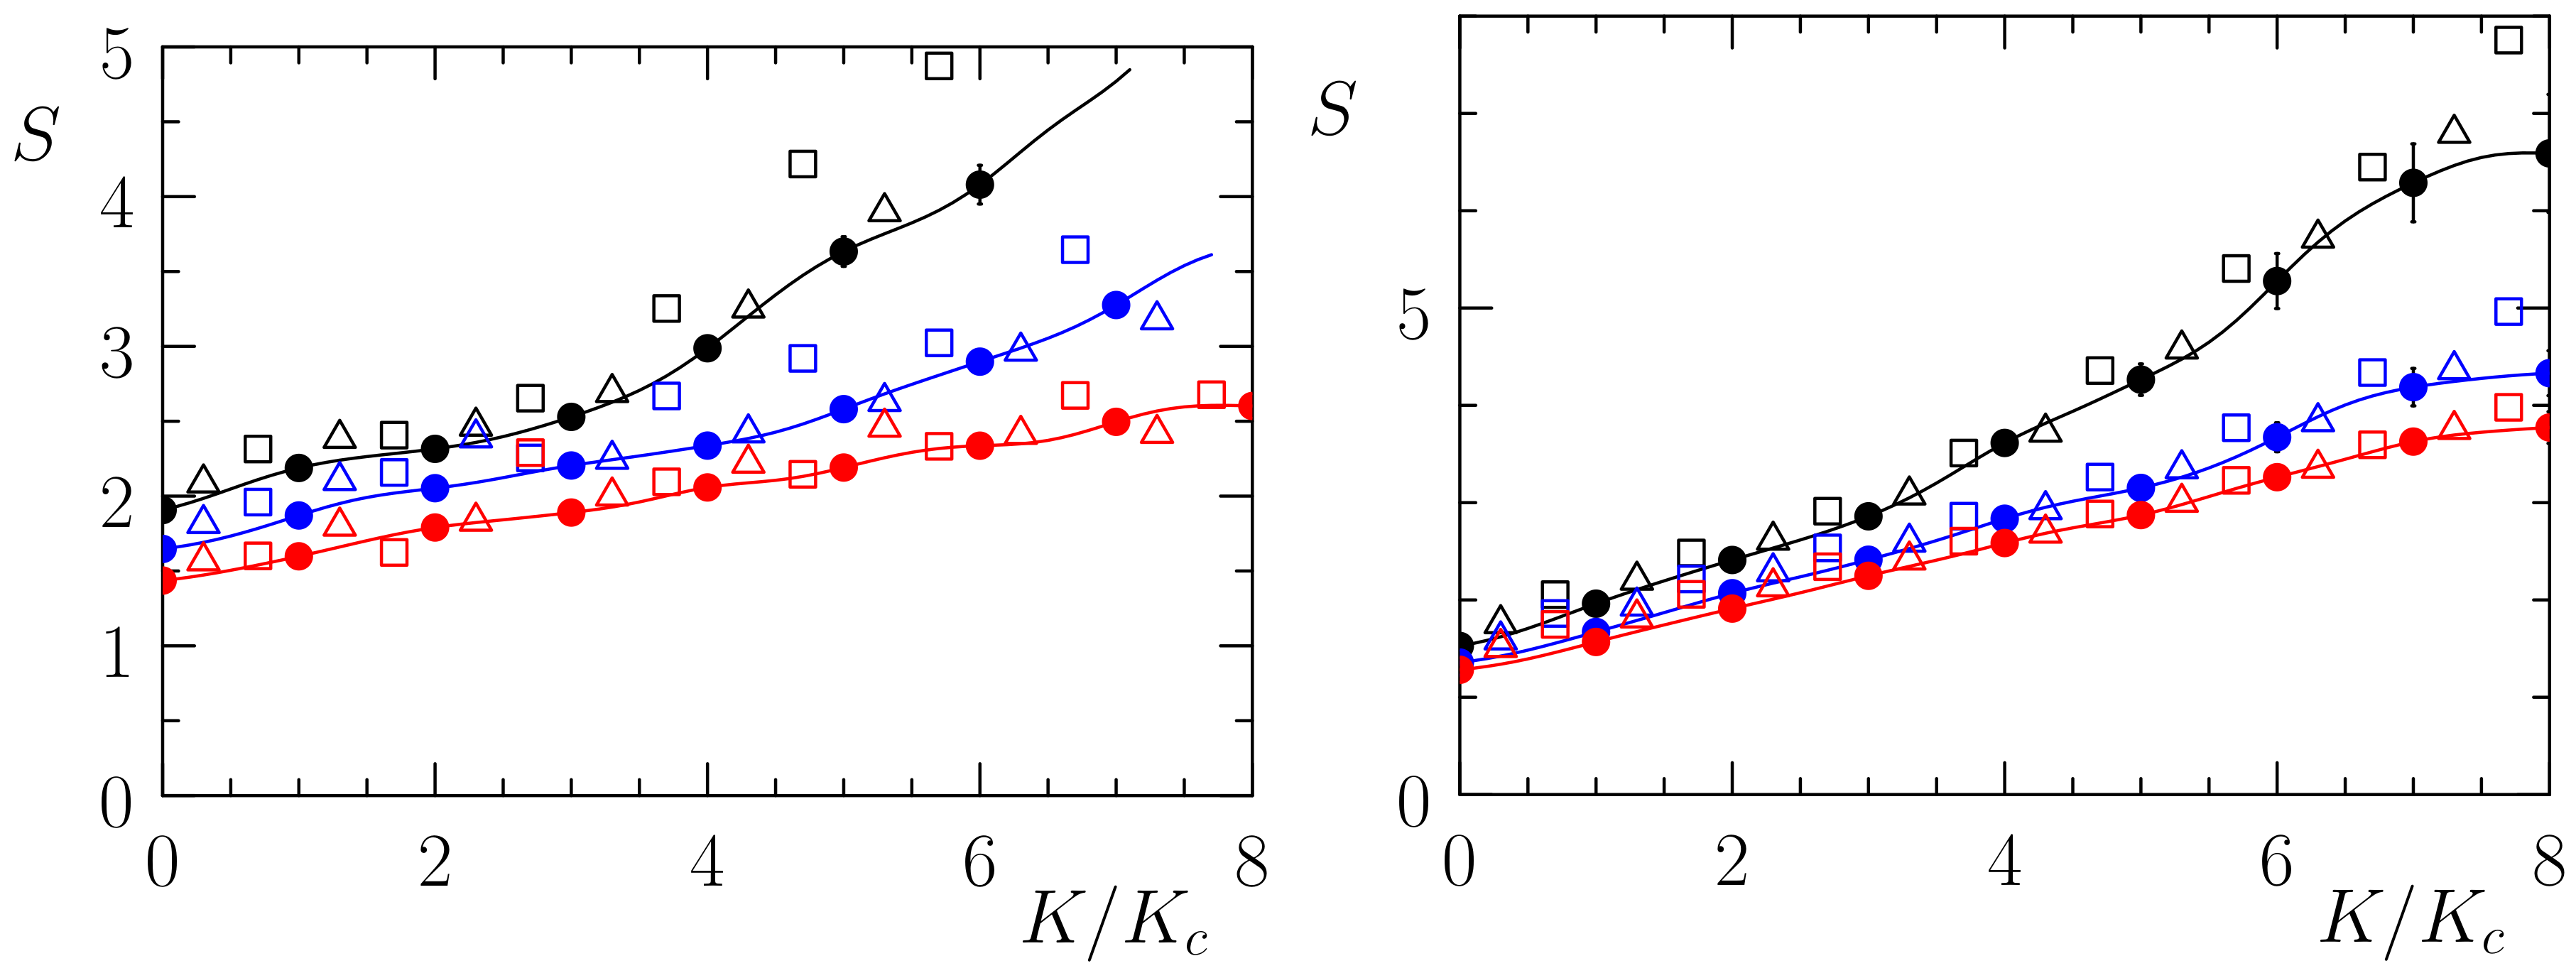
Here in Figure A3, we present results at different chain lengths for fixed atom density showing that the Seebeck coefficient is independent of the system size.
Figure A3. Dependence of the Seebeck coefficient S on the rescaled potential amplitude K / K c at different rescaled temperatures T / K c . Left panel: T / K c = 1 (black curve/symbols), 2 (blue curve/symbols), 4 (red curve/symbols); here ν = N / L = 34 / 21 1.618 (full circles), 55 / 34 (triangles), 89 / 55 (squares) with colors from bottom to top; K c = 0.019 . Right panel: same as in the left panel for T / K c = 0.8 , 1.3 , 1.6 at same color order for ν = N / L = 55 / 21 , 89 / 34 , 144 / 55 2.618 at same symbol order; K c = 0.14 .
Applsci 10 02090 g0a3
We found similar independence of the chain length for σ , κ and power factor P S = S 2 σ / σ 0 .

Appendix D. Additional Data for ZT

Additional data for the figure of merit Z T are given in Figure A4.
Figure A4. Dependence of Z T on the rescaled potential amplitude K / K c (left column) and on the rescaled temperature T / K c (right column) for N / L = 34 / 21 = ν 1.618 (top row) and N / L = 55 / 21 = ν 2.618 (bottom row). Left: color curves show the cases T / K c = 0.5 , 1 , 2 , 3 , 4 for N / L = 34 / 21 and T / K c = 0.3 , 0.8 , 1.3 , 1.6 , 2.3 for N / L = 55 / 21 (black, violet, blue, green, red from top to bottom curves). Right: K / K c = 0 , 2 , 4 , 6 , 8 for N / L = 34 / 21 and N / L = 55 / 21 (black, violet, blue, green, red from bottom to top curves). Here K c = 0.019 for ν = 34 / 21 and K c = 0.14 for ν = 55 / 21 .
Applsci 10 02090 g0a4

Appendix E. Additional Data for Power Factor
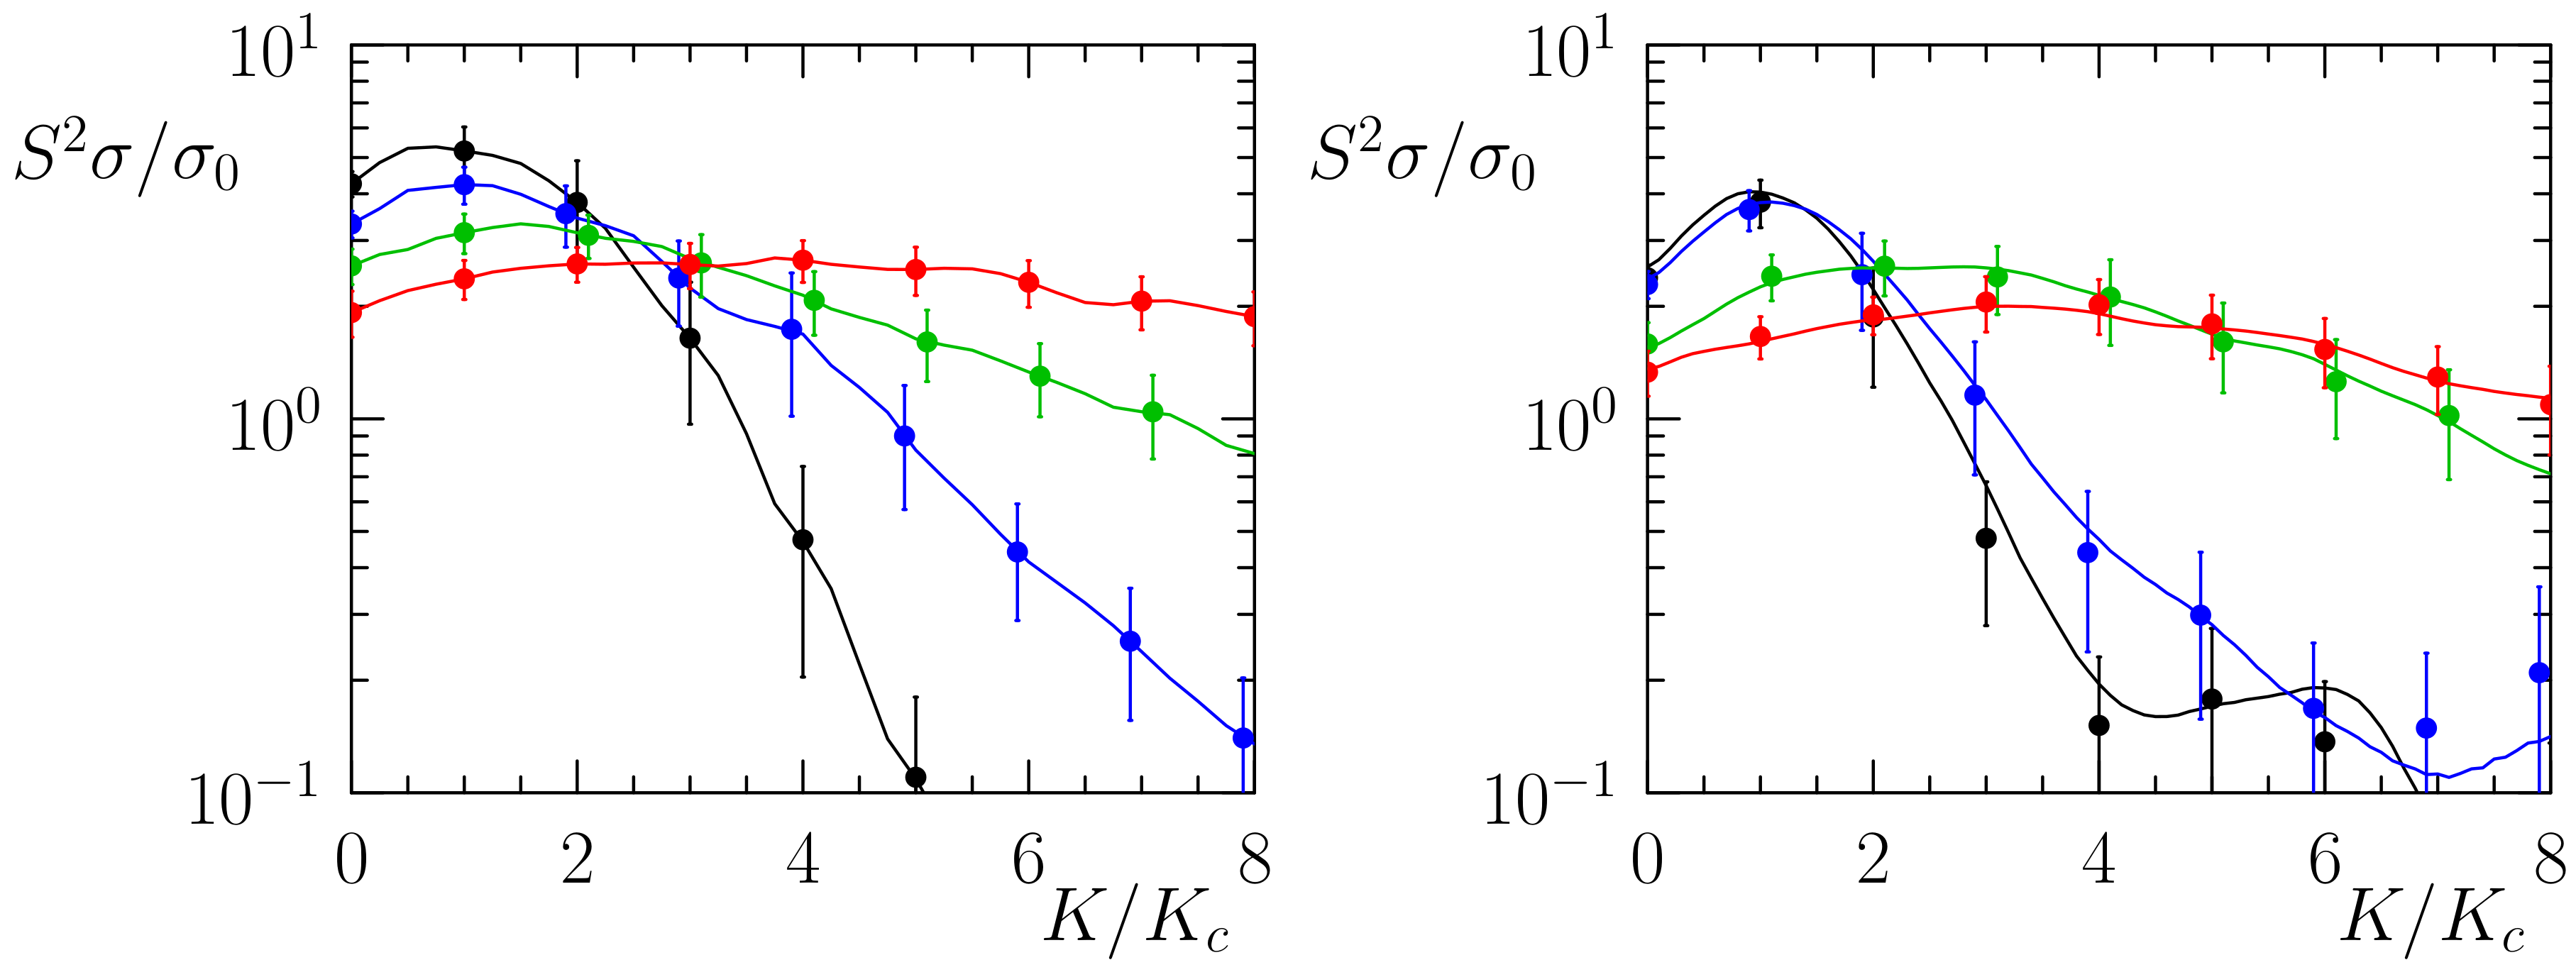
Additional data for the power factor P S = S 2 σ / σ 0 are given in Figure A5.
Figure A5. Dependence of the power factor P S = S 2 σ / σ 0 on system parameters. Left panel: ν = N / L = 34 / 21 , T / K c = 0.25 , 1 , 2 , 4.25 (black, blue, green, red colors), K c = 0.019 . Right panel: ν = N / L = 55 / 21 , T / K c = 0.25 , 0.5 , 1.5 , 2.5 (black, blue, green, red colors), K c = 0.14 .
Applsci 10 02090 g0a5

References

  1. Braun, O.M.; Kivshar, Y. The Frenkel-Kontorova Model: Concepts, Methods, and Applications; Springer: Berlin/Heidelberg, Germany, 2004. [Google Scholar] [CrossRef] [Green Version]
  2. Chirikov, B.V. A universal instability of many-dimensional oscillator systems. Phys. Rep. 1979, 52, 263–379. [Google Scholar] [CrossRef]
  3. Lichtenberg, A.; Lieberman, M. Regular and Chaotic Dynamics; Springer: New York, NY, USA, 1992. [Google Scholar] [CrossRef]
  4. Meiss, J.D. Symplectic maps, variational principles, and transport. Rev. Mod. Phys. 1992, 64, 795–848. [Google Scholar] [CrossRef]
  5. Chirikov, B.; Shepelyansky, D. Chirikov standard map. Scholarpedia 2008, 3, 3550. [Google Scholar] [CrossRef]
  6. Aubry, S. The twist map, the extended Frenkel-Kontorova model and the devil’s staircase. Phys. D Nonlinear Phenom. 1983, 7, 240–258. [Google Scholar] [CrossRef] [Green Version]
  7. Pokrovsky, V.L.; Talapov, A.L. Theory of Incommensurate Crystals; Harwood Academic Publishers: New York, NY, USA, 1984. [Google Scholar]
  8. García-Mata, I.; Zhirov, O.V.; Shepelyansky, D.L. Frenkel-Kontorova model with cold trapped ions. Eur. Phys. J. D 2007, 41, 325–330. [Google Scholar] [CrossRef] [Green Version]
  9. Zhirov, O.V.; Lages, J.; Shepelyansky, D.L. Thermoelectricity of cold ions in optical lattices. Eur. Phys. J. D 2019, 73, 149. [Google Scholar] [CrossRef] [Green Version]
  10. Pruttivarasin, T.; Ramm, M.; Talukdar, I.; Kreuter, A.; Häffner, H. Trapped ions in optical lattices for probing oscillator chain models. New J. Phys. 2011, 13, 075012. [Google Scholar] [CrossRef] [Green Version]
  11. Bylinskii, A.; Gangloff, D.; Vuletić, V. Tuning friction atom-by-atom in an ion-crystal simulator. Science 2015, 348, 1115–1118. [Google Scholar] [CrossRef] [Green Version]
  12. Bylinskii, A.; Gangloff, D.; Counts, I.; Vuletić, V. Observation of Aubry-type transition in finite atom chains via friction. Nat. Mater. 2016, 15, 717–721. [Google Scholar] [CrossRef]
  13. Kiethe, J.; Nigmatullin, R.; Kalincev, D.; Schmirander, T.; Mehlstäubler, T.E. Probing nanofriction and Aubry-type signatures in a finite self-organized system. Nat. Commun. 2017, 8, 15364. [Google Scholar] [CrossRef] [Green Version]
  14. Lauprêtre, T.; Linnet, R.B.; Leroux, I.D.; Landa, H.; Dantan, A.; Drewsen, M. Controlling the potential landscape and normal modes of ion Coulomb crystals by a standing-wave optical potential. Phys. Rev. A 2019, 99, 031401. [Google Scholar] [CrossRef] [Green Version]
  15. Zhirov, O.V.; Shepelyansky, D.L. Thermoelectricity of Wigner crystal in a periodic potential. EPL Europhys. Lett. 2013, 103, 68008. [Google Scholar] [CrossRef]
  16. Ioffe, A.F. Semiconductor Thermoelements, and Thermoelectric Cooling; Infosearch Ltd.: Bangkok, Thailand, 1957. [Google Scholar]
  17. Joffe, A.F.; Stil’bans, L.S. Physical problems of thermoelectricity. Rep. Prog. Phys. 1959, 22, 167–203. [Google Scholar] [CrossRef]
  18. Majumdar, A. Thermoelectricity in Semiconductor Nanostructures. Science 2004, 303, 777–778. [Google Scholar] [CrossRef] [PubMed]
  19. Goldsmid, H.J. Introduction to Thermoelectricity; Springer: Berlin/Heidelberg, Germany, 2010. [Google Scholar] [CrossRef]
  20. Li, N.; Ren, J.; Wang, L.; Zhang, G.; Hänggi, P.; Li, B. Colloquium: Phononics: Manipulating heat flow with electronic analogs and beyond. Rev. Mod. Phys. 2012, 84, 1045–1066. [Google Scholar] [CrossRef] [Green Version]
  21. Levi, B.G. Simple compound manifests record-high thermoelectric performance. Phys. Today 2014, 67, 14–16. [Google Scholar] [CrossRef]
  22. He, J.; Tritt, T.M. Advances in thermoelectric materials research: Looking back and moving forward. Science 2017, 357. [Google Scholar] [CrossRef] [Green Version]
  23. Bruzewicz, C.D.; Chiaverini, J.; McConnell, R.; Sage, J.M. Trapped-ion quantum computing: Progress and challenges. Appl. Phys. Rev. 2019, 6, 021314. [Google Scholar] [CrossRef] [Green Version]
  24. Schneider, C.; Porras, D.; Schaetz, T. Experimental quantum simulations of many-body physics with trapped ions. Rep. Prog. Phys. 2012, 75, 024401. [Google Scholar] [CrossRef]
  25. Lahaye, T.; Menotti, C.; Santos, L.; Lewenstein, M.; Pfau, T. The physics of dipolar bosonic quantum gases. Rep. Prog. Phys. 2009, 72, 126401. [Google Scholar] [CrossRef]
  26. Schmitt, M.; Wenzel, M.; Böttcher, F.; Ferrier-Barbut, I.; Pfau, T. Self-bound droplets of a dilute magnetic quantum liquid. Nature 2016, 539, 259–262. [Google Scholar] [CrossRef] [PubMed] [Green Version]
  27. Böttcher, F.; Schmidt, J.N.; Wenzel, M.; Hertkorn, J.; Guo, M.; Langen, T.; Pfau, T. Transient Supersolid Properties in an Array of Dipolar Quantum Droplets. Phys. Rev. X 2019, 9, 011051. [Google Scholar] [CrossRef] [Green Version]
  28. Ramm, M.; Pruttivarasin, T.; Häffner, H. Energy transport in trapped ion chains. New J. Phys. 2014, 16, 063062. [Google Scholar] [CrossRef]
  29. Freitas, N.; Martinez, E.A.; Paz, J.P. Heat transport through ion crystals. Phys. Scr. 2015, 91, 013007. [Google Scholar] [CrossRef] [Green Version]
  30. Lous, R.S.; Fritsche, I.; Jag, M.; Huang, B.; Grimm, R. Thermometry of a deeply degenerate Fermi gas with a Bose-Einstein condensate. Phys. Rev. A 2017, 95, 053627. [Google Scholar] [CrossRef] [Green Version]
  31. Shepelyansky, D.L. Quantum computer with cold ions in the Aubry pinned phase. Eur. Phys. J. D 2019, 73, 148. [Google Scholar] [CrossRef]
  32. Loye, J.; Lages, J.; Shepelyansky, D.L. Properties of phonon modes of ion trap quantum computer in the Aubry phase. arXiv 2020, arXiv:2002.03730. [Google Scholar]
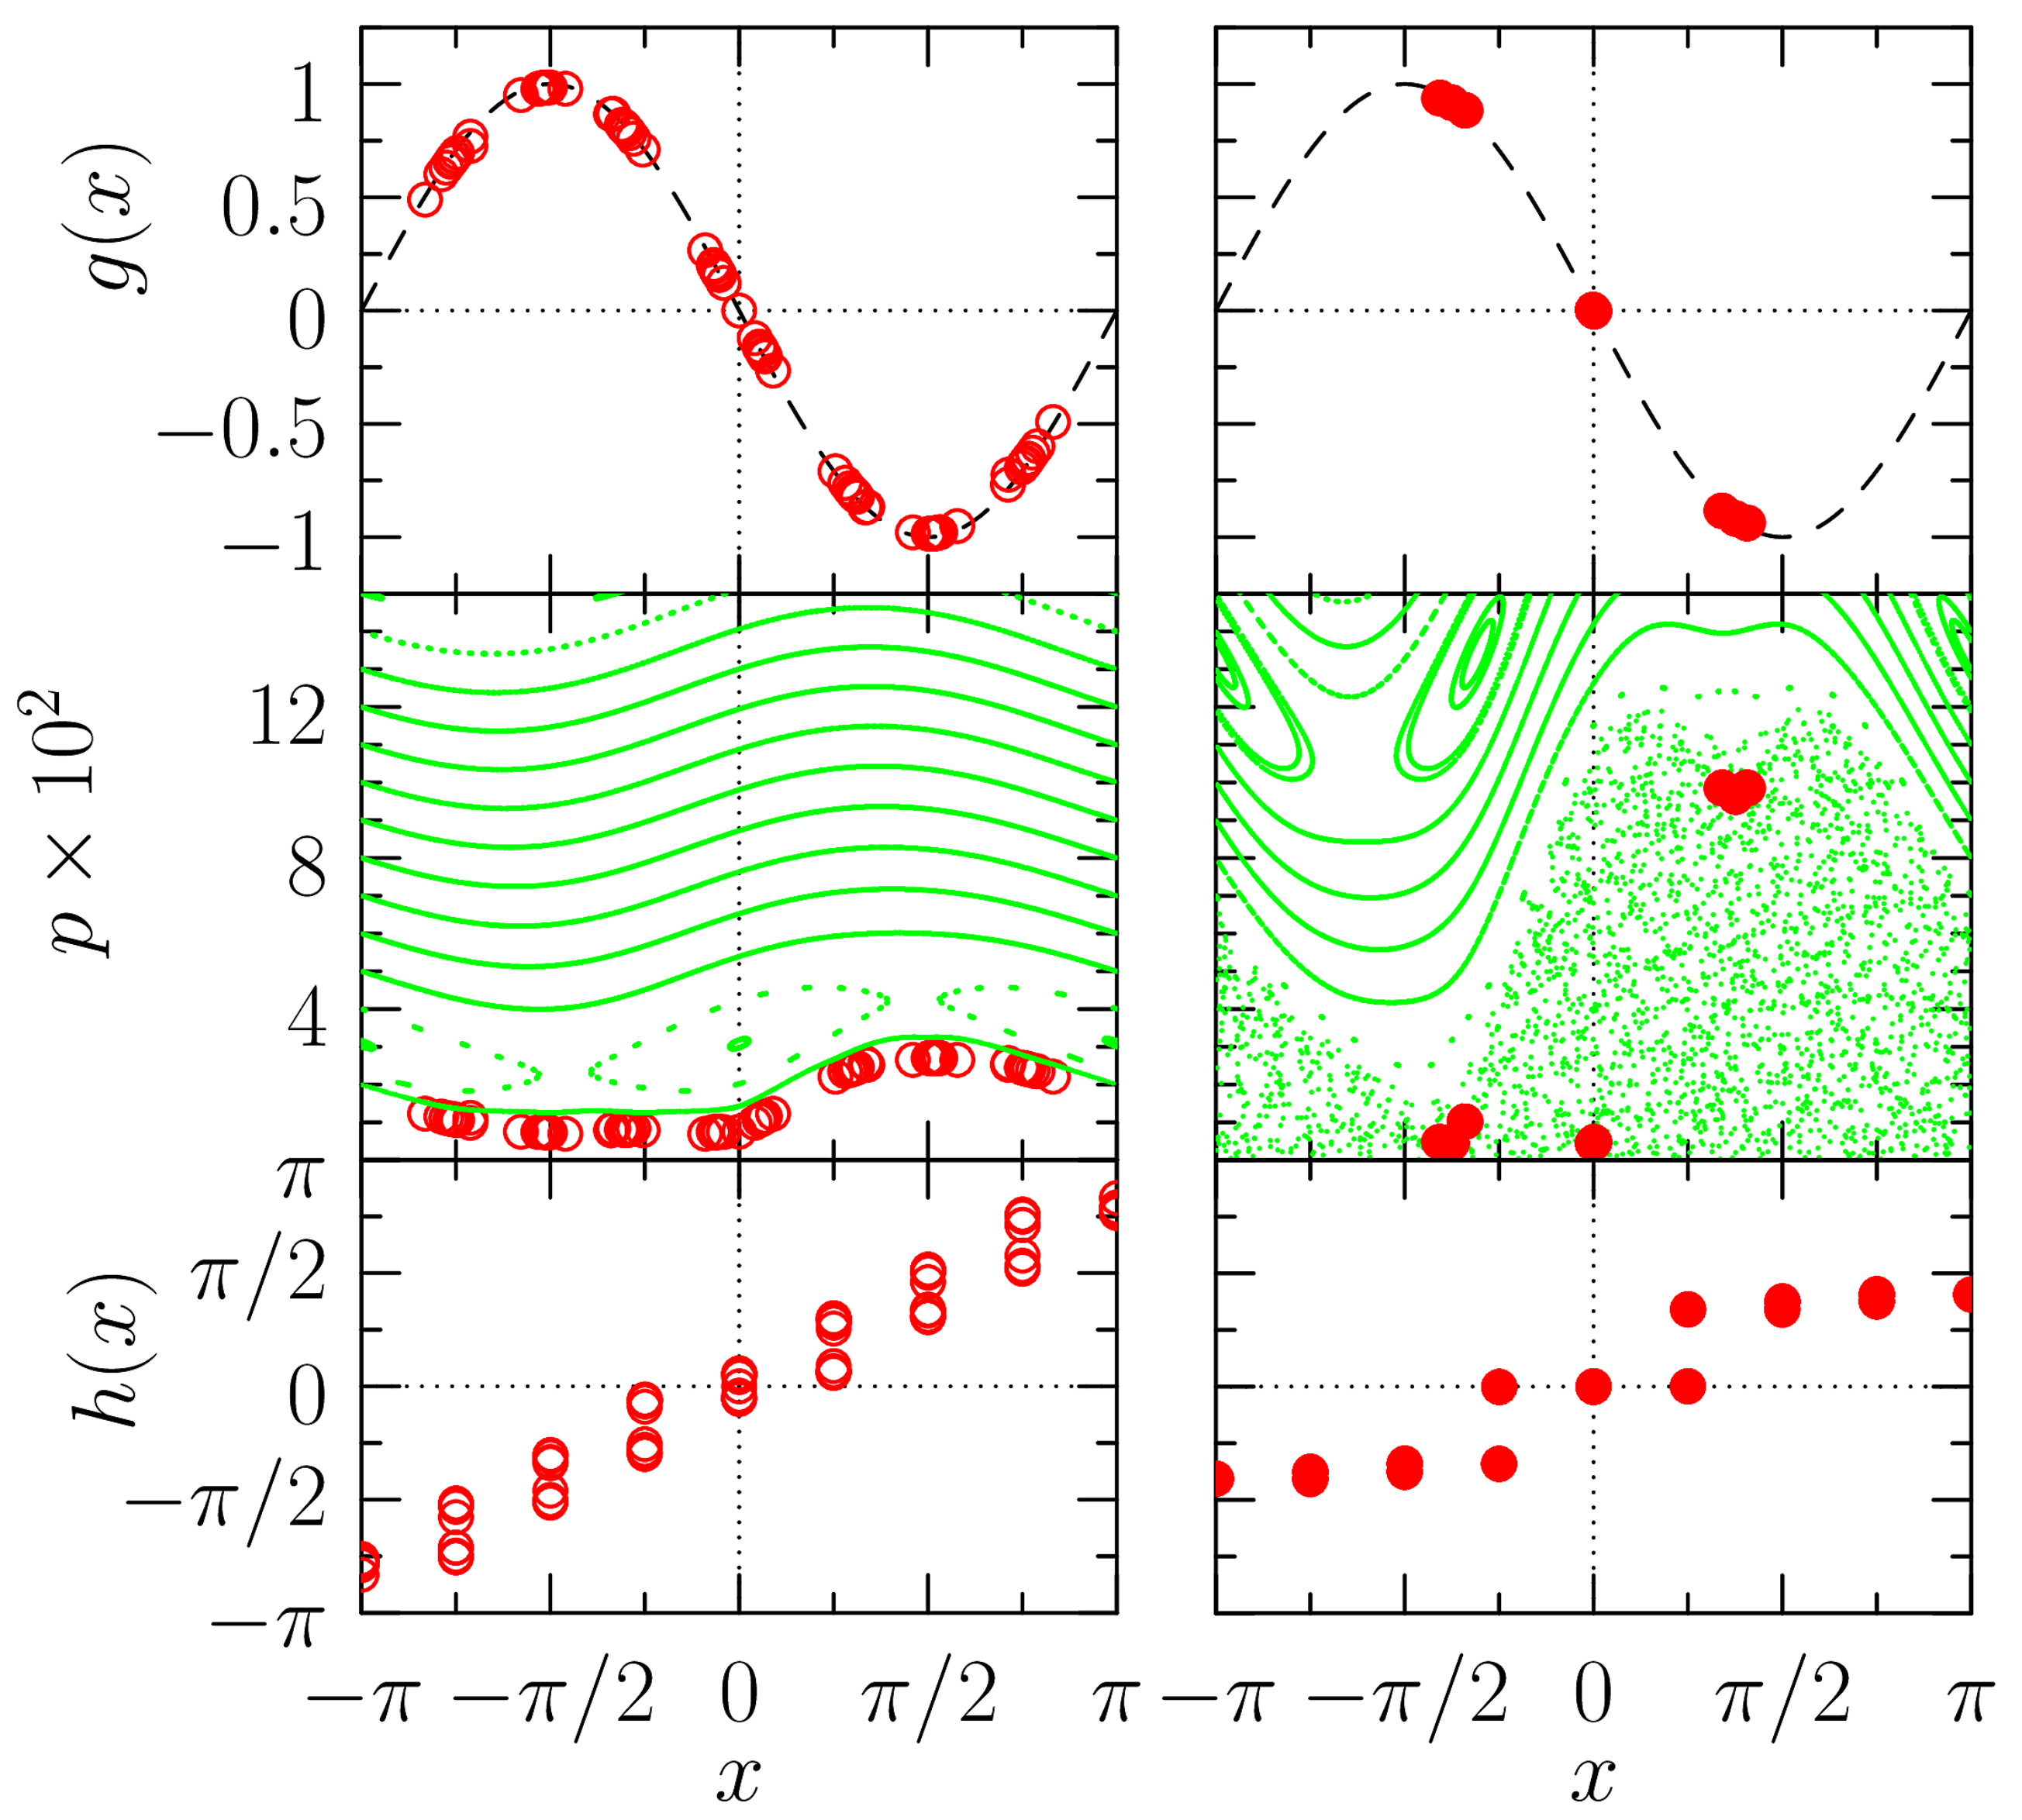
Figure 1. Functions related to the dynamical map obtained from the ground state equilibrium positions x 1 , , x N of the atoms at K = 0.02 (left column) and K = 0.1 (right column). Top row: the red circles show the reconstructed kick function g ( x ) using the the ground state positions x 1 , , x N . The dashed curved gives the theoretical form of the kick function g ( x ) = sin x . Middle row: phase space portrait of the ( x , p ) -map (2) (green points) and the actual ground state positions of the atoms (red circles). Bottom row: the atom positions are shown via the hull function h ( x ) = ( x i + π ) [ mod 2 π ] π versus x = ( 2 π ( i 1 ) / ν + π ) [ mod 2 π ] π ; the positions of the two atoms at the chain ends are fixed. Here we have N = 89 atoms and L = 55 periods, ν = 89 / 55 .
Applsci 10 02090 g001
Figure 2. Left panel: phonon spectrum ω ( k ) for K = 0.02 (open circles) and K = 0.01 (full circles) for ν = N / L = 89 / 55 . Right panel: dependence of the lowest phonon frequency ω 0 on K for the lattice with N dipole atoms in L lattice periods at density ν ν g = 1.618 : N / L = 55 / 34 (blue curve), 89 / 55 (green curve), 144 / 89 (black curve); the arrow marks the point of the Aubry transition at K c = 0.019 defined as it is described in the text.
Applsci 10 02090 g002
Figure 3. Dependence of the Aubry transition critical threshold K c on the atomic density ν shown for different chain lengths L = 34 (blue curve), 55 (green curve) and 89 (black curve). The red full curve shows the theoretical dependence (3), the dashed cyan curve shows the fit with K c = 0.0137 ( ν / ν g ) α , ν g = 1.618 and α = 4.82 ± 0.08 .
Applsci 10 02090 g003
Figure 4. Dependence of the Seebeck coefficient S on the rescaled potential amplitude K / K c (left column) and temperature T / K c (right column) for N / L = 34 / 21 = ν 1.618 (top row) and N / L = 55 / 21 = ν 2.618 (bottom row). Left: color curves show the cases T / K c = 0.5 , 1 , 2 , 3 , 4 for N / L = 34 / 21 and T / K c = 0.3 , 0.8 , 1.3 , 1.6 , 2.3 for N / L = 55 / 21 (black, violet, blue, green, red from top to bottom curves). Right: K / K c = 0 , 2 , 4 , 6 , 8 for N / L = 34 / 21 and N / L = 55 / 21 (black, violet, blue, green, red from bottom to top curves). Here, K c = 0.019 for ν = 34 / 21 and K c = 0.14 for ν = 55 / 21 .
Applsci 10 02090 g004
Figure 5. Color map of the figure of merit Z T values for density ν = N / L = 34 / 21 1.618 (top panel) and ν = N / L = 55 / 21 2.618 (bottom panel); numbers mark isocontour values of Z T . Here, K c = 0.019 for ν = 34 / 21 and K c = 0.14 for ν = 55 / 21 .
Applsci 10 02090 g005