Article

Mining Characteristic Patterns for Comparative Music Corpus Analysis

by
Kerstin Neubarth
1 and
Darrell Conklin
2,3,*
1
Europa-Universität Flensburg, 24943 Flensburg, Germany
2
Department of Computer Science and Artificial Intelligence, University of the Basque Country UPV/EHU, 20018 San Sebastian, Spain
3
IKERBASQUE, Basque Foundation for Science, 48013 Bilbao, Spain
*
Author to whom correspondence should be addressed.
Appl. Sci. 2020, 10(6), 1991; https://doi.org/10.3390/app10061991
Submission received: 30 January 2020 / Revised: 4 March 2020 / Accepted: 9 March 2020 / Published: 14 March 2020
(This article belongs to the Special Issue Sound and Music Computing -- Music and Interaction)

Abstract

:
A core issue of computational pattern mining is the identification of interesting patterns. When mining music corpora organized into classes of songs, patterns may be of interest because they are characteristic, describing prevalent properties of classes, or because they are discriminant, capturing distinctive properties of classes. Existing work in computational music corpus analysis has focused on discovering discriminant patterns. This paper studies characteristic patterns, investigating the behavior of different pattern interestingness measures in balancing coverage and discriminability of classes in top k pattern mining and in individual top ranked patterns. Characteristic pattern mining is applied to the collection of Native American music by Frances Densmore, and the discovered patterns are shown to be supported by Densmore’s own analyses.

1. Introduction

Advances in music data mining and the creation of annotated music corpora [1,2,3] have supported a renewed interest in comparative music analysis [4,5]. Analyses of class-labeled music datasets have explored a range of data mining paradigms, including descriptive methods such as subgroup discovery and emerging pattern mining [6,7,8,9,10,11,12] and predictive methods such as decision tree and classification rule induction [13,14,15,16,17,18]. These studies generally focus on identifying discriminant  properties, which distinguish different classes. Highly discriminant patterns, however, may only describe a few examples in a class. In fact, emerging pattern mining will discover contrasts between classes even if patterns are infrequent [19]; applications to music corpora consequently reveal emerging patterns that sometimes cover only a small proportion of examples in a class [12]. In contrast to discriminant patterns, characteristic patterns capture properties that are prevalent in a class: ideally, a characteristic pattern is complete, i.e., it covers all, or almost all, examples of a class [20]; completeness does not require characteristic patterns to also discriminate between classes. Other methods for characteristic pattern discovery consider characteristic patterns the more interesting the more specific they are to a certain class [21,22]. This paper explores characteristic pattern mining for music corpus analysis and investigates the trade-off between completeness and discriminant power of descriptive patterns.
Two examples shall illustrate characteristic patterns in music. These examples are based on analyses by Frances Densmore (1867–1957), one of the most prolific collectors of Native American music. Through comparative analyses of feature distributions in different tribal repertoires, Densmore sought to identify common and distinctive properties of these repertoires. The two selected patterns are both shared by a majority of songs in a class: among the songs of the Chippewa, 67% end on the keynote; of Teton Sioux songs, 70% contain one or more rhythmic units. However, when compared against songs of other tribes (Ute, Mandan, Hidatsa, Papago, Pawnee, and Menominee), only the first of these patterns shows different distributions in different tribes: “Tribes differ in the location of the keynote; for example, the Chippewa usually build their melodies above the keynote, while the Papago more frequently place the melody partly above and partly below the keynote. The percentage of Chippewa songs ending on the keynote is 67, while the Papago group contains 41 per cent with this ending” [23] (pp. 19–20). The occurrence of rhythmic units, on the other hand, is prevalent not only in Sioux music, but also in the songs of other tribes: “The tribes show little difference in this respect [use of a rhythmic unit], and 72 per cent of the entire group contains one or more rhythmic units” [23] (p. 20). Thus, both patterns are characteristic for their class (describing a majority of songs in the class), but the ending on the keynote is more discriminant (describing proportionately fewer songs in other classes) than the use of rhythmic units (Figure 1). Densmore’s analyses present a remarkable opportunity to compare, qualitatively, the results of computational pattern mining to published musicological findings.
To separate potentially interesting patterns from trivial results, different pattern interestingness measures have been proposed [24]. In this paper, we analyze interestingness measures for characteristic patterns, investigating their ability to balance class coverage and discriminant power of patterns (Section 2). Top k pattern mining is applied to the Densmore collection of Native American music (Section 3); the behavior of top k patterns mined with different interestingness measures is compared, and top ranked example patterns are discussed with reference to observations by Frances Densmore (Section 4).

2. Descriptive Patterns

Descriptive pattern discovery focuses on symbolic data analysis, which extracts comprehensible and potentially interesting patterns intended for interpretation [25].

2.1. Class Association Patterns

Characteristic patterns describe properties that are common to most examples in a class. Hence, to place this work in the context of music pattern mining, we are interested in inter-opus patterns (recurring across multiple music pieces [8]), each of which is associated with a class. Let D be a dataset organized into classes of examples. Further, let X denote a pattern, interpretable as a Boolean predicate on examples: the pattern is true for an example if it describes a property of the example [26]. The set of examples for which a pattern X is true is said to be covered by the pattern. A class association pattern X C covers those examples in class C that are described by pattern X.
For music corpus analysis, different pattern representation languages have been employed, including representation by global features or by sequences of event features [27]. Following Densmore’s quantitative analyses of Native American songs, the current study focuses on global-feature patterns: a global feature is an attribute–value pair a : v describing a song as a whole, e.g., lastNote : keynote or rhythmicUnits : no . A global feature covers a song if the value v of attribute a is true for the song. A global-feature pattern is a set of global features, e.g., { lastNote : keynote , rhythmicUnits : no } . A global-feature pattern covers a song if all global features included in the pattern cover the song.
The association X C between a pattern X and a class C can be summarized in a 2 × 2 contingency table (Figure 2). The table shows the pattern’s presence (X) or absence ( ¬ X ) in a target class C and the background of remaining classes  ¬ C . More specifically, the table cells list the respective support counts: the support count of pattern X, written n ( X ) , is the number of examples in the dataset that are covered by pattern X, while the support count of pattern X in class C, written n ( X C ) , is the number of examples in class C covered by pattern X. Further, n ( C ) gives the number of examples in class C, and N denotes the total number of examples in the dataset. Then, the empirical probability of a pattern X occurring in the dataset  D is defined as P ( X ) = n ( X ) / N , and the conditional probability of pattern X occurring given class C is P ( X | C ) = n ( X C ) / n ( C ) .

2.2. Pattern Interestingness

From the contingency table for a class association pattern X C (Figure 2), measures of pattern interestingness can be computed [24]. Interestingness measures guide the pattern discovery towards patterns that are of potential interest and should be presented. They can be used during pattern mining to prune uninteresting pattern candidates or during post-processing to rank or select patterns.
The issue of identifying interesting association patterns has been extensively studied, and a large number of interestingness measures have been proposed. Tan et al. [28] analyzed 21 interestingness measures for association analysis; the survey of Geng and Hamilton [24] covered 38 measures; while Belohlavek et al. [29] studied 61 measures. In this paper, we consider seven interestingness measures that have been used in characteristic pattern mining; the measures and their definitions are listed in Table 1.
Typicality: The measure of typicality evaluates relative pattern frequency in the target class, i.e., the proportion of examples in class C that are covered by pattern X. The measure was originally proposed to quantify disjunctive patterns which together completely cover a class [30], but is here applied to evaluate individual characteristic patterns.
Utility: The utility measure was proposed in order to rank as more interesting those patterns which are more specifically related to the target class than to other classes [22]. The measure returns a positive value when pattern and class cannot be considered statistically independent, i.e., when  P ( X C ) > P ( X ) × P ( C ) . Utility is weighted by pattern frequency (scaled by a), favoring more general patterns with higher relative frequency  P ( X ) (for a > 0 ).
Novelty: Similarly to utility, novelty (applied to characteristic patterns in [31]) is based on comparing the joint and individual probabilities of a pattern and a class: it returns a positive value when the co-occurrence of pattern and class is more frequent, measured by P ( X C ) , than expected given the individual probabilities  P ( X ) and P ( C ) . Novelty can be rewritten as weighted relative accuracy, P ( X ) × [ P ( C | X ) P ( C ) ] , combining generality of the pattern with added value of the class probability given the pattern [32].
Laplace estimate: The Laplace estimate has been used as an alternative to novelty for assessing characteristic patterns [31]. The measure quantifies the pattern’s frequency in the target class relative to its frequency in the complete dataset. The value of the Laplace estimate is maximal if all examples covered by the pattern are examples of the target class. Due to the constant summands (1 in the numerator and 2 in the denominator), the measure implicitly penalizes less frequent patterns with smaller n ( X ) and n ( X C )  [33].
Relative risk: The measure of relative risk has been employed to select among typical patterns those patterns which are more predictive of the target class [21]. Relative risk assesses the conditional probability of the class C given the pattern X against the class probability in the case of the pattern being absent.
IC + + : The IC + + measure [34] not only considers the pattern’s absence in the target class, but also in the background, with ¬ X observed in the target class rather than background suggesting C to be less plausible. Different from utility and novelty, the IC + + measure, increasing with higher  P ( C ) , is biased towards frequent classes rather than frequent patterns.
F1 score: As a further measure, we borrow the F1 score from predictive data mining, which is designed to balance recall P ( X | C ) and precision P ( C | X ) by calculating their harmonic mean. While recall (corresponding to typicality) measures the relative frequency of the pattern in the target class irrespective of the pattern’s occurrence in other classes, precision quantifies the proportion of pattern occurrences which are observed in the target class rather than other classes.
Hence, while typicality only considers the pattern’s frequency in the target class C independently of its occurrence in the background  ¬ C , the other measures listed in Table 1 select in various ways characteristic patterns that are specific to the target class C, relative to their overall distribution. Among class-specific patterns, the measures of utility, novelty, and Laplace favor more frequent patterns, while the IC + + measure is biased towards larger classes.

2.3. Analysis Criteria

The analysis in this paper focuses on the trade-off between completeness and discriminant power for different pattern interestingness measures. A pattern X is Γ % complete with respect to a class C if it covers Γ % of the examples in C, that is completeness is quantified by the pattern’s sensitivity [34,35]:
Γ = P ( X | C )
Note that the definition of the typicality measure for characteristic patterns (Table 1) corresponds to Equation (1); considering typicality in this study hence provides a benchmark of maximal completeness for the given datasets. A pattern X is Δ % discriminant for class C if it covers ( 100 Δ ) % of the examples that are not members of class C, that is discriminant power of a pattern with respect to a class is given by its specificity [34,35]:
Δ = 1 P ( X | ¬ C ) = P ( ¬ X | ¬ C )
Equations (1) and (2) quantify completeness and discriminant power of individual patterns. Descriptive statistics (such as the mean, median, and maximum) can then be calculated to analyze output sets of patterns.

3. Data

For the current study, two subsets from the Densmore collection of Native American music were selected (Section 3.1), and Densmore’s own music content features were employed to represent songs (Section 3.2).

3.1. Datasets

Case Study 1: Tribes   Predominantly, Densmore’s comparative analysis “seeks to ascertain in what respects the music of one tribe (or linguistic family) resembles and differs from another” [23] (p. 19). The first dataset in the current study is comprised of songs of four tribes, considering all songs for which Densmore provided music content descriptors: Chippewa (326 songs), Teton Sioux (240), Pawnee (86), and Papago (167). These tribes are expected to reveal both resemblances and differences in their music: all four tribes belong to the Plains musical area, historically considered the most typical style of North American Native music; within the larger style area, however, several sub-areas can be identified whose styles differ from each other, including the Eastern Woodlands and Great Lakes (here represented by the Chippewa), the Plains and Northern Prairies (Teton Sioux), and the Southern Prairies (Pawnee). Included as well is the Pima-Papago style, although more marginal to the area than other sub-areas [36]. In addition, the four selected tribes represent different linguistic families: Algonquian (Chippewa), Siouan (Sioux), Caddoan (Pawnee), and Piman (Papago) [23].
Case Study 2: Song types   In Densmore’s study of Chippewa music, “the principal tabulated analysis is made on the basis of the class or use of the song” [37] (p. 1). In addition to the tabular analysis, the publication provides a narrative description of each song class and a synopsis of resemblances between classes. Densmore distinguished 11 classes of songs, including one group of unclassified songs. Of these, we consider in our analysis song types represented by at least 10 songs: Mĭde’ songs (92 songs), war songs (87), dream songs (51), love songs (26), and moccasin game songs (14).
Table 2 summarizes the two datasets in terms of their size (number of songs) and partitioning (number of classes).

3.2. Music Content Features

Underlying Densmore’s quantitative analyses are music content features, i.e., attribute–value pairs, which describe melodic and rhythmic-metric aspects of the music. The selection of attributes and the partitioning of their values varies across Densmore’s published analyses, ranging—for the repertoires considered in this paper—from 237 features (derived from 22 attributes) in the analysis of Chippewa songs [37] to 137 features (derived from 17 attributes) in the analysis of Papago songs [41]. The current study employs a subset of Densmore’s features. First, attributes that in Densmore’s analyses were applied to complete datasets rather than individual songs (e.g., average interval size or distribution between ascending and descending intervals) were ignored. Second, attributes with highly fragmented values and generally low feature counts (e.g., tempo based on metronome readings) were discarded. For the remaining attributes, some infrequent values were aggregated and—for cross-tribe analysis (Case Study 1)—common attributes selected and different partitionings of values mapped onto the same value ranges. Table 3 summarizes the feature vocabulary for the two case studies, the comparison of songs by four Plains tribes (Case Study 1) and the comparison of five song types within Chippewa music (Case Study 2).

4. Results

The two datasets described above were mined for class association patterns, employing the seven interestingness measures introduced in Table 1. In this section, we analyze sets of top k discovered patterns; in particular, we study how the different interestingness measures trade off completeness against discriminant power (Section 4.1). The top ranked pattern for each of the interestingness measures is presented, for the two case studies of comparing Plains tribes and of comparing Chippewa song types, discussing completeness and discriminant power of the individual patterns in the context of Densmore’s quantitative analyses of the repertoires (Section 4.2). To reduce the risk of spurious patterns and to facilitate the interpretation of the mining output, pattern discovery was run with a minimum support threshold of 3% [42] and a maximum pattern size constraint of four features [43].

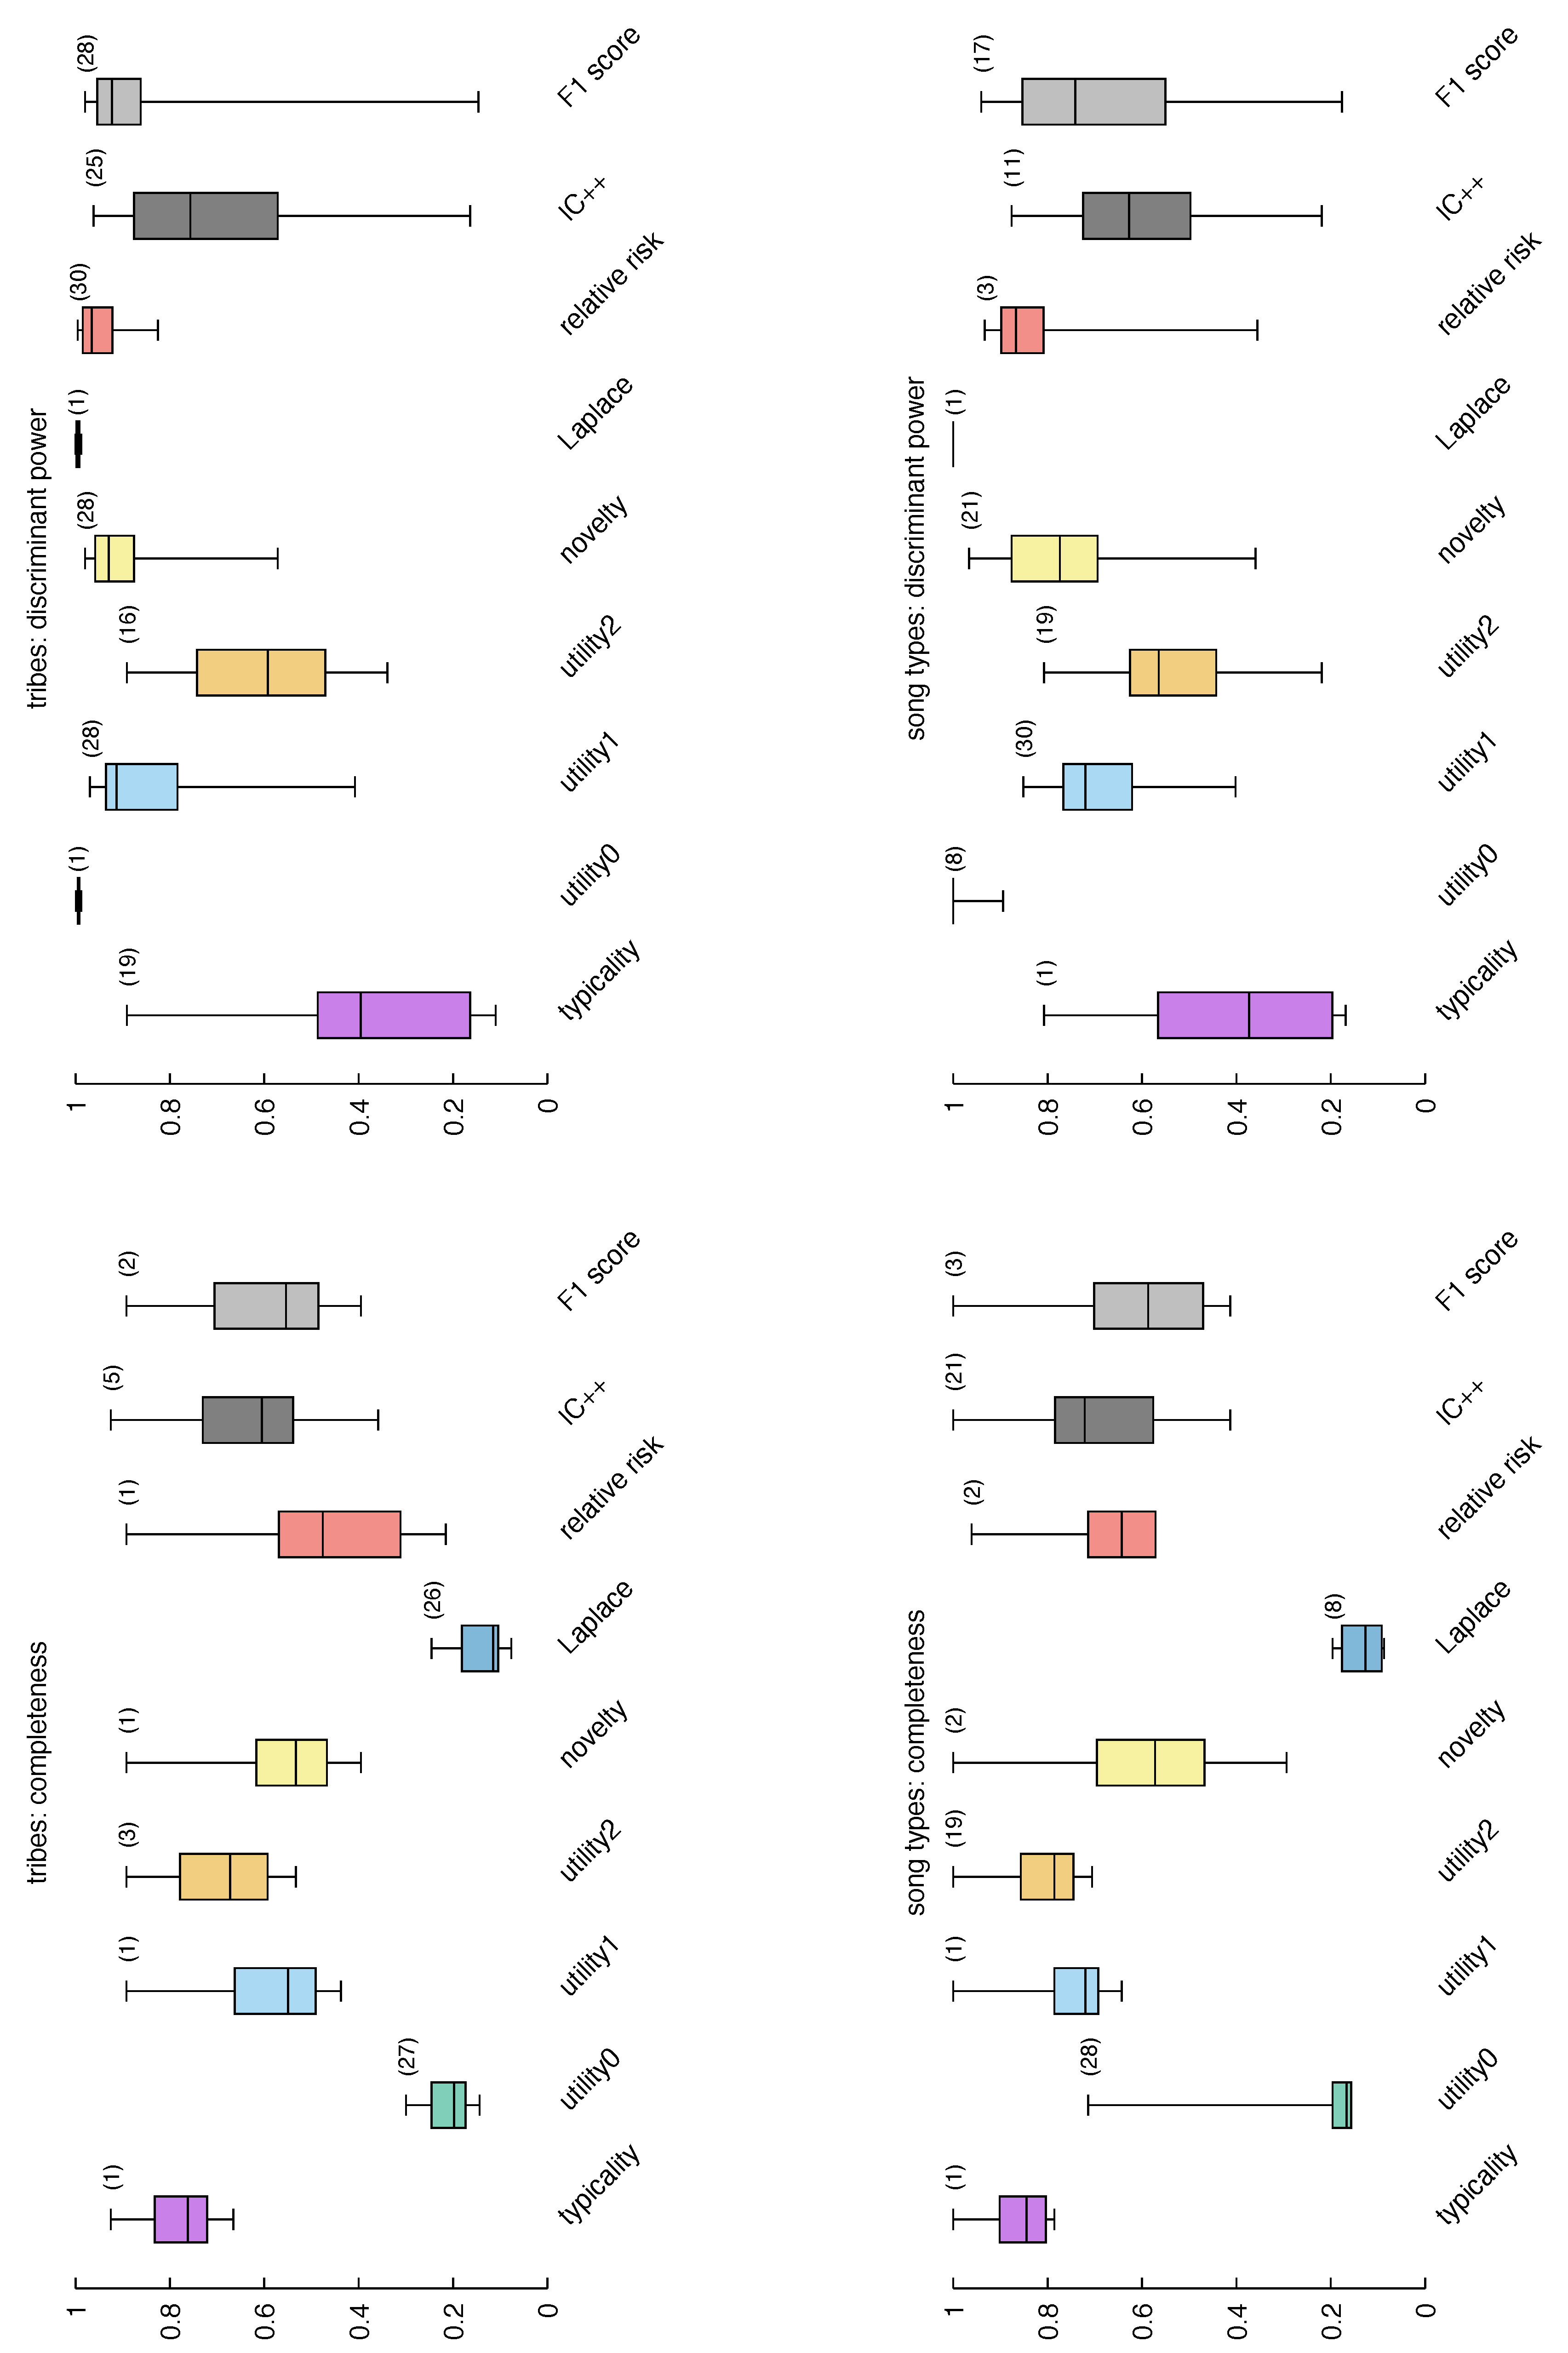
4.1. Distribution of Completeness and Discriminant Power for Different Interestingness Measures

Figure 3 shows graphically the variation in completeness and discriminant power over the top k ( k = 30 ) patterns for each of the studied interestingness measures, in the two case studies of comparing songs by different Plains tribes and of comparing different song types within Chippewa music. The box and whisker plots in Figure 3 show for each measure a box around the first and third quartile, with whiskers from the minimum to maximum completeness or discriminant power. The plots reveal differences between the interestingness measures in balancing completeness and discriminant power. At the same time, overall similar behavior of the measures relative to each other can be observed in both case studies, suggesting that the principal observations can be generalized across datasets.
Unsurprisingly, patterns ranked high by the typicality measure are located high in the completeness space but predominantly low with respect to discriminant power. In the first case study, the comparison of tribes, the maximum completeness (indicated by the highest ranked pattern according to typicality) is also reached by the IC + + measure where it is found on rank five. In the second case study, the comparison of Chippewa song types, additionally utility (with higher a), novelty, and F1 score also include the maximally complete pattern among the top 30 patterns, in the case of utility (with a = 1 ) on rank one. For the utility measure, generally, the bias towards more frequent patterns with higher a favors more complete patterns, while low a leads to more discriminant patterns.
The remaining measures proposed for discovering characteristic patterns seek to increase discriminant power, frequently at the cost of lower completeness. The Laplace estimate generally appears to favor highly discriminant patterns, while relative risk shows a larger variance especially in the first case study, reaching relatively high, but also relatively low completeness values for some among the top ranked patterns. Novelty, like utility biased towards more frequent patterns, achieves higher completeness than Laplace and utility (with a = 0 ) and predominantly higher discriminant power than IC + + and utility (with higher a). These findings are in line with alternative uses of these measures: Laplace has proven successful in associative classification using patterns [44]. The measure is similar to confidence in association rule mining, which was proposed as a measure for discriminant as opposed to characteristic pattern induction in early work on data mining and knowledge discovery [20]. Novelty, also known as Piatetsky-Shapiro (or PS) and leverage in association rule mining, has been used for mining differences between groups in combination with a statistical test metric [45] and (as mentioned above) can be translated into weighted relative accuracy in subgroup discovery, which has been adapted for contrast set mining [46]. When integrated into rule-based classification, novelty has been found to yield more general patterns with higher support but lower predictive accuracy than a rule-based classifier employing the Laplace estimate [47].

4.2. Example Patterns

The following two sections present example patterns discovered in the two case studies on Densmore’s collection of Native American songs. They serve to illustrate the findings of the previous section at the level of individual patterns, to assess the pattern discovery against related observations by Densmore, and to demonstrate characteristic pattern mining for music corpus analysis.

4.2.1. Case Study 1: Tribes

Table 4 lists the class association pattern ranked first by each interestingness measure for comparing songs of the four tribes Chippewa, Teton Sioux, Pawnee, and Papago. Several interestingness measures agree on the same top ranked pattern, lastNoteReCompass : above _ lowest for Papago songs: this pattern is ranked first in computational pattern mining using either utility (with a = 1 , pattern A3), novelty (A5), or relative risk (A7), i.e., measures that according to the findings of Section 4.1 tend to balance completeness and discriminant power to various degrees. In fact, this pattern is both characteristic ( Γ = 0.89 ) and discriminant ( Δ = 0.82 )—for example, in contrast to Sioux songs generally ending on the lowest tone (A8, A4)—and was also highlighted by Densmore: “The difference between the songs in various tribes is clearly shown [in the ending relative to the compass]. In the Pawnee songs 78 per cent end on the lowest tone of the compass, while in the Papago group 90 per cent contain tones lower than the final tone” [40] (p. 15). In combination with additional features (beginning and ending on the fifth above the keynote with melodic tones based on a major pentatonic scale, A2), discriminant power increases to 0.99 , though at the cost of decreasing completeness ( Γ = 0.16 ), discovered with utility ( a = 0 ), which tends to favor discriminant patterns. As for utility ( a = 0 ), the pattern ranked first by the Laplace estimate—another measure biased towards discriminant patterns—is a more specialized pattern comprising four features: major tonality, harmonic structure, beginning on the twelfth above the keynote, and ending on the keynote (A6). Individually, the most discriminant of the features is the beginning on the twelfth ( Γ = 0.29 , Δ = 0.93 ), while the ending on the keynote ( Γ = 0.67 , Δ = 0.47 ) is characteristic but less discriminant for Chippewa songs when compared against Sioux, Papago, and Pawnee music. Indeed, in her analysis of individual features, Densmore commented on the “relatively large proportion” [48] (p. 52) of Chippewa songs beginning on the twelfth, while in Pawnee music, the “highest percentages of initial tones are on the tenth, octave, fifth and keynote” [40] (p. 14) and “[n]o Papago songs begin on a tone higher than the tenth above the keynote” [41] (p. 12). The trade-off between completeness and discriminant power is also clearly illustrated by the first pattern listed for the class of Teton Sioux songs, ranked top by typicality (A1): the characteristic pattern meterChange : yes is prevalent in this group—93% of the Sioux songs contain one or more meter changes—but also found frequently in other tribal repertoires and thus not discriminant for Teton Sioux music ( Δ = 0.16 ); in fact, the pattern occurs among associations discovered with typicality also for the other tribes included in the analysis, on the second rank for Papago (92%), on the eighth rank for Chippewa (83%), and on the 17th rank for Pawnee (74%). This finding corresponds to Densmore’s analyses, who observed “a change of measure lengths, as indicated by accented tones, to be a prevailing characteristic of Indian songs” [49] (p. 183).

4.2.2. Case Study 2: Song Types

Table 5 presents example patterns for Case Study 2, comparing different song types in the Chippewa repertoire. As for Case Study 1 above, the top ranked pattern for each of the studied interestingness measures was selected. The examples confirm the observations already supported by the mining results in the first case study: high completeness at the cost of low discriminant power is achieved by measures such as IC + + (pattern B8) and utility (with a = 2 , B4), while the Laplace estimate yields a top-ranked pattern with high discriminant power but low completeness (B6). In this case, the pattern ranked highest by utility (with a = 0 , B2) shows higher completeness than in Case Study 1, but still has higher discriminant power than completeness. Similar to Case Study 1, highly discriminant patterns tend to be more specialized, comprising multiple features. Of these, the pattern ranked first by relative risk (B7) is the most complete; curiously, exactly this combination of features was also referenced by Densmore in her description of Chippewa moccasin game songs: “Directness is shown in the accented beginnings of the songs and their endings on the tonic, but this is contradicted by the small percentage of songs containing a rhythmic unit” [37] (p. 45). Among the features contributing to the other pattern for moccasin game songs listed in Table 5 (ranked highest by utility with a = 0 , B2), individually, both the ending on the keynote and the absence of accidentals are highly characteristic ( Γ = 0.93 , with Δ = 0.36 and Δ = 0.18 , respectively), and minor tonality is observed in a majority of moccasin game songs ( Γ = 0.79 , Δ = 0 . 62 ), as also pointed out by Densmore: “In the analysis of these songs may be noted a large proportion in minor tonality […]. Eighty-four per cent begin on, and all end on, either the tonic or dominant. […] Only one song contains an accidental” [37] (p. 44). In combination, the features are still shared by 57% of the moccasin game songs, but are also strongly discriminant for this group of songs when compared against Mĭde’, war, dream, and love songs. The top ranked patterns characterizing Mĭde’ songs allow to directly observe the effect of pattern specialization on decreasing completeness and increasing discriminant power: an initial downward progression is found in 91% of Mĭde’ songs (B8), while 70% of the Mĭde’ songs begin with a downward progression and are melodic in structure (B5, B9); the latter pattern is more discriminant of Mĭde’ songs ( Δ = 0.69 ) than the former ( Δ = 0.36 ). The specialized pattern for war songs ranked first by the Laplace estimate (B6) has 100% discriminant power: it is not found at all in the other groups. The general pattern for love songs ranked highest by typicality (B1) and utility (with a = 1 , B3), on the other hand, has 100% completeness: “The love songs were unaccompanied by any instrument” [37] (p. 41); thus, all love songs in the analysis corpus were recorded without the drum. In comparison, songs of other types were usually accompanied by the drum (Mĭde’, war, dream, and moccasin game songs) or rattle (Mĭde’ songs) [37,38].

5. Discussion and Conclusions

A central issue in pattern discovery research is the challenge of separating interesting patterns from trivial results. Patterns that are characteristic of a class, covering most examples in the class, may not be discriminant. On the other hand, highly discriminant patterns may have low coverage, may be sensitive to noise, and may be prone to overfit a few examples in the data [50]. In this paper, we studied, for a range of pattern interestingness measures and on real musicological data, the trade-off between completeness and discriminant power in mining characteristic patterns. The empirical findings confirm the considerations underlying different choices of measure: the typicality measure, used to discover characteristic patterns that cover all or most examples in a class [20,30], achieves high completeness without controlling for discriminant power. The IC + + measure was motivated by the view that those characteristic patterns are most interesting that also discriminate a target class from background classes [34]; consequently, class association patterns ranked high by the IC + + measure are generally more discriminant than patterns ranked high by typicality, while still retaining relatively high completeness. Similarly, novelty has been selected as an interestingness measure to discover patterns that are frequent in the target class but infrequent in the background, thus trading off sensitivity and specificity of the pattern [31]. Other measures, such as relative risk, suggested to prune patterns that are frequent in a class but not predictive of the class [21], tend to more strongly favor discriminant patterns at the cost of decreasing completeness. The results reported in this paper were also found to align with alternative uses of certain measures in contrast pattern mining (e.g., novelty) or pattern-based classification (e.g., Laplace estimate).
Characteristic pattern discovery was applied to the Densmore collection of Native American music. In her publications, Densmore herself included quantitative analyses of collected songs organized into classes such as tribal repertoires or song types, which together with her narrative descriptions provide a valuable reference for assessing the results of the computational analysis. Without explicitly referring to characteristic and discriminant patterns (and thus not providing a ground truth for quantitatively evaluating computational pattern discovery), Densmore’s findings include patterns that are prevalent in a group of songs, and thus can be considered characteristic patterns, and patterns that distinguish one group of songs from others, and hence can be considered discriminant patterns. Revisiting the two Densmore examples introduced at the beginning of the paper, while both patterns—the ending on the keynote in Chippewa songs and the occurrence of one or more rhythmic units in Sioux songs—are similarly prevalent in the respective groups ( Γ = 0.67 and Γ = 0.70 , respectively), the ending on the keynote in the Chippewa songs is more discriminant ( Δ = 0.53 ) than the use of rhythmic units in the Sioux songs ( Δ = 0.28 ). This analysis of completeness and discriminant power of the two example patterns can be related to Densmore’s observation that tribes differed in the location of the keynote (with Chippewa songs exhibiting a comparatively high proportion of songs ending on the keynote), but showed little difference in the use of rhythmic units. When computational pattern discovery is applied to two subsets of Densmore’s collection—comparing songs of four Plains tribes and comparing five song types within Chippewa music—the top-ranked patterns can in many cases be shown to match the corresponding observations in Densmore’s comments on these repertoires. Thus, the interestingness measures for characteristic pattern mining explored in this paper indeed reveal patterns that appear of interest in comparative music corpus analysis.
The pattern evaluation strategies considered in the current study attempt to balance completeness and discriminant power in a single interestingness measure. This can make measure values difficult to interpret. Indeed, an application of subgroup discovery to music, using novelty, additionally presented other measures (including sensitivity, corresponding to typicality) to facilitate the interpretation of results [6]. Rather than a single integrated measure, multiple measures could be evaluated during the pattern mining. For example, employing frequency and significance constraints, Ali et al. [21] applied a χ 2  test of association in addition to a support threshold in order to ensure that the relation between a characteristic pattern and a class was statistically significant. Brijs et al. [35] set thresholds for minimum coverage in the target class (constraining sensitivity or completeness) and maximum coverage in the background (constraining specificity or discriminant power), though at the level of pattern sets rather than individual patterns. The explicit use of multiple measures potentially gives additional control over the trade-off between completeness and discriminant power and may enhance the interpretation of pattern interestingness results, but requires the specification of one or more measure thresholds.
The challenge of selecting interestingness measures has attracted considerable attention in data mining research, and several principles to characterize the behavior of measures under different conditions have been proposed [24,28,29,51]. The choice of a measure will always depend on the specific analysis interest in the task at hand [52]. The case studies in this paper provide examples in comparative music corpus analysis, studying class-labeled music data. As Densmore’s analyses demonstrate, both characteristic patterns, which describe prevalent properties of classes of songs, and discriminant patterns, which capture contrasting properties that distinguish one class from other classes, can be of interest. In the first case, interestingness measures such as typicality, IC + + , or utility (with higher a) will yield patterns with a bias towards completeness; on the other hand, measures such as relative risk, the Laplace estimate, and utility (with a = 0 ) will predominantly prioritize discriminant but potentially infrequent patterns. If both characteristic and discriminant patterns are studied or for an initial exploration of a dataset before specifying further analysis questions, measures such as novelty or F1 score, which balance completeness and discriminant power, may present a suitable compromise. Besides quantitative criteria such as completeness and discriminant power, other principles may be considered, e.g., intelligibility of a measure [52]. Attempts have thus been made to develop multi-criteria decision aids for selecting interestingness measures [52]. Ultimately, the choice of interestingness measure in a specific task is a subjective decision and may even be adapted in iterative data analysis; empirical studies comparing computational measures and human assessment of pattern interestingness have observed considerable differences for different human analysts or datasets [53].
Class-labeled datasets have been, and continue to be, prominent in music data mining. Most existing research has focused on identifying discriminant patterns, which alone do not provide an exhaustive picture of the data. The current study complements previous work by systematically investigating interestingness measures for characteristic patterns and illustrating their implications in a detailed discussion of discovered patterns.

Author Contributions

Conceptualization, K.N. and D.C.; methodology, K.N. and D.C.; software, K.N.; formal analysis and validation, K.N. and D.C.; data curation, K.N.; visualization, D.C.; writing, original draft preparation, K.N.; writing, review and editing, K.N. and D.C. All authors read and agreed to the published version of the manuscript.

Funding

This research received no external funding.

Conflicts of Interest

The authors declare no conflict of interest.

References

  1. Serra, X. Creating research corpora for the computational study of music: The case of the CompMusic project. In Proceedings of the 53rd AES International Conference on Semantic Audio, London, UK, 27–29 January 2014; pp. 1–9. [Google Scholar]
  2. Kroher, N.; Díaz-Báñez, J.M.; Mora, J.; Gómez, E. Corpus COFLA: A research corpus for the computational study of flamenco music. J. Comput. Cult. Herit. 2016, 9, 10. [Google Scholar] [CrossRef]
  3. van Kranenburg, P.; de Bruin, M.; Volk, A. Documenting a song culture: The Dutch Song Database as a resource for musicological research. Int. J. Digit. Libr. 2017, 20, 13–23. [Google Scholar] [CrossRef] [Green Version]
  4. Cook, N. Computational and comparative musicology. In Empirical Musicology: Aims, Methods, Prospects; Clarke, E., Cook, N., Eds.; Oxford University Press: Oxford, UK, 2004; pp. 103–126. [Google Scholar]
  5. Savage, P.E.; Brown, S. Toward a new comparative musicology. Anal. Approach. World Music 2013, 2, 148–197. [Google Scholar]
  6. Taminau, J.; Hillewaere, R.; Meganck, S.; Conklin, D.; Nowé, A.; Manderick, B. Descriptive subgroup mining of folk music. In Proceedings of the 2nd International Workshop on Machine Learning and Music at ECML/PKDD 2009 (MML 2009), Bled, Slovenia, 7–11 September 2009. [Google Scholar]
  7. Taminau, J.; Hillewaere, R.; Meganck, S.; Conklin, D.; Nowé, A.; Manderick, B. Applying subgroup discovery for the analysis of string quartet movements. In Proceedings of the 3rd International Workshop on Music and Machine Learning at ACM Multimedia (MML 2010), Florence, Italy, 29 October 2010; pp. 29–32. [Google Scholar]
  8. Conklin, D. Discovery of distinctive patterns in music. Intell. Data Anal. 2010, 14, 547–554. [Google Scholar] [CrossRef] [Green Version]
  9. Conklin, D.; Anagnostopoulou, C. Comparative pattern analysis of Cretan folk songs. J. New Music Res. 2011, 40, 119–125. [Google Scholar] [CrossRef]
  10. Anagnostopoulou, C.; Giraud, M.; Poulakis, N. Melodic contour representations in the analysis of children’s songs. In Proceedings of the 3rd International Workshop on Folk Music Analysis (FMA 2013), Amsterdam, The Netherlands, 6–7 June 2013; pp. 40–42. [Google Scholar]
  11. Shanahan, D.; Neubarth, K.; Conklin, D. Mining musical traits of social functions in Native American music. In Proceedings of the 17th International Society for Music Information Retrieval Conference (ISMIR 2016), New York, NY, USA, 7–11 August 2016; pp. 681–687. [Google Scholar]
  12. Neubarth, K.; Shanahan, D.; Conklin, D. Supervised descriptive pattern discovery in Native American music. J. New Music Res. 2018, 47, 1–16. [Google Scholar] [CrossRef]
  13. Backer, E.; van Kranenburg, P. On musical stylometry—A pattern recognition approach. Pattern Recognit. Lett. 2005, 26, 299–309. [Google Scholar] [CrossRef]
  14. Cuthbert, M.S.; Ariza, C.; Friedland, L. Feature extraction and machine learning on symbolic music using the music21 toolkit. In Proceedings of the 12th International Society for Music Information Retrieval Conference (ISMIR 2011), Miami, FL, USA, 24–28 October 2011; pp. 387–392. [Google Scholar]
  15. Herremans, D.; Martens, D.; Sörensen, K. Dance hit song prediction. J. New Music Res. 2014, 43, 291–302. [Google Scholar] [CrossRef]
  16. Martins, M.L.; Silla, C.N., Jr. Irish traditional ethnomusicology analysis using decision trees and high level symbolic features. In Proceedings of the 12th Sound and Music Computing Conference (SMC 2015), Maynooth, Ireland, 25 July–1 August 2015. [Google Scholar]
  17. Herremans, D.; Martens, D.; Sörensen, K. Composer classification models for music theory building. In Computational Music Analysis; Meredith, D., Ed.; Springer: Cham, Switzerland, 2016; pp. 369–392. [Google Scholar]
  18. van Kranenburg, P.; Maessen, G. Comparing offertory melodies of five medieval Christian chant traditions. In Proceedings of the 18th International Society for Music Information Retrieval Conference (ISMIR 2017), Suzhou, China, 23–27 October 2017; pp. 204–210. [Google Scholar]
  19. Dong, G.; Li, J. Efficient mining of emerging patterns: Discovering trends and differences. In Proceedings of the 5th ACM SIGKDD International Conference on Knowledge Discovery and Data Mining (KDD-99), San Diego, CA, USA, 15–18 August 1999; pp. 43–52. [Google Scholar]
  20. Han, J.; Fu, Y.; Wang, W.; Koperski, K.; Zaiane, O. DMQL: A data mining query language for relational databases. In Proceedings of the ACM SIGMOD Workshop on Data Mining and Knowledge Discovery (DMKD-96), Montreal, QC, Canada, 2 June 1996; pp. 27–33. [Google Scholar]
  21. Ali, K.; Manganaris, S.; Srikant, R. Partial classification using association rules. In Proceedings of the 3rd International Conference on Knowledge Discovery and Data Mining (KDD-97), Newport Beach, CA, USA, 14–17 August 1997; pp. 115–118. [Google Scholar]
  22. Maeda, A.; Maki, H.; Akimori, H. Characteristic rule induction algorithm for data mining. In Proceedings of the 2nd Pacific-Asia Conference on Knowledge Discovery and Data Mining (PAKDD-98), Melbourne, Australia, 15–17 April 1998; pp. 399–400. [Google Scholar]
  23. Densmore, F. Menominee Music; Bulletin 102; Smithsonian Institution, Bureau of American Ethnology: Washington, DC, USA, 1932.
  24. Geng, L.; Hamilton, H.J. Interestingness measures for data mining: A survey. ACM Comput. Surv. 2006, 38, 1–32. [Google Scholar] [CrossRef]
  25. Novak, P.K.; Lavrač, N.; Webb, G.I. Supervised descriptive rule induction. In Encyclopedia of Machine Learning; Sammut, C., Webb, G.I., Eds.; Springer: Berlin, Germany, 2010; pp. 938–941. [Google Scholar]
  26. Atzmüller, M. Subgroup discovery—Advanced review. Wiley Interdiscip. Rev. Data Min. Knowl. Discov. 2015, 5, 35–49. [Google Scholar]
  27. Neubarth, K.; Conklin, D. Contrast pattern mining in folk music analysis. In Computational Music Analysis; Meredith, D., Ed.; Springer: Cham, Switzerland, 2016; pp. 393–424. [Google Scholar]
  28. Tan, P.N.; Kumar, V.; Srivastava, J. Selecting the right objective measure for association analysis. Inf. Syst. 2004, 29, 293–313. [Google Scholar] [CrossRef]
  29. Belohlavek, R.; Grissa, D.; Guillaume, S.; Nguifo, E.M.; Outrata, J. Boolean factors as a means of clustering of interestingness measures of association rules. In Proceedings of the 8th International Conference on Concept Lattices and their Applications (CLA 2011), Nancy, France, 17–20 October 2011; pp. 207–222. [Google Scholar]
  30. Han, J.; Cai, Y.; Cercone, N. Data-driven discovery of quantitative rules in relational databases. IEEE Trans. Knowl. Data Eng. 1993, 5, 29–40. [Google Scholar] [CrossRef] [Green Version]
  31. Turmeaux, T.; Salleb, A.; Vrain, C.; Cassard, D. Learning characteristic rules relying on quantified paths. In Proceedings of the 7th European Conference on Principles and Practice of Knowledge Discovery in Databases (PKDD 2003), Cavtat-Dubrovnik, Croatia, 22–26 September 2003; pp. 471–482. [Google Scholar]
  32. Lavrač, N.; Flach, P.; Zupan, B. Rule evaluation measures: A unifying view. In Proceedings of the 9th International Workshop on Inductive Logic Programming (ILP-99), Bled, Slovenia, 24–27 June 1999; pp. 174–185. [Google Scholar]
  33. Fürnkranz, J. Separate-and-conquer rule learning. Artif. Intell. Rev. 1999, 13, 3–54. [Google Scholar] [CrossRef]
  34. Kamber, M.; Shinghal, R. Evaluating the interestingness of characteristic rules. In Proceedings of the 2nd International Conference on Knowledge Discovery and Data Mining (KDD-96), Portland, OR, USA, 2–4 August 1996; pp. 263–266. [Google Scholar]
  35. Brijs, T.; Vanhoof, K.; Wets, G. Reducing redundancy in characteristic rule discovery by using integer programming techniques. Intell. Data Anal. 2000, 4, 229–240. [Google Scholar] [CrossRef]
  36. Nettl, B. North American Indian musical styles. J. Am. Folk. 1954, 67, 44–56, 297–307, 351–368. [Google Scholar] [CrossRef] [Green Version]
  37. Densmore, F. Chippewa Music II; Bulletin 53; Smithsonian Institution, Bureau of American Ethnology: Washington, DC, USA, 1913.
  38. Densmore, F. Chippewa Music; Bulletin 45; Smithsonian Institution, Bureau of American Ethnology: Washington, DC, USA, 1910.
  39. Densmore, F. Teton Sioux Music; Bulletin 61; Smithsonian Institution, Bureau of American Ethnology: Washington, DC, USA, 1918.
  40. Densmore, F. Pawnee Music; Bulletin 93; Smithsonian Institution, Bureau of American Ethnology: Washington, DC, USA, 1929.
  41. Densmore, F. Papago Music; Bulletin 90; Smithsonian Institution, Bureau of American Ethnology: Washington, DC, USA, 1929.
  42. Kavšek, B.; Lavrač, N. APRIORI-SD: Adapting association rule learning to subgroup discovery. Appl. Artif. Intell. 2006, 20, 543–583. [Google Scholar] [CrossRef]
  43. Lavrač, N.; Gamberger, D. Relevancy in constraint-based subgroup discovery. In Constraint-Based Mining and Inductive Databases; Boulicaut, J.F., Raedt, L.D., Mannila, H., Eds.; Springer: Berlin/Heidelberg, Germany, 2005; pp. 243–266. [Google Scholar]
  44. Sulzmann, J.N.; Fürnkranz, J. A comparison of techniques for selecting and combining class association rules. In Proceedings of the International Workshop From Local Patterns to Global Models at ECML/PKDD 2008 (LeGo-08), Antwerp, Belgium, 14–18 September 2008. [Google Scholar]
  45. Webb, G.I.; Butler, S.; Newlands, D. On detecting differences between groups. In Proceedings of the 9th ACM SIGKDD International Conference on Knowledge Discovery and Data Mining (KDD-2003), Washington, DC, USA, 24–27 August 2003; pp. 256–265. [Google Scholar]
  46. Novak, P.K.; Lavrač, N.; Gamberger, D.; Krstačić, A. CSM-SD: Methodology for contrast set mining through subgroup discovery. J. Biomed. Inform. 2009, 42, 113–122. [Google Scholar] [CrossRef] [PubMed] [Green Version]
  47. Lavrač, N.; Kavšek, B.; Flach, P.; Todorovski, L. Subgroup discovery with CN2-SD. J. Mach. Learn. Res. 2004, 5, 153–188. [Google Scholar]
  48. Densmore, F. Northern Ute Music; Bulletin 75; Smithsonian Institution, Bureau of American Ethnology: Washington, DC, USA, 1922.
  49. Densmore, F. Choctaw Music; Bulletin 136; Smithsonian Institution, Bureau of American Ethnology: Washington, DC, USA, 1943.
  50. García-Vico, A.; Carmona, C.; Martín, D.; García-Borroto, M.; del Jesus, M. An overview of emerging pattern mining in supervised descriptive rule discovery: Taxonomy, empirical study, trends, and prospects. Wiley Interdiscip. Rev. Data Min. Knowl. Discov. 2018, 8, e1231. [Google Scholar] [CrossRef] [Green Version]
  51. Piatetsky-Shapiro, G. Discovery, analysis and presentation of strong rules. In Knowledge Discovery in Databases; Piatetsky-Shapiro, G., Frawley, W., Eds.; MIT Press: Cambridge, MA, USA, 1991; pp. 229–248. [Google Scholar]
  52. Lenca, P.; Meyer, P.; Vaillant, B.; Lallich, S. On selecting interestingness measures for association rules: User oriented description and multiple criteria decision aid. Eur. J. Oper. Res. 2008, 184, 610–626. [Google Scholar] [CrossRef] [Green Version]
  53. Carvalho, D.R.; Freitas, A.A.; Ebecken, N. Evaluating the correlation between objective rule interestingness measures and real human interest. In Proceedings of the 9th European Conference on Principles and Practice of Knowledge Discovery in Databases (PKDD 2005), Porto, Portugal, 3–7 October 2005; pp. 453–461. [Google Scholar]
Figure 1. Visualization of two example patterns from Densmore’s quantitative analyses. Top: Songs of the Chippewa ending on the keynote, compared against combined Sioux, Ute, Mandan, Hidatsa, Pawnee, Papago, and Menominee songs. Bottom: Songs of the Teton Sioux containing one or more rhythmic units, compared against combined Chippewa, Ute, Mandan, Hidatsa, Pawnee, Papago, and Menominee songs. The bar charts show the relative frequency of the pattern in the target class (dark blue) and the background of other classes (light blue).
Applsci 10 01991 g001
Figure 2. Contingency table for a class association pattern X C .
Applsci 10 01991 g002
Figure 3. Distribution of completeness and discriminant power for the top 30 patterns mined with different pattern interestingness measures (minimum association support 3 % , maximum pattern size 4). Numbers in brackets indicate the rank of the maximally complete resp. discriminant pattern.
Applsci 10 01991 g003
Table 1. Interestingness measures for characteristic patterns.
MeasureDefinition
typicality P ( X | C )
utility P ( X ) a log P ( X C ) P ( X ) × P ( C )
novelty P ( X C ) P ( X ) × P ( C )
Laplace estimate n ( X C ) + 1 n ( X ) + 2
relative risk P ( C | X ) P ( C | ¬ X )
IC + + P ( C ) [ 1 P ( ¬ X | C ) P ( ¬ X | ¬ C ) ] if 0 P ( ¬ X | C ) P ( ¬ X | ¬ C ) < 1 0 otherwise
F1 score 2 × P ( X | C ) × P ( C | X ) P ( X | C ) + P ( C | X )
Table 2. Datasets, selected from Densmore’s collection of Native American music [37,38,39,40,41].
Case StudyClasses# of Songs# of Classes
1Tribes8194
2Song types2705
Table 3. Music content features based on Densmore’s quantitative analyses.
AttributeDefinition# of Values
Case Study 1Case Study 2
tonalitythird above keynote53
firstNoteReKeyfirst tone relative to keynote1714
lastNoteReKeylast tone relative to keynote76
lastNoteReCompasslast tone relative to compass of song42
materialtone material1613
accidentalschromatic alterations of tones63
structurerelation between contiguous accented tones43
firstProgressiondirection of first progression22
firstMetricPospart of measure on which song begins33
firstMeasurerhythm (meter) of first measure1310
meterChangechange of time (measure-lengths)33
rhythmicUnitsrhythmic units33
tempoVoiceAccomptempo relation voice/rhythmic accompaniment4
Table 4. Top-ranked patterns (by interestingness measure) in Case Study 1, with class support count n ( C ) , pattern support count n ( X ) , association support count n ( X C ) , interestingness I (according to the respective interestingness measure), completeness  Γ , and discriminant power  Δ .
MeasureClass (Support)Pattern (Support) n ( X C ) I Γ Δ
A1typicalityTeton Sioux (240)meterChange:yes (691)222 0.93 0.93 0.16
A2utility a = 0 Papago (167)material:major_pentatonic,
firstNoteReKey:fifth, lastNoteReKey:fifth,
lastNoteReCompass:above_lowest (28)
27 1.55 0.16 0.99
A3utility a = 1 Papago (167)lastNoteReCompass:above_lowest (269)149 0.33 0.89 0.82
A4utility a = 2 Teton Sioux (240)lastNoteReCompass:lowest,
meterChange:yes (456)
195 0.12 0.81 0.56
A5noveltyPapago (167)lastNoteReCompass:above_lowest (269)149 0.11 0.89 0.82
A6LaplaceChippewa (326)tonality:major, structure:harmonic,
firstNoteReKey:twelfth,lastNoteReKey:keynote (59)
56 0.93 0.17 0.99
A7rel. riskPapago (167)lastNoteReCompass:above_lowest (269)149 17.54 0.89 0.82
A8IC + + Teton Sioux (240)lastNoteReCompass:lowest (566)209 0.19 0.87 0.40
A9F1 scorePapago (167)lastNoteReCompass:above_lowest,
meterChange:yes (226)
139 0.71 0.83 0.87
Table 5. Top-ranked patterns (by interestingness measure) in Case Study 2, with class support count n ( C ) , pattern support count n ( X ) , association support count n ( X C ) , interestingness I (according to the respective interestingness measure), completeness  Γ , and discriminant power  Δ .
MeasureClass (Support)Pattern (Support) n ( X C ) I Γ Δ
B1typicalitylove songs (26)tempoVoiceAccomp:noDrum (65)26 1.00 1.00 0.81
B2utility a = 0 game songs (14)tonality:minor, accidentals:none,
firstProgression:upward,
lastNoteReKey:keynote (25)
8 1.82 0.57 0.93
B3utility a = 1 love songs (26)tempoVoiceAccomp:noDrum (65)26 0.35 1.00 0.81
B4utility a = 2 love songs (26)structure:melodic (171)25 0.17 0.96 0.40
B5noveltyMĭde’ songs (92)structure:melodic,
firstProgression:downward (121)
64 0.08 0.70 0.69
B6Laplacewar songs (87)structure:mixed,
lastNoteReKey:keynote,
lastNoteReCompass:lowest,
rhythmicUnits:one (12)
12 0.93 0.14 1.00
B7rel. riskgame songs (14)lastNoteReKey:keynote,
firstMetricPos:accented,
rhythmicUnits:no (37)
10 15.74 0.71 0.89
B8IC + + Mĭde’ songs (92)firstProgression:downward (198)84 0.26 0.91 0.36
B9F1 scoreMĭde’ songs (92)structure:melodic,
firstProgression:downward (121)
64 0.60 0.70 0.69

