Abstract
Melody extraction is an important task in music information retrieval community and it is unresolved due to the complex nature of real-world recordings. In this paper, the melody extraction problem is addressed in the extreme learning machine (ELM) framework. More specifically, the input musical signal is first pre-processed to mimic the human auditory system. The music features are then constructed by constant-Q transform (CQT), and the concentration strategy is introduced to make use of contextual information. Afterwards, the rough melody pitches are determined by ELM network, according to its pre-trained parameters. Finally, the rough melody pitches are fine-tuned by the spectral peaks around the frame-wise rough pitches. The proposed method can extract melody from polyphonic music efficiently and effectively, where pitch estimation and voicing detection are conducted jointly. Some experiments have been conducted based on three publicly available datasets. The experimental results reveal that the proposed method achieves higher overall accuracies with very fast speed.
1. Introduction
Melody extraction, also known as main melody extraction or predominant F0 estimation, aims to extract the predominant pitch sequence of melody (the lead voice or instrument) from polyphonic music [1]. It can be used in some applications, such as query-by-humming [2], version identification [3], music retrieval [4], and so on.
Various methods have been proposed since Goto first put forward the melody extraction problem [5]. Salience and temporal continuity are two principles commonly utilized in the literature. In the early studies, researchers tried various ways to formulate the melody extraction problem based on the two principles. For example, Fuentes et al. designed a translation invariant model to track the lead melody based on probabilistic latent component analysis [6]. Expectation maximization was utilized to estimate the model parameters. Salamon et al. defined a set of contour characteristics, studied theirs distributions, and devised rules to distinguish melodic and non-melodic contours [7]. This approach works especially well on singing melody extraction due to the preference of singing pitch contour. Later, Bosch and Gómez combined a salience function based on a smoothed instantaneous mixture model and pitch tracking based on pitch contour characterization [8,9]. To alleviate the low-frequency strong accompaniment influence, Zhang et al. generalized the Euclidean algorithm, which was designed for computing the greatest common divisor of two natural numbers to positive real numbers, and proposed the melody extraction method based on the modified Euclidean algorithm [10]. In contrast to tracking the pitch values, Arora and Behera proposed an online vocal melody extraction method, which traced various sources with the help of harmonic clusters and then determined the predominant vocal source by using the harmonic strength of the source. Recently, the task was formulated in the Bayesian filtering framework, and the salience, timbre similarity, and spectral smoothness were incorporated in the likelihood function, while temporal continuity was modeled in the pitch transition probability [11]. The aforementioned methods all addressed the melody extraction by human-crafted features and their performances degraded greatly when dealing with more complex music.
More recently, some deep learning-based methods have been proposed. Typical methods include the method by Fan et al., who separated the singing voice from polyphonic music, using a deep neural network, and tracked the melodic pitch trajectory by dynamic programming [12]. Rigaud and Radenen introduced two deep neural networks for singing melody extraction: one for pitch estimation and the other for singing voice detection [13]. The aforementioned works obtain singing pitches directly from the deep learning networks, while there are still some alternative methods. For example, Bittner et al. got the deep salience representations for F0 estimation [14]. Lu and Su addressed the melody extraction problem from the semantic segmentation on a time-frequency image perspective [15]. Afterwards, following Lu and Su’s work, Hsieh et al. added links between the pooling layers of the encoder and the un-pooling layers of the decoder to reduce convolution layers and simplify convolution modules [16]. The deep learning-based methods can automatically learn high-level features, according to the training data. They are capable of learning more sophisticated features. However, their performance strongly relies on the capacity and variability of training set, and it is often time-consuming to train their parameters.
Among these methods, Melodia is commonly considered as state of the art, especially for singing melody extraction [7,17]. It is a typical salience-based method, which is centered on the creation and characterization of pitch contours. The pitch contours are generated and grouped using heuristics based on auditory streaming cues. The audio signal is first processed through spectral transform and the instantaneous frequency method is adopted for frequency and amplitude correction. The salience function, based on bin salience mapping and harmonic weighting, is then constructed for determining the salience of frequencies among the pitch range. Afterwards, pitch contours are created based on peak filtering and peak streaming cascaded by contour characterization. Finally, spurious melodic trajectories are iteratively discarded based on some heuristic rules. This method tends to reserve singing contours, hence it works especially well on singing melody extraction.
Huang and Babri proved that a single-hidden layer feedforward neural network (SLFN) with hidden nodes and with almost any nonlinear activation function can exactly learn distinct observations [18]. Later, Huang et al. proved that the input weights and hidden layer biases of SLFN can be randomly assigned if the activation functions of the hidden layer are infinitely differentiable and proposed the extreme learning machine (ELM) [19]. The ELM works efficiently and effectively in both pattern classification and regression [19]. It does not need the slow gradient-based learning algorithms to train neural networks or the iterative parameter tuning. As a result, the ELM network training speed is much faster.
Inspired by the fact that the ELM can learn non-linear features efficiently and effectively, an ELM-based melody extraction method is proposed in this work. The mixture signal is processed by an equal loudness filter to mimic the human auditory system and constant-Q transform (CQT) is employed to obtain multi-resolution spectral analysis. The CQT amplitude spectra of several adjacent frames are then concentrated to construct the input vectors for ELM. Next, the rough melodic pitches are estimated by the trained ELM network based on the training set. Finally, melodic pitch fine-tuning is carried out by searching the spectral peaks around the frame-wise rough pitches. The experimental results show that the proposed method achieves higher overall accuracies with fast speed, compared with some typical reference methods. The proposed method has some potential applications in other areas, such as fault diagnosis [20], biomedical signal processing [21], animal emotional recognition [22], and so on.
The main contributions of this paper include: The melody extraction is formulated in the ELM framework, which can extract melody efficiently and effectively; the pitch estimation and voicing detection are conducted jointly, which reduces their mutual inhibition; and the melodic pitches are fine-tuned after coarse melody estimation, which reserves the tiny dynamics of melody.
2. Preliminaries
2.1. Extreme Learning Machine
Feedforward neural networks can approximate complex nonlinear mapping functions directly from training data and provide models for difficult artificial phenomena. Traditionally, the parameters of the feedforward networks need to be tuned, leading to the dependency between different layers. The gradient descent-based methods are commonly used for parameter learning. However, these methods are often time-consuming due to either improper steps or converging to local minima. In this subsection, the SLFN and ELM will be presented in detail.
Given arbitrary distinct samples , where and , standard SLFNs with hidden nodes and an activation function are modeled as:
where is the output of , is the input weight vector connecting the -th hidden unit and input units, is the output weight vector connecting the -th hidden unit and the output units, is the bias of the -th hidden unit, and denotes the inner product of and .
The architecture of the ELM network that maps to is illustrated in Figure 1.
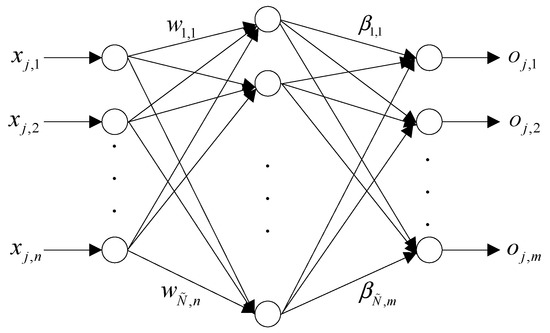
Figure 1.
Architecture of the extreme learning machine (ELM) network.
samples can be approximated by the standard SLFNs with hidden nodes and an activation function , i.e.,
In other words, there exist , and satisfying
The above equations can be denoted in the matrix form as:
where hidden layer output matrix , weight matrix , and label matrix are, respectively, defined as:
If the activation function is infinitely differentiable, the number of hidden nodes satisfies .
It is proven in [19] that the input weights and the hidden layer biases can be randomly initialized and then the output matrix can be calculated. Furthermore, the least-squares solution of the linear function denoted in Equation (4) is:
If , matrix is square and invertible when the input weights and the hidden layer biases are randomly initialized. In this case, the SLFN can approximate the training samples with zero error.
In most cases, the number of hidden nodes is much less than that of the training samples, i.e., , then is not square. Thus, the smallest norm least-squares solution of Equation (4) is:
where is the Moore–Penrose generalized inverse of matrix [23].
Huang et al. also proved that expressed in Equation (9) is one of the least-squares solutions with the smallest norm. Additionally, the minimum norm least-squares solution of Equation (4) is unique. In other words, the solution expressed by Equation (9) is the unique least-squares solution of approximating the samples. Moreover, can be any infinitely differential activation function, such as the sigmoidal function, radial basis, sine, cosine, or exponential function, and so on.
The detailed ELM training is presented in Algorithm 1.
| Algorithm 1. Procedure of ELM training |
| Input: Training set , activation function , and hidden node number . |
| Output: Output weights . |
| Steps |
|
Compared with the traditional gradient-based learning algorithms, ELM has several advantages, such as faster learning speed, better generalization, reaching the solutions directly without confusion of local minima or over-fitting, and so on.
2.2. Constant-Q Transform
Given a discrete time domain signal , its CQT representation is defined as [24]:
where and denote frequency and time indices, respectively, is the length of the input signal , and the atoms are the complex conjugated window functions, defined as:
with a zero-centered window function , bin center frequency , sampling rate , and .
The center frequencies are geometrically distributed as
where is the lowest frequency, is the number of frequency bins per octave, and is the total number of frequency bins.
The -factor of CQT is constant. The frequency resolution at the -th frequency bin is
Substituting Equation (13) into Equation (12) yields
It can be found that the frequency resolution of CQT is also geometrically spaced along the frequency bins. That is, higher frequency resolutions are obtained in the lower frequency bands, while lower frequency resolutions are obtained in the higher frequency bands, in accordance with the pitch intervals of notes.
2.3. Equal Loudness Filter
The human auditory system perceives sounds at different sound pressure levels for different frequencies. More specifically, human listeners are more sensitive to sounds among mid-frequency bands [25]. Due to this fact, an equal loudness filter is usually introduced in the music information retrieval community to pre-filter the musical signals. It is commonly implemented using the cascade of a 10-th order infinite impulse filter, followed by a second order high pass filter [25]. Following the previous works, we use the same implementation to enhance the components that the human auditory system is more sensitive to. The amplitude frequency response curve of the equal loudness filter is illustrated in Figure 2.
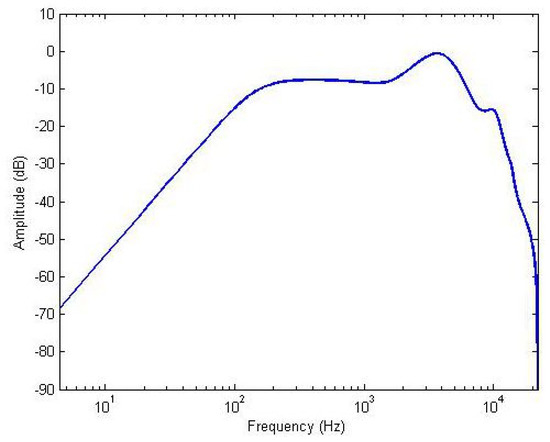
Figure 2.
Amplitude frequency response of equal loudness filter.
3. Extreme Learning Machine-Based Melody Extraction
To extract melody from polyphonic music efficiently and effectively with good generalization properties, the ELM-based melody extraction is proposed. The block diagram of the proposed method is shown in Figure 3. In detail, the audio mixture is first down-sampled and processed by the equal loudness filter to simulate the human auditory system. Then, CQT is utilized to analyze the audio with multiple resolutions and several CQT amplitude spectra are concentrated at the centering frames to construct the input vectors for the ELM. Next, the coarse pitches are estimated by pre-trained ELM. Finally, a post-processing step is employed in order to obtain a smoother melody contour. The pre-processing, rough melody pitch estimation, post-processing, and computational complexity analysis is presented in detail in this section.
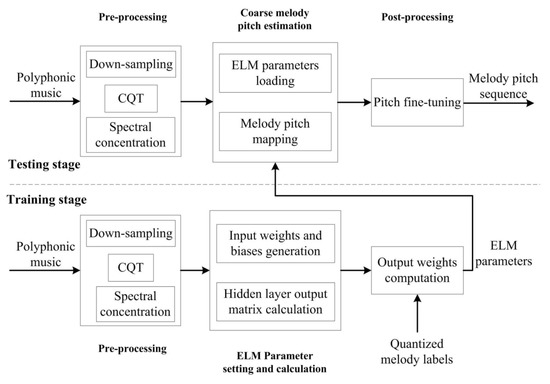
Figure 3.
Block diagram of the proposed method.
3.1. Pre-Processing
Previous studies illustrate that the spectral slope of musical signals decays 3 to 12 dB per octave [26], which implies that the amplitudes of higher frequency components drop dramatically. Therefore, down-sampling is utilized to reduce data quantity and accelerate processing speed.
In music, notes are spaced logarithmically with 12 semitones per octave. Hence, only the estimates falling with about 3% of the ground truth are considered correct. According to the Heisenberg uncertainty principle, the time and frequency resolutions cannot be increased at the same time, meaning that higher frequency resolution can only be obtained at the expense of lower time resolution. Hence, CQT is introduced to achieve variable resolution spectral analysis [24]. By CQT, the higher frequency resolution can be obtained for the lower frequency bands and the higher time resolution can be obtained for the higher frequency bands.
As musical signal is non-stationary and varies a lot, it is helpful to make use of the contextual information. Inspired by this phenomenon, the input vectors of ELM are constructed by concentrating the CQT amplitude spectra of several frames before and after the current frame, as depicted in Figure 4.
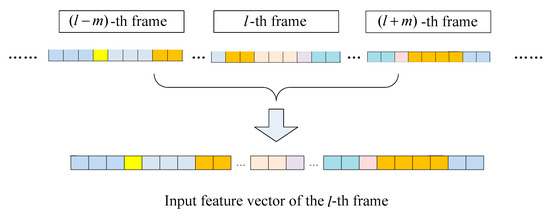
Figure 4.
Input vector construction.
3.2. Coarse Melody Pitch Estimation
In this work, the coarse melody pitches are estimated by ELM, with one semitone interval. ELM parameters need to be trained based on training set. The training audios are first pre-processed, as described in Section 3.1, and the input vectors are generated by incorporating some CQT amplitude spectra of adjacent frames.
Pitch estimation and voicing detection are two sub-problems in the melody extraction task. Either performance of these two sub-problems affects the other. To avoid their mutual inhibitions, pitch estimation and voicing detection are conducted simultaneously. That is, the unvoiced situation is also considered as one pattern, the same as pitches. More specifically, the labels are one-hot vectors with the first element equal to one for the unvoiced frames. The other elements correspond to the individual pitches.
During the training stage, given the training set , where is an input feature vector, is the corresponding label, and is the number of training samples, the input weights and hidden layer biases are first generated following uniform distribution on [−1,1]. Then, the hidden layer output matrix is determined according to Equation (5), where the activation function is the sigmoid function, i.e.,
Afterwards, the output weights can be calculated according the Equation (9). All parameters of ELM are now known, including the input weights , hidden layer biases , and the output weights .
During the test stage, the coarse melody pitches can be obtained based on the ELM parameters. Specifically, given the input vectors of a recording, the input feature vectors can be obtained, as described in Section 3.1.
Then, the output of sample is
where .
Next, the function is utilized to locate the maximum value. If the maximum value is the first element of vector , the corresponding frame is considered as unvoiced. In other cases, the pitches, with respect to these locations, are the coarse melody pitches.
3.3. Pitch Fine-Tuning
In real-world recordings, the pitches are continuous. However, the pitches are quantized to generate different classes in this paper. The estimated pitch contour might have some pitch jumps between adjacent frames. Hence, pitch fine-tuning is employed to derive a smoother melody contour herein.
As sinusoidal components exhibit a spectral peak in the CQT amplitude spectrum, pitch fine-tuning is conducted by searching around the estimated rough pitches. Suppose the rough pitch at frame is , the interval of peak search is set to be , where is the search radius. If some peaks are found, the frequency with the highest amplitude is chosen as the final pitch at this frame. If no peak is found at this interval, the rough pitch is chosen as the final one.
3.4. Computational Complexity Analysis
In this subsection, the computational complexity of the proposed method is analyzed. As commonly assumed, one addition, subtraction, multiplication, and division of two floating numbers are treated equally as one basic floating operation (Flops), and they contribute the same to the overall computation load [27].
The computational load of the proposed method mainly originates from CQT and ELM training and testing. Let and be the down-sampled signal lengths of training and testing recordings, respectively. Assume that and are the numbers of training and testing samples, respectively. Suppose that there are pitch classes and hidden neurons. CQT calculations of the training and testing recordings require Flops on the order of and [24], respectively. The computational cost of the ELM solution is . As , , , and , the computation of ELM training is on the order of . Similarly, ELM testing is on the order of . Therefore, the computational cost of ELM training is on the order of , and that of ELM testing is on the order of .
4. Experimental Results and Discussions
Some experiments were conducted to evaluate the performance of the proposed method. In this section, the experimental results and discussions are provided in detail.
4.1. Evaluation Metrics and Collections
4.1.1. Evaluation Metrics
In this paper, we chose three metrics that are commonly used in melody extraction literature, i.e., overall accuracy (OA), raw pitch accuracy (RPA), and raw chroma accuracy (RCA) [11].They are defined as
where the term ‘true positive’ means that the estimated pitch falls within a quarter tone from the ground truth on a given frame or one frame is correctly identified as unvoiced [28].
4.1.2. Evaluation Collections
In this paper, the evaluation experiments were carried out based on three publicly available collections: ISMIR2004, MIREX05 train, and MIR-1K. ISMIR2004 was collected by the Music Technology Group of Pompeu Fabra University. It contains 20 excerpts with different genres, such as Jazz, R&B, Pop, Opera, and so on. The sampling rate is 44.1 kHz. Durations of these recordings were about 20 s. The reference melody pitches are labeled each 5.8 ms.
MIREX05 train (also referred to as MIREX05 for simplicity) is provided by Graham Poliner and Dan Ellis (LabROSA, Columbia University). It involves 13 excerpts lasting between 24 s and 39 s, with a sampling rate of 44.1 kHz. The ground truths are labeled each 10 ms.
MIR-1K is gathered by the MIR Lab of National Taiwan University. It contains 1000 song clips chopped from 110 Karaoke songs. The total length of this dataset is 133 min, with each recording lasting from 4 s to 13 s. The sampling rate of this dataset is 16 kHz. A 10 ms interval is also used on this collection.
In this paper, the recordings of all collections were mixed together and randomly split into three subsets; 150 recordings for training, 100 recordings for validation, and the rest 783 for testing. The overview of training, validation, and testing sets is illustrated in Table 1.

Table 1.
Overview of training, validation. and testing sets.
4.2. Parameter Setting
There are some parameters that needed to be set before evaluation. As mentioned before, the musical signals are down-sampled to reduce the data quantity and accelerate the processing speed. In this work, the mixtures were re-sampled to 16 kHz. The MATLAB CQT toolbox implemented by Schörkhuber et al. was utilized herein for multi-resolution spectral analysis [24]. The spectral analysis range was [0, 8 kHz]. As the frequency tolerance is half semitone range of the ground truth, there are 12 semitones per octave, hence the CQT bins are geometrically spaced with 36 bins per octave, enough to satisfy the tolerance. The melody pitches were experientially set, ranging from 110 Hz to 1000 Hz. There were 40 notes with one semitone interval within this range. Hence, the ELM output one-hot vector was of dimension 41, since the unvoiced frames are also assigned with one pattern. The search radius of fine-tuning was set to be 2/3 semitones (i.e., two bins). If is set greater than 2/3 semitones, the fine-tuned pitch might shift to other notes rather than the coarse one, and if it is set less than 2/3 semitones, i.e., 1/3 semitone, the searching range does not cover the frequency tolerance. Moreover, the tiny margin between 2/3 semitones and tolerance can help track occasional singing glides. To make use of contextual information, the input feature vectors of the ELM cover 7 adjacent frames centered at the current frame.
Except for the aforementioned parameters, the hidden neuron number of ELM also need to be set. In this work, we evaluated the training accuracy, validation accuracy, training time, and validation time when the neuron number ranged from 1000 to 7000. The experimental results are given in Table 2.

Table 2.
Influence of hidden neuron number on the overall accuracy(OA).
It can be seen from Table 2 that training accuracy grows with the increase of the hidden neuron number. This phenomenon might because more complicated non-linear mapping functions can be approximated with more neuron numbers. However, the validation accuracy first grows then declines slightly with the increase of the neuron number. This observation reveals that the ELM network suffers from over-fitting to a small extent. As far as the processing times are concerned, the training time was prolonged dramatically with the increase of a hidden neuron number and the validation time was also extended approximately linearly. Considering both accuracies and time efficiencies, the hidden neuron number was set as 5000 in the following experiments.
4.3. Experimental Results on Test Sets
The performance of the proposed method is compared with some typical methods, including Melodia [7], the source/filter model incorporated with the contour characteristics (BG1) [9], the harmonic cluster tracking (HCT) [29], the probabilistic model (PM) [6], the modified Euclidean algorithm (MEA) [10], and the particle filter and dynamic programming (PFDP) [11] methods. These methods were chosen since they are typical methods and we could get their source codes or Vamp plug-in to assure the results were unbiased. In more detail, we used the Vamp plug-in of Melodia, the source codes of BG1, HCT, and PM, provided by the authors. MEA and PFDP are two methods proposed by us before. The detailed results and discussions of these methods are elaborated in this subsection.
4.3.1. Accuracies on Different Collections
As mentioned before, the three collections were mixed together and divided into training, validation, and testing sets. Thus, only the results on the testing sets were reported. To be fair, the results of the reference methods were also based on the testing set. The results are illustrated on individual collections to provide some deep insights.
The OAs, RPAs, and RCAs on ISMIR2004 are shown in Figure 5. It can be observed that the accuracies did not vary much among different methods. The proposed method obtained the highest OA, while its RPA and RCA were not high. This phenomenon implies that the proposed method was superior for voicing detection, while inferior for pitch estimation. Table 1 shows that recordings from ISMIR2004 contributed 2.7% to the whole training set. Hence, it can be concluded that the pitch estimation results relied more on the training set than voicing detection.
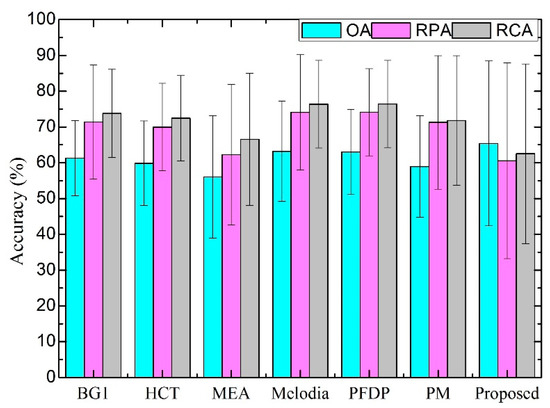
Figure 5.
Accuracies on ISMIR2004.
The OAs, RPAs, and RCAs on MIREX05 are depicted in Figure 6. It can be seen that the OA of the proposed method was much higher than all other compared methods. However, its RPA and RCA were much lower than others. Only one recording of this collection was covered in the training set, while 12 others were involved in the testing set. This great gap confirms our conclusion that pitch estimation relied more on training data than voicing detection. Moreover, both RPA and RCA of the other methods were higher than OA, while the OA of the proposed method was higher than the other two. Similar results can be observed in ISMIR2004.
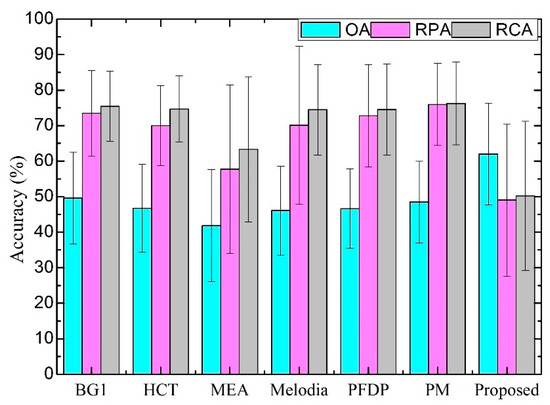
Figure 6.
Accuracies on MIREX05.
The OAs, RPAs, and RCAs on MIR-1K are provided in Figure 7. Results were very diverse on this collection. The OAs ranged from 26% to 64%. RPAs varied between 31% and 66%. RCAs covered the range of 39% to 69%. The proposed method obtained the highest OA, while Melodia achieved the highest RPA and RCA. This result may be due to the fact that it involved some strategies to preferably select the singing melody. RPA and RCA indicate the accuracies among the voiced frames, while the OA took into account of both voiced and unvoiced frames. It can be inferred that the voicing detection performance of the proposed method still outperformed the others on this dataset. Its RPA and RCA on this dataset was much better than those on ISMIR2004 and MIREX04. Table 1 reveals that the training set was mostly contributed by this collection, and that may be the reason for the RPA and RCA improvement.
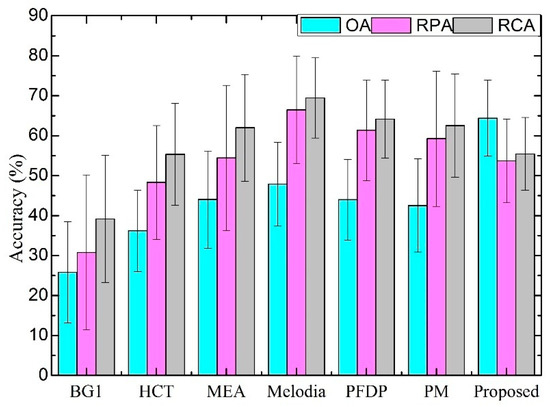
Figure 7.
Accuracies on MIR-1K.
4.3.2. Statistical Significance Analysis
To determine if the proposed method achieves significantly higher OA and lower RPA compared with the reference methods, the statistical significance analysis was performed. A paired-sample t-test was conducted between the proposed and reference methods in terms of OA and RPA.
The statistical significance results about OA are reported in Table 3. It can be seen from this table that the proposed method performed better than reference methods with respect to OA on ISMIR2004, but the differences were not significant. It outperformed the other methods significantly on both MIREX05 and MIR-1K.

Table 3.
Statistical significance analysis of a paired-sample t-test (OA) between the proposed and reference methods.
The statistical significance results about RPA are listed in Table 4. It can be found from this table that Melodia and PFDP achieved significantly higher RPAs than the proposed method on ISMIR2004. The proposed method obtained comparable RPA with the other methods on this dataset. However, all methods, except MEA, outperformed the proposed method significantly on MIREX05. As only one recording of MIREX05 was covered in the training set, it can be inferred that training samples were important for ELM parameter training, similar to other machine learning-based methods. As far as MIR-1K is concerned, the proposed method surpassed BG1 and HCT significantly, was comparable with MEA, and was inferior to Melodia and PFDF significantly with respect to RPA.

Table 4.
Statistical significance analysis of a paired-sample t-test (raw pitch accuracy (RPA))between the proposed and reference methods.
The statistical significance results, with respect to RCA, were similar to the results of RPA, so they are not given herein. The statistical results confirmed the judgment that the proposed method works better on OA than RPA and RCA, indicating its superiority in voicing detection.
4.3.3. Discussions
The averaged OAs, RPAs. and RCAs of all methods on the three collections are reported in Table 5. It can be seen from this table that Melodia achieved the highest RCA, PFDP obtained the highest RPA, while the proposed method gained the highest OA. The results revealed in this table indicate the superiority of the proposed method, with respective to OA. However, the RPAs and RCAs of the proposed method were not that high, indicating that the proposed method works much better on voice detection than pitch estimation, compared with the reference methods.

Table 5.
Averaged accuracies on three collections.
There are still several limitations of this method that need to be further studied in the future. First, the performance of the proposed method also relies on training set. It will help to improve its performance if an abundant dataset is utilized instead of randomly selecting some recordings to construct the training set. In addition, the proposed method does not take into account of the temporal dependency. Incorporating some temporal strategies also might be one future direction.
5. Conclusions
In this paper, melody extraction from polyphonic music is addressed in the ELM framework. Pitch estimation and voicing detection are carried out simultaneously. More specifically, the musical signals are first down-sampled, processed by an equal loudness filter to mimic the human auditory system, and analyzed by CQT. The frame-wise CQT spectra are then concentrated at the center frame to build the input feature vectors for the ELM. The output one-hot vectors of the ELM are generated based on the labels. Next, during the testing stage, the output prediction matrix of the ELM is computed according to the pre-trained parameters, and the rough melody pitches are obtained by locating the maximum value of each frame. Finally, the rough pitches are fine-tuned by searching around the rough pitches. The proposed method can learn high-level melody features very efficiently. It performs pitch estimation and voicing detection simultaneously. Experimental results demonstrate that the proposed method achieves higher overall accuracies compared with reference methods.
Author Contributions
Investigation, W.Z., Q.Z., and J.D.; writing—original draft, W.Z.; writing—review and editing, Q.Z.; supervision, S.B. and S.F.; funding acquisition, W.Z. and Q.Z. All authors have read and agreed to the published version of the manuscript.
Funding
This work was supported by [National Natural Science Foundation of China] grant number [61806178], [Natural Science Foundation of Liaoning Province] grant number [20170540197].
Acknowledgments
The authors would like to thank authors of the reference methods for providing the codes, Vamp plug-ins, or executable programs for evaluating the performances of these methods.
Conflicts of Interest
The authos declare no conflict of interest.
References
- Salamon, J.; Gómez, E.; Ellis, D.P.; Richard, G. Melody extraction from polyphonic music signals: Approaches, applications, and challenges. IEEE Signal Process. Mag. 2014, 31, 118–134. [Google Scholar] [CrossRef]
- Salamon, J.; Serra, J.; Gómez, E. Tonal representations for music retrieval: From version identification to query-by-humming. Int. J. Multimed. Inf. Retr. 2013, 2, 45–58. [Google Scholar] [CrossRef]
- Zhang, W.; Chen, Z.; Yin, F. Melody extraction using chroma-level note tracking and pitch mapping. Appl. Sci. 2018, 8, 1618. [Google Scholar] [CrossRef]
- Gathekar, A.O.; Deshpande, A.M. Implementation of melody extraction algorithms from polyphonic audio for Music Information Retrieval. In Proceedings of the IEEE International Conference on Advances in Electronics, Communication and Computer Technology, Pune, India, 2–3 December 2016; pp. 6–11. [Google Scholar]
- Goto, M. A real-time music-scene-description system: Predominant-F0 estimation for detecting melody and bass lines in real-world audio signals. Speech Commun. 2004, 43, 311–329. [Google Scholar] [CrossRef]
- Fuentes, B.; Liutkus, A.; Badeau, R.; Richard, G. Probabilistic model for main melody extraction using constant-Q transform. In Proceedings of the IEEE International Conference on Acoustics, Speech and Signal Processing (ICASSP), Kyoto, Japan, 25–30 March 2012; pp. 5357–5360. [Google Scholar]
- Salamon, J.; Gómez, E. Melody extraction from polyphonic music signals using pitch contour characteristics. IEEE Trans. Audio Speech Lang. Process. 2012, 20, 1759–1770. [Google Scholar] [CrossRef]
- Bosch, J.J.; Bittner, R.M.; Salamon, J.; Gutiérrez, E.G. A comparison of melody extraction methods based on source-filter modelling. In Proceedings of the 17th International Society for Music Information Retrieval Conference, New York, NY, USA, 7–11 August 2016; pp. 571–577. [Google Scholar]
- Bosch, J.; Gómez, E. Melody extraction based on a source-filter model using pitch contour selection. In Proceedings of the Sound and Music Computing Conference, Hamburg, Germany, 31 August–3 September 2016; pp. 67–74. [Google Scholar]
- Zhang, W.; Chen, Z.; Yin, F. Main melody extraction from polyphonic music based on modified Euclidean algorithm. Appl. Acoust. 2016, 112, 70–78. [Google Scholar] [CrossRef]
- Zhang, W.; Chen, Z.; Yin, F.; Zhang, Q. Melody extraction from polyphonic music using particle filter and dynamic programming. IEEE/ACM Trans. Audio Speech Lang. Process. 2018, 26, 1620–1632. [Google Scholar] [CrossRef]
- Fan, Z.-C.; Jang, J.-S.R.; Lu, C.-L. Singing voice separation and pitch extraction from monaural polyphonic audio music via DNN and adaptive pitch tracking. In Proceedings of the International Conference on Multimedia Big Data, Taipei, Taiwan, 20–22 April 2016; pp. 178–185. [Google Scholar]
- Rigaud, F.; Radenen, M. Singing voice melody transcription using deep neural networks. In Proceedings of the International Society for Music Information Retrieval Conference, New York, NY, USA, 7–11 August 2016; pp. 737–743. [Google Scholar]
- Bittner, R.M.; Mcfee, B.; Salamon, J.; Li, P.; Bello, J.P. Deep salience representations for F0 estimation in polyphonic music. In Proceedings of the International Society for Music Information Retrieval Conference, Suzhou, China, 23–27 October 2017; pp. 63–70. [Google Scholar]
- Lu, W.T.; Su, L. Vocal Melody Extraction with Semantic Segmentation and Audio-symbolic Domain Transfer Learning. In Proceedings of the International Society for Music Information Retrieval Conference, Paris, France, 23–27 September 2018; pp. 521–528. [Google Scholar]
- Hsieh, T.-H.; Su, L.; Yang, Y.-H. A streamlined encoder/decoder architecture for melody extraction. In Proceedings of the International Conference on Acoustics, Speech and Signal Processing, Brighton, UK, 12–17 May 2019; pp. 156–160. [Google Scholar]
- Bosch, J. From Heuristics-Based to Data-Driven Audio Melody Extraction. Ph.D. Thesis, Universitat Pompeu Fabra, Barcelona, Spain, 2017. [Google Scholar]
- Huang, G.-B.; Babri, H.A. Upper bounds on the number of hidden neurons in feedforward networks with arbitrary bounded nonlinear activation functions. IEEE Trans. Neural Netw. 1998, 9, 224–229. [Google Scholar] [CrossRef] [PubMed]
- Huang, G.-B.; Zhu, Q.-Y.; Siew, C.-K. Extreme learning machine: Theory and applications. Neurocomputing 2006, 70, 489–501. [Google Scholar] [CrossRef]
- Zhang, D.; Yu, D. Multi-fault diagnosis of gearbox based on resonance-based signal sparse decomposition and comb filter. Measurement 2017, 103, 361–369. [Google Scholar] [CrossRef]
- Verde, L.; de Pietro, G.; Sannino, G. A methodology for voice classification based on the personalized fundamental frequency estimation. Biomed. Signal Process. Control. 2018, 42, 134–144. [Google Scholar] [CrossRef]
- Maskeliunas, R.; Raudonis, V.; Damasevicius, R. Recognition of emotional vocalizations of canine. Acta Acust. United Acust. 2018, 104, 304–314. [Google Scholar] [CrossRef]
- Serre, D. Matrices: Theory and Applications; Springer: Berlin, Germany, 2002. [Google Scholar]
- Schörkhuber, C.; Klapuri, A.; Holighaus, N.; Dörfler, M. A Matlab toolbox for efficient perfect reconstruction time-frequency transforms with log-frequency resolution. In Proceedings of the 53rd International Conference: Semantic Audio Engineering Society Conference, London, UK, 26–29 January 2014; pp. 1–8. [Google Scholar]
- Reddy, G.; Rao, K.S. Predominant Vocal Melody Extraction from Enhanced Partial Harmonic Content; IEEE: Piscataway, NJ, USA, 2017. [Google Scholar]
- Dressler, K. Pitch estimation by the pair-wise evaluation of spectral peaks. In Proceedings of the AES International Conference, Ilmenau, Germany, 22–24 July 2011; pp. 1–10. [Google Scholar]
- Zhang, Q.; Chen, Z.; Yin, F. Distributed marginalized auxiliary particle filter for speaker tracking in distributed microphone networks. IEEE/ACM Trans. Audio Speech Lang. Process. 2016, 24, 1921–1934. [Google Scholar] [CrossRef]
- Durrieu, J.-L.; Richard, G.; David, B.; Févotte, C. Source/filter model for unsupervised main melody extraction from polyphonic audio signals. IEEE Trans. Audio Speech Lang. Process. 2010, 18, 564–575. [Google Scholar] [CrossRef]
- Arora, V.; Behera, L. On-line melody extraction from polyphonic audio using harmonic cluster tracking. IEEE Trans. Audio Speech Lang. Process. 2013, 21, 520–530. [Google Scholar] [CrossRef]
© 2020 by the authors. Licensee MDPI, Basel, Switzerland. This article is an open access article distributed under the terms and conditions of the Creative Commons Attribution (CC BY) license (http://creativecommons.org/licenses/by/4.0/).