Abstract
Generalized autoregressive conditional heteroskedasticity (GARCH) is one of the most popular models for time-series forecasting. The GARCH model uses a maximum likelihood method for parameter estimation. For the likelihood method to work, there should be a known and specific distribution. However, due to uncertainties in time-series data, a specific distribution is indeterminable. The GARCH model is also unable to capture the influence of each variance in the observation because the calculation of the long-run average variance only considers the series in its entirety, hence the information on different effects of the variances in each observation is disregarded. Therefore, in this study, a novel forecasting model dubbed a fuzzy linear regression sliding window GARCH (FLR-FSWGARCH) model was proposed; a fuzzy linear regression was combined in GARCH to estimate parameters and a fuzzy sliding window variance was developed to estimate the weight of a forecast. The proposed model promotes consistency and symmetry in the parameter estimation and forecasting, which in turn increases the accuracy of forecasts. Two datasets were used for evaluation purposes and the result of the proposed model produced forecasts that were almost similar to the actual data and outperformed existing models. The proposed model was significantly fitted and reliable for time-series forecasting.
1. Introduction
Time-series forecasting is commonly considered as a technique for estimating many future domains. It has become a major interest in statistical inference and predictions for researchers and academics [1]. Almost every aspect of life, including the economy [2], physics [3], agriculture [4], and engineering [5], has applied time-series analysis. In economics, the accurate forecasting of data from a financial time series allows investors to determine relevant strategies and techniques to reduce price risk and protect their investment from unacceptable loss. One of the most crucial applications of forecasting is in investment risk management. Thus, the scrupulous selection of an effective forecasting model is important for managing non-linearity to ensure critical input for plans and decisions. In a significant number of studies, generalized autoregressive conditional heteroskedasticity (GARCH) and exponentially weighted moving average (EWMA) models have been used for time series forecasting, especially in estimating and predicting future values given the existence of ARCH effects in return series. Individual researchers can conveniently manipulate the GARCH and EWMA models as several resources are publicly available that can be used to develop forecasts effortlessly. Bollerslev [6] developed the GARCH model to estimate and predict future values given the existence of ARCH effects in return series in particular. The GARCH model has achieved significant success in describing in-sample forecasting characteristics [7]. Many studies used the GARCH model, for example, a study of the stochastic representation of impulsive noise in the frequency band [8], a study of the stock exchange market of China [9], and a study of Bitcoin volatility [10]. They found that the GARCH model is more accurate when compared to ordinary-least-square (OLS) and EWMA methods. From these studies, despite having publicly accessible tools to easily forecast data, the GARCH model performed better than the EWMA. Thus, our study used the GARCH model as a basis for improvement.
Extensive research is being undertaken to improve the GARCH model by combining mathematical and statistical models, thus creating new models. For instance, a Glosten–Jagannathan–Runkle–GARCH (GJR-GARCH) model was introduced to allow for the conditional variance to respond to previous negative and positive changes differently [11], and was then applied in measuring extreme risks within a sustainable financial system [12]. A combination of an artificial neural network (ANN) and GARCH was proposed for the volatility forecasting of daily log-returns series in a study of international stock return volatility [13], and was then applied in a study of the Chinese energy market [14]. More improved GARCH models were introduced for variance–covariance and correlation forecasting, including the use of orthogonal components for displaying temporal aggregated properties that are not found when working with univariate models [15]; the use of copulas for conveniently linking univariate GARCH [16]; and the use of realized semi-variances, semi-covariances, and semi-correlations [17]. Most of the improved model was used for correlation components, such as covariances and volatilities of stock and bond returns [18,19,20,21]. More extensive and complex GARCH models were developed to improve the forecasting model. For example, a fuzzy GJR-GARCH model using fuzzy inference systems [22], hybrid neural network GJR-GARCH models [23,24] for volatility forecasting of indexes, a mixture of integer-valued models with different distributions in GARCH model [25], and a hidden Markov Exponential GARCH model for volatility forecasting of crude oil price [26]. Another approach toward improving the GARCH model was introduced by using a sliding window technique to forecast future values in various fields; this was called the sliding window GARCH (SWGARCH) model [27,28]. These hybrid models produced more accurate results than the classic forecasting models considered in the studies.
Although these numerical models outperform the conventional forecasting models, forecasting errors are still debated regarding the issue of accuracy. Forecasting accurately facilitates researchers in decision-making; therefore, the existing models must be improved. The applications of ANN, GJR, and Markov chain methods are very popular but undesirable in this study due to their complex and lengthy computation processes. The computation is also not easy to understand and only concerned with weight adjustment [29]. Moreover, the common neural networks are inefficient for detecting nonlinear or dynamic behaviors [30] and are unable to independently manage data uncertainties [31], thus decreasing the forecasting efficiency. It is important to develop a new forecasting model with a low accuracy error [32]. In addition, the fuzzy theory in some hybrid models [33,34] can estimate nonlinear continuous functions uniformly with an arbitrary accuracy, thereby producing more precise results than GARCH models. However, the computations of the hybrid fuzzy models are lengthy and incomprehensible. Thus, our study considers improving the GARCH model into a more understandable and less complex model.
In previous studies, the GARCH models were sensitive to extreme values in certain seasonal months [14,27]. The sensitivity of the GARCH model depends on the parameter estimation using the maximum likelihood method (MLM). The likelihood method is sensitive to the selection of initial values and the data distribution. The existence of uncertainties in time-series data makes it unreliable to employ the likelihood method to manage the uncertainties because no specific distribution is known. This drawback poses a major issue in terms of the instability of time-series forecasting. The GARCH model imposes parameter restrictions that are often violated by estimated coefficients that may improperly limit the dynamics of the conditional variance process [35]. The GARCH model is also unable to capture the influence of each variance in the observation as the model uses a long-run average variance. The calculation of the long-run average variance, which is used to determine the weight of forecast, only considers the series in its entirety; therefore, the information on different effects of the variances in each observation is disregarded. Hence, our study improves the GARCH model in terms of parameter estimation and variance calculation to search for the most effective model for forecasting time-series data.
Therefore, this study proposes a new time-series forecasting model by combining the GARCH model with two methods; the first model is the fuzzy linear regression (FLR), which is used to estimate the parameters of the model, and the second is the fuzzy sliding window (FSW) variance, which is used to determine the weight of the forecast. The FLR is used for parameter estimation to reduce the computation risk and overcome the inter-correlation problem associated with independent variables [36]. It is capable of addressing uncertainties and handling fluctuating information and/or linguistic variables. The FLR is also more robust at handling outlier effects [37]. When applied to finance, FLR generates better estimates than the traditional approach [38]. This approach is very useful when facing unstable time-series data caused by uncertainties. The FSW variance is used to calculate the variance of the model. The FSW variance improves the proposed model by replacing the component of the long-run average variance in the GARCH. The FSW variance combines fuzzy theory and the sliding window technique. Applications of the sliding window technique are useful in forecasting [39]. The technique was used to determine the adjustment weights of the forecast and a certain number of splits to create a small number of intervals [40]. The performance of the sliding window technique enables researchers to understand how cases work and change the efficiency pattern [41]. SWGARCH [27] improved the GARCH model by using the sliding window technique to produce a window variance that is calculated based on principal component analysis (PCA) to determine the weight of the forecast. Although the steps are straight-forward, the determination of weight based on the PCA is unconvincing and inaccurate. Thus, the SWGARCH model cannot guarantee a highly accurate performance and further complicates the forecasting process. The new combination of the proposed model is beneficial as the FSW variance can capture the impact of each variance in the observation and retain information on various effects of each observation. This attempt is also very useful as the model can select an accurate window size, as well as determine the accurate weight of the forecast. The latter ensures the best accuracy performance. In addition, the computation of the proposed model is simple since it involves only four simple steps, allows for faster calculations, and requires a small memory space. Furthermore, the proposed model is capable of reducing calculated risk, address uncertainties in variables, and capitalizing on FLR to manage fuzzy data or linguistic variables. Therefore, this study aims to exploit the advantages of the FLR and the fuzzy window variance to address the drawbacks of the existing models. The sections below explain the algorithm of the proposed model, the implementation, the results, and the conclusion of the study.
2. The Proposed Model
2.1. FLR-FSWGARCH Model
The proposed model consists of four steps, as shown in Figure 1. The first step is the parameter estimation using fuzzy linear regression, the second step is the return computation, the third step is the fuzzy window variance computation, and the last step is the forecasting. The new combination of the GARCH model with two methods is done in the first and third steps. A fuzzy sliding window algorithm was developed in this model to be used in the first and the third steps.
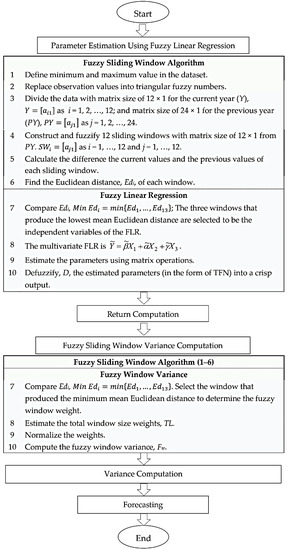
Figure 1.
Design algorithm of the fuzzy linear regression sliding window generalized autoregressive conditional heteroskedasticity (FLR-FSWGARCH) model. TFN: triangular fuzzy number.
The following paragraphs explain the above four steps involved in the proposed model in detail.
2.1.1. Parameter Estimation Using Fuzzy Linear Regression
The first step of the FLR-FSWGARCH is the parameter estimation using FLR. The FLR contains three components; the first component concerns the dependent variable, the second concerns the independent variables, and the third concerns the parameter coefficients. To select the independent variables, a fuzzy sliding window algorithm was developed. In the fuzzy sliding window algorithm, the minimum and maximum values of the dataset are determined. Then, the dataset undergoes a fuzzification process in which the crisp values of the data are transformed into triangular fuzzy numbers (TFNs). A matrix size of 12 × 1 for the current year (Y) and a matrix size of 24 × 1 for the previous year (PY), which consists of 24 months from the previous two years, are constructed, as adopted from the study by Kapoor and Bedi [29]. The matrix PY is used to construct 12 sliding window slices. The sliding windows are labeled SWi and have the same size as the matrix Y. The partitions of the sliding windows SWi and the matrix Y are given in Equations (1) and (2), respectively:
where Xn-i (i = 1, 2, 3, …, 12) is the previous observation of the first element in matrix Y. Both matrices SWi and Y are in the TFN form where SWi = (x1, x2, x3) and Y = (y1, y2, y3). Then, the Euclidean distance, Edi, for every 12 fuzzified sliding windows is obtained by using Equation (3):
where j = 1, 2, 3, …, 12 is the row of the elements in both the Y and SW matrices. Next, the Euclidean distance computed using Equation (3) is further defuzzified using Equation (4):
The mean Euclidean distance is calculated using Equation (5):
The three windows that produce the lowest mean Euclidean distance are selected to be the independent variables of the FLR. Now, the dependent variable is the TFN of the actual data, defined as , while the three selected windows act as the independent variable of the regression. This study uses multivariate FLR [36], as shown in Equation (6):
The TFN of the actual data is expressed as Equation (7):
where is the membership function, is the mode of the TFN, and and are the width of the left and right values with the mode of the TFN, respectively. In this study, we considered the dependent variables to be symmetrical TFNs given as ; thus, , as shown in Figure 2.
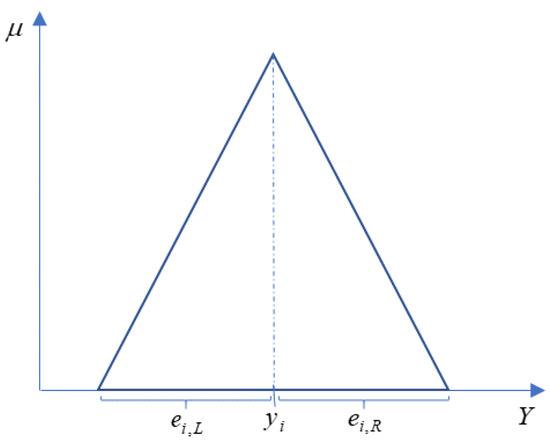
Figure 2.
The triangular fuzzy number of .
Then, matrix algebra is employed to estimate the parameters. The FLR can be expressed in the following matrix form:
where
Matrix is in the form of TFNs that contain a least-squares estimation of the regression coefficients. To obtain the regression parameters of , Equation (8) can be transformed using matrix operations and derived, as follows:
where X′ is the transpose matrix of X, while is the inverse matrix of X′X. The fitted fuzzy regression equation can be developed based on the estimated regression coefficients. The estimated regression coefficients, which are in the form of TFNs, need to be defuzzified (D) into a crisp output using Equation (13):
where , , and are the first, second, and third elements of the TFN forms, respectively.
2.1.2. Return Computation
In step two of the proposed model, the returns of the observation are computed by squaring the change in the rate at the end of , for example, and :
The return is defined as the continuously compounded return during time i, or it can be considered the gain or loss of value in a particular period.
2.1.3. Fuzzy Window Variance Computation
The fuzzy window variance is then calculated in the third step of the proposed model. The fuzzy window variance is a summation of the multiplication of each weight with the returns of the observation. It is employed in the FLR-FSWGARCH model as follows:
where is the fuzzy window weight that is subject to . The fuzzy window weight is determined by selecting the window that produced the minimum mean Euclidean distance in the previous step. The time series gives more weight to recent events as opposed to older observations. The total of the window size weights is calculated using Equation (16) and then the weights are normalized using Equation (17):
where the are the weights that are dependent on the selection of the sliding window. Then, the fuzzy window variance is utilized in the computation of the variance based on the most recent return and the most recent variance using a recursive procedure:
where is a recent return and is a recent variance.
2.1.4. Forecasting
The future values are forecasted using the expected forecast variance in the step four of the proposed model. The expected forecast variance is computed by using the fuzzy window variance as the weight of forecasting, as follows:
where n represents the month of the calculated variance and t represents the additional time that will reflect the forecasted month. Finally, the forecasted value is computed using Equation (20):
where is the current observation.
2.2. Validation and Evaluation of the Proposed Model
The mean absolute percentage error (MAPE) was used for comparing and assessing the accuracy performance of the model, as given below:
If the MAPE of the proposed model is less than the benchmark models, then the accuracy of the proposed model is better [42]. The benchmark models that were used for the performance comparison were SWGARCH, GARCH, ARIMA-GARCH, and EWMA.
Furthermore, regression analysis was done to verify the performance of the proposed model. The analysis also determined the relationship between the variance of FSWGARCH and its covariates, which were the fuzzy window variance, recent returns, and recent variances. The R2 in the regression analysis tests on a scale of 0–100 percent shows the strength of the relationship between the model and its covariates. Hypothesis testing was also developed, as given below:
The test statistic used in this study was , where and , with the rejection criteria of , where is the critical value. If is rejected, then there is enough evidence to say that the proposed model is significantly better.
3. Implementations and Results
3.1. Forecasting of the Stock and Price (S&P) Index Using the FLR-FSWGARCH Model
Daily data from the S&P index covering a period from 2 January 2015 to 10 September 2015 was obtained from Yahoo Finance. Figure 3 plots the daily S&P used in this study. The x-axis is the day numbered from 1 to 252, while the y-axis is the S&P.
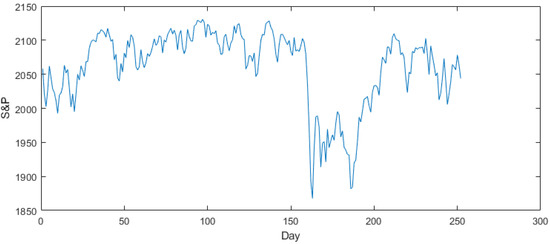
Figure 3.
The time-series plot of the Stock and Price (S&P) dataset.
The trend is apparent from the plot, indicating the necessity of a suitable model for nonlinear time-series forecasting, such as the FLR-FSWGARCH model. Next, the minimum and maximum observations of the S&P indexes were 1867.61 and 2130.82, respectively. The data was fuzzified using TFNs, as shown in Figure 4.
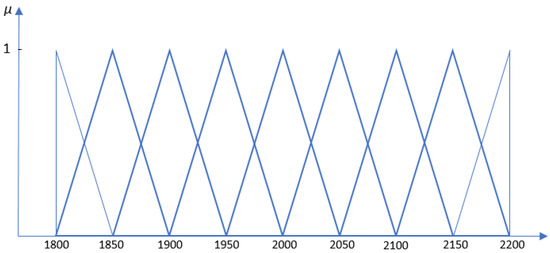
Figure 4.
The triangular fuzzy numbers of the S&P dataset.
A 12 × 1 matrix of the current year Y and 12 × 1 matrices of 12 sliding windows (SW) were formed from the data and tabulated, as shown in Table 1.

Table 1.
Matrix of the current year, Y and the previous year of S&P data, PY.
After partitioning the sliding windows, the differences between the current values and previous values were calculated to find the Euclidean distance of each window. The size of the forecasting was determined from the selected window that produced the minimum mean Euclidean distance. An example of a calculation using matrices Y and SW1 to produce the Euclidean distance is shown below.
- The difference between the current and previous values (only displays the calculation of the first row).
- The defuzzification:
- The mean Euclidean distance:The Euclidean distance calculated for each sliding window is shown in Table 2.
Table 2. Mean of Euclidean distance for the twelve sliding windows, SWi.
From Table 2, based on the Euclidean distance, it was found that SW1, SW4, and SW5 produced the smallest distances; thus, they were selected to be the explanatory variables, Xi, for the FLR analysis. The proposed computation for parameter estimation was employed on the data to produce:
By using Equation (12), the estimated regression parameters were:
Finally, the estimated FLR equation could be written as:
The was then defuzzified using Equation (8) to get the crisp values of β, α, and γ.
The estimated parameters β, α, and γ were used in FSWGARCH model to predict the data in steps three and four. After discovering the optimal parameters, returns of the observations were calculated by squaring the change in the number of S&P at the end of the month. Then, the fuzzy window variance (Fw), which was computed by summing up the multiplication of each weight with the returns of the observation, was employed in the FSWGARCH model. For this dataset, the three sliding windows produced the same minimum mean of the Euclidean distance, as stated in Table 2, which were SW1, SW4, and SW5. Thus, the variation of the three windows were calculated. The smallest variation produced by those windows was selected to determine the weight of the forecast. For the S&P dataset, the smallest variation among those three windows was SW5; thus, the total weight of Fw was 1 + 2 + 3 + 4 + 5 = 15. After some calculation, the model produced Fw and the variance, as shown in columns three and four, respectively, in Table 3. The first fuzzy window variance and the first variance of the FLR-FSWGARCH model started with month 6 as their weight included the first five returns.
Table 3.
Fuzzy window variance and variance of the FLR-FSWGARCH model.
The forecasting was then continued by calculating the expected variance and the forecast value, as given in Equations (19) and (20). The forecast value with the respective percentage errors is shown in Table 4. It can be observed that there was a slight difference between the actual observation and the forecasted value. The percentage errors in the fourth column were near 1%. The illustration of the actual data and forecast value of S&P data is displayed in Figure 5.
Table 4.
Forecast value and error percentage of the S&P data.
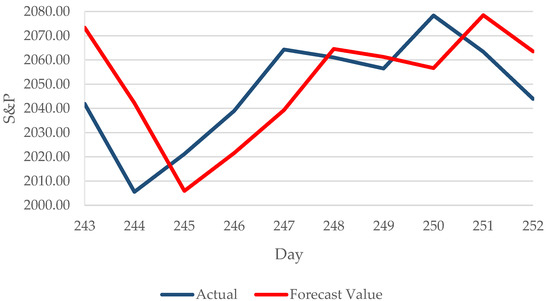
Figure 5.
Plot of the actual data and the forecast values.
3.2. Comparison and Evaluation of the Proposed FLR-FSWGARCH Model with Benchmark Models for Two Datasets
For contrast, the performance of the proposed model was compared to the SWGARCH, GARCH, ARIMA-GARCH, and EWMA models. Two datasets were involved; the first was the daily S&P index, as shown in Section 3.1, and the second was the yearly data for vanilla production covering 1961 to 2017 obtained from knoema.com. The mean absolute percentage errors produced by the models for both the monthly S&P and yearly vanilla datasets were compared and the results are summarized in Table 5.
Table 5.
Mean absolute percentage error (MAPE) of the datasets for different models.
As shown in Table 5, the FLR-FSWGARCH model produced a lower MAPE compared to the SWGARCH, GARCH, ARIMA-GARCH, and EWMA models for both datasets. It is clear that the FLR-FSWGARCH model outperformed the other models at forecasting the time-series data. The proposed model also underwent a goodness-of-fit test using regression analysis to test its efficiency. The results of the analysis are tabulated in Table 6 and Table 7.
Table 6.
Analysis of the S&P dataset.
Table 7.
Analysis of the vanilla production dataset.
From Table 6 and Table 7, the values of R2 were 0.9981 for S&P and 0.9999 for vanilla production; thus, a strong relationship existed between the variables of the model. By taking the significance level to be α = 0.05, the F values of both datasets were significant and the variables fuzzy window variance, recent returns, and recent variances were also statistically significant. Therefore, it can be concluded that the proposed model was significantly fitted and efficient. The proposed model could forecast accurately in both economics and agriculture.
4. Conclusions
In this study, a new model for time-series forecasting was presented. The model was presented in two phases. The first phase was fuzzy linear regression that was used to replace the maximum likelihood method in parameter estimation. The second was the fuzzy window variance used to replace the long-run average variance component. Two datasets were used to test the performance of the proposed model; the first was from economics and the second was from agriculture. The forecasted values obtained from the use of the proposed model were compared to the benchmark models. The empirical results show that the proposed FLR-FSWGARCH model produced highly accurate forecasting values and a lower mean absolute percentage error (MAPE) than the SWGARCH, GARCH, ARIMA-GARCH, and EWMA models. This demonstrates that the FLR-FSWGARCH model was capable of giving a superior forecast compared to the benchmark models. Furthermore, the results also confirmed that the proposed model was highly reliable and significantly fit for forecasting time-series data as the R2 were more than 90% for both datasets. These indicated that the combination of the FLR and FSW variance with the GARCH model was adept at addressing uncertainties and handling fluctuating information. The highlight of this work lies in the application of FLR and FSW variance, which overcomes the limitation of the GARCH. The FLR curbs the inter-correlation problem associated with independent variables, while the FSW variance captures the influence of the variance on each observation and determines the true window selection for the weight of the forecast to produce a highly accurate performance.
In view of the need for a model that is easily understood by most people, particularly forecasters, the proposed model is computationally simple and practical as it does not involve any complex computations or simulations. The equations in the proposed model can be applied in Excel to obtain the estimated parameters of models and calculate the forecasts automatically. In addition, the application of the proposed model extends beyond the fields of economics to even include use in agriculture. Therefore, the proposed forecasting model could be used as an alternative to better forecast sustainable prices and growth, thereby improving a country’s economy. The application of the FLR-FSWGARCH model will also facilitate the decision-making processes associated with forecasting practice. For further studies, more attention should be paid to the fuzzification process by imposing a bipolar fuzzy set to form the triangular fuzzy numbers. The bipolar fuzzy set is an extension of a fuzzy set whose membership degree range is (−1,1), which is different from the current study, which uses a membership degree range of (0,1). The performance of the proposed model will be more superior by using the bipolar fuzzy set as previous research has shown its advantages when handling vagueness and uncertainty over a fuzzy set.
Author Contributions
Conceptualization, A.L.M.H. and M.O.; project administration, A.L.M.H.; validation, N.R. and A.H.; formal analysis, R.S. and P.V.; funding acquisition, M.O. All authors have read and agreed to the published version of the manuscript.
Funding
Universiti Teknologi PETRONAS, Malaysian Fundamental Research Grant Scheme (FRGS), cost center: 015MA0-021.
Acknowledgments
Thanks to the authors for the contributions and thanks to Universiti Teknologi PETRONAS and FRGS for providing financial support and good facilities.
Conflicts of Interest
The authors declare no conflict of interest.
References
- Tobar, F.A.; Orchard, M.E.; Mandic, D.P.; Constantinides, A.G. Estimation of Financial Indices Volatility Using a Model with Time-Varying Parameters. In Proceedings of the IEEE Conference on Computational Intelligence for Financial Engineering & Economics (CIFEr), London, UK, 27–28 March 2014; pp. 318–324. [Google Scholar] [CrossRef]
- Banik, S.; Khan, K. Forecasting US NASDAQ Stock Index Values Using Hybrid Forecasting Systems. In Proceedings of the 18th International Conference on Computer and Information Technology (ICCIT), Dhaka, Bangladesh, 21–23 December 2015; pp. 282–287. [Google Scholar] [CrossRef]
- Zou, Y.; Donner, R.V.; Marwan, N.; Donges, J.F.; Kurths, J. Complex Network Approaches to Nonlinear Time Series Analysis. Phys. Rep. 2019, 787, 1–97. [Google Scholar] [CrossRef]
- Ruekkasaem, L.; Sasananan, M. Forecasting Agricultural Products Prices Using Time Series Methods for Crop Planning. Int. J. Mech. Eng. Technol. (Ijmet) 2018, 9, 957–971. [Google Scholar]
- Dong, M.A. Tutorial on Nonlinear Time-Series Data Mining in Engineering Asset Health and Reliability Prediction: Concepts, Models, and Algorithms. Math. Probl. Eng. 2010, 1–22. [Google Scholar] [CrossRef]
- Bollerslev, T. Generalized Autoregressive Conditional Heteroskedasticity. J. Econom. 1986, 31, 307–327. [Google Scholar] [CrossRef]
- Lamoureux, C.G.; Lastrapes, W.D. Persistence in Variance, Structural Change, and the GARCH Model. J. Bus. Econ. Stat. 1990, 8, 225–234. [Google Scholar] [CrossRef]
- Mosalaosi, M.; Afullo, T.J.O. Prediction of Asynchronous Impulsive Noise Volatility for Indoor Powerline Communication Systems Using GARCH Models. In Proceedings of the Progress in Electromagnetic Research Symposium (PIERS), Shanghai, China, 8–11 August 2016; pp. 4876–4880. [Google Scholar] [CrossRef]
- Guo, H. Estimating Volatilities by The GARCH and The EWMA Model of Petrochina and TCL in The Stock Exchange Market of China. In Proceedings of the 6th International Scientific Conference Managing and Modelling of Financial Risks, Ostrava, Czech Republic, 10–11 September 2012; pp. 191–202. [Google Scholar]
- Naimy, V.Y.; Hayek, M.R. Modelling and Predicting the Bitcoin Volatility Using GARCH Models. Int. J. Math. Model. Numer. Optim. 2018, 8, 197. [Google Scholar] [CrossRef]
- Glosten, L.R.; Jagannathan, R.; Runkle, D.E. On the Relation between the Expected Value and the Volatility of the Nominal Excess Return on Stocks. J. Financ. 1993, 48, 1779–1801. [Google Scholar] [CrossRef]
- Ma, X.; Yang, R.; Zou, D.; Liu, R. Measuring Extreme Risk of Sustainable Financial System Using GJR-GARCH Model Trading Data-Based. Int. J. Inf. Manag. 2020, 50, 526–537. [Google Scholar] [CrossRef]
- Donaldson, R.G.; Kamstra, M. An Artificial Neural Network-GARCH Model for International Stock Return Volatility. J. Empir. Financ. 1997, 4, 17–46. [Google Scholar] [CrossRef]
- Lu, X.; Que, D.; Cao, G. Volatility Forecast Based on the Hybrid Artificial Neural Network and GARCH-Type Models. Procedia Comput. Sci. 2016, 91, 1044–1049. [Google Scholar] [CrossRef]
- Van der Weide, R. GO-GARCH: A Multivariate Generalized Orthogonal GARCH Model. J. Appl. Econom. 2002, 17, 549–564. [Google Scholar] [CrossRef]
- Jondeau, E.; Rockinger, M. The Copula-GARCH Model of Conditional Dependencies: An International Stock Market Application. J. Int. Money Financ. 2006, 25, 827–853. [Google Scholar] [CrossRef]
- Bollerslev, T.; Patton, A.J.; Quaedvlieg, R. Multivariate Leverage Effects and Realized Semi-covariance GARCH Models. J. Econom. 2020. [Google Scholar] [CrossRef]
- Engle, R.F.; Rangel, J.G. The Spline-GARCH Model for Low-Frequency Volatility and Its Global Macroeconomic Causes. Rev. Financ. Stud. 2008, 21, 1187–1222. [Google Scholar] [CrossRef]
- Babu, C.N.; Reddy, B.E. Selected Indian Stock Predictions Using a Hybrid ARIMA-GARCH Model. In Proceedings of the International Conference on Advances in Electronics Computers and Communications, Bangalore, India, 10–11 October 2014; pp. 1–6. [Google Scholar] [CrossRef]
- Ou, P.; Wang, H. Modeling and Forecasting Stock Market Volatility by Gaussian Processes based on GARCH, EGARCH and GJR Models. In Proceedings of the World Congress on Engineering, London, UK, 6–8 July 2011; pp. 338–342. [Google Scholar]
- Choudhry, T.; Hasan, M.; Zhang, Y. Forecasting the Daily Dynamic Hedge Ratios in Emerging European Stock Futures Markets: Evidence from GARCH Models. Int. J. Bank. Account. Financ. 2019, 10, 67–100. [Google Scholar] [CrossRef]
- Maciel, L. A Hybrid Fuzzy GJR-GARCH Modeling Approach for Stock Market Volatility Forecasting. Braz. Rev. Financ. 2012, 10, 337–367. [Google Scholar] [CrossRef]
- Wang, Y.H. Nonlinear Neural Network Forecasting Model for Stock Index Option Price: Hybrid GJR–GARCH Approach. Expert Syst. Appl. 2009, 36, 564–570. [Google Scholar] [CrossRef]
- Kristjanpoller, W.; Fadic, A.; Minutolo, M.C. Volatility Forecast Using Hybrid Neural Network Models. Expert Syst. Appl. 2014, 41, 2437–2442. [Google Scholar] [CrossRef]
- Mao, H.; Zhu, F.; Cui, Y. A Generalized Mixture Integer-Valued GARCH Model. Stat. Methods Appl. 2019, 1–26. [Google Scholar] [CrossRef]
- Lin, Y.; Xiao, Y.; Li, F. Forecasting Crude Oil Price Volatility Via A HM-EGARCH Model. Energy Econ. 2020, 104693. [Google Scholar] [CrossRef]
- Shbier, M.Z.; Ku-Mahamud, K.R.; Othman, M. SWGARCH Model for Time Series Forecasting. In Proceedings of the 1st International Conference on Internet of Things and Machine Learning, Liverpool, UK, 17–18 October 2017. [Google Scholar] [CrossRef]
- Hanapi, A.L.M.; Othman, M.; Sokkalingam, R.; Sakidin, H. Developed A Hybrid Sliding Window and GARCH Model for Forecasting of Crude Palm Oil Prices in Malaysia. J. Phys. Conf. Ser. 2018, 1123, 1–8. [Google Scholar] [CrossRef]
- Kapoor, P.; Bedi, S.S. Weather Forecasting Using Sliding Window Algorithm. ISRN Signal Process. 2013, 1–5. [Google Scholar] [CrossRef]
- Tealab, A.; Hefny, H.; Badr, A. Forecasting of Nonlinear Time Series Using ANN. Future Comput. Inform. J. 2017, 2, 39–47. [Google Scholar] [CrossRef]
- Singh, P.; Gaurav, D. A Hybrid Fuzzy Time Series Forecasting Model Based on Granular Computing and Bio-Inspired Optimization Approaches. J. Comput. Sci. 2018, 27, 370–385. [Google Scholar] [CrossRef]
- Mas-Machuca, M.; Sainz, M.; Martinez-Costa, C. A Review of Forecasting Models for New Products. Intang. Cap. 2017, 10, 1–25. [Google Scholar] [CrossRef][Green Version]
- Dincer, N.G.; Akkuş, Ö. A New Fuzzy Time Series Model Based on Robust Clustering for Forecasting of Air Pollution. Ecol. Inform. 2018, 43, 157–164. [Google Scholar] [CrossRef]
- Chang, J.-R.; Wei, L.-Y.; Cheng, C.H. A Hybrid ANFIS Model Based on AR and Volatility for TAIEX Forecasting. Appl. Soft Comput. 2011, 11, 1388–1395. [Google Scholar] [CrossRef]
- Korkmaz, T.; Aydın, K. Using EVMA and GARCH Methods in VaR Calculations: Aplication on ISE-30 Index. Available online: http://content.csbs.utah.edu/~ehrbar/erc2002/pdf/P161.pdf (accessed on 12 March 2020).
- Abdullah, L.; Zakaria, N. Matrix Driven Multivariate Fuzzy Linear Regression Model in Car Sales. J. Appl. Sci. 2012, 12, 56–63. [Google Scholar] [CrossRef]
- Jialu, X.; Qiujun, L.G. Outlier Detection in Fuzzy Linear Regression About Predicting GDP. Int. J. Recent Res. Appl. Stud. 2014, 19, 189–193. [Google Scholar]
- Muzzioli, S.; Ruggier, A.; De Baets, B. A Comparison of Fuzzy Regression Methods for The Estimation of the Implied Volatility Smile Function. Fuzzy Sets Syst. 2015, 266, 131–143. [Google Scholar] [CrossRef]
- Bingham, E.; Gionis, A.; Haiminen, N.; Hiisila, H.; Mannila, H.; Terzi, E. Segmentation and Dimensionality Reduction. In Proceedings of the Sixth SIAM International Conference on Data Mining, Bethesda, MD, USA, 20–22 April 2006; pp. 372–383. [Google Scholar] [CrossRef]
- Datar, M.; Gionis, A.; Indyk, P.; Motwani, R. Maintaining Stream Statistics Over Sliding Windows. In Proceedings of the Thirteenth Annual ACM-SIAM Symposium on Discrete Algorithms, San Francisco, CA, USA, 6–8 January 2002; pp. 1794–1813. [Google Scholar] [CrossRef]
- Ferreira, P.; Dionísio, A.; Guedes, E.F.; Zebendee, G.F. A Sliding Windows Approach to Analyse the Evolution of Bank Shares in The European Union. Phys. A Stat. Mech. Its Appl. 2018, 490, 1355–1367. [Google Scholar] [CrossRef]
- Kapila, T.R.R.; Seneviratna, M.D.; Jianguo, W.; Arumawadu, H.I. A Hybrid Statistical Approach for Stock Market Forecasting Based on Artificial Neural Network and ARIMA Time Series Models. In Proceedings of the International Conference on Behavioral, Economic and Socio-cultural Computing (BESC), Nanjing, China, 30 October–1 November 2015; pp. 54–60. [Google Scholar] [CrossRef]

© 2020 by the authors. Licensee MDPI, Basel, Switzerland. This article is an open access article distributed under the terms and conditions of the Creative Commons Attribution (CC BY) license (http://creativecommons.org/licenses/by/4.0/).