Simultaneous Determination of 12 Marker Components in Yeonkyopaedok-san Using HPLC–PDA and LC–MS/MS


Abstract
1. Introduction
2. Materials and Methods
2.1. Plant Materials
2.2. Chemicals and Reagents
2.3. Preparation of the YPS Water Decoction
2.4. Preparations of Sample and Standard Solutions for HPLC Analysis
2.5. HPLC Apparatus and Conditions for Simultaneous Analysis of the 12 Marker Components
2.6. Validation of the HPLC Analytical Method
2.7. UPLC–MS/MS Apparatus and Conditions for Quantification of the 12 Marker Components
3. Results and Discussion
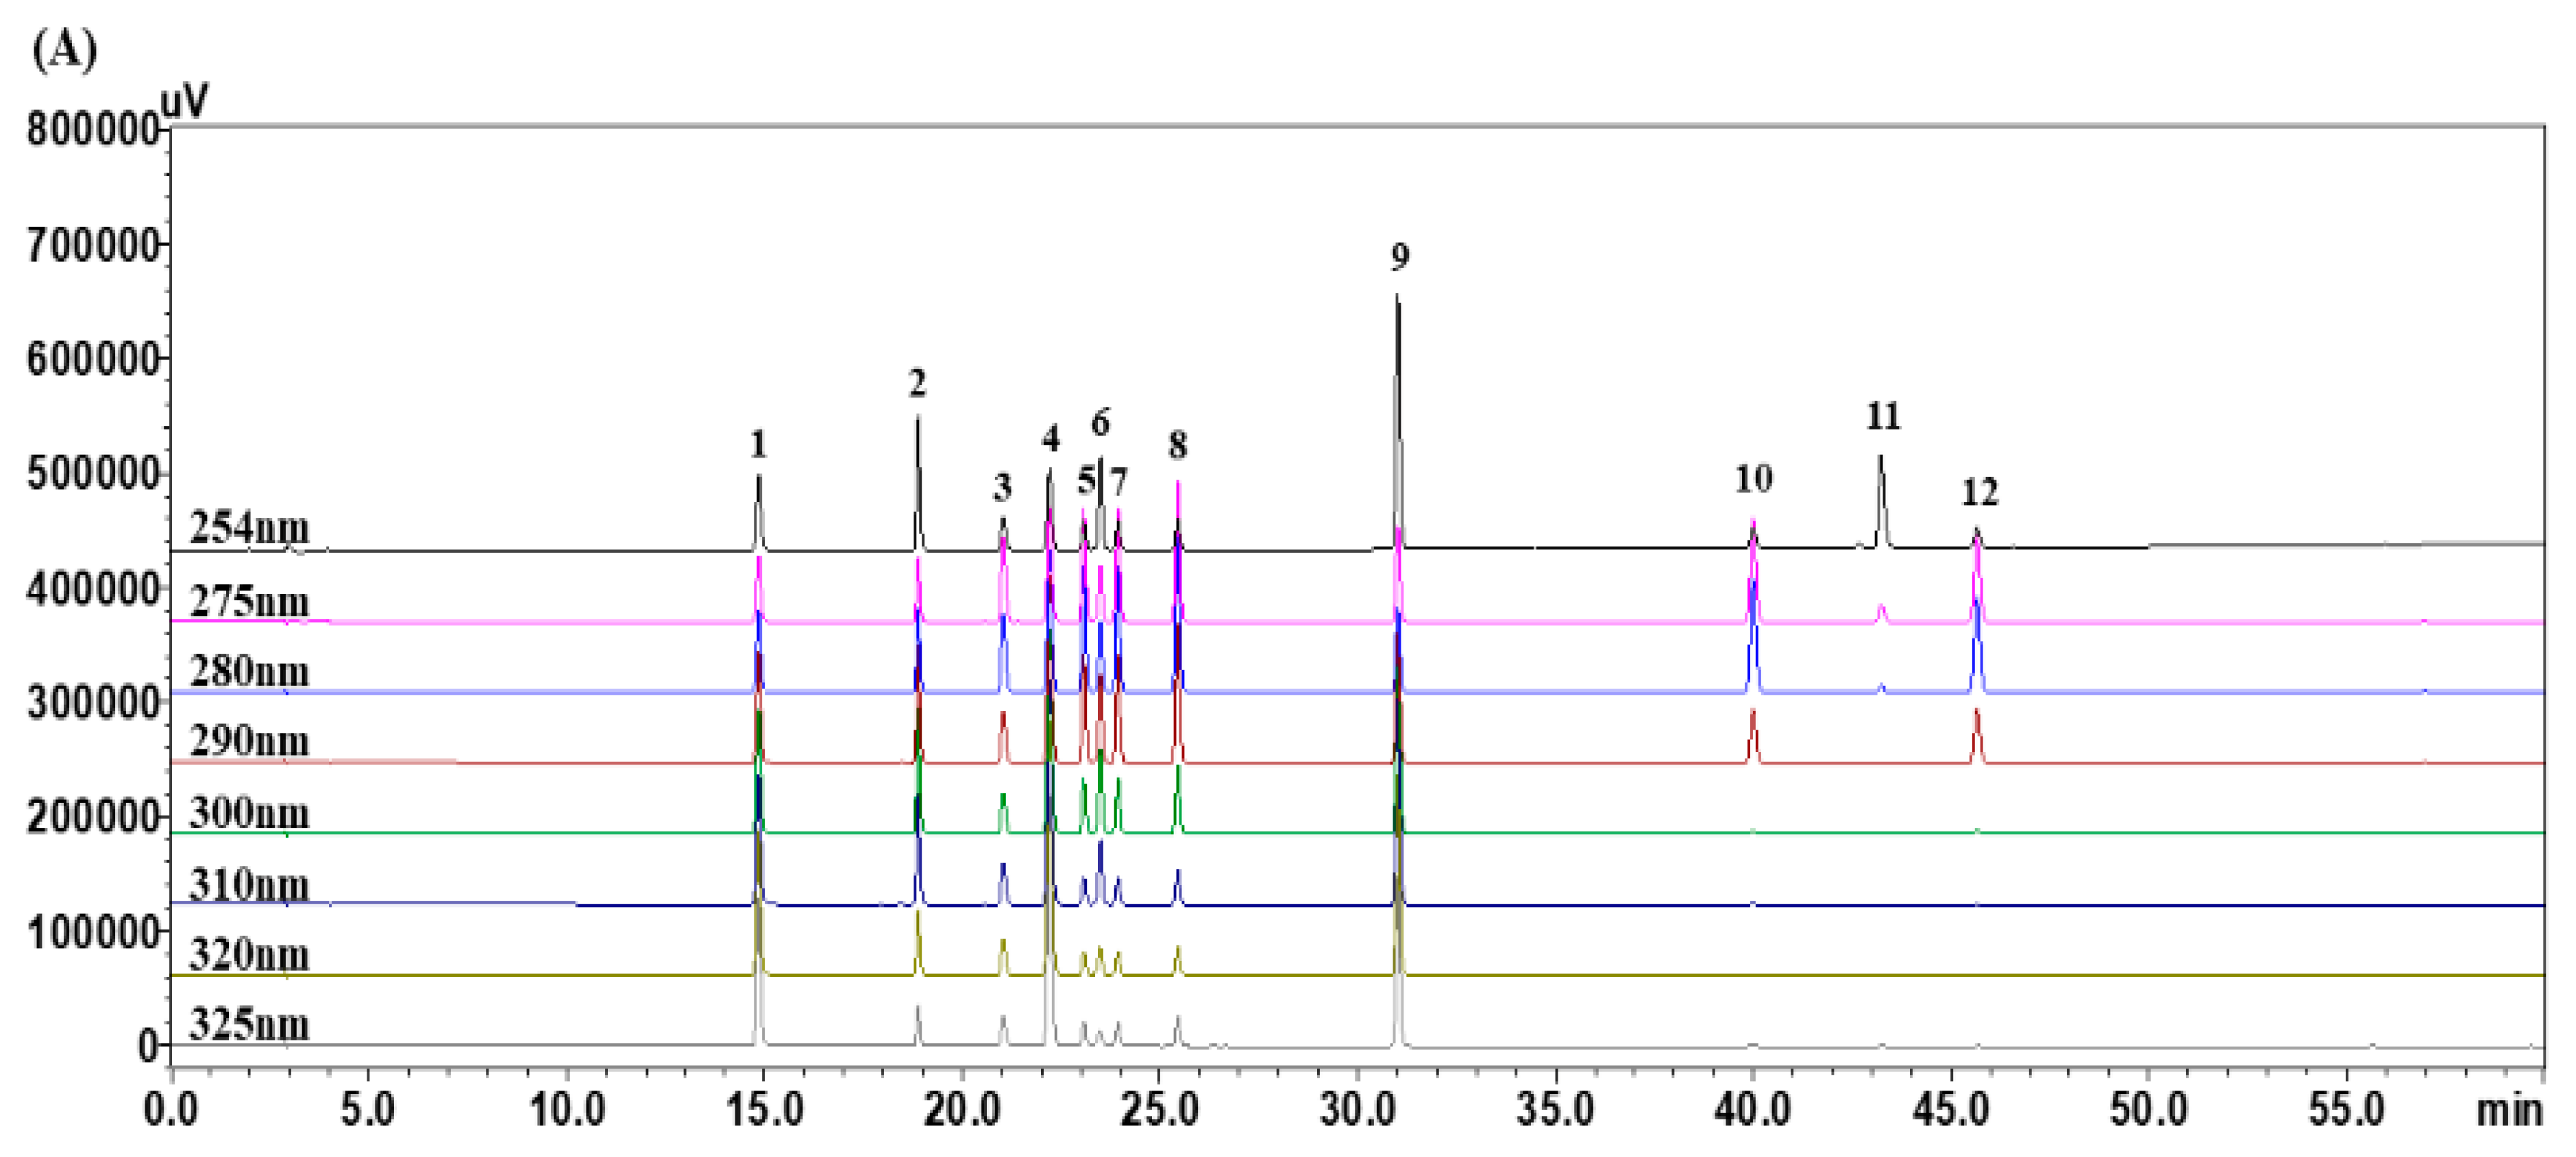
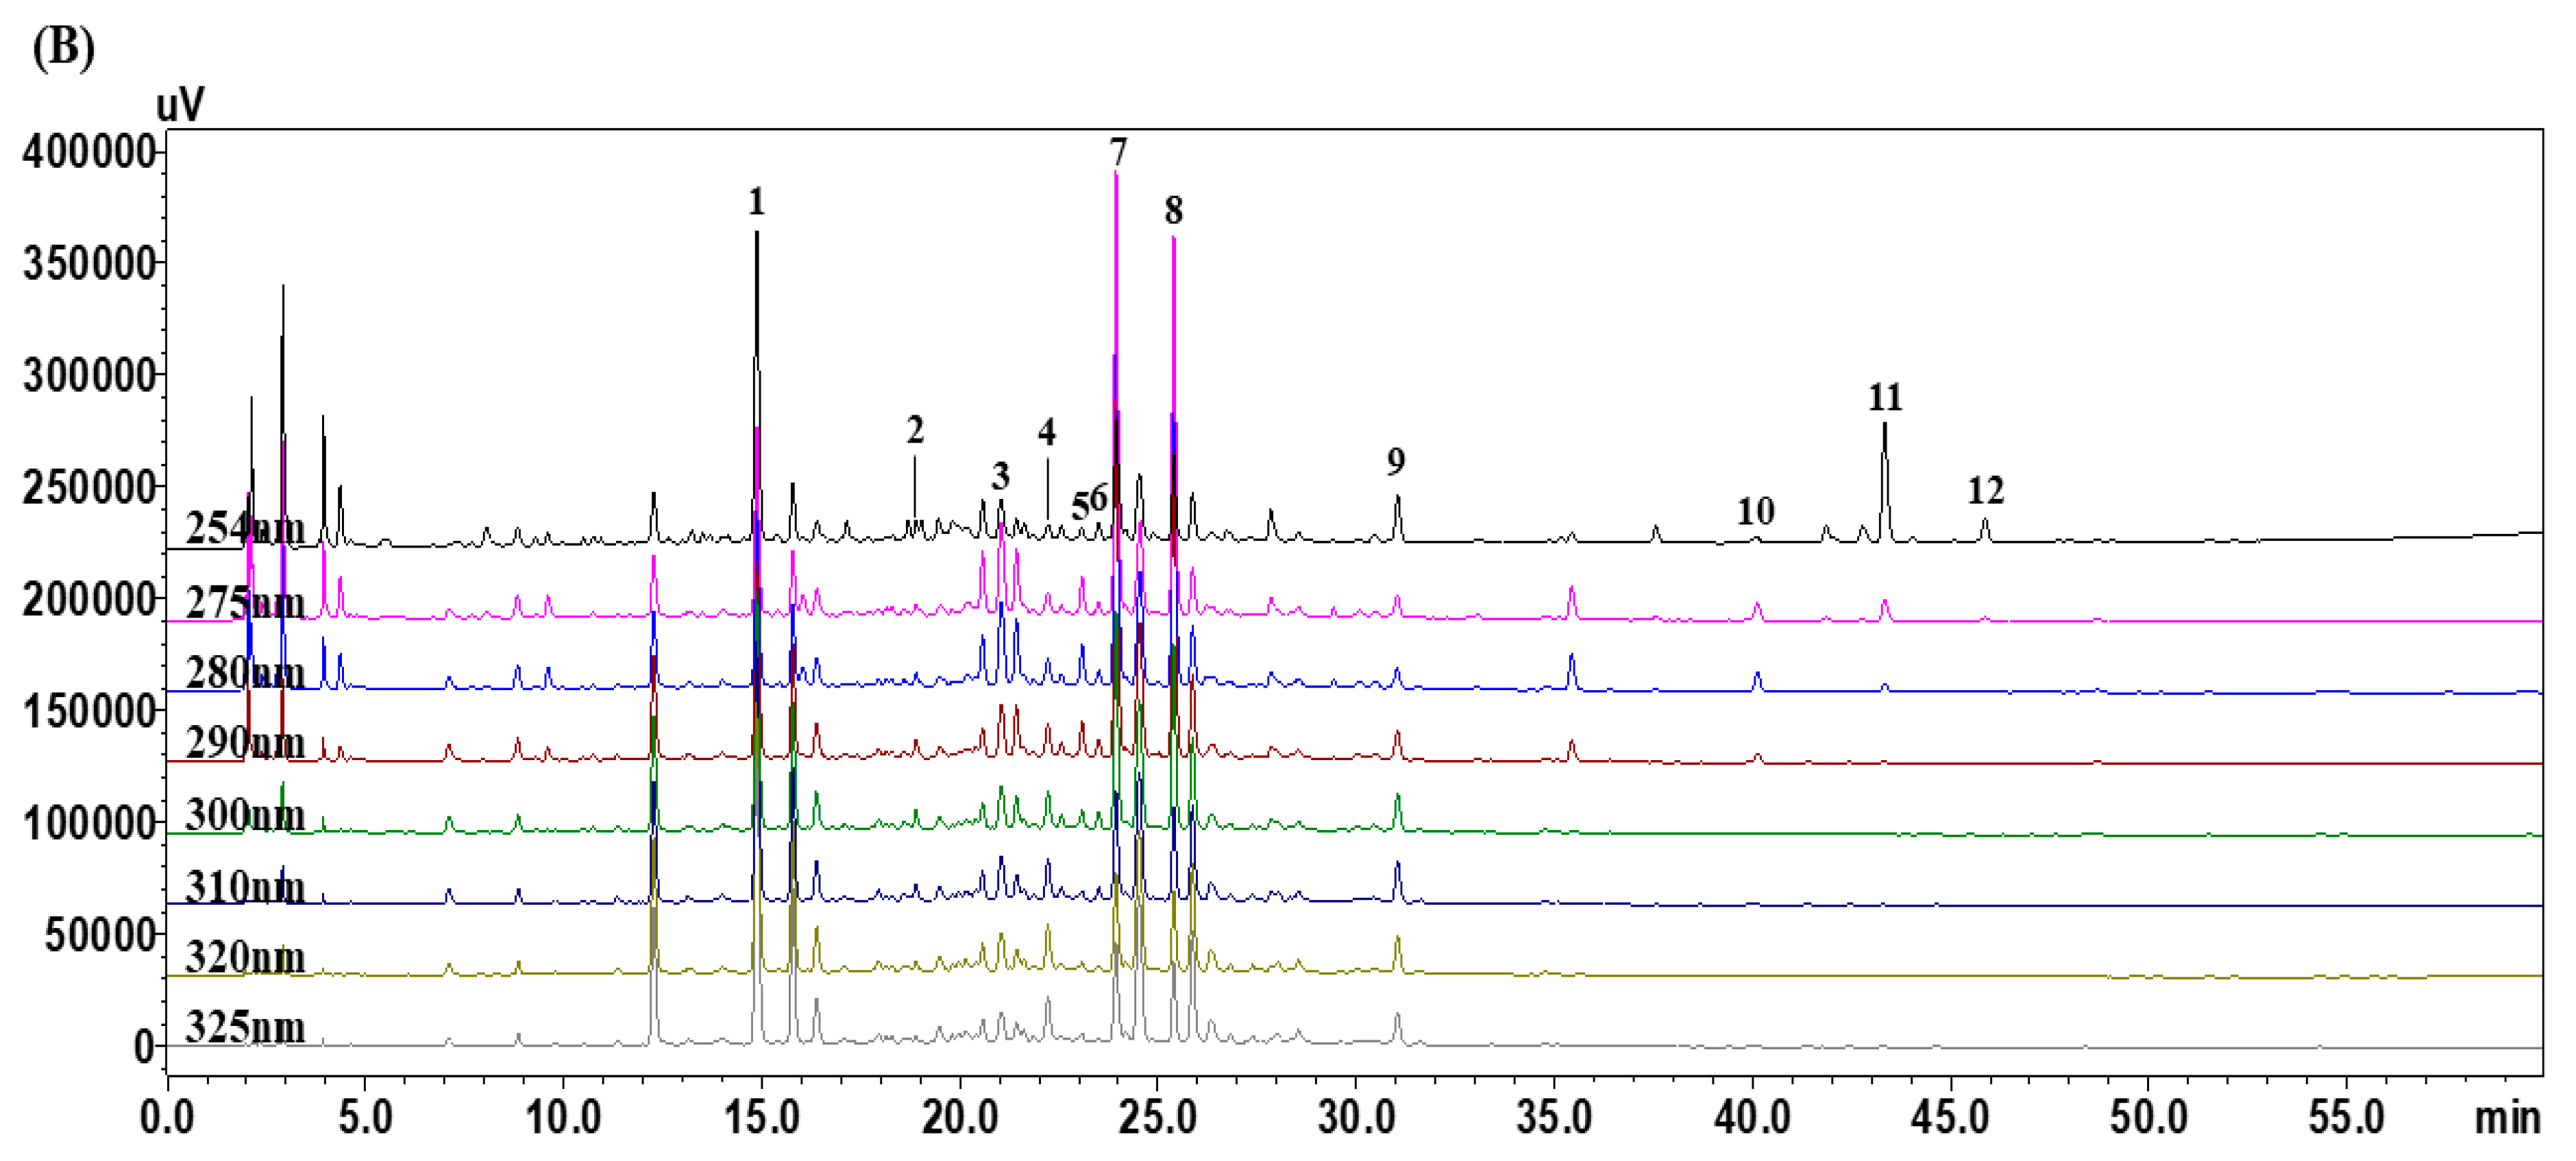
3.1. Optimization of HPLC Chromatographic Conditions
3.2. Method Validation for Quantitative Analysis by HPLC
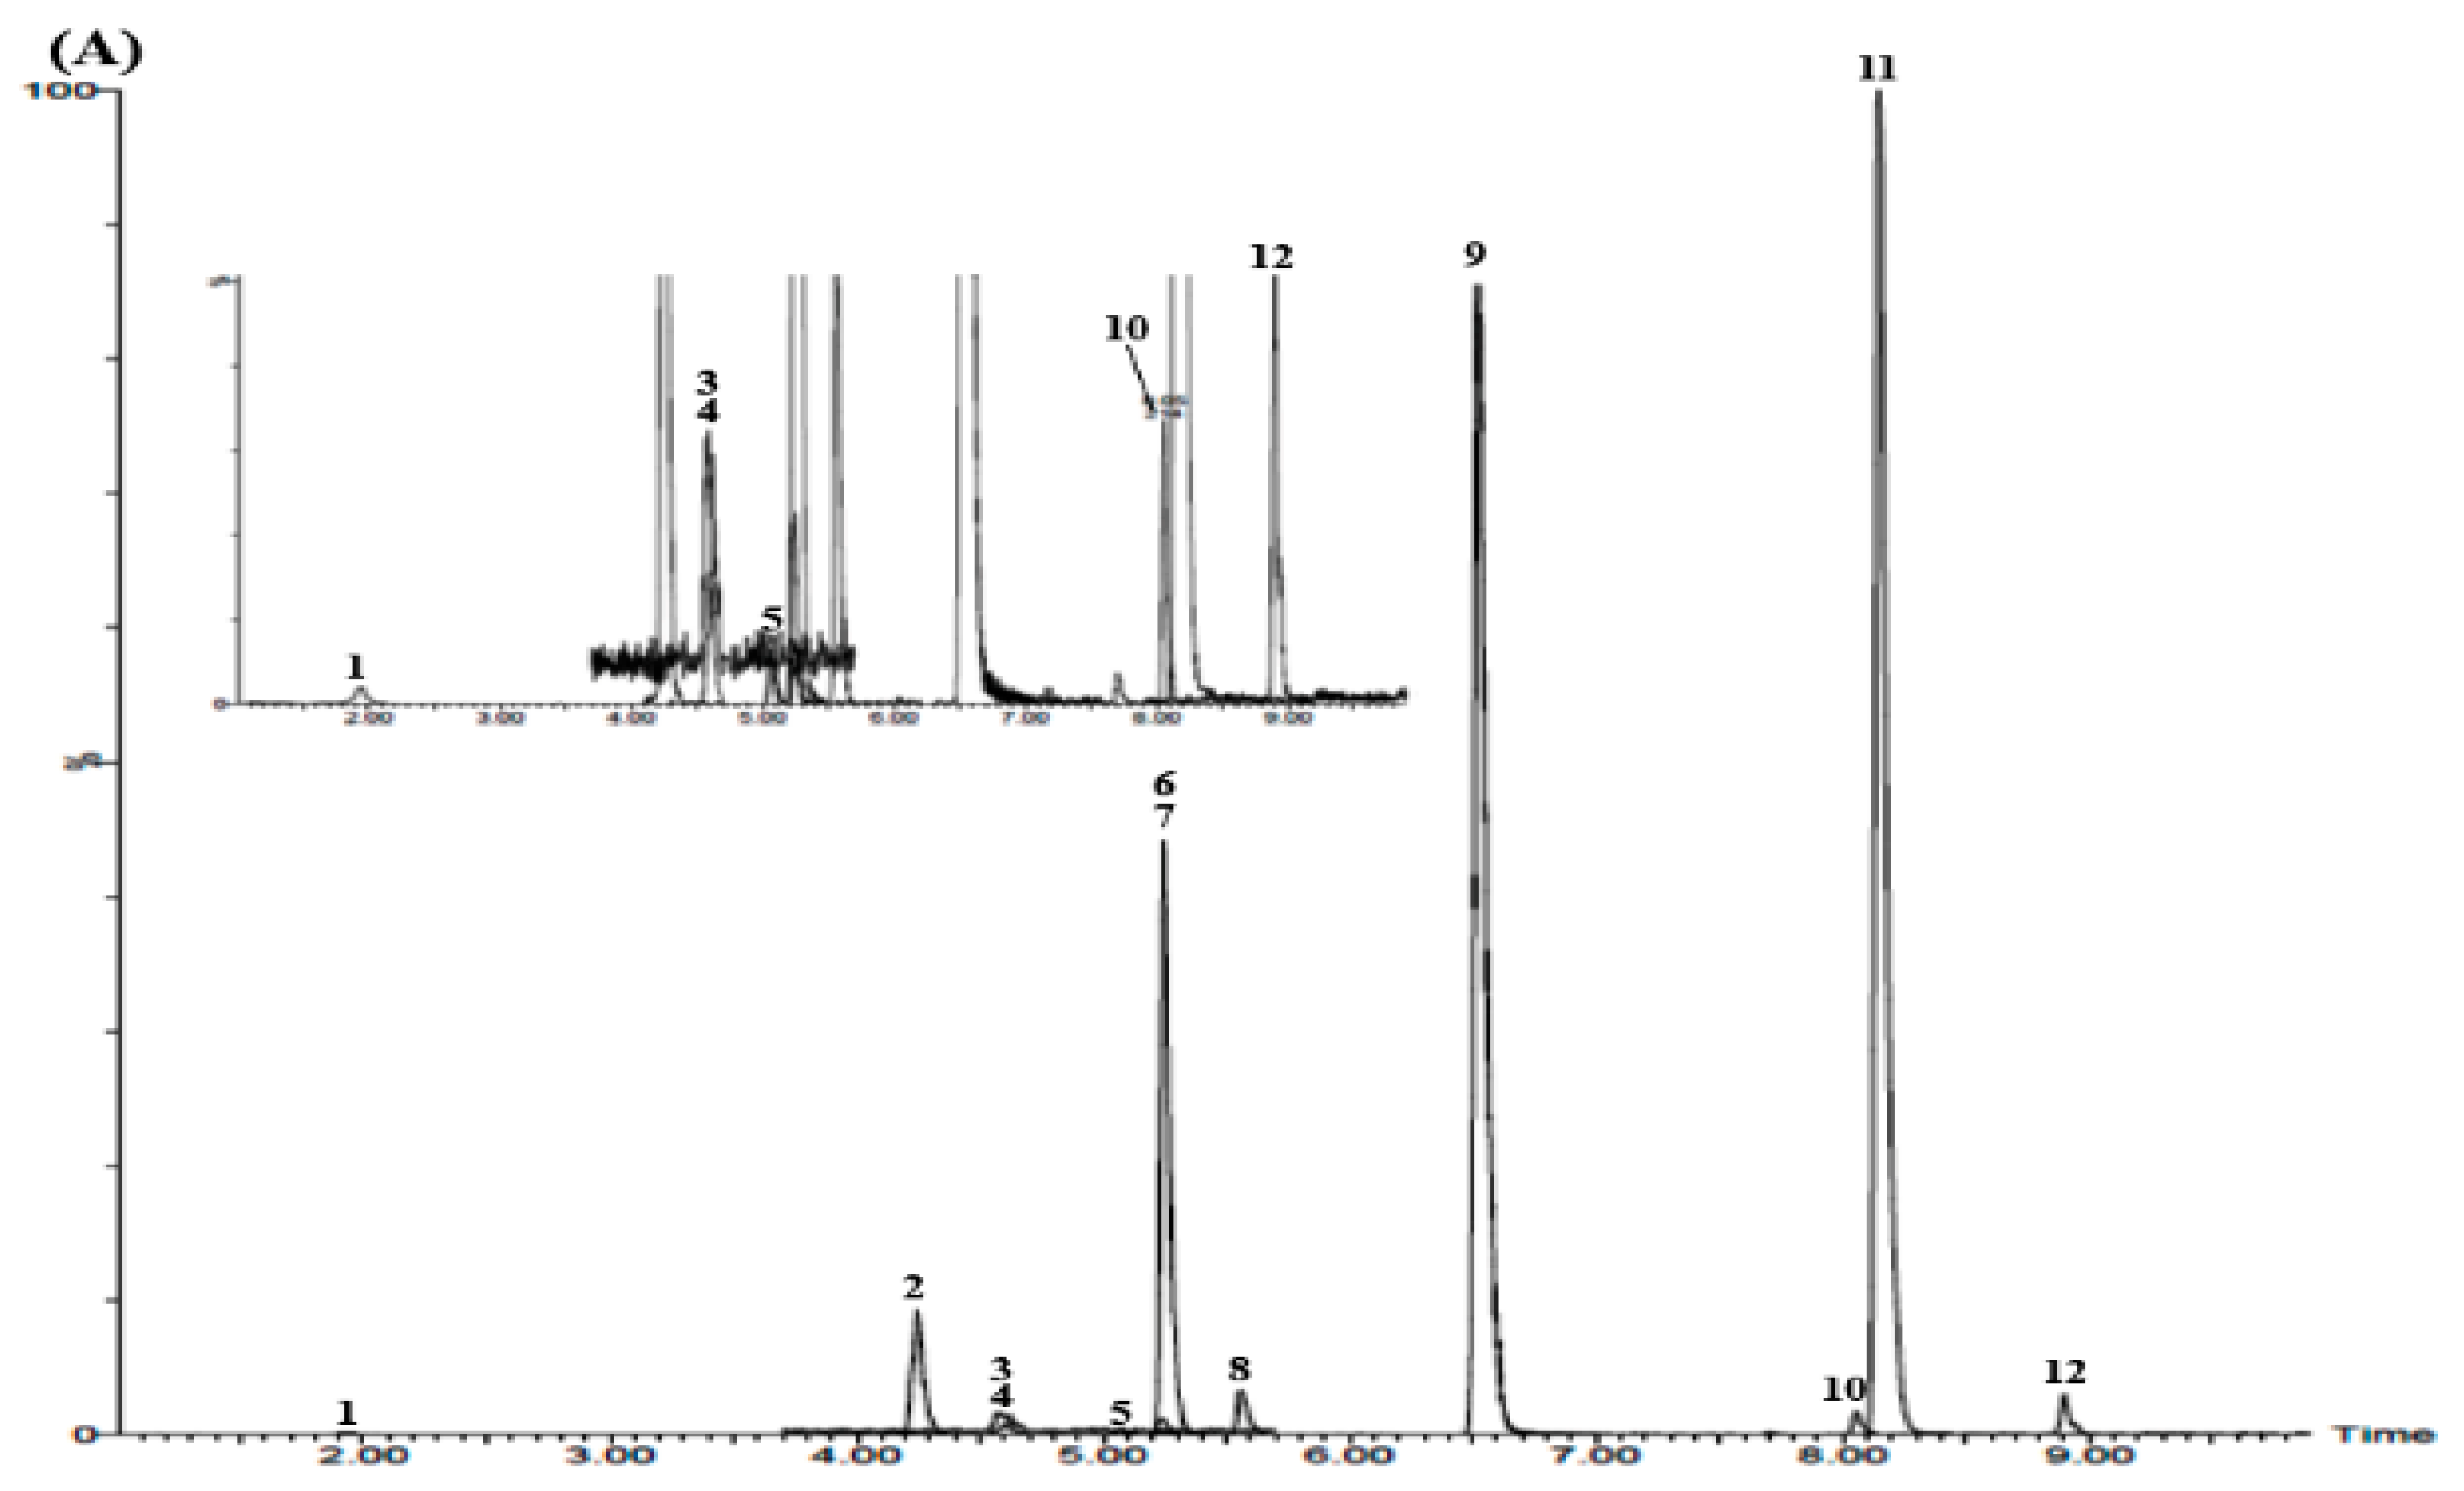
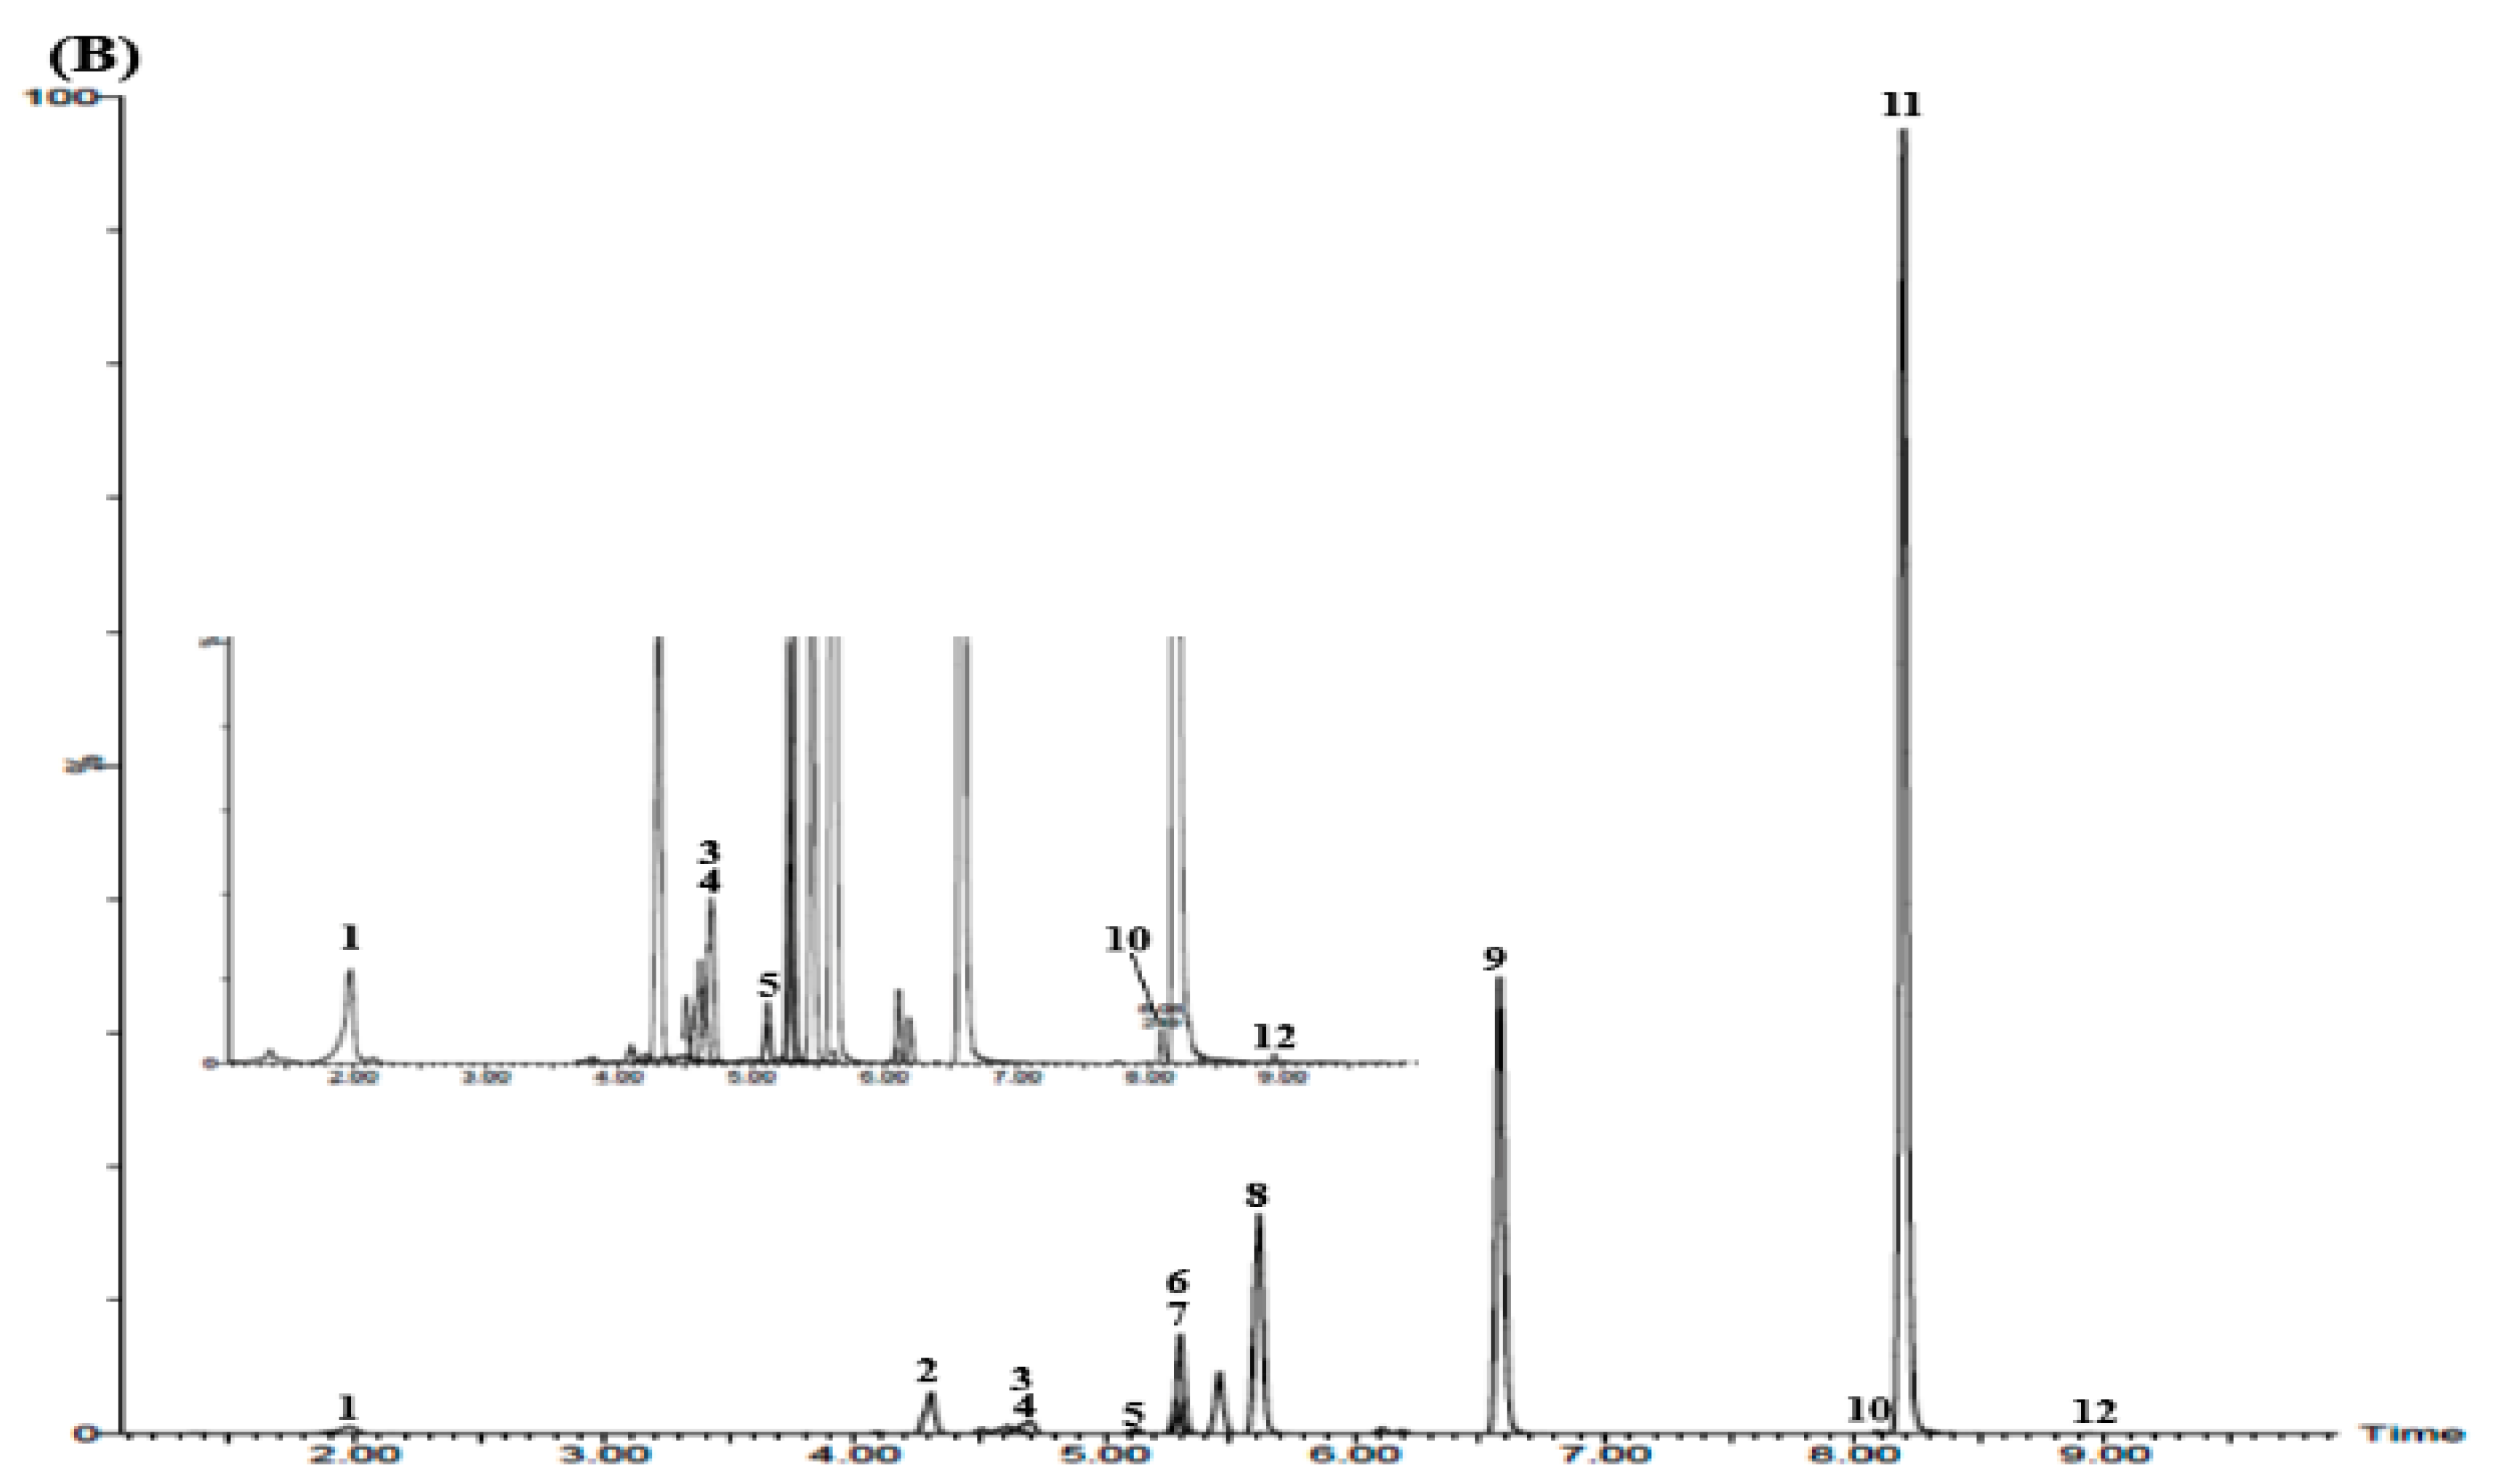
3.3. UPLC–MS/MS Confirmation
3.4. Quantitative Analysis of the 12 Marker Components in YPS Samples Using HPLC–PDA
3.5. Simultaneous Determination of the 12 Marker Components in YPS Sample Using UPLC–MS/MS MRM Mode
4. Conclusions
Supplementary Materials
Author Contributions
Funding
Acknowledgments
Conflicts of Interest
References
- Heo, J. Donguibogam; Namsandang: Seoul, Korea, 2007; p. 540. [Google Scholar]
- Yoon, D.; Hong, S.; Noh, H.; Yi, S.; Lee, I.; Lew, J. Observation of inflammatory marker levels in Sprague-Dawley rats with Youngyopaedoc-san-related anti-antherogenic effect. J. Korean Med. 2013, 34, 86–95. [Google Scholar] [CrossRef]
- Khwag, N.G.; Kang, H.; Myung, E.G.; Park, S.M.; Shim, B.S.; Kim, S.H.; Choi, S.H.; Ahn, K.S. Effect of Yeongyupaedog-san on cytokine levels of mouse Th1/Th2 cells and anti-allergic activity in ovalbumin-sensitized allergic inflammation model. Korean J. Orient. Physiol. Pathol. 2006, 20, 844–852. [Google Scholar]
- Chen, S.; Sun, G.; Yang, L.; Zhang, J. Micellar electrokinetic chromatography fingerprinting combined with chemometrics as an efficient strategy for evaluating the quality consistency and predicting the antioxidant activity of Lianqiao Baidu pills. J. Sep. Sci. 2017, 40, 2838–2848. [Google Scholar] [CrossRef] [PubMed]
- Chen, S.; Sun, G.; Ma, D.; Yang, L.; Zhang, J. Quantitative fingerprinting based on the limited-ratio quantified fingerprint method for an overall quality consistency assesment and antioxidant activity determination of Lianqiao Baidu pills using HPLC with a diode array detector combined with chemometric methods. J. Sep. Sci. 2018, 41, 548–559. [Google Scholar] [PubMed]
- Wu, L.; Yang, G.; Huang, F. Study on quality standard for Lianqiaobaidu pills. Chin. J. Inf. Tradit. Chin. Med. 2014, 21, 95–97. [Google Scholar]
- Kang, H.S.; Lee, J.Y.; Kim, C.J. Anti-inflammatory activity of arctigenin from Forsythiae Fructus. J. Ethnopharmacol. 2008, 116, 305–312. [Google Scholar] [CrossRef]
- Kim, H.Y.; Lim, J.K.; Choi, J.H.; Jung, J.Y.; Oh, W.Y.; Kim, D.C.; Lee, H.S.; Kim, Y.S.; Kang, S.S.; Lee, S.H.; et al. Hepatoprotective effect of pinoresinol on carbon tetrachloride-induced hepatic damage in mice. J. Pharmacol. Sci. 2010, 112, 105–112. [Google Scholar] [CrossRef]
- Kao, S.T.; Liu, C.J.; Yeh, C.C. Protective and immunomodulatory effect of Flos Lonicerae Japonicae by augmenting IL-10 expression in a murine model of acute lung inflammation. J. Ethnopharmacol. 2015, 168, 108–115. [Google Scholar] [CrossRef]
- Chun, M.H.; Kim, E.K.; Lee, K.R.; Jung, J.H.; Hong, J. Quality control of Schizonepeta tenuifolia Briq by solid-phase microextraction gas chromatography/mass spectrometry and principal component analysis. Microchem. J. 2010, 95, 25–31. [Google Scholar] [CrossRef]
- Kim, M.K.; Yang, D.H.; Jung, M.; Jung, E.H.; Eom, H.Y.; Suh, J.H.; Min, J.W.; Kim, U.; Min, H.; Kim, J.; et al. Simultaneous determination of chromones and coumarins in Radix Saposhnikoviae by high performance liquid chromatography with diode array and tandem mass detectors. J. Chromatogr. A 2011, 1218, 6319–6330. [Google Scholar] [CrossRef]
- Lee, K.; Park, G.; Ham, I.; Yang, G.; Lee, M.; Bu, Y.; Cim, H.; Choi, H.Y. Vasorelaxant effect of Osterici Radix ethanol extract on rat aortic rings. Evid.-Based Complement. Alternat. Med. 2013, 2013, 350964. [Google Scholar] [CrossRef] [PubMed]
- Kim, H.S.; Moon, B.C.; Choi, G.; Kim, W.J.; Lee, A.Y. Ultra-performance convergence chromatography for the quantitative determination of bioactive compounds in Aralia continentalis Kitagawa as quality control markers. J. Sep. Sci. 2017, 40, 2071–2079. [Google Scholar] [CrossRef] [PubMed]
- Han, D.S.; Lee, D.K. Separation and determination of saikosaponins in Bupleuri Radix with HPLC. Korean J. Pharmacogn. 1985, 16, 175–179. [Google Scholar]
- Lu, G.H.; Chan, K.; Liang, Y.Z.; Leung, K.; Chan, C.L.; Jiang, Z.H.; Zhao, Z.Z. Development of high-performance liquid chromatographic fingerprints for distinguishing Chinese Angelica from related umbelliferae herbs. J. Chromatogr. A 2005, 1073, 383–392. [Google Scholar] [CrossRef] [PubMed]
- Wang, C.; Pan, Y.; Fan, G.; Chai, Y.; Wu, Y. Application of an efficient strategy based on MAE, HPLC-DAD-MS/MS and HSCCC for the rapid extraction, identification, separation and purification of flavonoids from Fructus Aurantii Immaturus. Biomed. Chromatogr. 2010, 24, 235–244. [Google Scholar] [CrossRef] [PubMed]
- Ha, Y.W.; Kim, Y.S. Preparative isolation of six major saponins from Platycodi Radix by high-speed counter-current chromatography. Phytochem. Anal. 2009, 20, 207–213. [Google Scholar] [CrossRef]
- Li, G.; Xu, M.L.; Lee, C.S.; Woo, M.H.; Chang, H.W.; Son, J.K. Cytotoxicity and DNA topoisomerases inhibitory activity of constituents from the sclerotium of Poria cocos. Arch. Pharm. Res. 2004, 27, 829–833. [Google Scholar] [CrossRef]
- Wu, Y.P.; Meng, X.S.; Bao, Y.R.; Wang, S.; Kang, T.G. Simultaneous quantitative determination of nine active chemical compositions in traditional Chinese medicine Glycyrrhiza by RP-HPLC with full-time five-wavelength fusion method. Am. J. Chin. Med. 2013, 41, 211–219. [Google Scholar] [CrossRef]
- Cho, H.; Sowndhararajan, K.; Jung, J.W.; Jhoo, J.W.; Kim, S. Fragrance chemicals in the essential oil of Mentha arvensis reduce levels of mental stress. J. Life Sci. 2013, 7, 933–940. [Google Scholar] [CrossRef]
- Wang, W.; Li, C.Y.; Wen, X.D.; Li, P.; Qi, L.W. Simultaneous determination of 6-gingerol, 8-gingerol, 10, gingerol and 6-shogaol in rat plasma by liquid chromatography-mass spectrometry: Application to pharmacokinetics. J. Chromtogr. B 2009, 877, 671–679. [Google Scholar] [CrossRef]
- Lee, K.H. The Dispensatory on the Visual and Organoleptic Examination of Herbal Medicine; National Institute of Food and Drug Safety Evaluation: Seoul, Korea, 2013; pp. 24–706.
- Seo, C.S.; Yoo, S.R.; Jeong, S.J.; Ha, H. Quantification of the constituents of the traditional Korea medicine, Samryeongbaekchul-san, and assessment of its antiadipogenic effect. Saudi Pharm. J. 2019, 27, 145–153. [Google Scholar] [CrossRef] [PubMed]
- Jung, M.Y.; Seo, C.S.; Baek, S.E.; Lee, J.; Shin, M.S.; Kang, K.S.; Lee, S.; Yoo, J.E. Analysis and identification of active compounds from Gami-Soyosan toxic to MCF-7 human breast adenocarcinoma cells. Biomolecules 2019, 9, 272. [Google Scholar] [CrossRef] [PubMed]
- International Conference on Harmonisation (ICH). Q2B, Validation of Analytical Procedures: Methodology; European Medicines Agency: Amsterdam, The Netherlands, November 1996.
- U.S. Food and Drug Administration. Reviewer Guidance, Validation of Chromatographic Methods; Center for Drug Evaluation and Research: Rockville, MD, USA, November 1994.
- Jaiswal, R.; Muller, H.; Muller, A.; Karar, M.G.E.; Kuhnert, N. Identification and characterization of chlorogenic acid, chlorogenic acid glycosides and flavonoids from Lonicera henryi L. (Caprifoliaceae) leaves by LC-MSn. Phytochemistry 2014, 108, 252–263. [Google Scholar] [PubMed]
- Gui, Y.; Tsao, R.; Li, L.; Liu, C.M.; Wang, J.; Zong, X. Preparative separation of chromones in plant extract of Saposhnikovia divaricata by high-performance counter-current chromatography. J. Sep. Sci. 2011, 34, 520–526. [Google Scholar] [CrossRef]
- Zhang, Z.; Li, Q.; Li, Q.; Du, S.; Zhou, Y.; Lv, C.; Zhao, Y.; Wang, Y.; Zhang, N. Simultaneous determination of nineteen major components in Qi She Pill by ultra-high-performance liquid chromatography-tandem mass spectrometry. Acta Pharm. Sin. B 2014, 4, 384–393. [Google Scholar] [CrossRef]
- Wang, X.; Ma, X.; Li, W.; Chu, Y.; Guo, J.; Li, S.; Wang, J.; Zhang, H.; Zhou, S.; Zhu, Y. Simultaneous determination of five phenolic components and paeoniflorin in rat plasma by liquid chromatography-tandem mass spectrometry and pharmacokinetic study after oral administration of Cerebralcare granule®. J. Pharm. Biomed. Anal. 2013, 86, 82–91. [Google Scholar] [CrossRef]
- Tan, G.; Zhu, Z.; Jing, J.; Lv, L.; Lou, Z.; Zhang, G.; Chai, Y. Characterization of constituents in Sini decoction and rat plasma by high-performance liquid chromatography with diode array detection coupled to time-of-flight mass spectrometry. Biomed. Chromatogr. 2005, 25, 913–924. [Google Scholar] [CrossRef]
- Li, L.; Liang, S.; Du, F.; Li, C. Simultaneous quantification of multiple licorice flavonoids in rat plasma. J. Am. Soc. Mass Spectrom. 2007, 18, 778–782. [Google Scholar] [CrossRef]
- Fu, C.; Xia, Z.; Liu, Y.; Lu, H.; Zhang, Z.; Wang, Y.; Fan, X. Qualitative analysis of major constituents from Xue Fu Zhu Yu Decoction using ultra high performance liquid chromatography with hybrid ion trap time-of-flight mass spectrometry. J. Sep. Sci. 2016, 39, 3457–3468. [Google Scholar] [CrossRef]
- Xiong, X.; Jiang, J.; Duan, J.; Xie, Y.; Wang, J.; Zhai, S. Development and validation of a sensitive liquid chromatography-tandem mass spectrometry method for the determination of naringin and its metabolite, naringenin in human plasma. J. Chromatogr. Sci. 2004, 52, 654–660. [Google Scholar] [CrossRef]
- Zheng, G.D.; Zhou, P.; Yang, H.; Li, Y.; Li, P.; Liu, E.H. Rapid resolution liquid chromatography-electrospray ionization tandem mass spectrometry method for identification of chemical constituents in Cirti Reticulatae Pericarpium. Anal. Methods 2013, 136, 604–611. [Google Scholar]
- Tang, D.Q.; Zheng, X.X.; Chen, X.; Yang, D.Z.; Du, Q. Quantitative and qualitative analysis of common peaks in chemical fingerprint of Yuanhu Zhitong tablet by HPLC-DAD-MS/MS. J. Pharm. Anal. 2014, 4, 96–106. [Google Scholar] [CrossRef] [PubMed]
- Wang, X.; Liang, J.; Wen, H.; Shan, C.; Liu, R. Simultaneous determination of five bioactive secolignans in rat plasma by LC-MS/MS for pharmacokinetic studies following oral administration of Peperomia dindygulensis Miq. extract. J. Chromatogr. B 2014, 944, 82–89. [Google Scholar] [CrossRef] [PubMed]
- He, Q.; Ge, Z.W.; Song, Y.; Cheng, Y.Y. Quality evaluation of Cortex Moutan by high performance liquid chromatography coupled with diode array detector and electrospray ionization tandem mass spectrometry. Chem. Pharm. Bull. 2006, 54, 1271–1275. [Google Scholar] [CrossRef] [PubMed]


| Compound | Linear Range (μg/mL) | Regression Equation a | r2 | LOD (μg/mL) | LOQ (μg/mL) |
|---|---|---|---|---|---|
| 3-CQA | 1.56–100.00 | y = 3.168268 × 10⁴x − 2.279203 × 10⁴ | 0.9986 | 0.19 | 0.57 |
| CFG | 0.78–50.00 | y = 1.589998 × 10⁴x − 3.69893 × 10⁴ | 0.9993 | 0.13 | 0.41 |
| LIQA | 1.56–100.00 | y = 1.435196 × 10⁴x − 6.7471 × 10³ | 0.9991 | 0.16 | 0.49 |
| FA | 0.78–50.00 | y = 7.557159 × 10⁴x − 1766964 × 104 | 0.9991 | 0.09 | 0.26 |
| NAR | 0.78–50.00 | y = 1.698577 × 10⁴x − 4.07642 × 10³ | 0.9990 | 0.05 | 0.16 |
| 5-MVS | 0.78–50.00 | y = 1.850794 × 10⁴x − 4.67958 × 10³ | 0.9990 | 0.11 | 0.32 |
| NAG | 2.34–150.00 | y = 1.779584 × 10⁴x − 1.182341 × 10⁴ | 0.9991 | 0.09 | 0.27 |
| NHES | 1.56–100.00 | y = 2.215239 × 10⁴x − 1.007198 × 10⁴ | 0.9991 | 0.10 | 0.31 |
| OPDH | 0.78–50.00 | y = 2.949819 × 10⁴x − 6.27553 × 10³ | 0.9994 | 0.15 | 0.47 |
| ARC | 0.78–50.00 | y = 1.019838 × 10⁴x − 2.73577 × 10³ | 0.9989 | 0.16 | 0.49 |
| GA | 1.56–100.00 | y = 8.69885 × 10³x − 3.5352 × 10² | 0.9993 | 0.20 | 0.60 |
| 6-GIN | 0.78–50.00 | y = 8.57485 × 10³x − 2.32865 × 10³ | 0.9990 | 0.06 | 0.18 |
| Compound | Original Amount (μg/mL) | Spiked Amount (μg/mL) | Found Amount (μg/mL) | Recovery (%) | SD | RSD (%) |
|---|---|---|---|---|---|---|
| 3-CQA | 44.98 | 8.00 | 52.65 | 95.87 | 1.44 | 1.51 |
| 20.00 | 64.02 | 95.16 | 2.85 | 2.99 | ||
| 40.00 | 82.68 | 94.24 | 0.56 | 0.60 | ||
| CFG | 5.55 | 1.00 | 6.50 | 95.28 | 2.35 | 2.47 |
| 2.00 | 7.52 | 98.62 | 2.00 | 2.02 | ||
| 4.00 | 9.49 | 98.61 | 1.37 | 1.39 | ||
| LIQA | 30.28 | 6.00 | 36.05 | 96.14 | 1.59 | 1.65 |
| 15.00 | 44.73 | 96.33 | 1.61 | 1.67 | ||
| 30.00 | 59.70 | 98.05 | 0.91 | 0.93 | ||
| FA | 3.38 | 1.00 | 4.36 | 98.22 | 1.77 | 1.80 |
| 2.00 | 5.28 | 94.85 | 0.68 | 0.72 | ||
| 4.00 | 7.29 | 97.85 | 1.43 | 1.47 | ||
| NAR | 11.81 | 2.00 | 13.83 | 101.22 | 1.35 | 1.34 |
| 5.00 | 16.81 | 100.14 | 1.87 | 1.87 | ||
| 10.00 | 21.85 | 100.41 | 0.60 | 0.60 | ||
| 5-MVS | 6.01 | 1.00 | 6.98 | 97.34 | 2.38 | 2.45 |
| 2.00 | 7.96 | 97.66 | 1.63 | 1.67 | ||
| 4.00 | 9.83 | 95.58 | 2.53 | 2.65 | ||
| NAG | 44.07 | 8.00 | 52.09 | 100.32 | 2.90 | 2.89 |
| 20.00 | 63.74 | 98.39 | 0.95 | 0.97 | ||
| 40.00 | 84.25 | 100.46 | 1.26 | 1.25 | ||
| NHES | 31.45 | 6.00 | 37.06 | 93.48 | 1.33 | 1.42 |
| 15.00 | 45.51 | 93.71 | 0.33 | 0.35 | ||
| 30.00 | 59.14 | 92.30 | 0.97 | 1.05 | ||
| OPDH | 6.35 | 1.00 | 7.31 | 96.39 | 1.42 | 1.47 |
| 2.00 | 8.26 | 95.73 | 1.29 | 1.34 | ||
| 4.00 | 10.26 | 97.69 | 0.36 | 0.37 | ||
| ARC | 9.17 | 2.00 | 11.16 | 99.56 | 2.80 | 2.81 |
| 5.00 | 14.08 | 98.38 | 1.44 | 1.46 | ||
| 10.00 | 18.80 | 96.38 | 1.04 | 1.08 | ||
| GA | 29.28 | 6.00 | 34.91 | 93.76 | 1.11 | 1.19 |
| 15.00 | 43.30 | 93.41 | 1.05 | 1.13 | ||
| 30.00 | 56.99 | 92.36 | 0.67 | 0.72 | ||
| 6-GIN | 1.14 | 1.00 | 2.15 | 101.30 | 1.31 | 1.29 |
| 2.00 | 3.12 | 99.26 | 2.44 | 2.45 | ||
| 4.00 | 5.11 | 99.29 | 2.49 | 2.51 |
| Compound | Conc. (μg/mL) | Intra-Day (n = 5) | Inter-Day (n = 5) | Repeatability (n = 6) | |||||
|---|---|---|---|---|---|---|---|---|---|
| Observed Conc. (μg/mL) | Precision (%) a | Accuracy (%) | Observed Conc. (μg/mL) | Precision (%) | Accuracy (%) | RSD (%) of Retention Time | RSD (%) of Peak Area | ||
| 3-CQA | 25.00 | 24.68 | 1.03 | 98.73 | 24.95 | 0.98 | 99.79 | 0.23 | 0.35 |
| 50.00 | 49.95 | 0.60 | 99.90 | 50.23 | 1.74 | 100.46 | |||
| 100.00 | 99.00 | 1.04 | 99.00 | 98.21 | 1.05 | 98.21 | |||
| CFG | 12.50 | 12.23 | 1.19 | 97.83 | 12.14 | 1.53 | 97.12 | 0.06 | 0.33 |
| 25.00 | 25.16 | 1.50 | 100.62 | 24.70 | 2.72 | 98.81 | |||
| 50.00 | 49.04 | 1.48 | 98.08 | 47.92 | 2.41 | 95.85 | |||
| LIQA | 25.00 | 25.16 | 1.48 | 100.65 | 25.66 | 2.30 | 102.64 | 0.06 | 0.33 |
| 50.00 | 49.97 | 1.58 | 99.94 | 50.88 | 2.06 | 101.75 | |||
| 100.00 | 97.95 | 1.20 | 97.95 | 98.67 | 1.44 | 98.67 | |||
| FA | 12.50 | 12.46 | 2.52 | 99.71 | 12.25 | 2.28 | 97.99 | 0.06 | 0.36 |
| 25.00 | 24.84 | 0.50 | 99.35 | 24.51 | 2.46 | 98.02 | |||
| 50.00 | 48.86 | 1.30 | 97.71 | 47.89 | 2.36 | 95.78 | |||
| NAR | 12.50 | 12.24 | 1.28 | 97.95 | 12.25 | 2.60 | 98.00 | 0.04 | 0.34 |
| 25.00 | 24.76 | 0.44 | 99.03 | 24.48 | 2.61 | 97.91 | |||
| 50.00 | 48.73 | 1.39 | 97.45 | 47.62 | 2.36 | 95.24 | |||
| 5-MVS | 12.50 | 12.29 | 1.31 | 98.28 | 12.22 | 1.74 | 97.76 | 0.08 | 0.33 |
| 25.00 | 24.77 | 0.49 | 99.10 | 24.49 | 2.57 | 97.96 | |||
| 50.00 | 48.69 | 1.35 | 97.38 | 47.72 | 2.32 | 95.43 | |||
| NAG | 37.50 | 36.84 | 1.31 | 98.23 | 36.56 | 1.45 | 97.50 | 0.08 | 0.35 |
| 75.00 | 74.60 | 0.60 | 99.47 | 73.66 | 2.64 | 98.22 | |||
| 150.00 | 146.12 | 1.45 | 97.41 | 144.12 | 2.93 | 96.08 | |||
| NHES | 25.00 | 24.59 | 1.22 | 98.36 | 24.38 | 1.47 | 97.52 | 0.06 | 0.35 |
| 50.00 | 49.69 | 0.48 | 99.39 | 49.27 | 2.65 | 98.54 | |||
| 100.00 | 99.25 | 4.79 | 99.25 | 96.49 | 4.16 | 96.49 | |||
| OPDH | 12.50 | 12.26 | 1.39 | 98.04 | 12.18 | 2.00 | 97.48 | 0.05 | 0.35 |
| 25.00 | 24.75 | 0.51 | 99.02 | 24.48 | 2.60 | 97.94 | |||
| 50.00 | 48.64 | 1.39 | 97.27 | 47.47 | 2.39 | 94.94 | |||
| ARC | 12.50 | 12.26 | 1.37 | 98.06 | 12.15 | 1.56 | 97.23 | 0.13 | 0.47 |
| 25.00 | 24.71 | 0.43 | 98.83 | 24.40 | 2.61 | 97.59 | |||
| 50.00 | 48.55 | 1.35 | 97.10 | 47.46 | 2.33 | 94.91 | |||
| GA | 25.00 | 24.32 | 1.43 | 97.30 | 24.12 | 1.52 | 96.49 | 0.10 | 0.33 |
| 50.00 | 49.64 | 0.58 | 99.28 | 49.03 | 2.70 | 98.05 | |||
| 100.00 | 97.98 | 1.41 | 97.98 | 95.86 | 2.34 | 95.86 | |||
| 6-GIN | 12.50 | 11.85 | 1.42 | 94.81 | 11.74 | 1.51 | 93.90 | 0.07 | 0.07 |
| 25.00 | 24.14 | 0.38 | 96.57 | 23.79 | 2.16 | 95.16 | |||
| 50.00 | 47.81 | 1.36 | 95.62 | 46.71 | 2.39 | 93.42 | |||
| Compound | Batch No. | |||||
|---|---|---|---|---|---|---|
| 1 | 2 | 3 | ||||
| Mean (mg/g) ± SD (× 10–1) | RSD (%) | Mean (mg/g) ± SD (× 10–1) | RSD (%) | Mean (mg/g) ± SD (× 10–1) | RSD (%) | |
| 3-CQA | 4.28 ± 0.66 | 1.53 | 4.22 ± 0.56 | 1.32 | 4.15 ± 0.83 | 1.99 |
| CFG | 0.62 ± 0.05 | 0.80 | 0.61 ± 0.07 | 1.19 | 0.60 ± 0.12 | 2.03 |
| LIQA | 3.05 ± 0.26 | 0.84 | 2.90 ± 0.65 | 2.24 | 2.96 ± 0.39 | 1.31 |
| FA | 0.32 ± 0.04 | 1.23 | 0.30 ± 0.07 | 2.27 | 0.30 ± 0.08 | 2.74 |
| NAR | 1.30 ± 0.15 | 1.19 | 1.27 ± 0.25 | 1.93 | 1.24 ± 0.24 | 1.95 |
| 5-MVS | 0.59 ± 0.03 | 0.49 | 0.58 ± 0.10 | 1.71 | 0.50 ± 0.15 | 2.97 |
| NAG | 9.00 ± 0.74 | 0.82 | 8.93 ± 0.07 | 0.08 | 8.84 ± 0.65 | 0.74 |
| NHES | 6.48 ± 0.42 | 0.65 | 6.39 ± 0.59 | 0.92 | 6.28 ± 0.94 | 1.50 |
| OPDH | 0.69 ± 0.05 | 0.78 | 0.67 ± 0.10 | 1.53 | 0.64 ± 0.17 | 2.64 |
| ARC | 0.94 ± 0.09 | 0.96 | 0.92 ± 0.03 | 0.31 | 0.92 ± 0.12 | 1.28 |
| GA | 6.02 ± 0.51 | 0.85 | 5.95 ± 0.37 | 0.61 | 5.85 ± 0.95 | 1.62 |
| 6-GIN | 0.15 ± 0.02 | 1.19 | 0.15 ± 0.04 | 2.65 | 0.14 ± 0.02 | 1.16 |
| Compound | Amount (μg/g) | ||
|---|---|---|---|
| Mean | SD | RSD (%) | |
| 3-CQA | 466.95 | 14.45 | 3.10 |
| CFG | 35.70 | 0.49 | 1.37 |
| FA | 26.91 | 0.78 | 2.89 |
| LIQA | 310.68 | 6.89 | 2.22 |
| NAR | 137.57 | 2.13 | 1.55 |
| 5-MVS | 19.29 | 0.27 | 1.42 |
| NAG | 756.78 | 16.17 | 2.14 |
| NHES | 721.47 | 14.93 | 2.07 |
| OPDH | 56.13 | 1.48 | 2.64 |
| GA | 853.11 | 60.47 | 7.09 |
| ARC | 107.85 | 1.52 | 1.41 |
| 6-GIN | 2.35 | 0.21 | 9.03 |
© 2020 by the authors. Licensee MDPI, Basel, Switzerland. This article is an open access article distributed under the terms and conditions of the Creative Commons Attribution (CC BY) license (http://creativecommons.org/licenses/by/4.0/).
Share and Cite
Seo, C.-S.; Shin, H.-K. Simultaneous Determination of 12 Marker Components in Yeonkyopaedok-san Using HPLC–PDA and LC–MS/MS. Appl. Sci. 2020, 10, 1713. https://doi.org/10.3390/app10051713
Seo C-S, Shin H-K. Simultaneous Determination of 12 Marker Components in Yeonkyopaedok-san Using HPLC–PDA and LC–MS/MS. Applied Sciences. 2020; 10(5):1713. https://doi.org/10.3390/app10051713
Chicago/Turabian StyleSeo, Chang-Seob, and Hyeun-Kyoo Shin. 2020. "Simultaneous Determination of 12 Marker Components in Yeonkyopaedok-san Using HPLC–PDA and LC–MS/MS" Applied Sciences 10, no. 5: 1713. https://doi.org/10.3390/app10051713
APA StyleSeo, C.-S., & Shin, H.-K. (2020). Simultaneous Determination of 12 Marker Components in Yeonkyopaedok-san Using HPLC–PDA and LC–MS/MS. Applied Sciences, 10(5), 1713. https://doi.org/10.3390/app10051713