Article

Application of Computational Fluid Dynamics Analysis after Bimaxillary Orthognathic Surgery

1
Department of Oral and Maxillofacial Surgery, School of Dentistry, Pusan National University, Yangsan 50612, Korea
2
Biomedical Research Institute, Pusan National University Hospital, Busan 49241, Korea
3
Dental and Life Science Institute, School of Dentistry, Pusan National University, Yangsan 50612, Korea
4
School of Mechanical Engineering, Pusan National University, Busan 46241, Korea
5
Dental Research Institute, Pusan National University Dental Hospital, Yangsan 50612, Korea
*
Authors to whom correspondence should be addressed.
Appl. Sci. 2020, 10(5), 1676; https://doi.org/10.3390/app10051676
Submission received: 28 January 2020 / Revised: 9 February 2020 / Accepted: 11 February 2020 / Published: 2 March 2020
(This article belongs to the Special Issue Application of CAD/CAM and 3D Printing Technologies in Dentistry)

Abstract

:
Bimaxillary orthognathic surgery is widely used to treat skeletal class III malocclusion. Changes in jaw position affect the shape of surrounding soft tissues. We used computational fluid dynamics (CFD) simulation to observe changes in airways observed in a patient who underwent bimaxillary orthognathic surgery. For CFD simulation, we performed cone beam computed tomography (CBCT) preoperatively (T0), 3 days postoperatively (T1), and 7 months postoperatively (T2). The values of velocity, pressure drop (ΔP), and wall shear stress all increased 7 months after surgery (Vmax 7.038 m/s to 12.054 m/s, ΔP −7.723 Pa to −53.739 Pa, WSSmax 4.214 Pa to 14.323 Pa). Locations where the velocity and pressure gradients are large included the velopharynx, oropharynx, and epiglottis, with narrow cross-sectional areas. Wall shear stress was also observed at these locations. The velopharynx, oropharynx, and epiglottis are structures most vulnerable to morphological changes, that is, they can easily become obstructed.

1. Introduction

Orthognathic surgery is widely used to improve skeletal facial asymmetry and malocclusion [1]. In Asians, who tend to exhibit a higher proportion of skeletal class III malocclusion, amelioration of mandibular protrusion has significant esthetic and functional effects [2]. Mandibular setback or bimaxillary orthognathic surgery are used to resolve mandibular prognathism. Bimaxillary orthognathic surgery is more likely to be performed because upper and lower jaw complexes are more esthetically effective than mandibular setback alone.
Movement of the jaw also affects the shape of the soft tissue attached to it [3]. The most influential structures in this regard include the tongue base and hyoid bone. Changes in the position of these structures affect the shape of the airway [4], and the changes in airway can cause oxydative stress. Oxydative stress can cause the sensation of chronic pain [5]. Moreover, postoperative reduction of the airway in skeletal class III patients may cause obstructive sleep apnea (OSA). Many studies investigating postoperative airway changes have involved patients undergoing orthognathic surgery. Fengshan C. et al. compared the effects of mandibular setback and bimaxillary surgery on the airway and found that mandibular setback surgery caused long-term changes in the airway. However, bimaxillary surgery was confirmed to not cause significant changes [6]. Most of these studies focused mainly on measuring volume changes after two-dimensional or three-dimensional (3D) reconstruction of airway changes in the sagittal plane [7]. It is known that the computational fluid dynamics (CFD) model applied to the upper airway is advantageous in capturing the characteristics of airflow [8]. Using this simulation model, we can observe how changes in air flow characteristics affect the soft tissue structures of the airway [9]. For this reason, CFD is an effective tool for identifying changes in airflow characteristics and the resulting airway changes that occur after bimaxillary setback surgery. Given the increase in the incidence and prevalence of OSA, attempts have been made to evaluate functional changes after airway changes. Sittivornwong S. et al., observed airway changes using CFD after maxillomandibular assessment (MMA) in OSA patients. As a result, it was found that the laminar and turbulent air flows were reduced at all locations in the airway [10]. Shah et al., used CFD methods to analyze airway changes observed after mandibular setback surgery in class III patients [11]. However, the study by Shah et al. only confirmed changes in a single jawbone (i.e., the mandible). As described above, the movement of the upper and lower jaw complex may occur in more directions than simply up, down, left, and right. Accordingly, airway changes can also assume many forms. The purpose of this study, therefore, was to use CFD simulation to analyze changes in the airway observed in a patient who underwent bimaxillary orthognathic surgery.

2. Materials and Methods

2.1. Patient Selection

This study was conducted on one patient. The patient underwent Le Fort I osteotomy and bilateral sagittal split osteotomy at Pusan National University Hospital (Busan, South Korea) on 26 February 2018. Lateral cephalography was used to measure the amount of movement in the upper and lower jaw. The amount of movement of the maxilla was 4.13 mm forward and 3.27 mm upwards at the point of bilateral mesiobuccal cusp of maxillary first molar. The amount of movement in the mandible measured from the pogonion was 5.53 mm backward and 8.36 mm upward. Cone beam computed tomography (CBCT) (KODAK 9500, Eastman Kodak Company in Rochester, NY, USA) was performed preoperatively (T0), 3 days postoperatively (T1), and 7 months postoperatively (T2). Ethical permission for this study was granted by the Institutional Review Board (IRB) of Pusan National University Hospital (H-1906-003-079) and follows the rule of the Declaration of Helsinki.

2.2. Airway Modeling

The three-dimensional reconstruction of the airway was based on CT images acquired from a representative patient. The detailed process of 3D reconstruction from two-dimensional CT images is shown in Figure 1. The complex shape of the airway in CT images with the sectional floor view was designed using SolidWorks software (Dassault Systèmes SolidWorks Corp., Waltham, MA, USA). Boundaries of the airway, manually segmented in sectional floor views (13 planes), were three-dimensionally aligned from a sectional side view following a guideline. 3D reconstruction of the airway connecting the boundaries in sectional floor views following the guideline in a sectional side view was performed using the lofted boss/base process in SolidWorks software. To compare each case, the lengths of the airway were matched to 62 mm.

2.3. Numerical Simulations

The numerical simulations for air flow in the upper airway were determined using Fluent 2019 R2 software (ANSYS, Inc., Canonsburg, PA, USA) based on a turbulence model with the k-ω model because this model can reasonably simulate turbulent airflow and near-wall physics in the upper airways [12,13]. The conservation equations for the steady state were solved to ensure the coupling of velocity and pressure. In this analysis, a no-slip condition was applied to the wall of the airways. The convergence criteria for momentum and the continuity equations were 10−5. An open condition with a relative pressure of 0 Pa was applied to the inlet. A constant volume flow rate of 1090 mL/s was applied to the outlet condition of the simulation. After verification using a preliminary grid dependency test, approximately 60,000,000 nodes were used.

3. Results

3.1. Volumetric Analysis

Total airway volumes were measured at T0, T1, and T2. The measurement area is a reconstructed area and no measurement was made according to the airway level. The measurements are summarized in Table 1. A comparison between T0 and T2 revealed that the total volume decreased by 6206.44 mm3. This corresponds to 29.41% of the volume at T0.

3.2. Airflow Stream Analysis

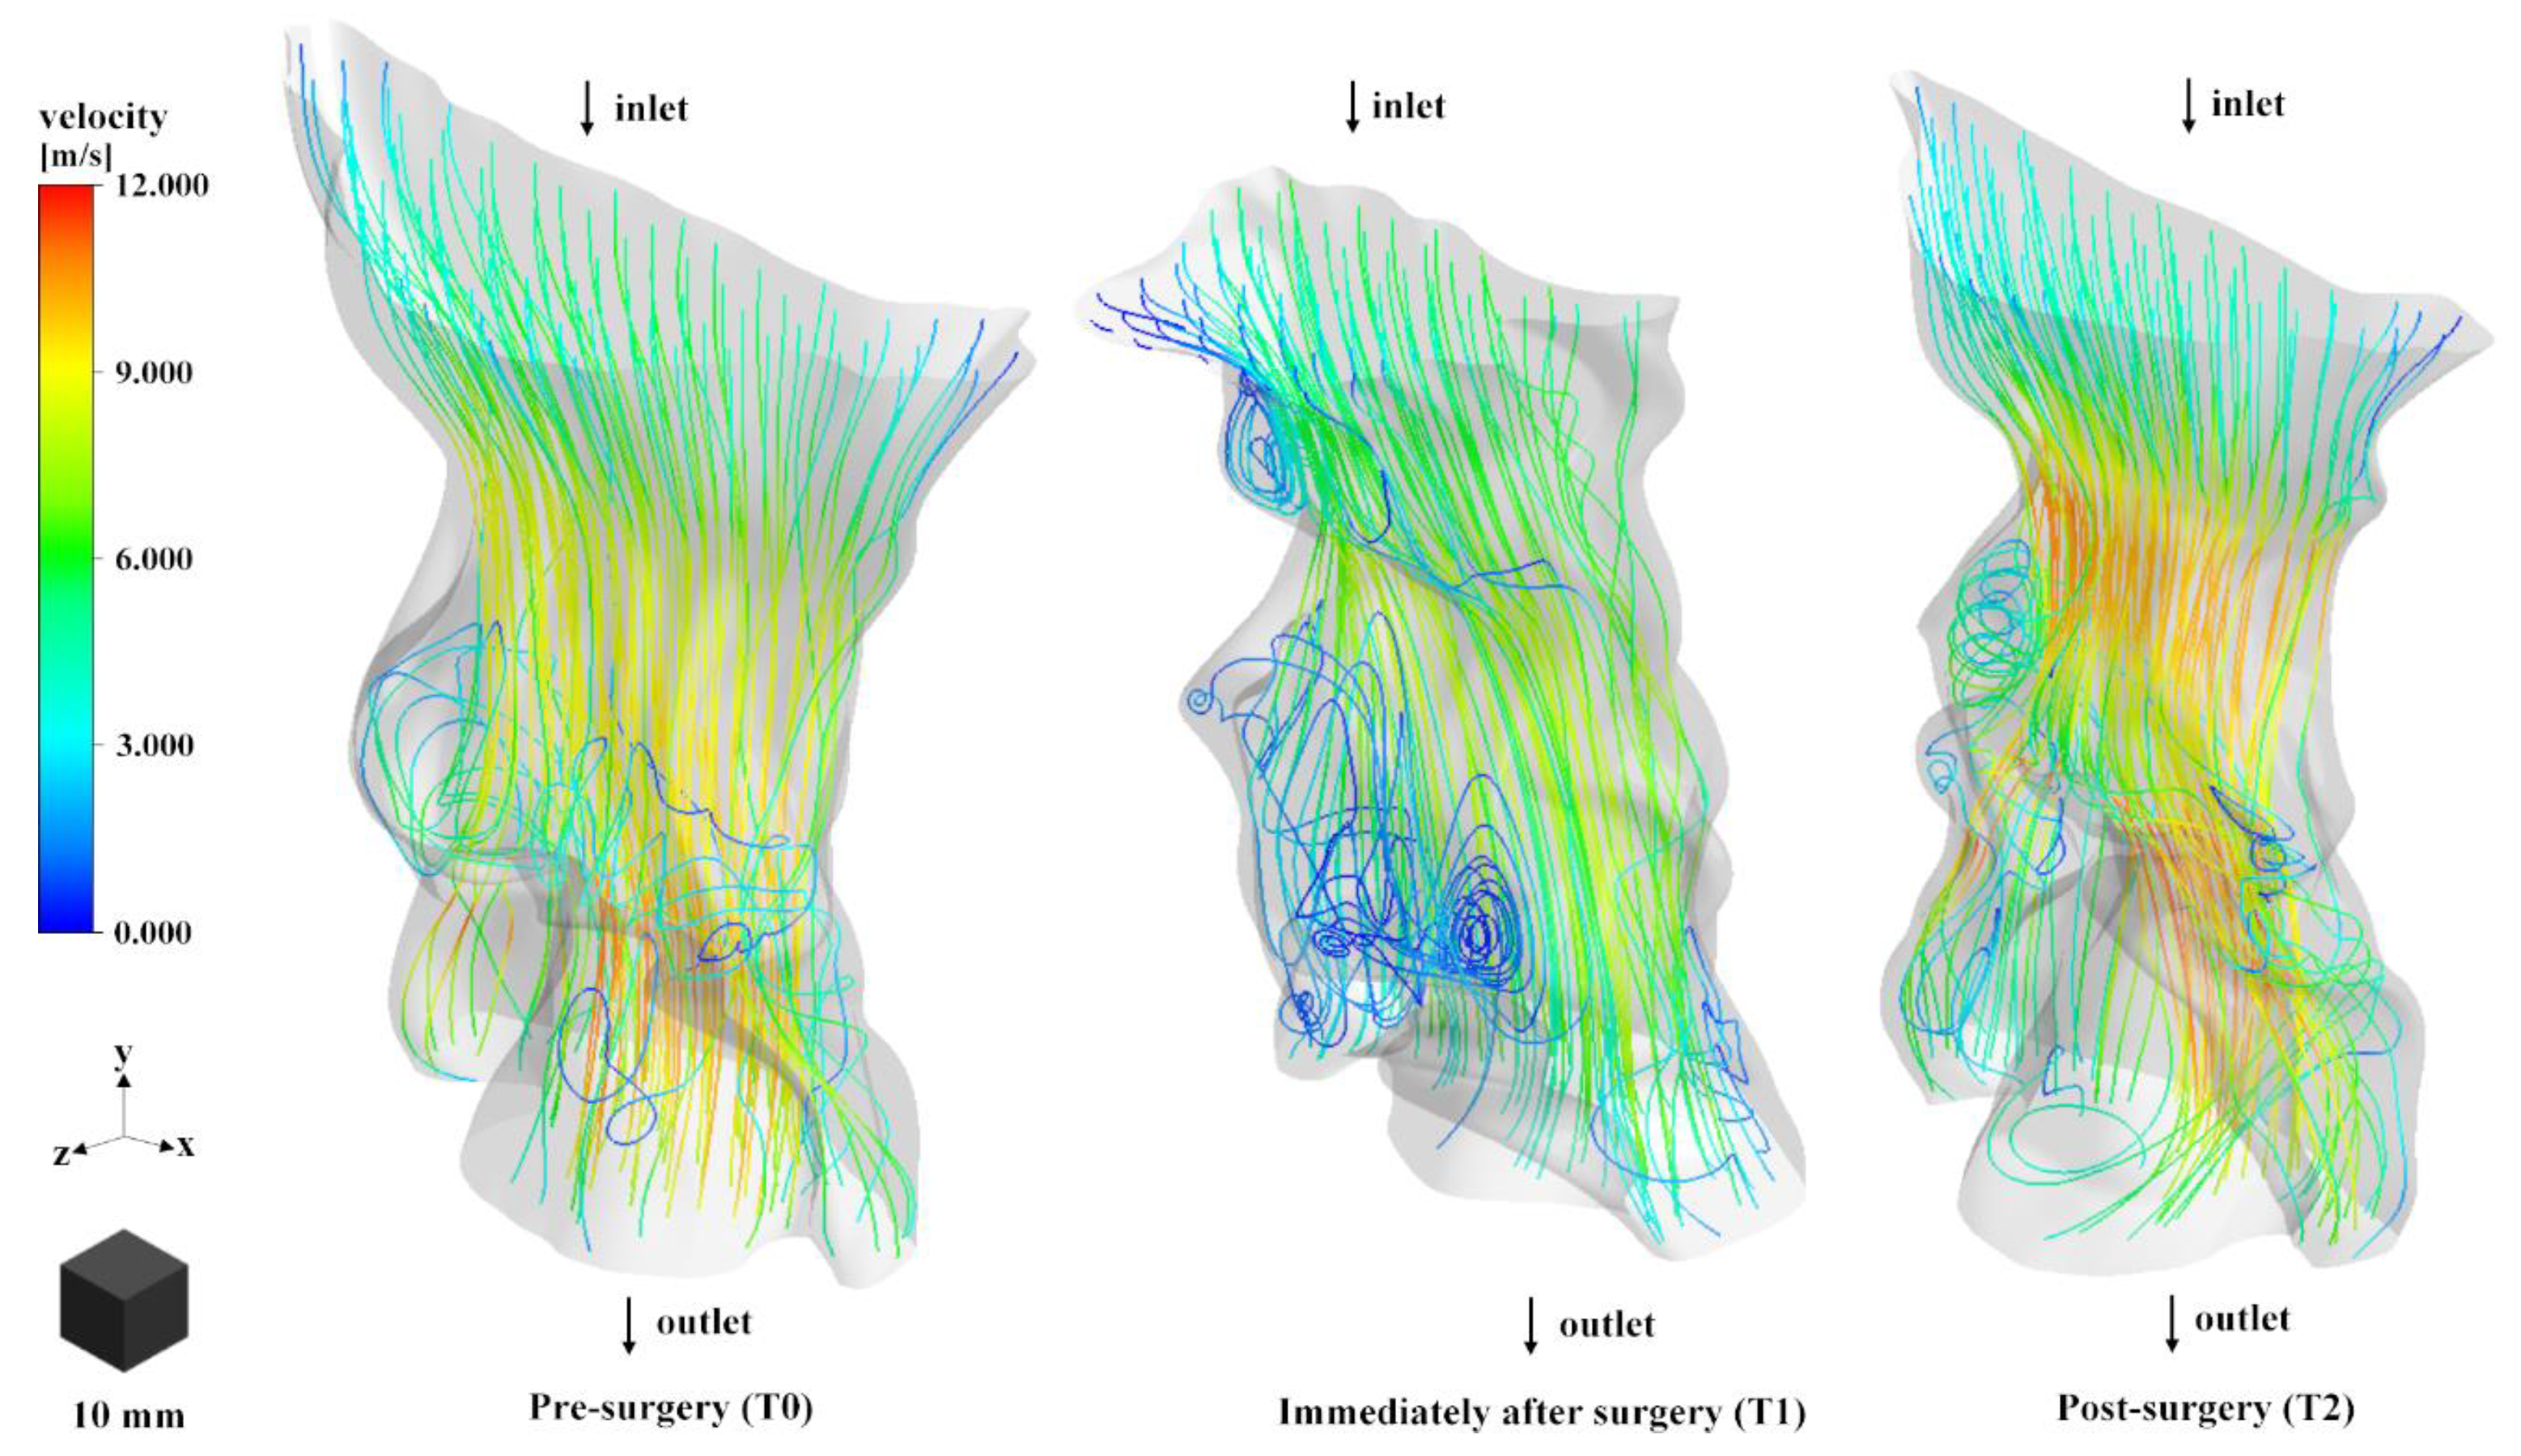
Airflow velocity and streamline is shown in Figure 2. Within the pre-surgery (T0) airway, the flow of air around the oropharynx and epiglottis was faster. The fastest airflows are observed at the epiglottis level. Vertical structures are most often observed in the lower areas of the oropharynx. Immediately after surgery (T1), an overall slower flow is observed in the airway. The number and width of vortices also increase. Vortices are most intense in the oropharynx and nasopharynx, which was not evident at T0. The airflow in the post-surgery (T2) airway is faster than at T0. The velopharynx, behind the soft palate, and epiglottis levels are the narrowest in cross-section, and the velocity at that level is highest. A vortex is observed around the oropharynx and epiglottis, but its size is reduced.
The cross-sectional area and helicity at specific locations are shown in Figure 3. Helicity reflects the flow of air and vortex translation. P1 represents levels at the velopharynx, P2 at the oropharynx, and P3 at the epiglottis. Only at T1 is the cross-sectional area of nasopharynx reduced. The cross-sectional areas of P2 and P3 were comparatively increased. As the area increases, the velocity is decreased, and the main stream is concentrated behind the airway. The cross-sectional area is increased, but a stream is difficult to form in front of the airway due to vortex, which in turn leads to low velocity. A reduction in the overall airway area is evident at T2. At P1, P2, and P3, the cross section is reduced, and the air flow is faster (Figure 3). Strong vortices are formed on both sides at the level of P2. At P3, with the smallest cross-sectional area, the increase in velocity is greatest. The vortex is concentrated in front of the airway and is at its strongest. The area occupied by the vortex increases in relation to the cross-sectional area.

3.3. Airway Pressure Analysis

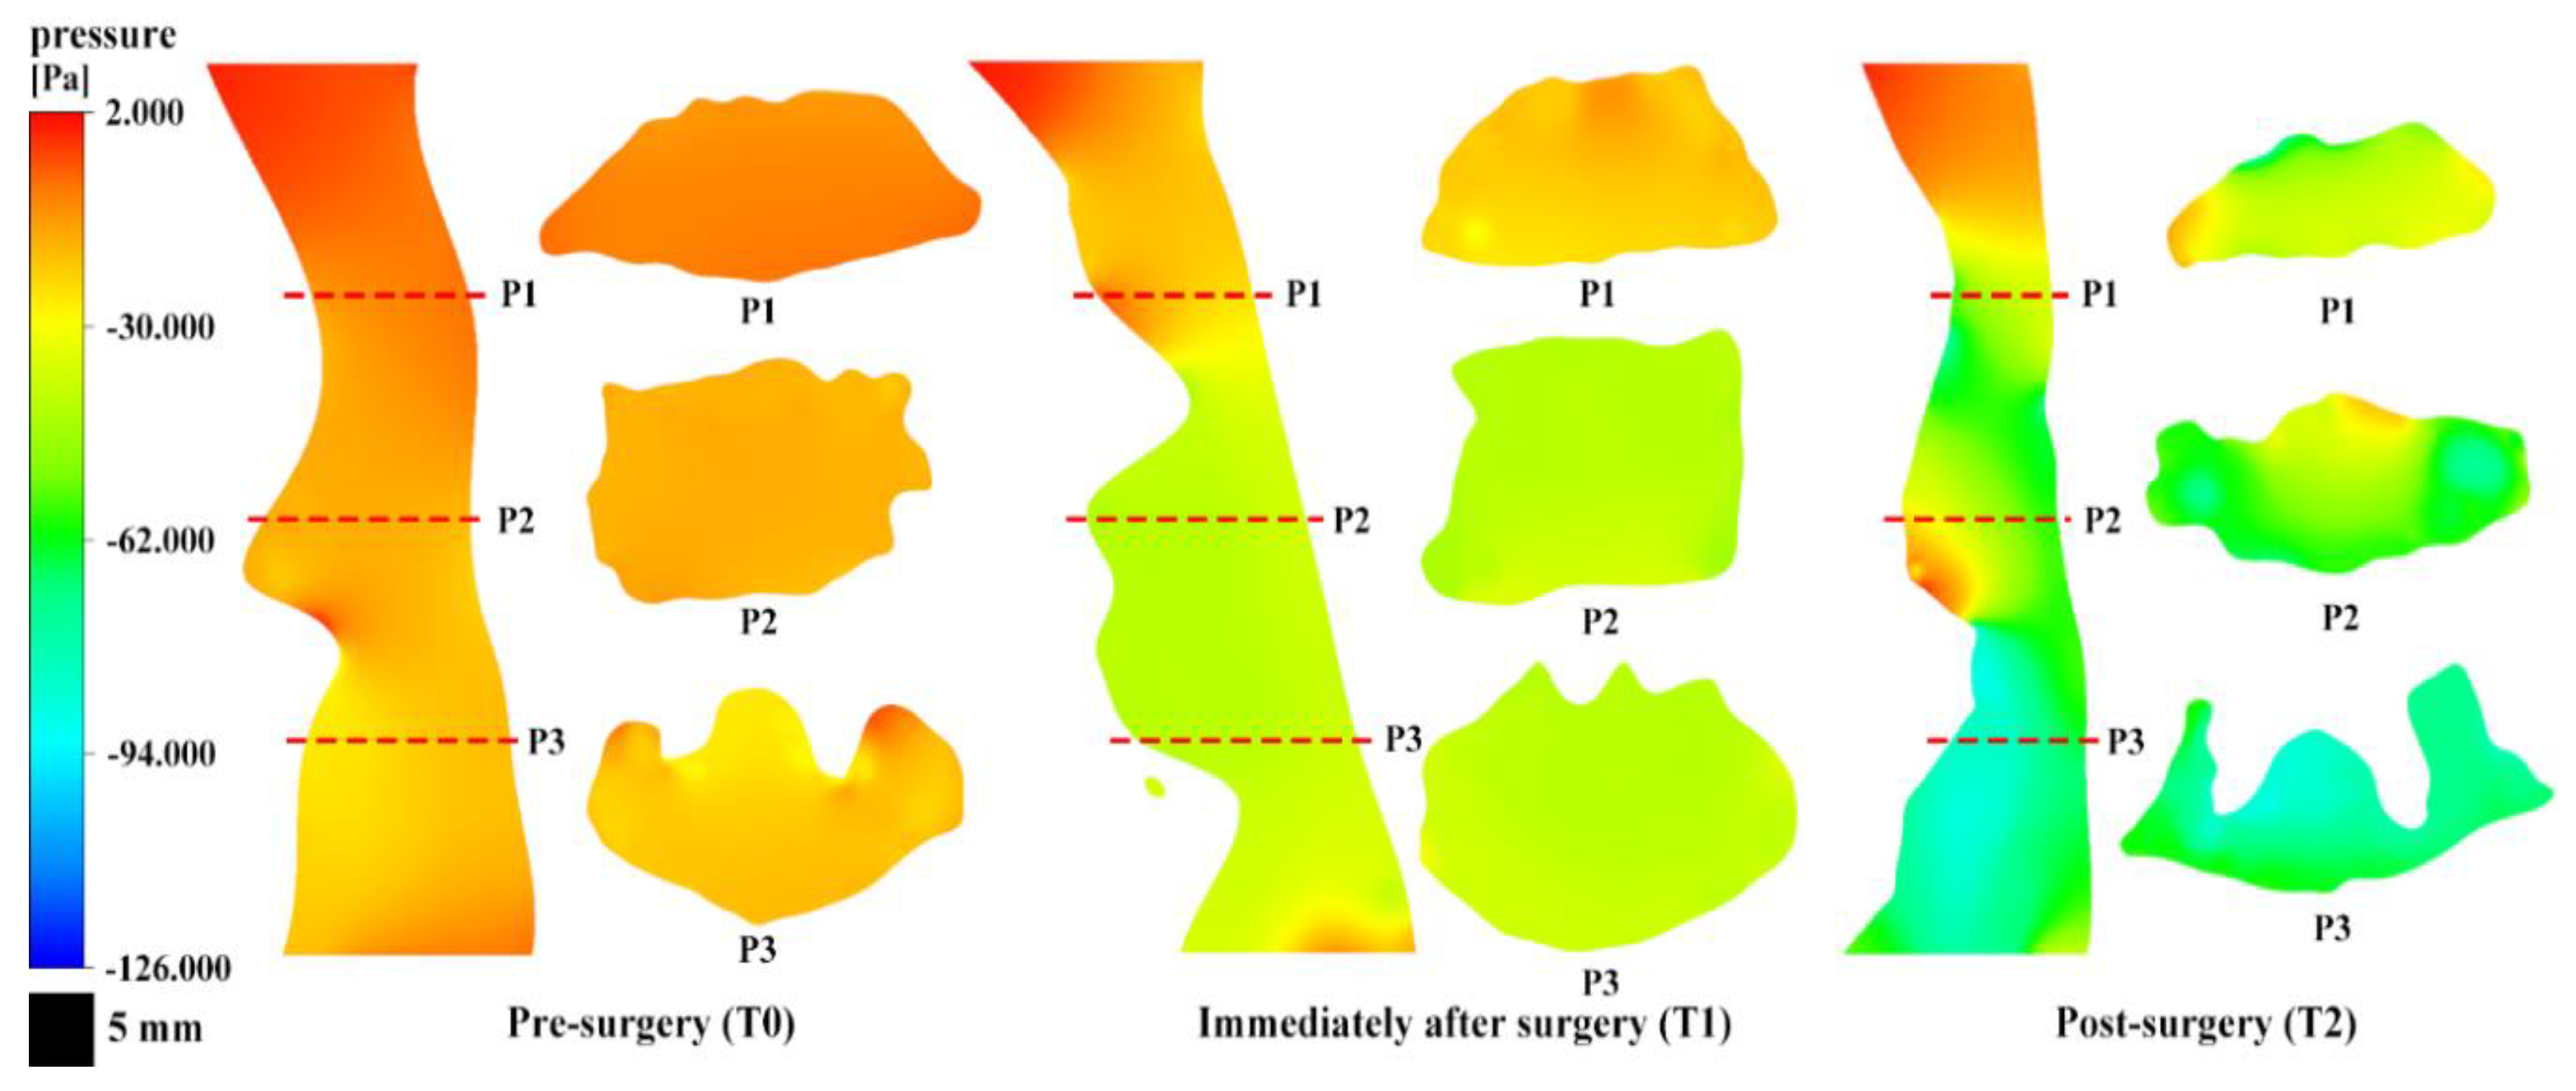
The pressure profile observed in the airway under the same pressure is shown in Figure 4. The airway pressure at T0 is not significantly different from the pressure applied in all regions. This pressure difference becomes larger toward T1 and T2. In the airway at T1, pressure differences were observed in the region from the oropharynx to the epiglottis. The largest pressure change was observed in the velopharynx. Although nasopharynx pressure decreases, it is not significant. The pressure gradient formed between the nasopharynx and oropharynx causes an increase in velocity in this region. The airways at T2 exhibit a larger pressure gradient. Rapid pressure changes are observed at the levels of the velopharynx and epiglottis. The velocity is at maximum at the level of the epiglottis where the pressure gradient is the largest.

3.4. Wall Shear Stress Analysis

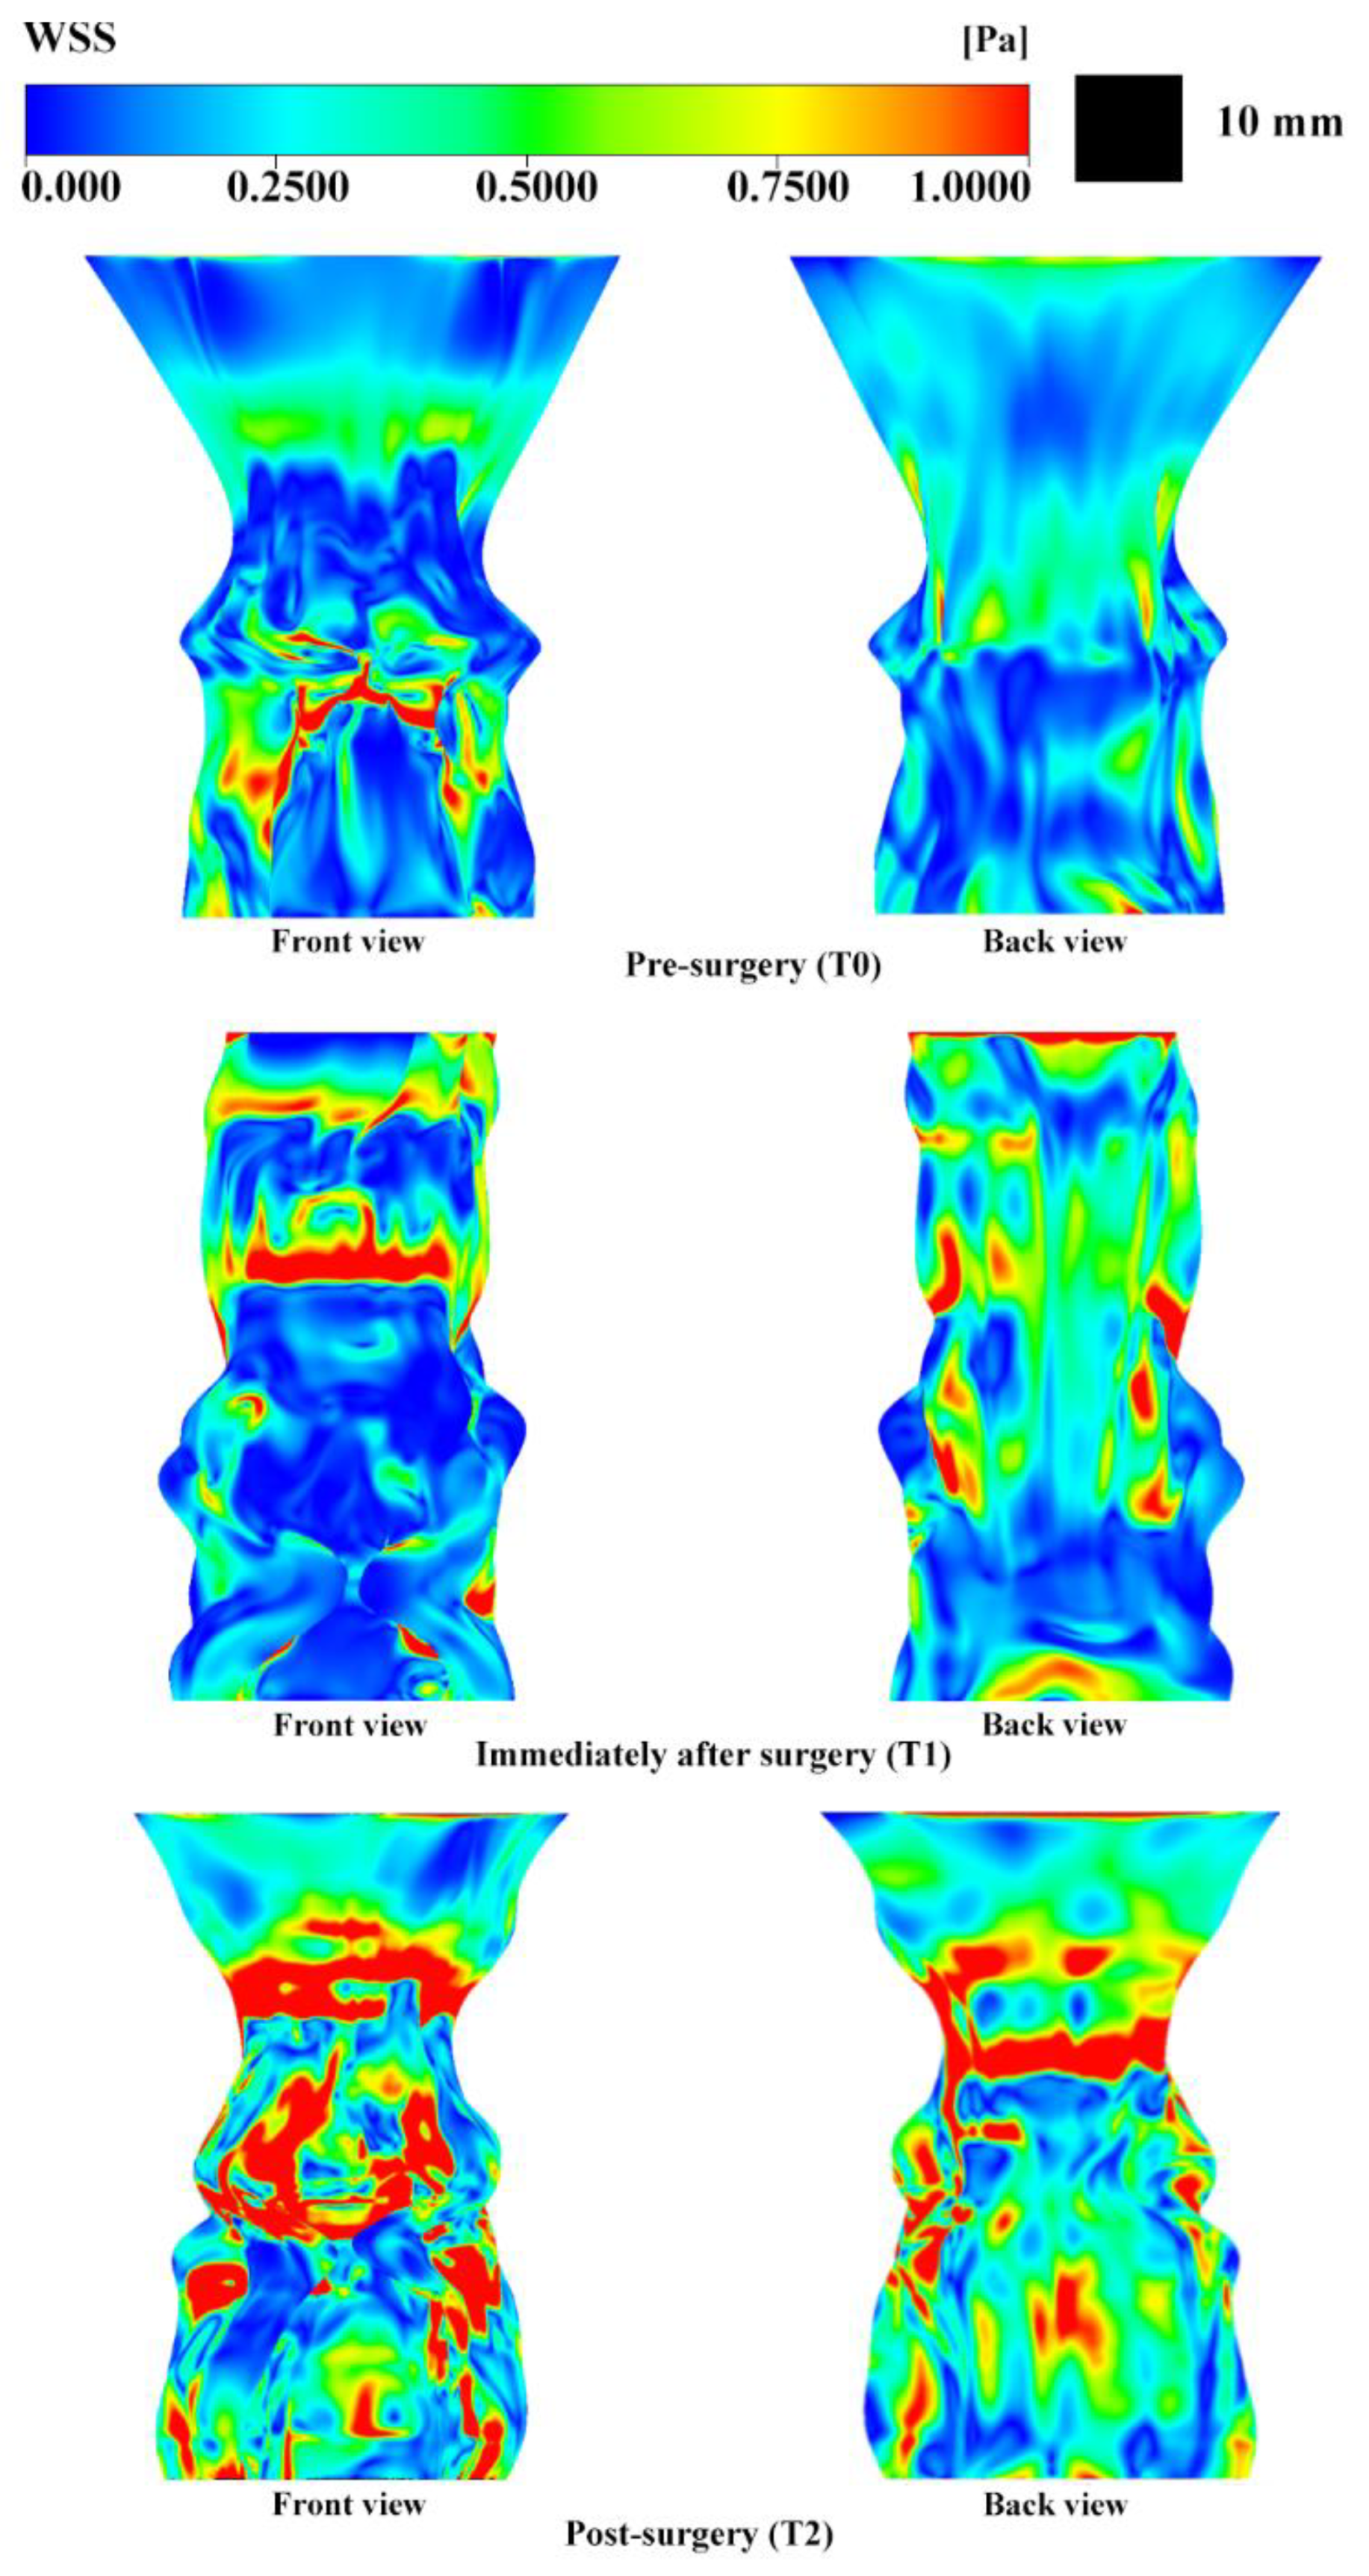
The distribution patterns and magnitudes of wall shear stresses formed in the airway are shown in Figure 5. Shear stress is strong at high-velocity gradients. At T0, the shear stress was generally low. Some areas of high stress at the level of the epiglottis are observed. The airway at T1 exhibited higher shear stress than the surroundings in the velopharynx. This is the same level at which velocity and pressure increase significantly. Shear stress is also high on both sides of the posterior wall of the oropharynx. This is similar to the position where the velocity change is large at T1 in the P2 and P3 cross sections shown in Figure 4. The airways at T2 generate high shear stress over a wide area. The area is concentrated in the upper and lower velopharynx, oropharynx, and epiglottis. As in T1, the positions where the velocity change is large and where the shear stress is high are similar. All these measurements are summarized in Table 2.

4. Discussion

Bimaxillary orthognathic surgery significantly alters facial appearance [1]. Implants can also be used to address facial problems caused by hypogrowth of jaws, such as midfacial deficiency. The implantation of stem cells of dental pulp origin with decellularized bone extracellular matrix (bECM) can induce bone formation [14]. The new bone can be useful in sites where implants are insufficient [15]. Induction of bone formation can hopefully be performed more in the future [16]; however, the most effective method is bimaxillary orthognathic surgery. The maxillomandibular complex can be repositioned up, down, left, right, or rotationally in this operation. As such, it is widely used in Asia where skeletal class III malocclusion is observed at high rates [2]. Changes in jaw position also affect the shape of the soft tissue attached to it. According to Ozbeck and Becker, the posterior movement of the mandible changes the position of the tongue base and hyoid bone rearward and downward [17]. The change in position of these structures ultimately affects the shape of the airway [3]. According to a meta-analysis by He et al., the volume of the oropharynx and total airway volume decrease after bimaxillary setback orthognathic surgery [18]. Furthermore, Jang et al., demonstrated that airway volume decreased by 29% after bimaxillary setback orthognathic surgery, especially in the oropharynx. Studies to observe changes in the upper respiratory tract after surgeries in various directions have been conducted. Staderini E. et al., performed a rapid maxillary expansion (RME) analysis using the three-dimensional stereophotogrammetrical method. The results of a meta-analysis confirmed that the effect of RME on the upper airway is not clear [19].
Reduction in airway volume is a risk factor for obstructive sleep apnea (OSA). Patini, R. et al., confirmed that children with OSA could undergo MRI assessment to effectively analyze the tonsil and airway patterns [20]. This is supported by the finding that airway stenosis is observed at the level of the velopharynx and oropharynx in many patients with OSA [21,22,23,24,25,26]. We conducted this study to determine the effect of positional changes in the maxillomandibular complex on the airway. We performed bimaxillary orthognathic surgery in one patient and acquired CBCT images preoperatively (T0), postoperatively (T1), and 7 months postoperatively 7 (T2). CBCT images and CFD simulations were used to analyze airflow in the airway.
The airway is a continuous organ consisting of soft tissue with irregular shapes and inner surfaces. To apply CFD simulation to such a “flabby” organ, it was reconstructed into a simple shape. CFD simulation applied to the reconstructed airway was helpful in effectively analyzing the airflow pattern according to the individual patient’s airway type [10,11,25,27,28].
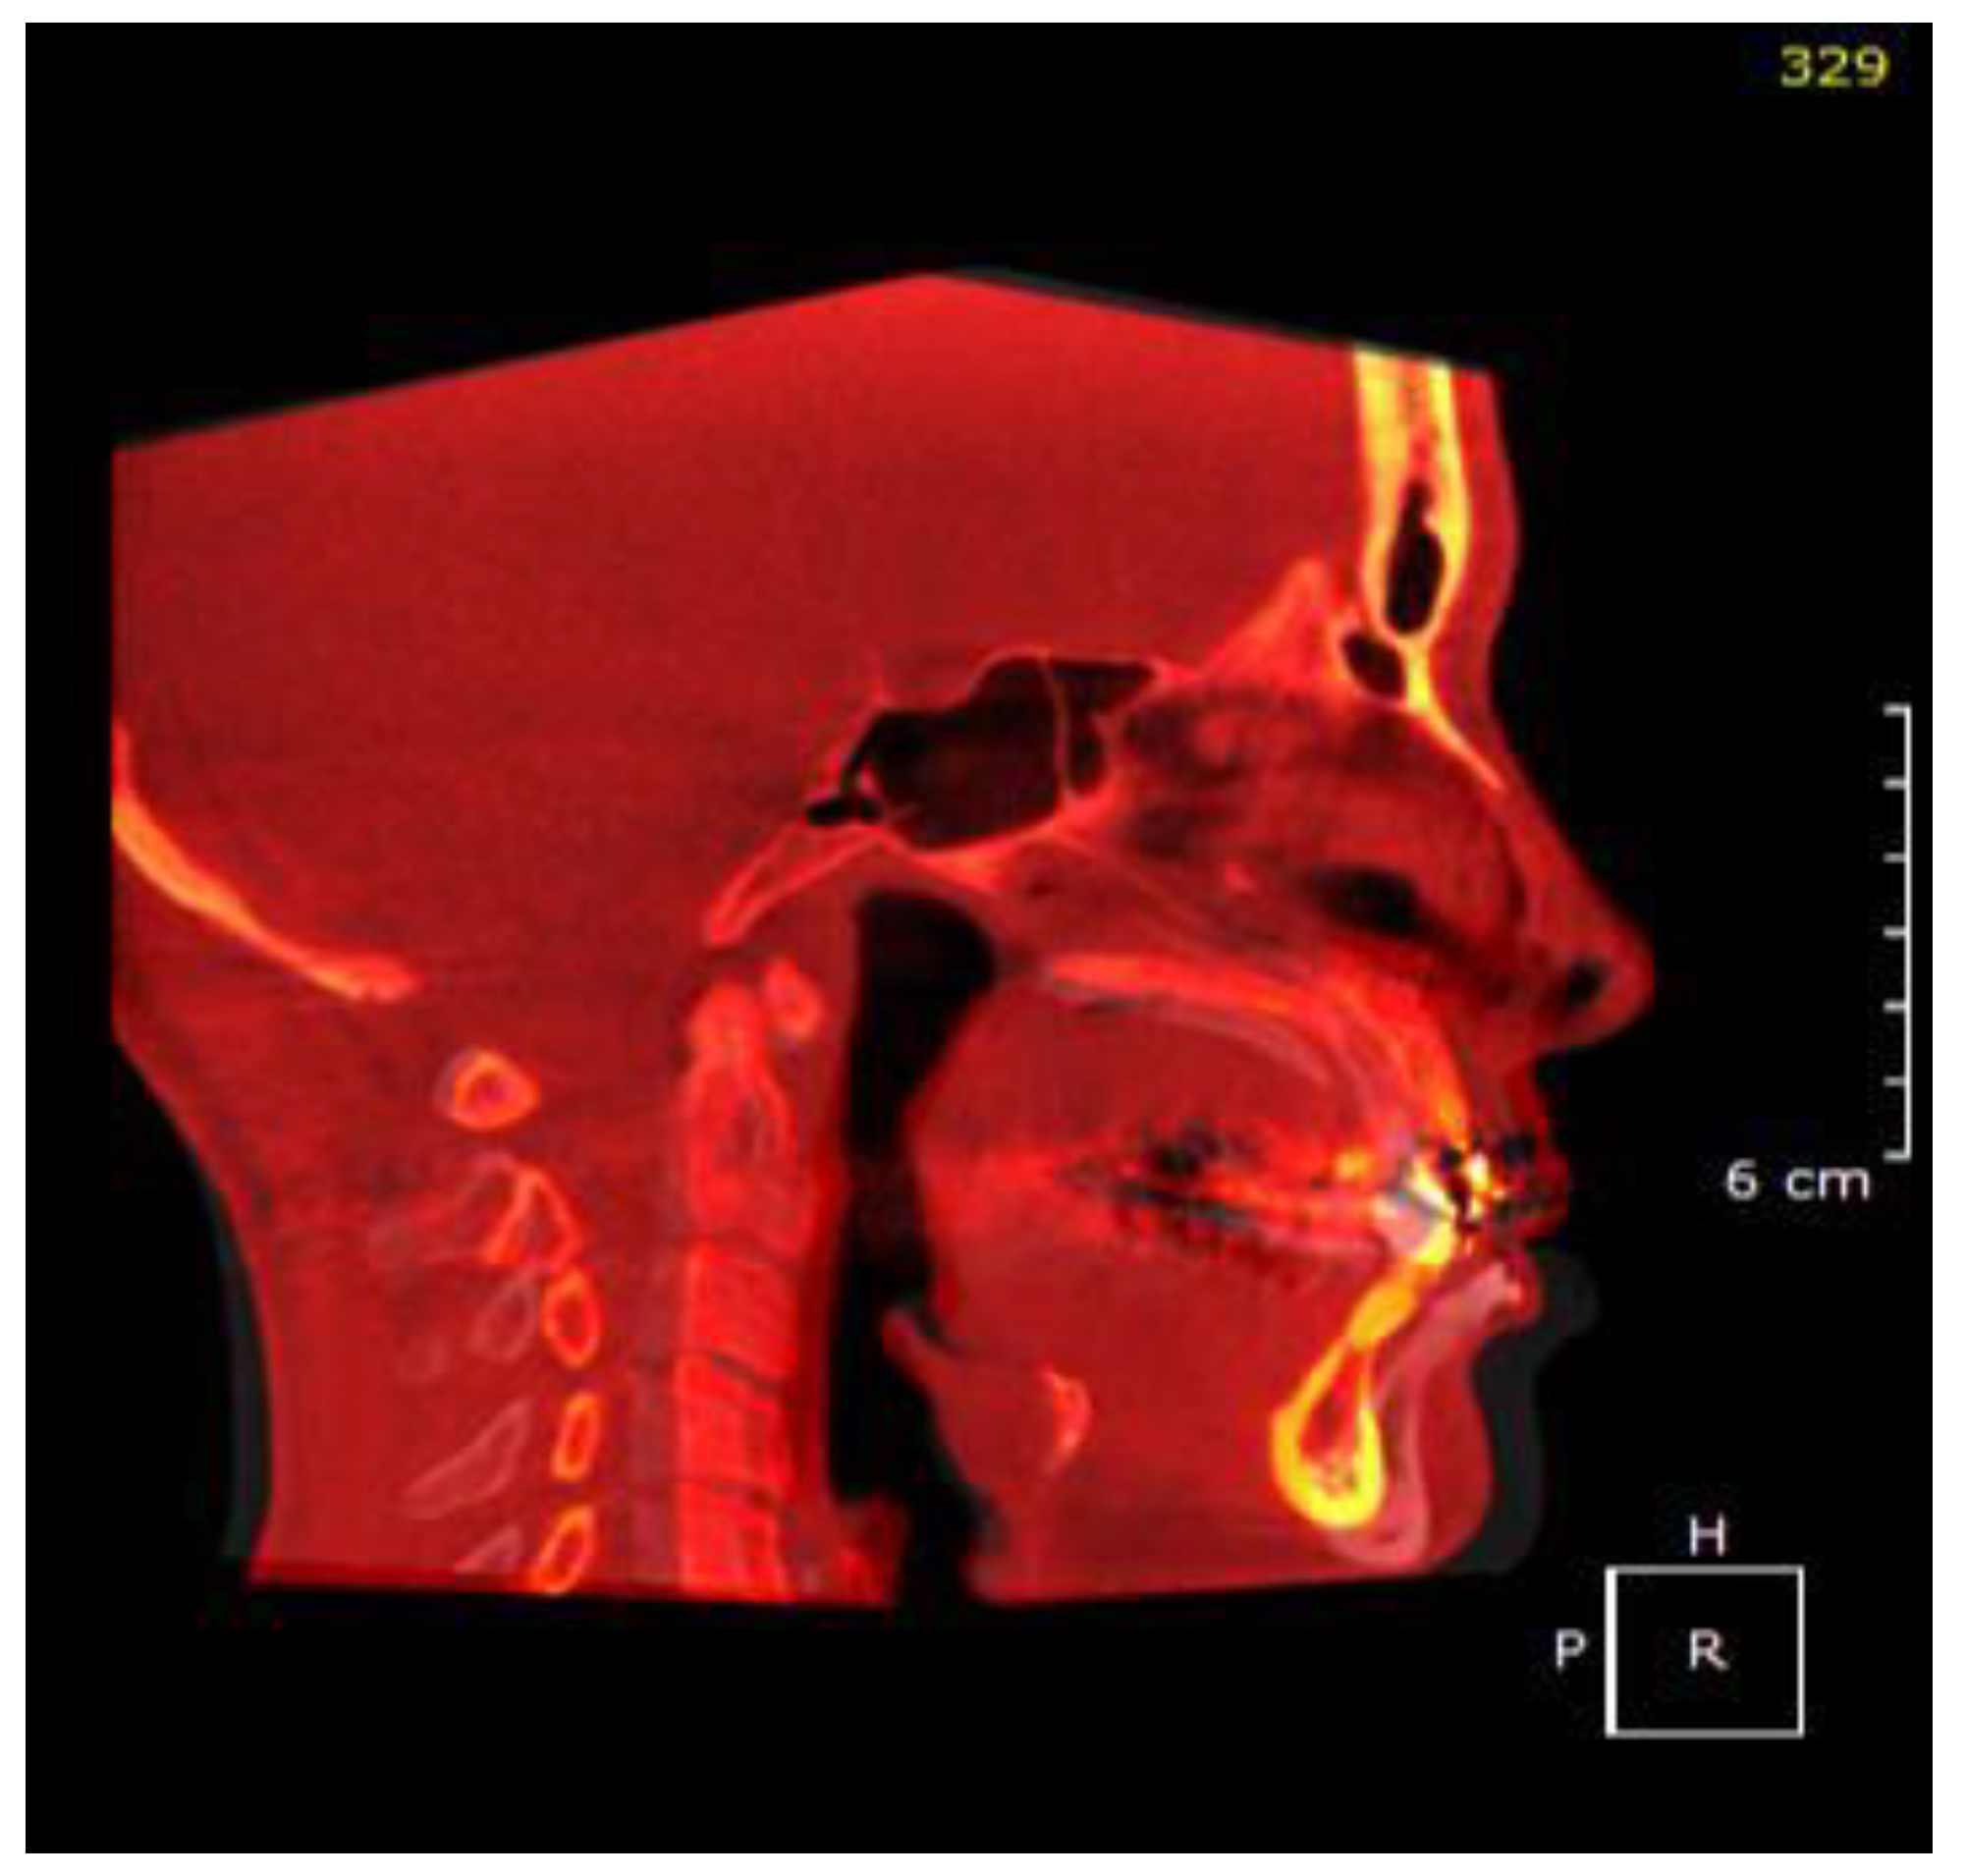
Analysis revealed that the velopharynx at T1 was narrowed, but the oropharynx was rather widened. This is assumed to be a result of the upward movement of the maxillomandibular complex because the position of the hyoid bone did not change immediately after the operation, and the distance from the mandible was increased. The direction of jaw movement in the patient is shown in Figure 6. Although the oropharynx is wider, the upper velopharynx is narrower, resulting in a decrease in the amount of incoming air, creating a strong vortex concentrated in front of the airway. The velopharynx is where airway internal pressure changes significantly. At this location, with its large pressure gradients, wall shear stress is also high. Thus, the shape of the conductive wall can be easily altered.
The airway at T2 decreased overall and became particularly narrower at the velopharynx, oropharynx, and epiglottis. This is because the hyoid bone moved after the operation. As a result, the flow rate in the oropharynx and laryngopharynx increased and significant sound pressure developed. This means that the patient will have to exert more effort to obtain the same amount of air. The greatest difference in speed and pressure occurs around the epiglottis. This creates a strong vortex structure at that level. In the oropharynx, vortices form and are located on both sides of the airway. Locations where the velocity and pressure gradients are large include the velopharynx, oropharynx, and epiglottis, with narrow cross-sectional areas. Wall shear stress is also observed at this location. The velopharynx, oropharynx, and epiglottis are the structures most vulnerable to morphological changes, meaning that they can easily become obstructed. This is the same result observed in patients with OSA.
In the present study, we effectively simulated the airflow pattern according to airway type of the patient using CFD, and we predicted the occurrence and location of airway obstruction when applied to an individual who underwent bimaxillary orthognathic surgery. Limitations of the present study include its small sample size (n = 1) and the use of CBCT performed with the patient in an upright position, which does not consider changes in airway patterns due to gravity. Furthermore, the study did not consider other factors that cause OSA, such as a high body mass index. However, we believe that the reduction in airway area according to the amount of movement of the upper and lower jaw can be quantified by performing follow-up studies with larger sample sizes. Furthermore, we believe that airway reconstruction and CFD analysis can be performed in individual patients. As such, it is possible to anticipate and prepare for changes in airway, airflow, and potential problems after surgery. We believe that the results of the present study are sufficiently significant as a preparatory step in this regard.

5. Conclusions

We confirmed that the airway change pattern analysis using CFD was effective. It is possible to simulate the air flow pattern according to the individual patient’s airway shape and to predict the location of airway obstruction.
After bimaxillary setback surgery, the airway decreases as a whole, especially at the velopharynx, oropharynx, and epiglottis. As a result, the flow rate in oropharynx and laryngopharynx increases and a substantial amount of negative pressure is generated. The greatest difference in speed and pressure occurs around the epiglottis, which causes the formation of strong vortex structures. The locations where the velocity and pressure gradients are large are at the velopharynx, oropharynx, and epiglottis levels with narrow cross sections. Wall shear stress is also observed at these locations. The velopharynx, oropharynx, and epiglottis are the structures most vulnerable to morphological changes, meaning that their structures are easy to observe.
This study has some limitations. The number of subjects was small (n = 1), and the use of CBCT taken in the standing position did not reflect the changes in airway patterns due to gravity. Another limitation is the lack of consideration of other factors that cause OSA. Follow-up studies with more patient groups are needed.

Author Contributions

Conceptualization, Y.-D.K. and E.Y.; methodology, H.S.; software, H.S.; validation, J.M.S. and E.Y.; investigation, N.-R.C. and H.S.; resources, Y.-D.K.; data curation, N.-R.C.; writing—original draft preparation, J.M.S.; writing—review and editing, E.Y.; visualization, H.S.; supervision, Y.-D.K.; project administration, Y.-D.K. All authors have read and agreed to the published version of the manuscript.

Funding

This research received no external funding.

Conflicts of Interest

The authors declare no conflict of interest.

References

  1. Ngan, P.; Moon, W. Evolution of Class III treatment in orthodontics. Am. J. Orthod. Dentofac. Orthop. 2015, 148, 22–36. [Google Scholar] [CrossRef] [PubMed] [Green Version]
  2. Oh, E.; Ahn, S.J.; Sonnesen, L. Ethnic differences in craniofacial and upper spine morphology between European and Asian children with skeletal Class III malocclusion. Am. J. Orthod. Dentofac. Orthop. 2019, 156, 502–511. [Google Scholar] [CrossRef] [PubMed]
  3. Kawakami, M.; Yamamoto, K.; Fujimoto, M.; Ohgi, K.; Inoue, M.; Kirita, T. Changes in tongue and hyoid positions, and posterior airway space following mandibular setback surgery. J. Cranio Maxillofac. Surg. 2005, 33, 107–110. [Google Scholar] [CrossRef] [PubMed]
  4. Becker, O.E.; Avelar, R.L.; Goelzer, J.G.; Dolzan Ado, N.; Haas, O.L., Jr.; De Oliveira, R.B. Pharyngeal airway changes in Class III patients treated with double jaw orthognathic surgery-maxillary advancement and mandibular setback. J. Oral Maxillofac. Surg. 2012, 70, e639–e647. [Google Scholar] [CrossRef] [PubMed]
  5. Tatullo, M.; Marrelli, M.; Scacco, S.; Lorusso, M.; Doria, S.; Sabatini, R.; Auteri, P.; Cagiano, R.; Inchingolo, F. Relationship between oxidative stress and “burning mouth syndrome” in female patients: A scientific hypothesis. Eur. Rev. Med. Pharmacol. Sci. 2012, 16, 1218–1221. [Google Scholar] [PubMed]
  6. Chen, F.; Terada, K.; Hua, Y.; Saito, I. Effects of bimaxillary surgery and mandibular setback surgery on pharyngeal airway measurements in patients with Class III skeletal deformities. Am. J. Orthod. Dentofac. Orthop. 2007, 131, 372–377. [Google Scholar] [CrossRef]
  7. Degerliyurt, K.; Ueki, K.; Hashiba, Y.; Marukawa, K.; Simsek, B.; Okabe, K.; Nakagawa, K.; Yamamoto, E. The effect of mandibular setback or two-jaws surgery on pharyngeal airway among different genders. Int. J. Oral Maxillofac. Surg. 2009, 38, 647–652. [Google Scholar] [CrossRef] [Green Version]
  8. Collins, T.P.; Tabor, G.R.; Young, P.G. A computational fluid dynamics study of inspiratory flow in orotracheal geometries. Med. Biol. Eng. Comput. 2007, 45, 829–836. [Google Scholar] [CrossRef]
  9. Xia, G.; Tawhai, M.H.; Hoffman, E.A.; Lin, C.L. Airway wall stiffening increases peak wall shear stress: A fluid-structure interaction study in rigid and compliant airways. Ann. Biomed. Eng. 2010, 38, 1836–1853. [Google Scholar] [CrossRef] [Green Version]
  10. Sittitavornwong, S.; Waite, P.D.; Shih, A.M.; Cheng, G.C.; Koomullil, R.; Ito, Y.; Cure, J.K.; Harding, S.M.; Litaker, M. Computational fluid dynamic analysis of the posterior airway space after maxillomandibular advancement for obstructive sleep apnea syndrome. J. Oral Maxillofac. Surg. 2013, 71, 1397–1405. [Google Scholar] [CrossRef] [Green Version]
  11. Shah, D.H.; Kim, K.B.; McQuilling, M.W.; Movahed, R.; Shah, A.H.; Kim, Y.I. Computational fluid dynamics for the assessment of upper airway changes in skeletal Class III patients treated with mandibular setback surgery. Angle Orthod. 2016, 86, 976–982. [Google Scholar] [CrossRef] [PubMed] [Green Version]
  12. Na, J.S.; Jung, H.D.; Cho, H.J.; Choi, Y.J.; Lee, J.S. Computational analysis of airflow dynamics for predicting collapsible sites in the upper airways: A preliminary study. J. Appl. Physiol. 2019, 126, 330–340. [Google Scholar] [CrossRef]
  13. Mylavarapu, G.; Murugappan, S.; Mihaescu, M.; Kalra, M.; Khosla, S.; Gutmark, E. Validation of computational fluid dynamics methodology used for human upper airway flow simulations. J. Biomech. 2009, 42, 1553–1559. [Google Scholar] [CrossRef] [PubMed]
  14. Paduano, F.; Marrelli, M.; Alom, N.; Amer, M.; White, L.J.; Shakesheff, K.M.; Tatullo, M. Decellularized bone extracellular matrix and human dental pulp stem cells as a construct for bone regeneration. J. Biomater. Sci. Polym. Ed. 2017, 28, 730–748. [Google Scholar] [CrossRef] [PubMed] [Green Version]
  15. Kerativitayanan, P.; Tatullo, M.; Khariton, M.; Joshi, P.; Perniconi, B.; Gaharwar, A.K. Nanoengineered osteoinductive and elastomeric scaffolds for bone tissue engineering. ACS Biomater. Sci. Eng. 2017, 3, 590–600. [Google Scholar] [CrossRef]
  16. Tatullo, M.; Codispoti, B.; Pacifici, A.; Palmieri, F.; Marrelli, M.; Pacifici, L.; Paduano, F. Potential Use of Human Periapical Cyst-Mesenchymal Stem Cells (hPCy-MSCs) as a Novel Stem Cell Source for Regenerative Medicine Applications. Front. Cell Dev. Biol. 2017, 5. [Google Scholar] [CrossRef] [PubMed] [Green Version]
  17. Özbek, M.M.; Miyamoto, K.; Lowe, A.A.; Fleetham, J.A. Natural head posture, upper airway morphology and obstructive sleep apnoea severity in adults. Eur. J. Orthod. 1998, 20, 133–143. [Google Scholar] [CrossRef] [PubMed] [Green Version]
  18. He, J.; Wang, Y.; Hu, H.; Liao, Q.; Zhang, W.; Xiang, X.; Fan, X. Impact on the upper airway space of different types of orthognathic surgery for the correction of skeletal class III malocclusion: A systematic review and meta-analysis. Int. J. Surg. 2017, 38, 31–40. [Google Scholar] [CrossRef]
  19. Staderini, E.; Patini, R.; De Luca, M.; Gallenzi, P. Three-dimensional stereophotogrammetric analysis of nasolabial soft tissue effects of rapid maxillary expansion: A systematic review of clinical trials. Acta Otorhinolaryngol. Ital. 2018, 38, 399–408. [Google Scholar] [CrossRef]
  20. Patini, R.; Arrica, M.; Di Stasio, E.; Gallenzi, P.; Cordaro, M. The use of magnetic resonance imaging in the evaluation of upper airway structures in paediatric obstructive sleep apnoea syndrome: A systematic review and meta-analysis. Dentomaxillofac. Radiol. 2016, 45, 20160136. [Google Scholar] [CrossRef] [Green Version]
  21. Hochban, W.; Schurmann, R.; Brandenburg, U.; Conradt, R. Mandibular setback for surgical correction of mandibular hyperplasia--does it provoke sleep-related breathing disorders? Int. J. Oral Maxillofac. Surg. 1996, 25, 333–338. [Google Scholar] [CrossRef]
  22. Canellas, J.V.; Barros, H.L.; Medeiros, P.J.; Ritto, F.G. Sleep-disordered breathing following mandibular setback: A systematic review of the literature. Sleep Breath 2016, 20, 387–394. [Google Scholar] [CrossRef] [PubMed]
  23. Liu, S.Y.; Huon, L.K.; Iwasaki, T.; Yoon, A.; Riley, R.; Powell, N.; Torre, C.; Capasso, R. Efficacy of Maxillomandibular Advancement Examined with Drug-Induced Sleep Endoscopy and Computational Fluid Dynamics Airflow Modeling. Otolaryngol. Head Neck Surg. 2016, 154, 189–195. [Google Scholar] [CrossRef] [PubMed]
  24. Guimaraes, T.M.; Bariani, R.C.; Iafigliola, S.G.; Guimaraes, C.M.; Chaves Junior, C.M.; Ferraz, O.; Cappellette Junior, M.; Abraao-Cunha, T.C.; Dal-Fabbro, C.; Rossi, R.; et al. Cone beam computed tomography in assessment on pharynx effects of orthopedic-surgical treatment—A review of the literature. Sleep Sci. 2019, 12, 106–109. [Google Scholar] [CrossRef]
  25. Song, B.; Li, Y.; Sun, J.; Qi, Y.; Li, P.; Li, Y.; Gu, Z. Computational fluid dynamics simulation of changes in the morphology and airflow dynamics of the upper airways in OSAHS patients after treatment with oral appliances. PLoS ONE 2019, 14, e0219642. [Google Scholar] [CrossRef]
  26. Suga, H.; Iwasaki, T.; Mishima, K.; Nakano, H.; Ueyama, Y.; Yamasaki, Y. Evaluation of the effect of oral appliance treatment on upper-airway ventilation conditions in obstructive sleep apnea using computational fluid dynamics. Cranio 2019, 1–9. [Google Scholar] [CrossRef] [Green Version]
  27. Huang, H.; Yin, H.; Wang, Y.; Chen, N.; Huang, D.; Luo, X.; Yin, X.; Zheng, Q.; Shi, B.; Li, J. Computational Fluid Dynamic Analysis of Different Velopharyngeal Closure Patterns. Ann. Otol. Rhinol. Laryngol. 2020, 129, 157–163. [Google Scholar] [CrossRef]
  28. Yajima, Y.; Oshima, M.; Iwai, T.; Kitajima, H.; Omura, S.; Tohnai, I. Computational fluid dynamics study of the pharyngeal airway space before and after mandibular setback surgery in patients with mandibular prognathism. Int. J. Oral Maxillofac. Surg. 2017, 46, 839–844. [Google Scholar] [CrossRef]
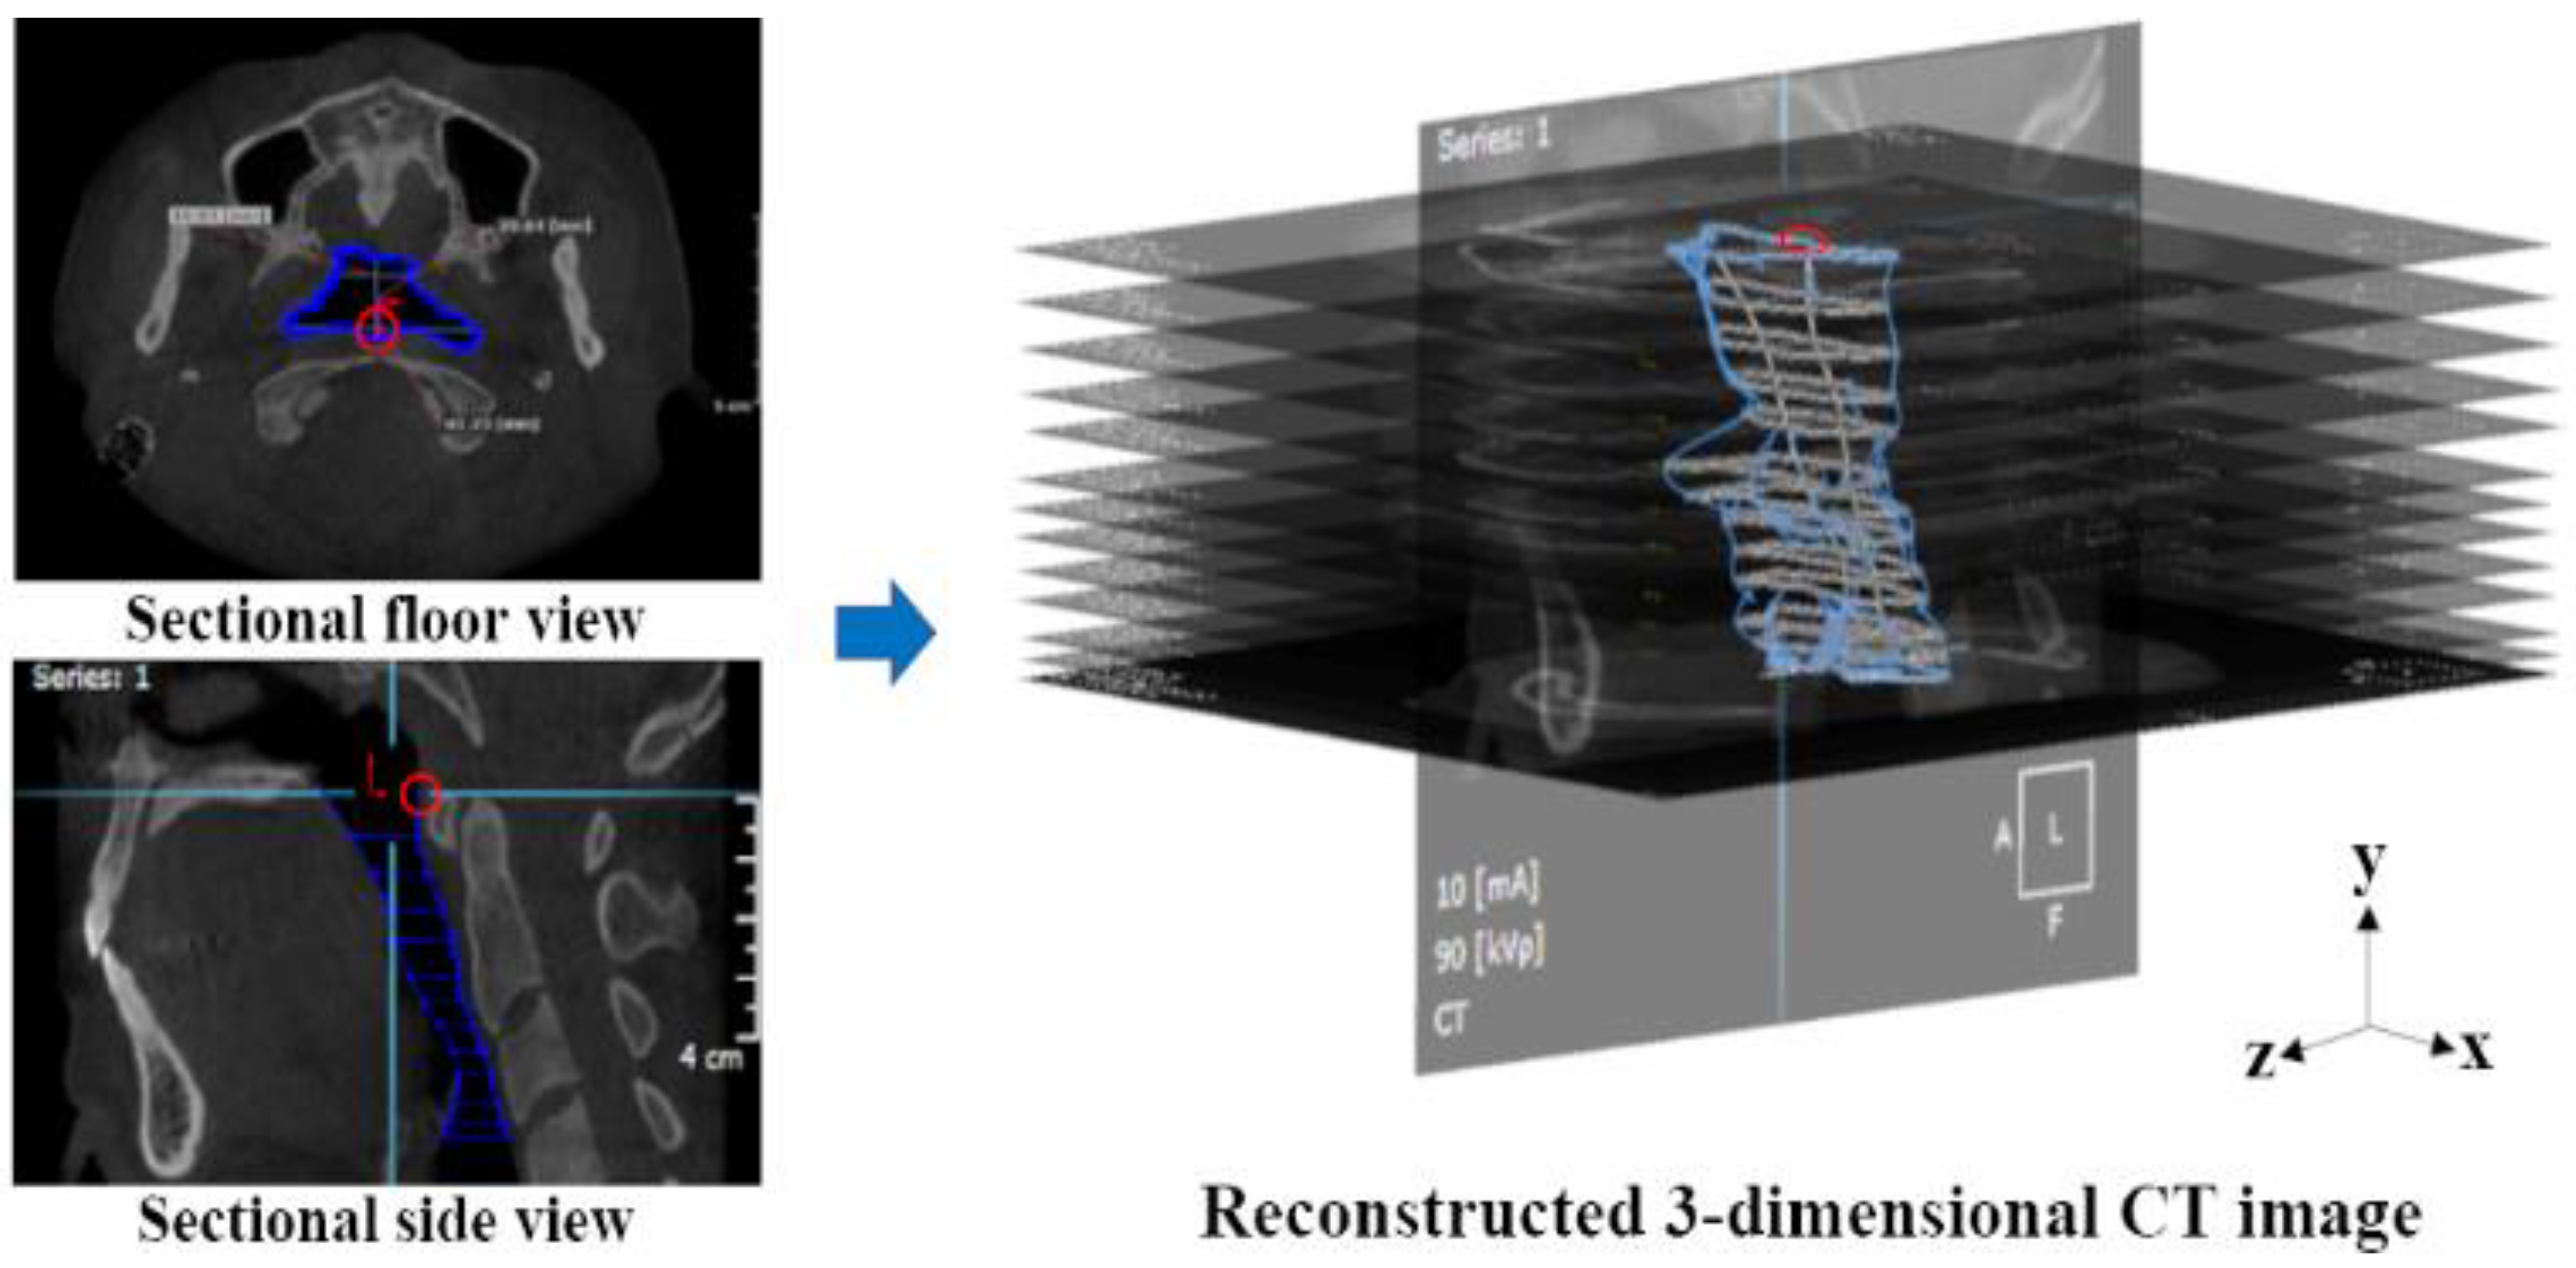
Figure 1. Procedure of the 3D reconstruction of upper airway based on sectional CT images. The complex shape of airway in sectional floor CT view was manually designed. To use the lofted boss/base in SolidWorks software, the edges of airway were manually matched on the sectional floor and side views.
Applsci 10 01676 g001
Figure 2. 3D streamlines in the 3D reconstructed model for pre-surgery, immediately after surgery, and post-surgery.
Applsci 10 01676 g002
Figure 3. Simulation results representing contoured vector fields of air flow in cases of pre-surgery, immediately after surgery, and post-surgery. P1, P2, and P3 indicate xz planes representing sectional information.
Applsci 10 01676 g003
Figure 4. Simulation results representing contoured pressure distribution of air flow in cases of pre-surgery, immediately after surgery, and post-surgery. P1, P2, and P3 indicate xz planes representing sectional information.
Applsci 10 01676 g004
Figure 5. 3D distribution of WSS (wall shear stress) for pre-surgery, immediately after surgery, and post-surgery.
Applsci 10 01676 g005
Figure 6. An overlay of the patient’s pre-surgery and post-surgery CT images. This shows the movement of the maxillomandibular complex.
Applsci 10 01676 g006
Table 1. Rendering volume of the 3D reconstructed model for pre-surgery, immediately after surgery and post-surgery.
Volume (mm3)
Pre-surgery (T0)21,102.38
Immediately after surgery (T1)19,556.17
Post-surgery (T2)14,895.94
Table 2. Flow parameters in this study. Maximum velocity (Vmax), pressure drop (ΔP), and maximum wall shear stress (WSSmax).
Vmax (m/s)ΔP (Pa)WSSmax (Pa)
Pre-surgery (T0) 7.038−7.7234.214
Immediately after surgery (T1) 8.723−27.00410.733
Post-surgery (T2) 12.054−53.73914.323