Article

Factor Identification and Prediction for Teen Driver Crash Severity Using Machine Learning: A Case Study

1
Department of Traffic Information and Control Engineering, Jilin University, Changchun 130022, China
2
Texas A & M Transportation Institute, Texas A & M University, College Station, TX 77843, USA
3
Department of Civil, Environmental and Construction Engineering, Texas Tech University, Lubbock, TX 79409, USA
*
Author to whom correspondence should be addressed.
Appl. Sci. 2020, 10(5), 1675; https://doi.org/10.3390/app10051675
Submission received: 8 January 2020 / Revised: 23 February 2020 / Accepted: 24 February 2020 / Published: 2 March 2020

Abstract

:
Crashes among young and inexperienced drives are a major safety problem in the United States, especially in an area with large rural road networks, such as West Texas. Rural roads present many unique safety concerns that are not fully explored. This study presents a complete machine leaning pipeline to find the patterns of crashes involved with teen drivers no older than 20 on rural roads in West Texas, identify factors that affect injury levels, and build four machine learning predictive models on crash severity. The analysis indicates that the major causes of teen driver crashes in West Texas are teen drivers who failed to control speed or travel at an unsafe speed when they merged from rural roads to highways or approached intersections. They also failed to yield on the undivided roads with four or more lanes, leading to serious injuries. Road class, speed limit, and the first harmful event are the top three factors affecting crash severity. The predictive machine learning model, based on Label Encoder and XGBoost, seems the best option when considering both accuracy and computational cost. The results of this work should be useful to improve rural teen driver traffic safety in West Texas and other rural areas with similar issues.

1. Introduction

Teen drivers are at greater risk than any other drivers on the highway system in the United States, especially in the areas like West Texas with large rural road networks. According to the Texas Department of Transportation (TxDOT), the number of crashes in the West Texas rural regions has been significantly increasing in the past years (11,652 in 2016, 12,801 in 2017, and 14,609 in 2018). Among them, around 23% on average are involved with teen drivers, which is disproportionately higher than other age driver groups [1].
Rural roads commonly have unique hazards that include different geometric and access properties than urban roads, such as increased speed limits, less cover against adverse weather, an increased association with driver alcohol use, longer trip lengths, less enforcement and use of safety devices, underage driving in farm communities, and more [2]. The problem is often made severe for teen drivers, since they are particularly vulnerable to hazards on rural roads. This vulnerability is because teen drivers are typically immature and lack safe driving habits. They are less likely to wear safety restraints and more likely to speed, drive late at night, drive impaired, and transport teenage passengers [3].
In order to address rural teen driver safety issues, which has been raising public concerns recently, factors contributing to these problems need to be identified. It makes significant sense that an understanding of how the number of teen driver crashes might be reduced begins with an understanding of how they happened. In this article, machine learning approaches are used to analyze factors that affect the occurrence of teen driver crashes and resulting severity. A complete machine learning pipeline has been conducted from collecting/cleaning data, performing exploratory data analysis, and formulating a real-world problem into machine-learning predictive models. The study is performed in two steps:
  • Step 1: Firstly, perform an Exploratory Data Analysis (EDA) on the collected dataset. The purpose of performing this EDA is to first to explore the collected raw dataset by using methods from descriptive statistics and data visualization. This EDA is done without any pre-conceived notions or hypotheses, and the results of this exploration is used to guide and to identify the factors in the subsequent machine learning (ML) models. Remove any features that are not related to crash severity by nature and any features with a large percentile of “no-data” or “missing data”. Also remove features with notable positive correlation (e.g., object stuck and first harmful event, etc.). Lastly, select features based on the existing literature on crash severity and teen crashes and your best engineering judgement.
  • Step 2: By performing data dimensionality reduction in the first step, build four machine learning models to identify the most important factors associated with the severity of crashes on rural roads and predict crash severity using these identified factors. Approach the problem as a multivariate regression problem and predict the severity of the crash based on the collected crash dataset.
The rest of the paper is organized as follows: Section 2 gives a thorough view of various literatures about teen driver crash severity and machine learning approaches applied in this area. Section 3 highlights the data collection/filtering process for this research. Section 4 performs an exploratory data analysis and the results from easily understandable visual presentations. Section 5 ranks the importance of factors on crash severity and building four machine learning models on crash severity prediction based on the teen driver crash data in rural West Texas alone. In the last section, a conclusion is discussed.

2. Literature Review

Crash severity analysis is an important and widely studied area in safety research. Past studies are usually focused on two important topics: (1) identification of risk factors associated with crash injury severity and (2) prediction of crash injury levels from the identified contributing variables.
In the first area, researchers in the past have investigated various factors that are contributing to crashes involved with teen drivers, such as speeding [4,5], distracted driving [6,7], driver age and gender [8,9], risky behavior [10], impaired driving [11], night-time driving [12], and peer passengers [13,14]. In the second field, many researchers have developed prediction models on crash severity, which can be generally divided into two groups: parametric models and nonparametric (or machine learning) methods. In crash severity analysis, the dependent variable is discrete, with multiple categories corresponding to different crash severity levels (for example, in this study, or in the TxDOT Crash Records Information System (CRIS), crash severity is defined with the KBACO scale: K: Killed, A: Incapacitating injury, B: Non-incapacitating injury, C: Possible injury, O: Not injured). Since crash severity levels can be considered as either nominal or ordinal variables, different types of statistical modeling techniques for nominal variables can be applied, such as multinomial logit (MNL) models (for example, investigating the impact of road features on crash injury severity [15], examining the impact of alcohol and drug use cyclist injury severities [16], and analyzing the severity of large-truck-involved crashes [17]) and ordered logit (OL) models (for example, investigating the impact of rural highway geometric features on crash injury severity [18], comparing the severity of freight-involved crashes and non-freight crashes [19], and finding the impact of contributing variables on the severity for highway-rail crossing crashes [20]).
It should be noted that parametric models need some model assumptions and pre-defined relationships between dependent and explanatory variables, which restrict their application when the assumptions are violated [21]. Meanwhile, nonparametric or machine learning methods usually do not require such assumptions and can identify and present underlying knowledge in large datasets with diverse variable categories without priori model assumptions or predefined relationships. This makes machine learning approaches particularly useful for traffic safety data analysis. The machine learning technologies applied in the past research include: Random forest [22,23], SVM (Support Vector Machine) [24,25], neural networks [26,27], and XGBoost [28].
Some scholars also performed comparison studies on these two kinds of approaches. Their studies consistently show the advantages of machine learning approaches over traditional statistical modelling methods. For example, Wang and Kim performed a comprehensive comparison between discrete models and tree-based models [21,29].
As discussed previously, rural roads are particularly dangerous to teen drivers due to geographically isolated rural areas and longer travel distances within rural communities. Combined with inexperience and risky driving behaviors of teen drivers, the situation becomes even more serious, and a comprehensive analysis of teen driver crashes on rural roads is necessary. Texas has one of the largest rural road networks in the nation (nearly 57,000 centerline miles and over 128,000 lane miles of state highway in rural areas, including 50,000 miles of farm-to-market (FM) roads). Therefore, we perform a case study in West Texas rural areas in this study.
The major contribution of this study is to conduct a systematic and panoramic machine learning methodology from collecting, cleaning, and coding crash data, performing a comprehensive exploratory data analysis, identifying the effect of factors contributing to the injury severity, and formulating four machine learning models on crash severity prediction. We use West Texas rural teen driver crash data as an example case. The research findings are helpful to better understand teen driver crashes and reduce teen driver injury severities by adopting effective solutions in West Texas or any other rural areas facing similar issues.
It is worthy of note that the proposed methodology has no any specific geospatial coverage limit and could be applied to many other areas facing similar safety issues. The proposed method can also be applied to other driver groups, such as adults or elderly drivers. The authors hope that other researchers could benefit from this study by applying this systemic approach to their own crash data set and hence better understand their own safety issues. In addition, we compared the performance of four ML models in terms of data coding methods, accuracy, and efficiency. We believe these comparisons could provide some insightful ideas for other researchers when they choose an appropriate ML method to process their own crash dataset, particularly to select data coding methods.

3. Data Collection

3.1. Study Area

West Texas is a loosely defined part of the US state of Texas, generally encompassing the arid and semiarid lands west of a line drawn between the cities of Wichita Falls, Abilene, and Del Rio [30]. Although there is no consensus on the boundary between East Texas and West Texas, we included five geographical TxDOT districts in this definition based on four principal metropolitan areas: Lubbock, Abilene, Midland/Odessa, and San Angelo, as highlighted in the map of Figure 1. Considering the huge binational border crossing transportation activities between the US and Mexico, we don’t include the TxDOT El Paso district in this West Texas focused research. The Lubbock district sponsored and managed this teen driver safety research as the home base for the researchers.

3.2. Crash Data

TxDOT maintains a statewide automated database for all reported motor vehicle traffic crashes received from the department of public safety, which is called the Crash Records Information System (CRIS). The CRIS database contain many attributes of crashes, such as crash identifier, crash date/time, location, facility, crash characteristics, human factors, environmental variables, and vehicle characteristics. Users may obtain publicly available crash data through the TxDOT’s CRIS Query tool. This application allows public users to query, extract, and/or analyze publicly available crash data. In this study, this Query tool was used to firstly collect the crashes with the rural area flag in the selected five TxDOT districts during the period of 2010 to 2018, and then filtered them to get the rural crashes involved with teen drivers only (aged from 15 to 20). Note that we included the drivers of age 20 to represent the teen driver group with longer trip distances on rural roads. Finally, we have collected 8859 teen driver crashes in rural West Texas. The detailed descriptions of the collected data can be found in Table A1.

4. Exploratory Data Analysis (EDA)

A comprehensive EDA was performed for the collected rural teen driver crash data in three stages. The first stage was all about the detailed analysis of the causes of teen driver crashes, nature, and class. The second stage was about the trend analysis related to teen driver crashes, and the third stage focused on the demographics of teen drivers involved with the crashes. Finally, we applied the EDA for dimensionality reduction to the raw data so that further processing could be accomplished by great reducing the computational cost of the developed machine learning models.

4.1. Analysis of Major Causes

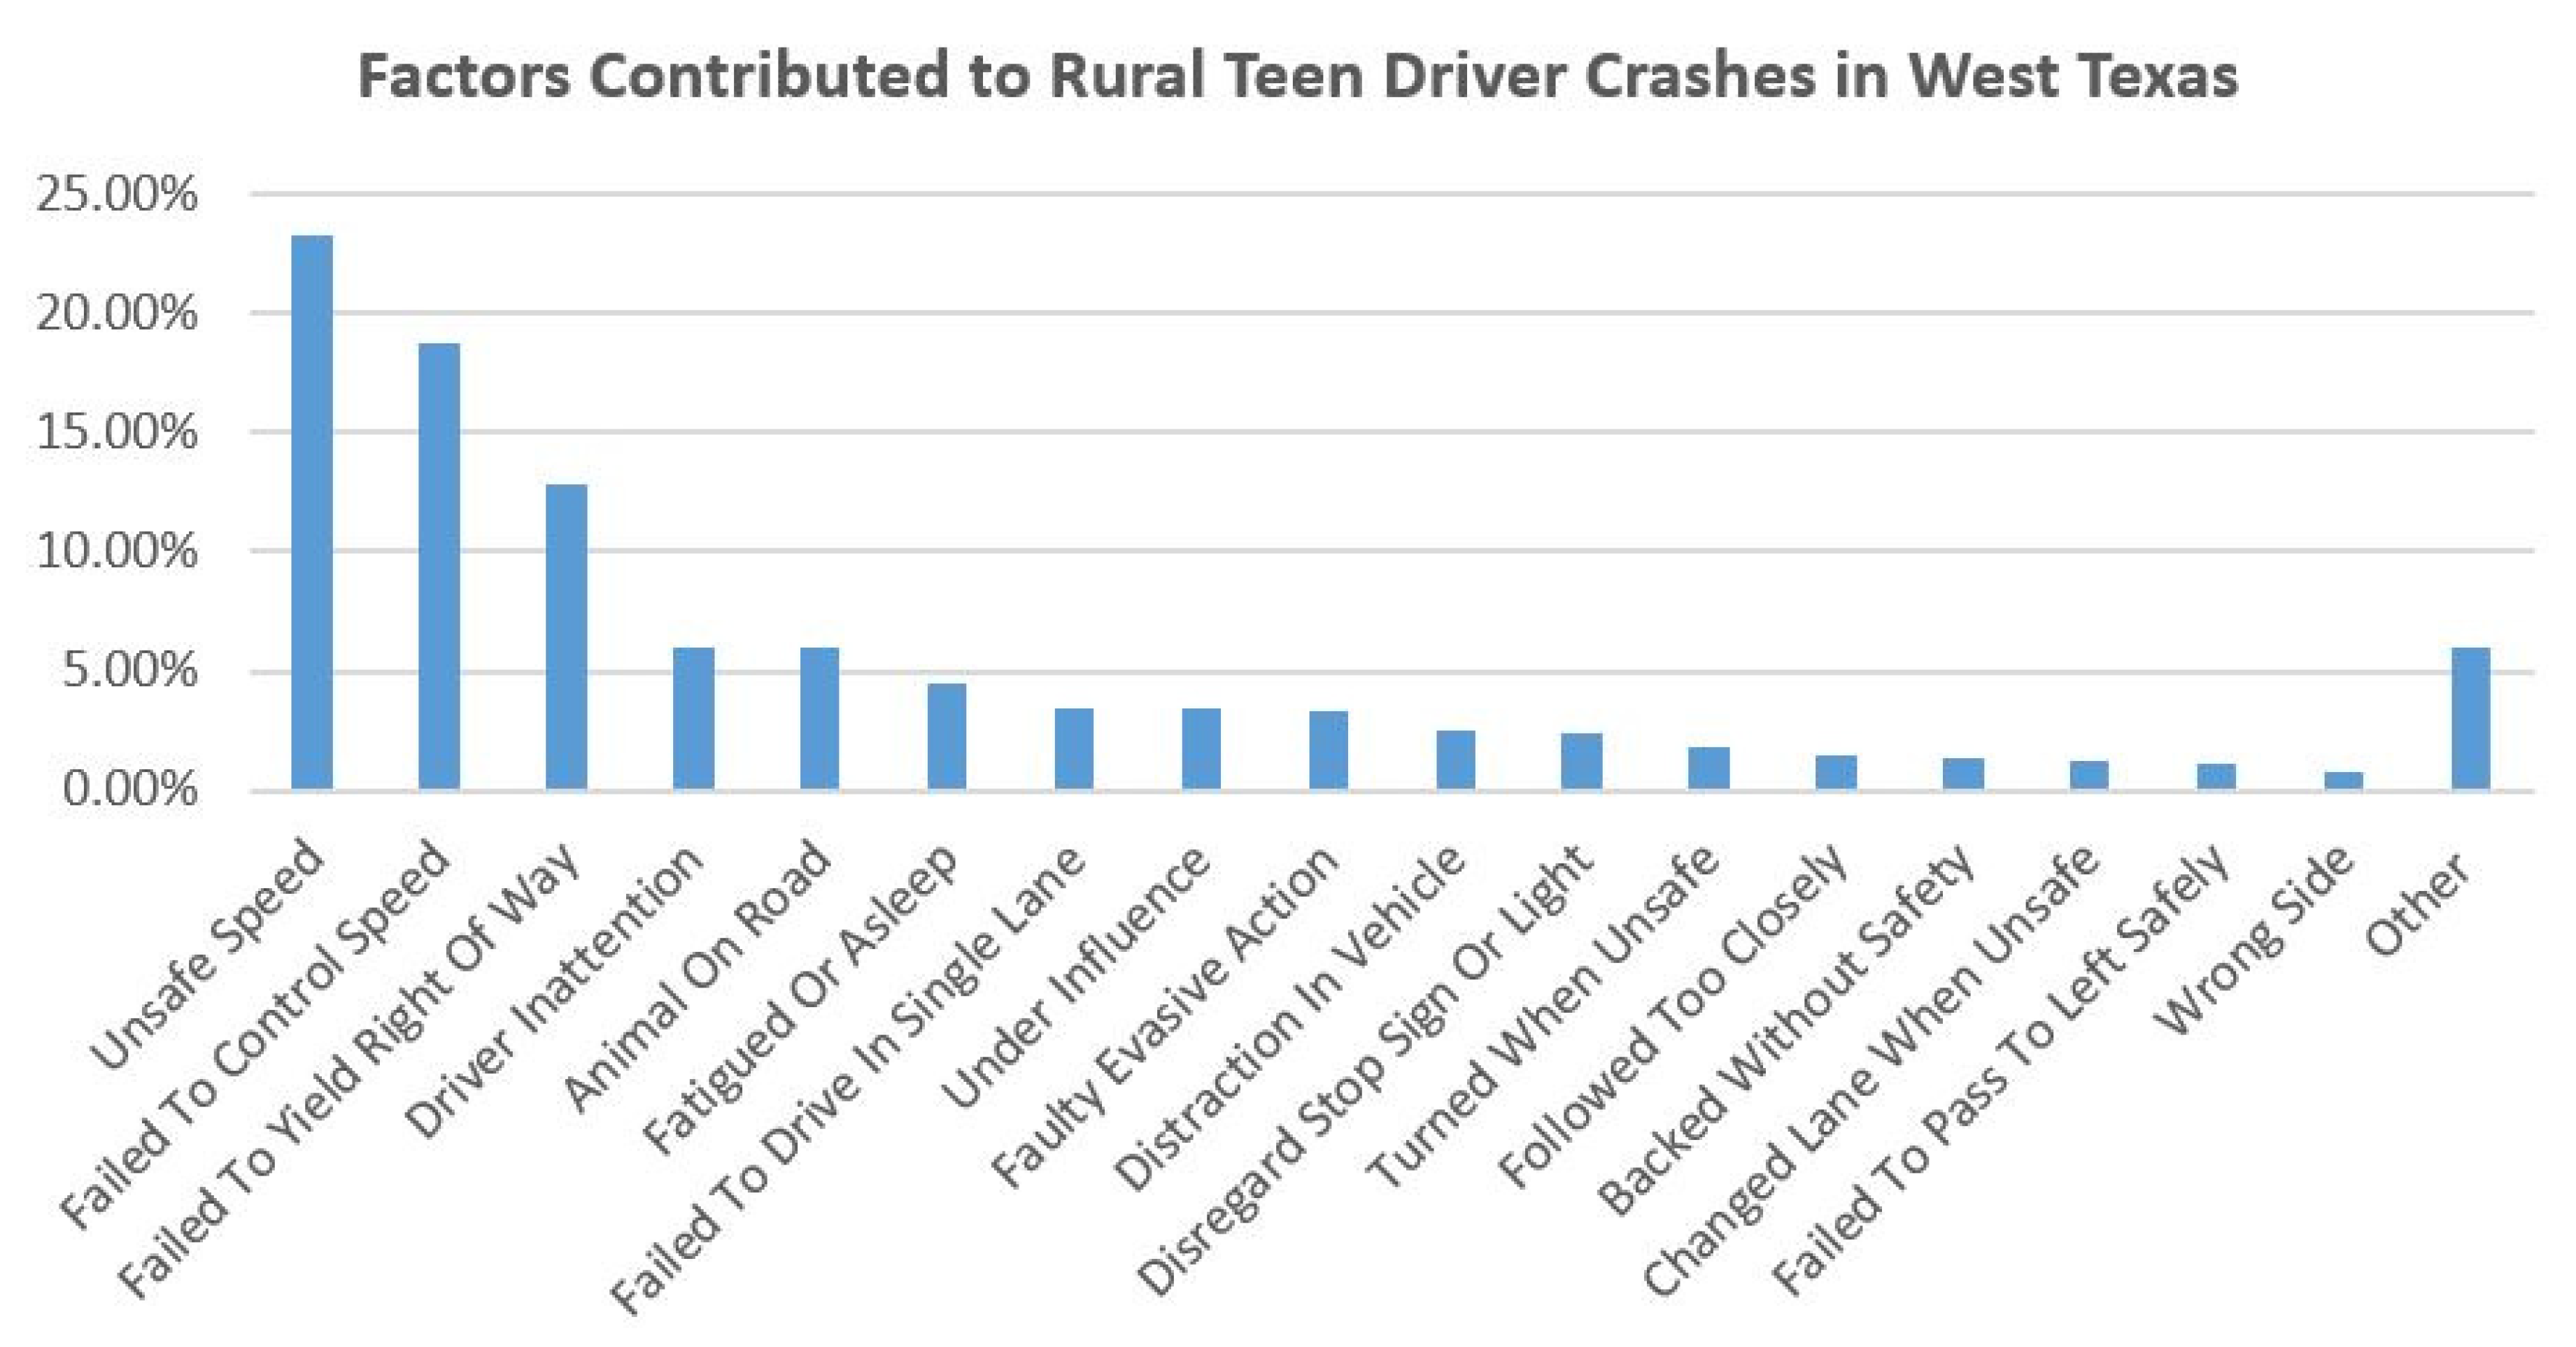
As observed in Figure 2, the major causes of teen driver crashes in rural West Texas are: unsafe speed (23%), failure to control speed (19%), failure to yield right of way (13%), driver inattention (6%), fatigue or sleep (5%), and animals on roads (6%). Other minor causes are mainly about risky driving behaviors, such as turning or changing lane when unsafe, following too closely, and backibg without safety, etc.
It is evident that speeding appeared to be the most important cause of teen driver crashes in West rural Texas regions (nearly 42% of crashes occurred due to high speed of the vehicle (unsafe speed and failure to control speed)). The yearly number and causes of teen driver crashes in West Texas rural areas can be found in Table A2.
Speeding increases the stopping distance of the vehicles while reducing reaction time to avoid a potential collision. It also increases the likelihood of injury in a crash. There is also evidence from naturalistic driving studies that teens’ speeding behavior increases over time, possibly as they gain confidence. In general, they take more risks than adults and are more likely to involve speeding, which becomes more prevalent when driving on rural roads in West Texas at night or with other teen passengers on board. The problem is even worse since Texas has the highest speed limit on its rural highways in the nation (75 mph is a common speed limit setting and 80 or 85 mph will be allowed if the highway is designed to accommodate that speed.) It should also be noted that not all speed-related teen crashes are due to intentional risk-taking. Instead, most are caused by inexperience of teen drivers and a lack of driving skills. Teens or new drivers need to be educated on speed management based on traffic and road conditions and keep a safe distance from other vehicles.
The second important cause is mainly related to the improper driving behaviors of teen drivers in West Texas: failure to yield right of way and being distracted while driving (roughly 19% of the total crashes). In some cases, teen drivers of rural West Texas failed to yield to other vehicles while they were merging into the interstate highway, which resulted in crashes. A merging vehicle is usually required to execute a lane-changing maneuver along a limited length of a merge lane, which requires a good control while timing the merging and possesses a high chance of collision [31]. Therefore, teen drivers might not be experienced enough to perform the maneuver properly and get involved in crashes. Additionally, teens’ inexperience behind the wheel makes them more susceptible to distraction of electronic devices or passengers in the vehicle.
The third important cause is from the unique hazards on rural roads: fatigue or asleep and animals on the road, which accounts for 11% of the overall crashes. One major concern for teen drivers on rural roads is highway hypnosis. Many rural highways in Texas consist of long, straight roadway sections. This fact, coupled with the propensity for teens to drive late at night, is a likely explanation for high fatal crash counts during night hours in Texas. Highway hypnosis can occur when drivers operate vehicles for extended periods of time in monotonous surroundings, entering a dulled and drowsy state. Low light and lack of sleep can contribute to the issue [2]. Additionally, in West Texas, animal crossings are common in rural terrains. Teen drivers often carelessly endanger themselves by overlooking the unforeseen hazards from animals. Wild animals, such as deer and domestic animals, escape from farms or ranches and dash into oncoming traffic. Inexperienced teen drivers often overcompensate when trying not to collide with the animal and, in fact, cause a collision. Other environmental issues coinciding with rural road animal accidents include lack of lighting and obstructions to visibility. It is important to teach teen drivers to be more cautious in areas with low visibility, more animals, and higher volume of slow-moving vehicles, such as farm machinery, in West Texas regions in the safety education program [2].
It is noted that driving under the influence is a minor cause for teen driver crashes in West Texas (only about 3% of the overall crashes). According to the National Highway Traffic Safety Administration (NHTSA), in 2016, alcohol-impaired driving crashes accounted for 18% of drivers involved in fatal crashes in the age group from 16–20 [32]. This indicates that the current Texas alcohol regulation that bans anyone under the age of 21 to purchase or consume alcohol successfully reduced the occurrences of teen driver alcohol-related crashes in West Texas.

4.2. Analysis of Trends

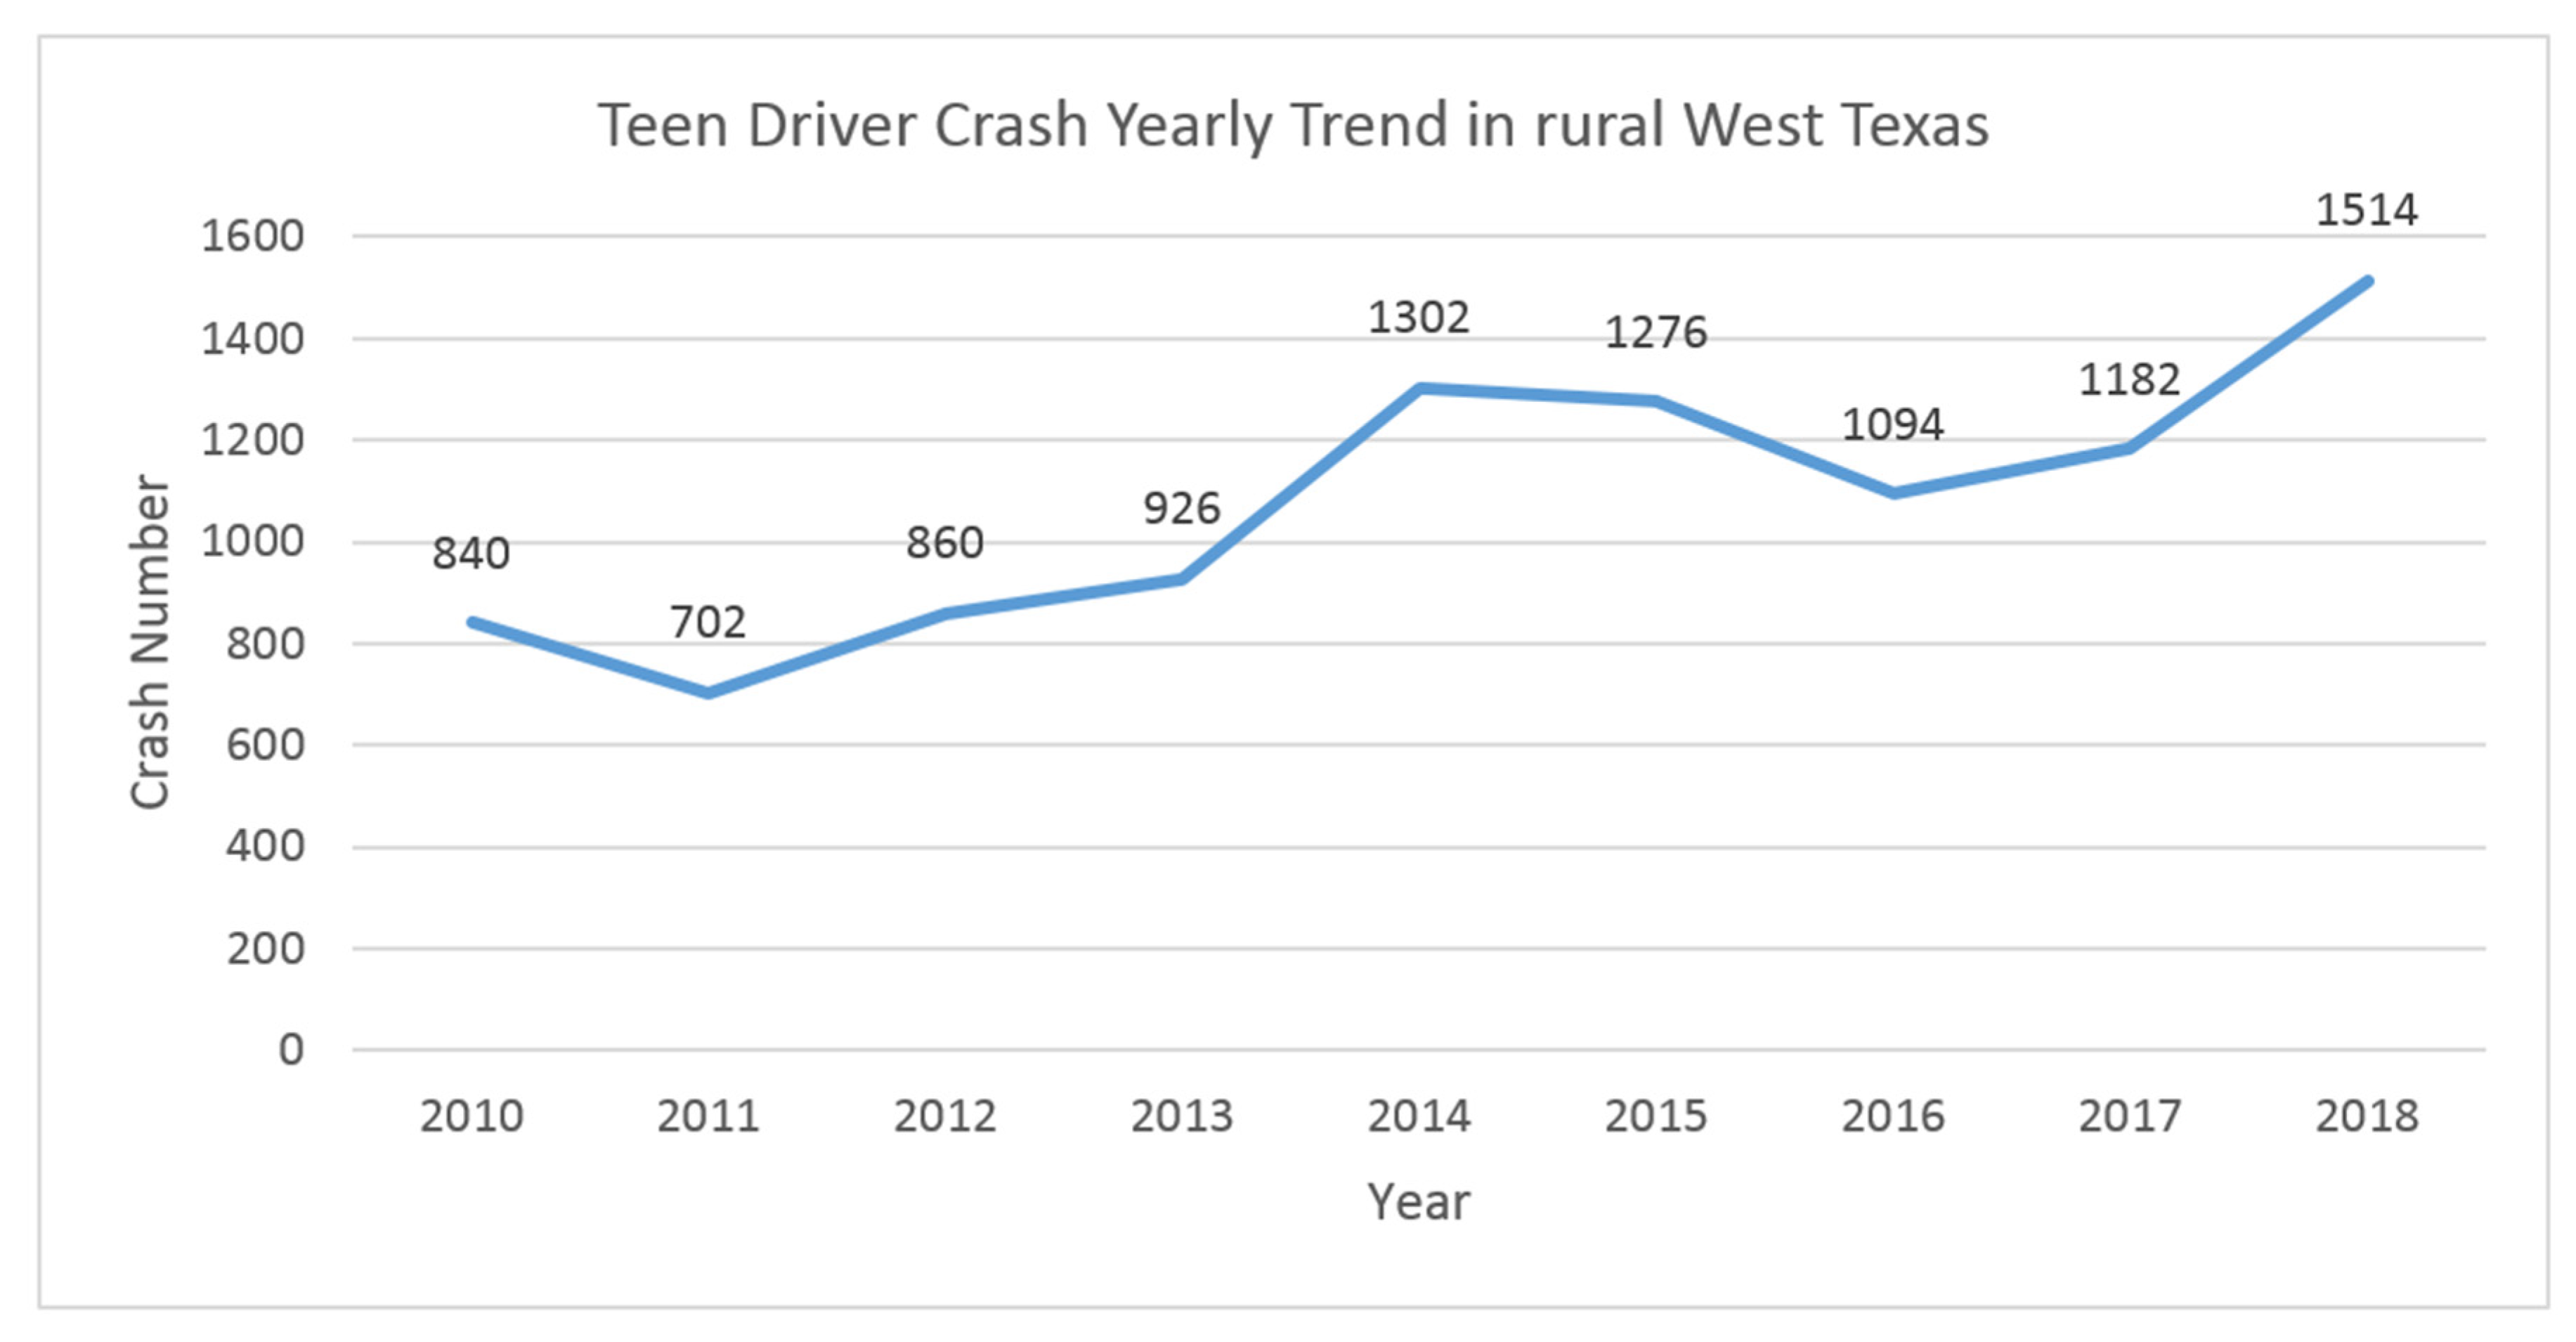
As overserved in Figure 3, the number of crashes involved with teen drivers in West Texas has experienced an overall increase in trend in the past nine years. The number almost doubled in 2018 compared with the number in 2010. However, according to a national study that examined the teen driver crash data in the entire 20-year period from 1994 through 2013, a substantial downward trend was presented in crash involvements of teen drivers [33]. In this regard, great efforts are needed to be devoted exclusively to teen driving safety in West rural Texas.
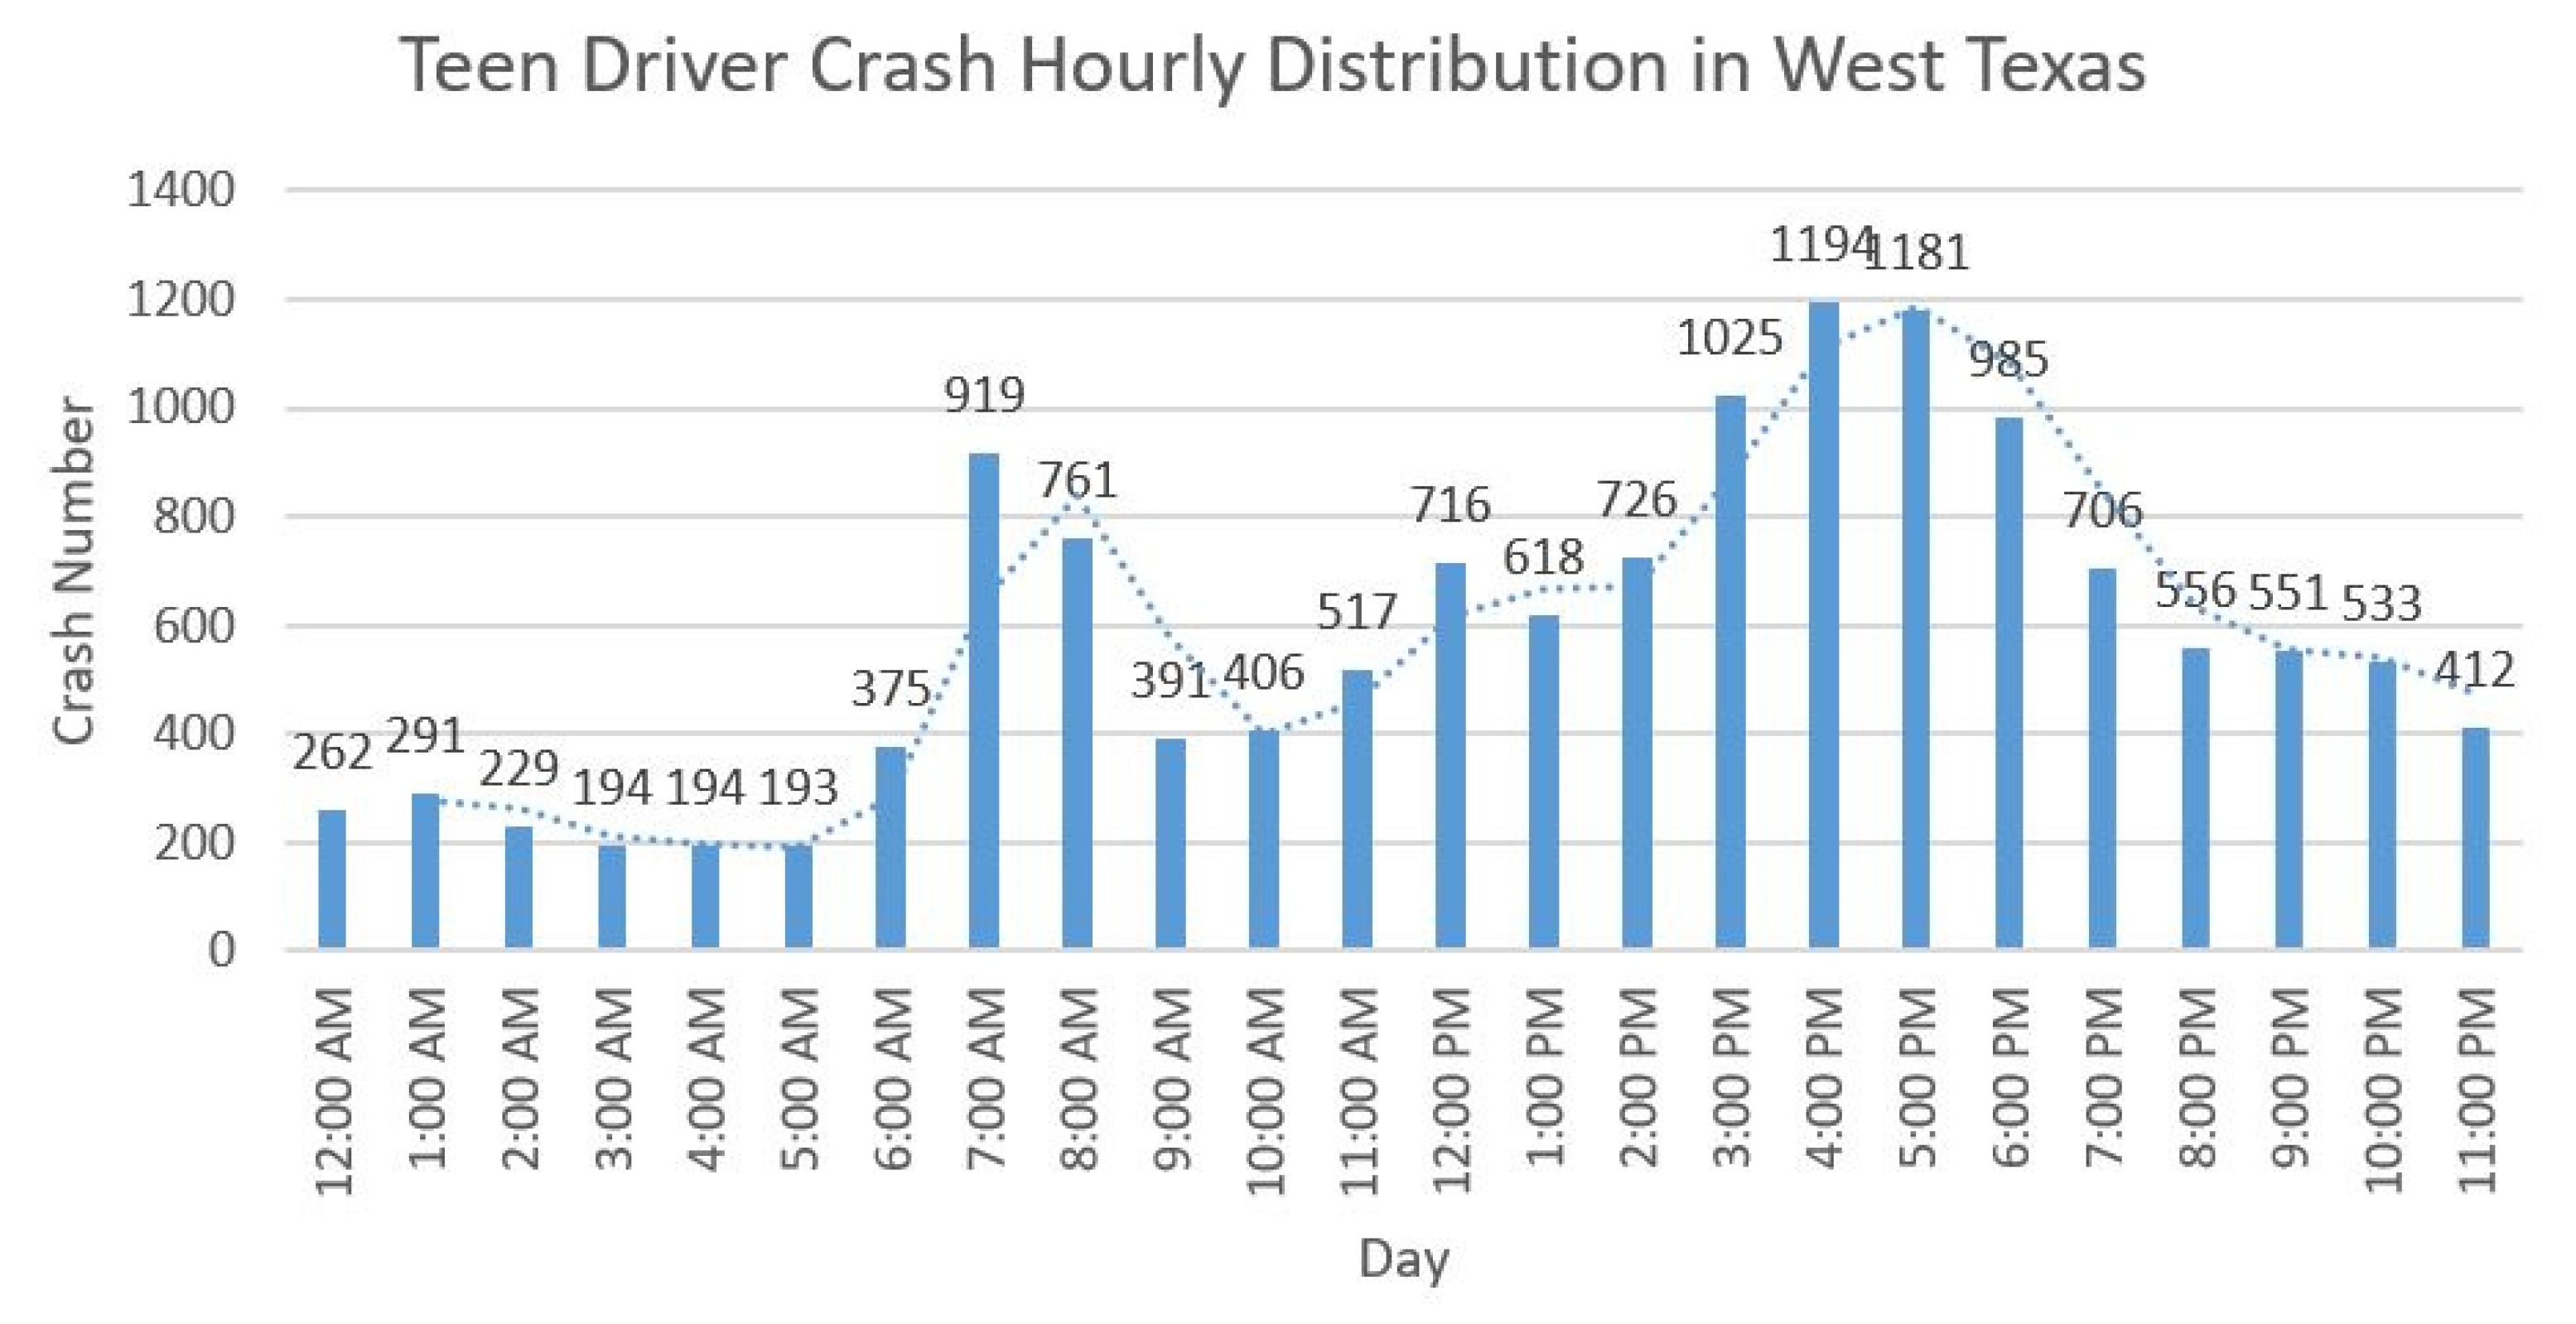
Additionally, as observed in Figure 4, there are two daily peaks for the occurrence of teen driver crashes on rural roads in West Texas: 7:00 to 8:00 in the morning and 16:00 to 17:00 in the afternoon. The researchers originally linked these two peaks with the daily peak hour traffic. However, these trends have not been found for other age driver groups. The researcher assumed that these two peaks are associated with teen driver traffic at school starting and ending time.

4.3. Other Exploratory Analysis

Other analyses were also performed to find the demographics of teen drivers and crash natures. As shown in Figure 5, male teen drivers were more likely to be involved in crashes than their female peers in rural West Texas (60% vs. 40%). In different ages, the occurrence trend of crashes was almost equally distributed (except the age of 15, only accounting for 2%). From the aspect of ethnicities, the majority of teen drivers were White and Hispanic, which was consistent with the demographics of residents in West Texas (almost 90% in total). As for the levels of crash severity, more than two thirds of the crashes did not end in injury. About 4% of teen drivers were involved with crashes with serious injuries and 1% were involved with fatal crashes, which was much lower than the average level of teen fatal crashes in the nation. In 2017, teen drivers involved in fatal crashes were 3225 in the nation, which was about 8% of total crashes [34].

5. Factor Identification and Predictive Models

Predictive analytics is defined as finding patterns in data and predicting values in future trends and outcomes by using those patterns. Moreover, machine learning techniques have become more popular in accomplishing predictive analytics due to their exceptional usage in managing large scale data in recent years. In addition to the EDA, in this study, we built several machine learning models to rank the important factors associated with the severity of crashes and performed crash severity prediction using these identified factors from the EDA. The machine learning process was implemented using Python and the related Python data learning libraries, such as Pandas and SKlearn. The detailed steps are described as follows:
Step 1: W Cleaned and filter raw crash data from the CRIS. “No data” and “Unknown data” of crash severity are filtered out of the dataset. Choose the features based on the previous EDA and remove the features with the large percentile of missing data. In the end, we obtained 8859 valid crash records during the period of year 2010 to 2018. Each crash record had 46 features about the characteristics of crash, teen driver, vehicle, road, and driving environment.
Step 2: Since most of the features in the crash dataset are categorical, encode categorical data to numerical data for further construction of predictive models. Use two encoders that are available in the Python Sklearn library: label encoder and one hot encoder.
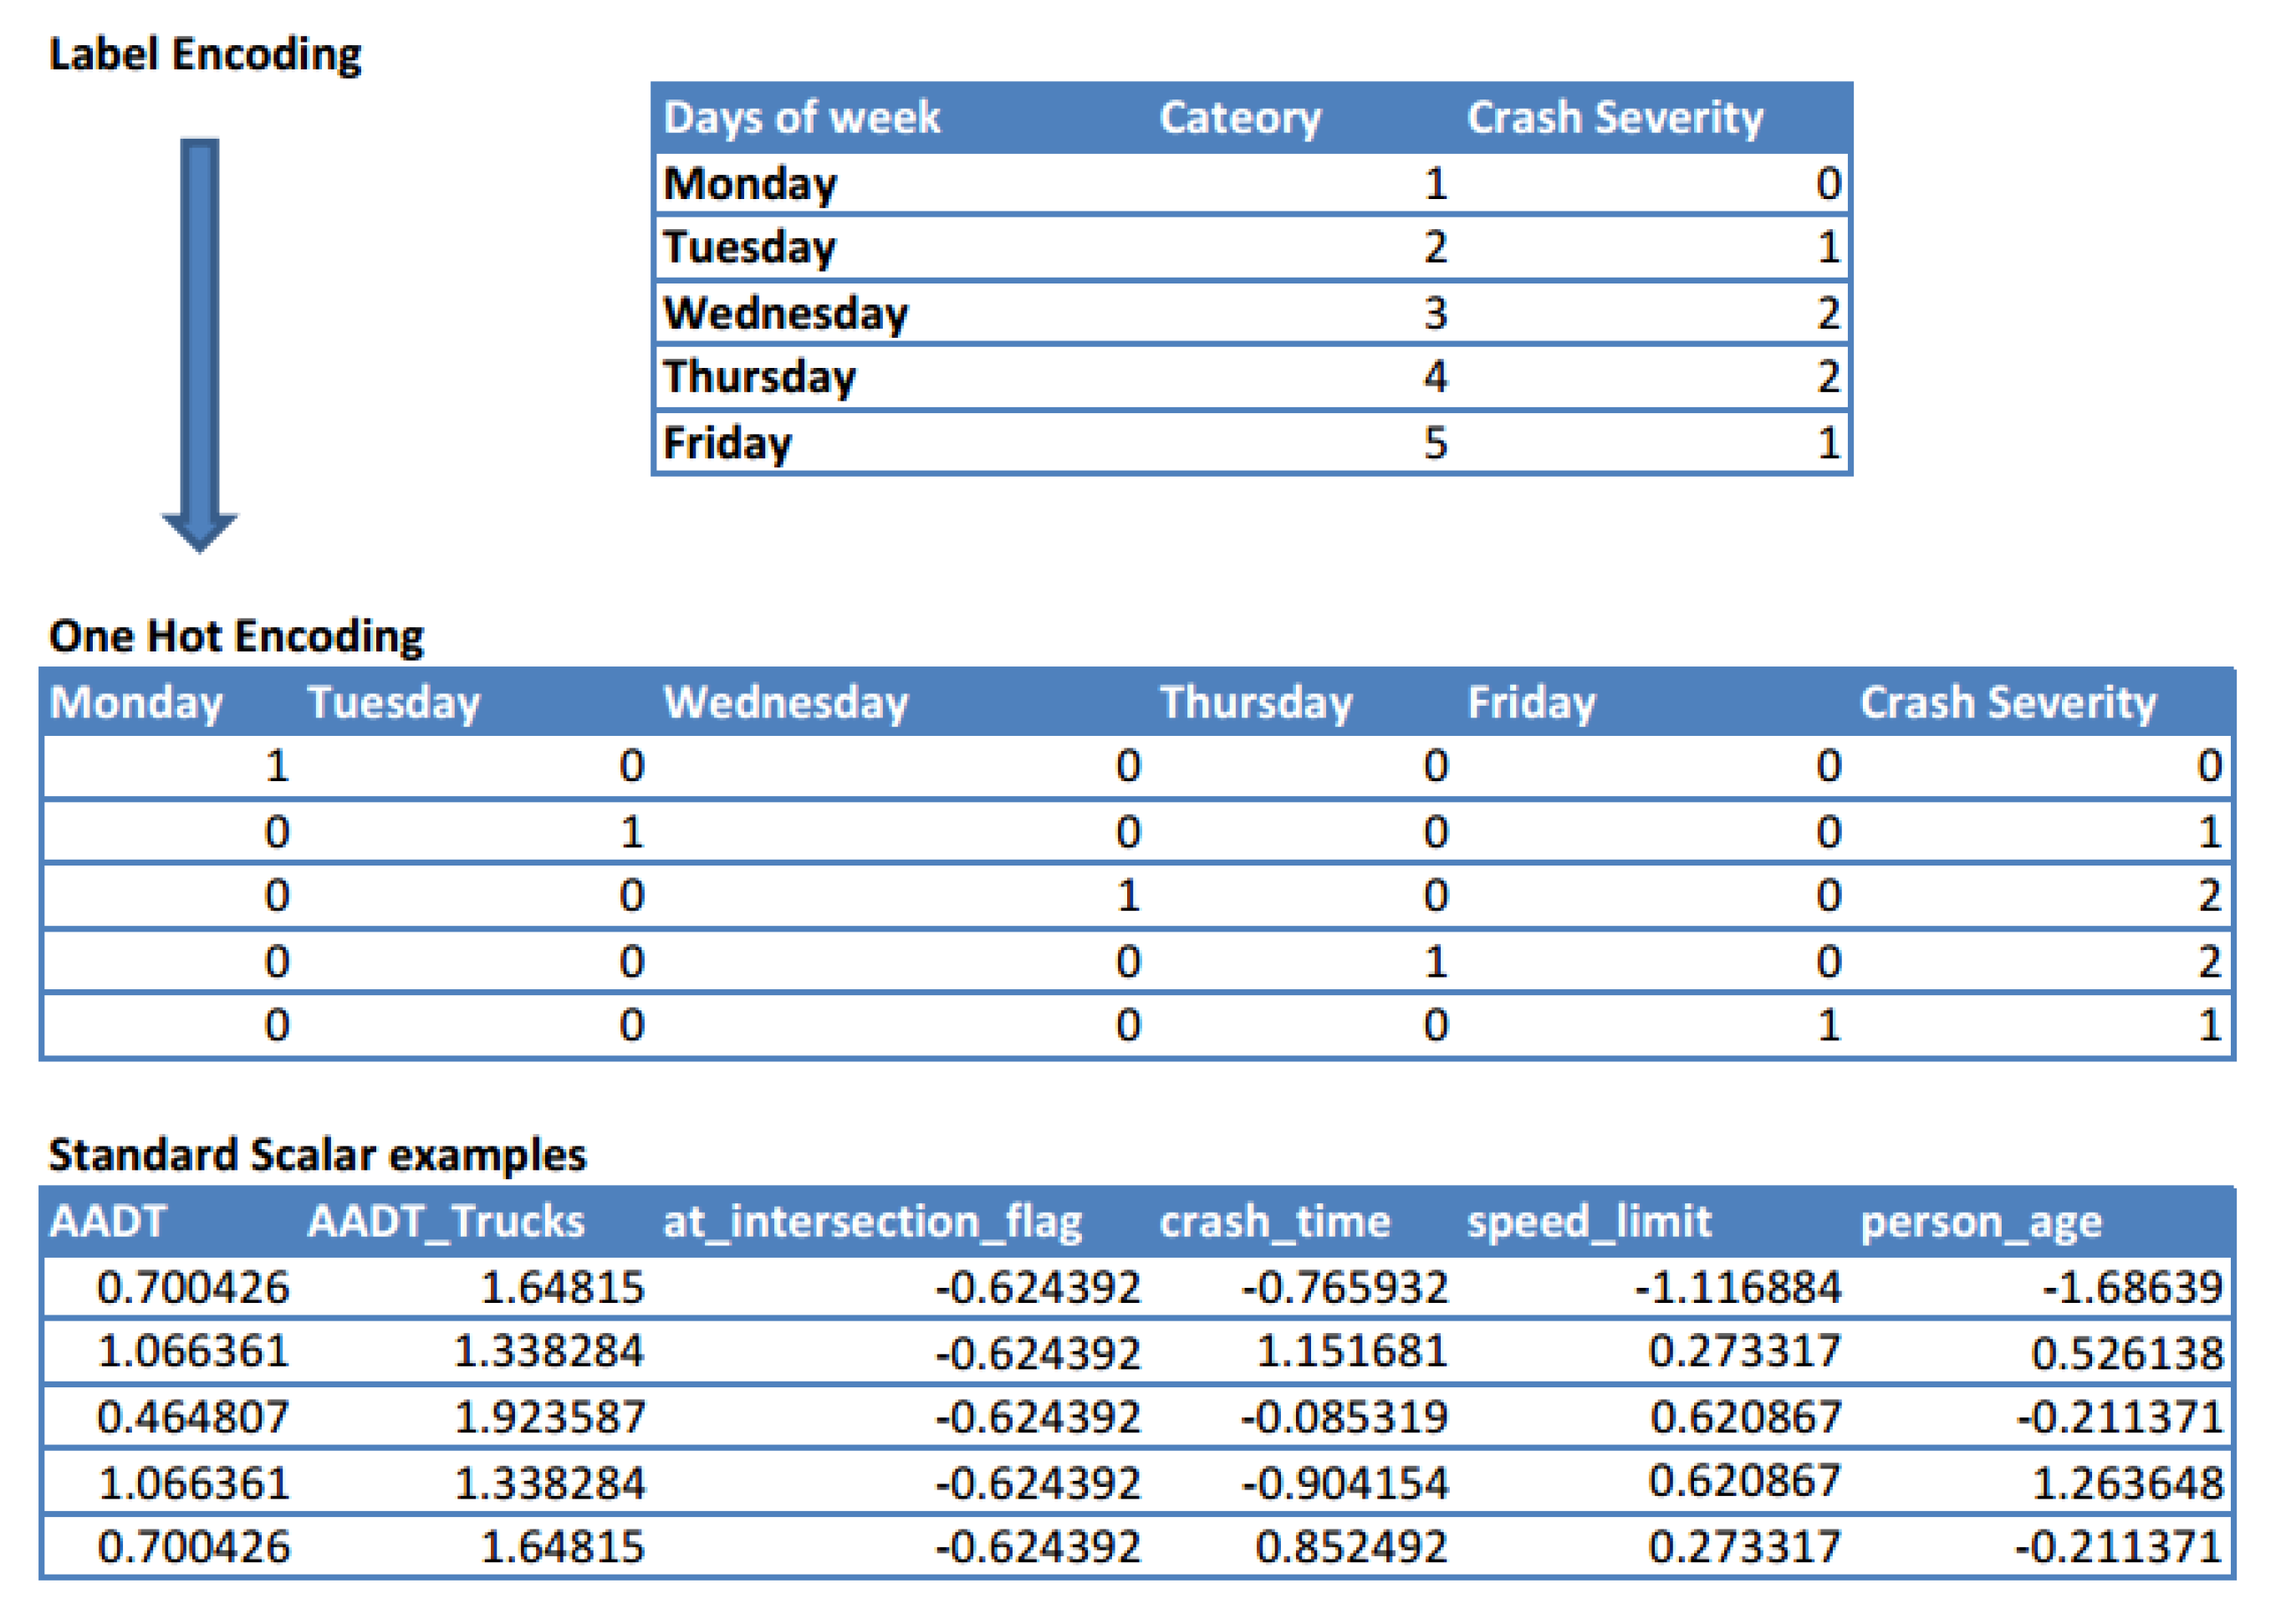
Label encoder assigns a non-repeat numerical value to each category in the data type of object. However, one weakness of the label encoder is that, by assigning different values to different categories, it gives an order to all categories, even though all categories are weighted equally and have no relationships between each category. One hot encoder splits one categorical feature into a binary sparse matrix. For example, in the categorical feature “Day of the week”, there are seven different values representing each day of the week. One hot encoder splits the feature into a binary matrix with seven columns, where 1 represents true and 0 represents false for the value in each column. The differences between these two coding methods are illustrated in Figure 6.
After encoding the data, all data should be numerical in all cases, but the values of some continuous features are in large numbers by nature (such as the average daily traffic), which means it may have a higher impact on prediction than other features. Standardize all continuous features so that all variability is measured at the same scale. We used the Standardscaler function in the SKlearn library to normalize all the features in the dataset. The standard scalar examples are also shown in Figure 6.
Step 3: With the encoded and scaled data, start building predictive models for crash severity prediction. Here, approach the prediction as a multivariate regression problem and choose Random Forest (RF) and XGBoost as predictive methods. We also used the Python SKlearn library to implement the selected algorithms.
Random Forest is an ensemble machine learning algorithm that is used for classification and regression problems. It employs the decision tree algorithm for parametrization, but it mixes a sampling procedure, a subspace technique, and an ensemble tactic to optimize the model building. Bootstrap is the name of the sampling method, which uses a random sampling tactic with replacement. The subspace technique also takes a random sampling method, but it assists in removing smaller subsets (i.e., subspaces) of variables. The overfitting problem in decision trees is corrected in random decision forests by providing manifold. Use trained decision tree algorithms for the testing stage [21]. This property makes the RF preferable over the regular decision trees algorithm, since it was the most popular machine learning algorithm amongst data scientist until XGBoost took over.
XGBoost is an optimized distributed gradient boosting library, designed to be highly efficient, flexible, and portable. It implements machine learning algorithms under the gradient boosting framework. XGBoost provides a parallel tree boosting, also known as GBDT (Gradient Boosting Decision Tree), GBM (Gradient Boosting Machine), which solves many data science problems in a fast and accurate way. It has recently been dominating applied machine learning for structured or tabular data [28].
Since we had two predictive algorithms, combined with the two coding methods, we built four models for the crash severity perdition: Model 1 (one hot encoder/Random Forest); Model 2 (one hot encoder/XGBoost); Model 3 (label encoder/Random Forest); and Model 4 (label encoder/XGBoost).
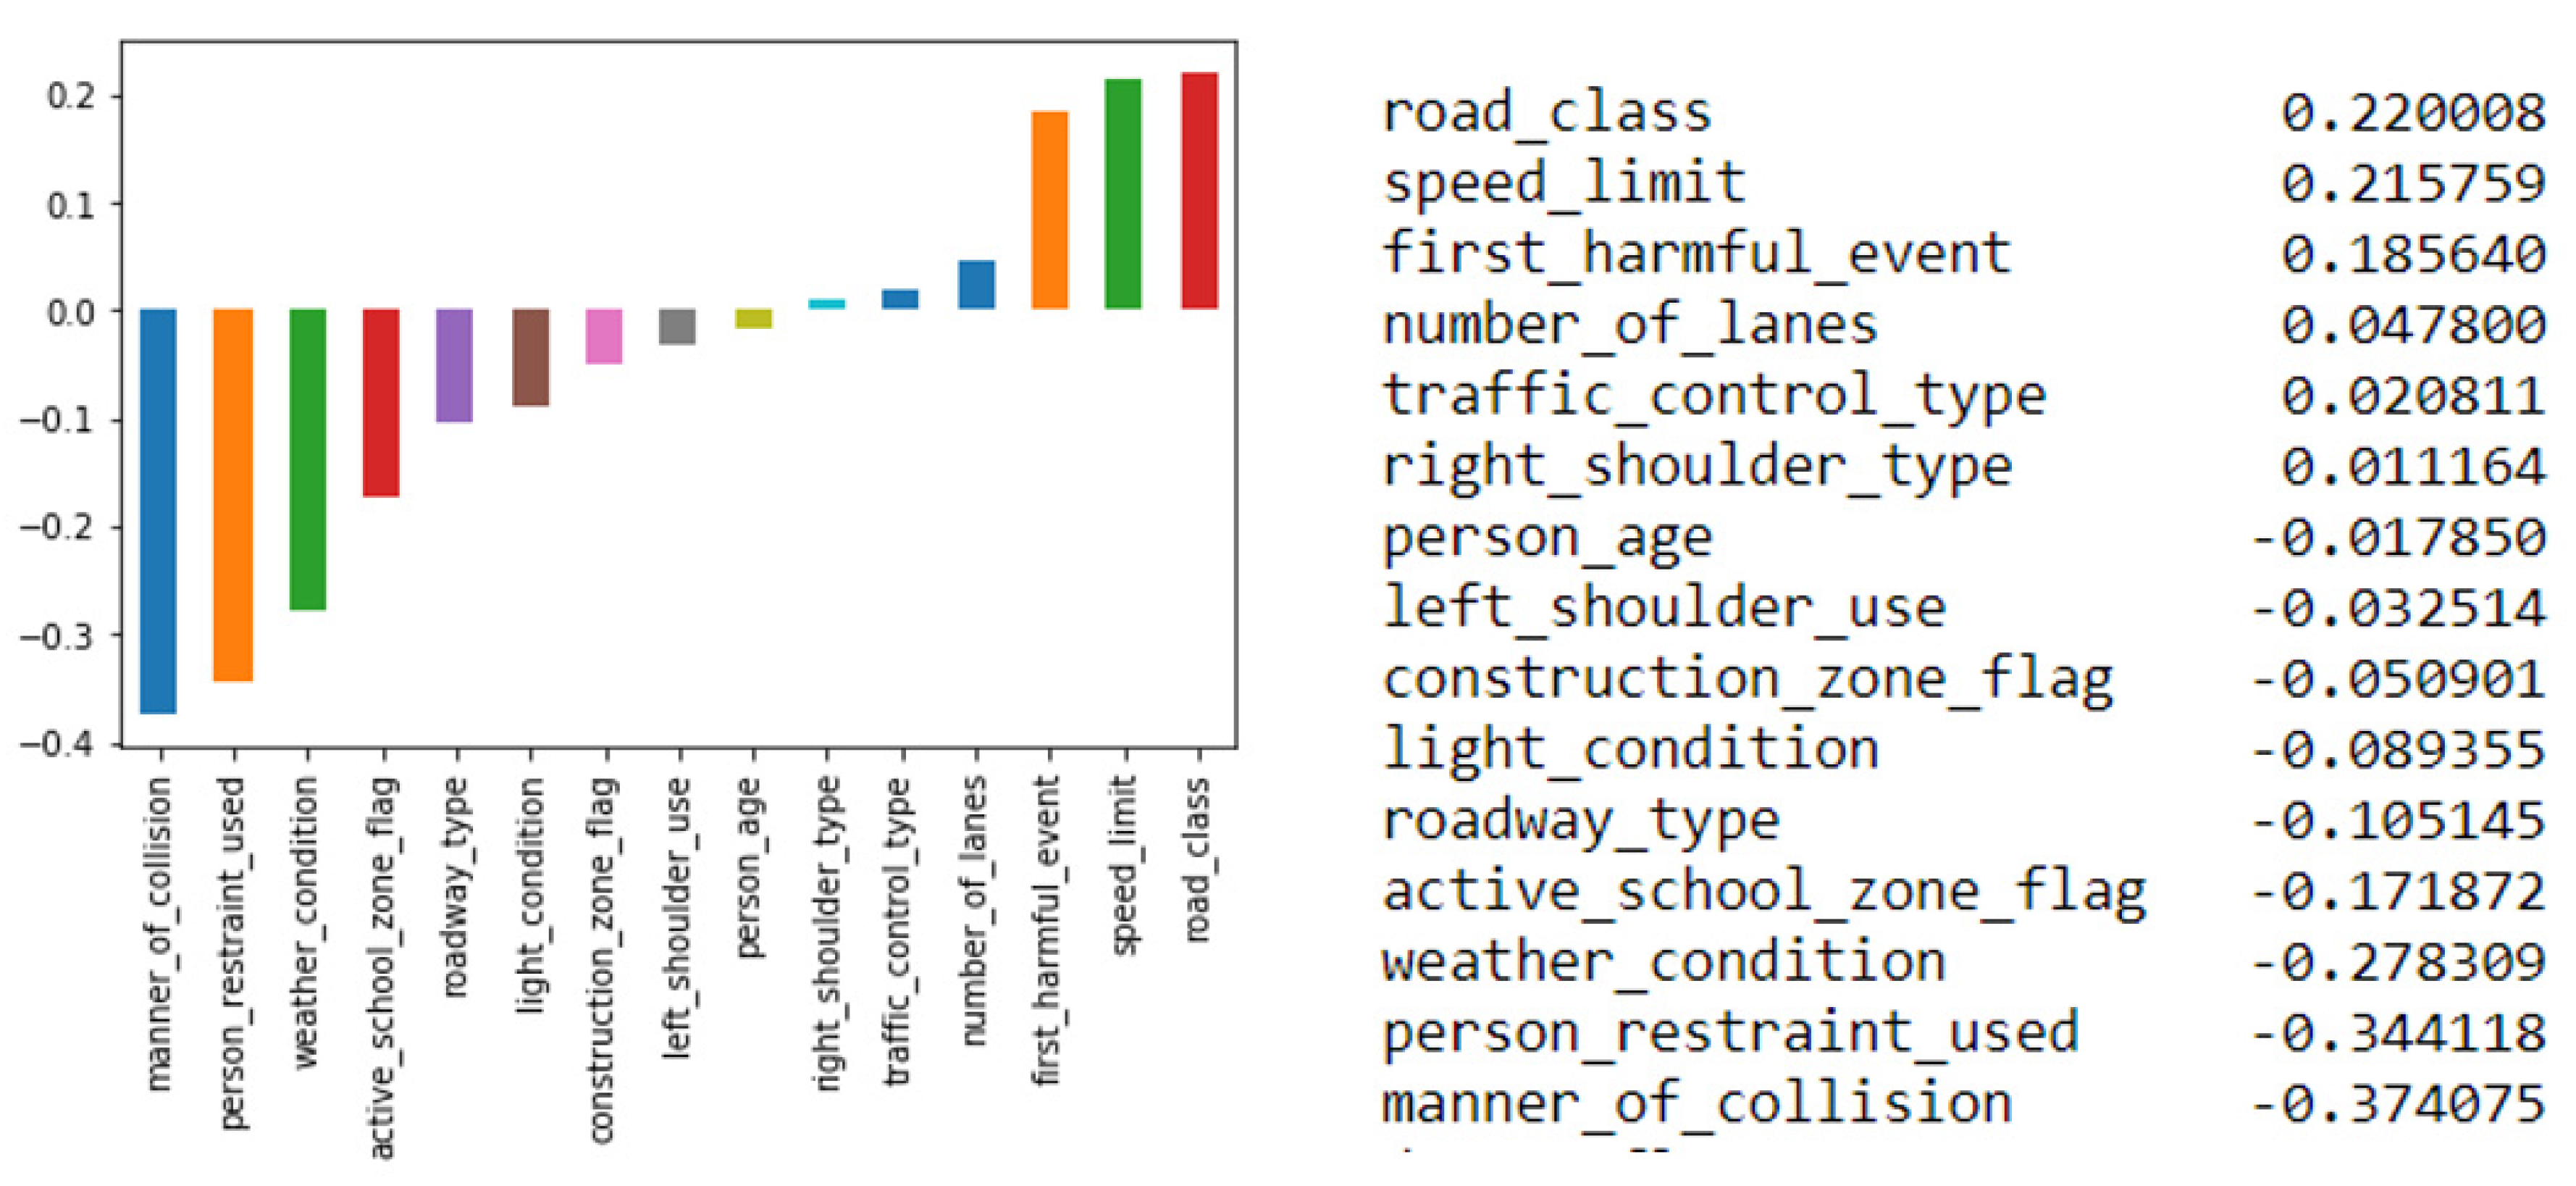
Step 4: In this step, apply the four models to the West Texas rural teen driver crash dataset. The dataset is randomly split into training and testing datasets (75%/25%) to avoid any bias from the data itself. Finally, obtain the feature importance graph (as shown in Figure 7) and compare the performance measures in both accuracy and speed for the four models (as illustrated in Table 1 and Table 2).
Note that, in Figure 7, the features with positive values mean that these features are the values that may lead to high-level crash severity (injury or even fatal crashes), while the features with negative values indicate that these are the values that may lead to low-level crash severity or even prevent the occurrence of crash injury. The features that rank highest in importance to crash severity prediction for West rural Texas teen driver crashes are: manner of collision, person restraint used, weather condition, school zone, roadway type, light condition, construction zone, left shoulder use, person age, right should type, traffic control type, number of lanes, speed limit, and road class.
In Table 1 and Table 2, we can find that, for both coding methods, XGBoost has the highest accuracy (Model 2). As for the speed evaluation, Model 4 takes the shortest time to process the same dataset, which is critical for real-time crash prediction applications.

6. Conclusions

In this study, we presented a complete machine learning pipeline on teen driver crashes in rural West Texas, including collecting, cleaning, and coding crash data, a comprehensive exploratory data analysis, identification of contributing factors to crash severity, and four machine learning predictive models. We have the following major findings:
(1)
The major causes of teen driver crashes in rural West Texas are unsafe speed (23%), failure to control speed (19%), failure to yield right of way (13%), driver inattention (6%), fatigue or sleep (5%), and animals on the road (6%). Other minor factors are mainly about risky driving behaviors, such as turning = or changing lane when unsafe, following too closely, and backing without safety.
(2)
The features that rank highest on importance to crash severity prediction for West rural Texas teen driver crashes are road class, speed limit, first harmful event, number of lanes, traffic control type, right shoulder type, person age, left shoulder use, construction zone, light condition, roadway type, school zone, weather condition, person restraint used, and manner of collision.
(3)
Machine learning approaches are particularly useful to uncover new statistical patterns in the large heterogeneous crash datasets. XGBoost seems to be an effective option when considering both predictive performance and computational cost.
(4)
It became apparent in this study that many teens do not have adequate knowledge of safe driving behavior on rural roads in West Texas. Policies and programs that can be built to curb this upward trend are in great need.
However, the dataset created contains information that has not been exploited yet, for example tempo-spatial patterns of teen driver crashes in rural West Texas. These will be included in further work. Additionally further time series analyses, for example, a comparison of the monthly time series through the years, as well as additional clustering experiments, for example, clustering of the day of week profiles by districts, might provide additional useful information. In cooperation with the TxDOT districts, we also hope to find explanations for some interesting features of the data discovered and possible ways to use the results of this work in improving rural teen driver traffic safety in West Texas.

Author Contributions

Conceived and designed the experiments: C.L., D.W., and H.L. Performed the experiments: X.X. and N.B. Analyzed the data: C.L., D.W., and H.L. Contributed reagents/materials/analysis tools: C.L., D.W., X.X., and N.B. Wrote the paper: C.L., D.W., and H.L. All authors have read and agreed to the published version of the manuscript.

Funding

This research is partly support by the National Natural Science Foundation of China with Grant No. 51408257 and the Youth Scientific Research Fund of Jilin with Grant No. 20180520075JH.

Acknowledgments

We are very thankful to the reviewers for their time and efforts; their comments and suggestions have greatly improved the quality of this paper.

Conflicts of Interest

The authors declare no conflict of interest.

Appendix A

Table A1. The descriptive of the collected teen driver crashes.
Variable CategoryFrequencyPercentage
Commercial motor vehicle flagNo822092.79
Yes6397.21
First harmful eventMotor Vehicle in Transport535560.45
Fixed Object223325.21
Overturned8839.97
Animal2402.71
Other Object610.69
Parked Car390.44
Other Non-Collision330.37
Pedestrian100.11
Pedal cyclist40.05
RR Train10.01
Highway lane designTwo-Way506957.22
Freeway207823.46
Boulevard128714.53
Expressway4254.80
Intersection relatedNon-Intersection518858.56
Intersection177420.02
Intersection Related128614.52
Driveway Access6116.90
Median typeNo Median506957.22
Unprotected279131.50
Positive Barrier8159.20
Curbed1842.08
Road classUS and State Highways379942.88
Farm to Market307634.72
Interstate197522.29
City Street90.10
Roadway functionRural Prin Arterial165518.68
Rural Major Coll162118.30
Urban Prin Arterial (Other)133615.08
Rural Interstate128014.45
Rural Minor Arterial103911.73
Urban Prin Arterial (IH)6747.61
Urban Minor Arterial5936.69
Urban Collector4424.99
Urban Prin Arterial (Other Freeway)1171.32
Rural Minor Coll951.07
Urban Local40.05
Rural Local30.03
Roadway type2 Lane, 2 Way432148.78
Four or More Lanes, Divided378142.68
Four or More Lanes, Undivided7488.44
Other Road Type90.10
Vehicle body stylePickup316235.69
Passenger Car, 4-Door296733.49
Sport Utility Vehicle147516.65
Passenger Car, 2-Door104611.81
Van780.88
Truck560.63
Unknown270.30
Truck Tractor250.28
Farm Equipment80.09
No Data60.07
Other (Explain in Narrative)60.07
Bus10.01
Ambulance10.01
Fire Truck10.01
Light conditionDaylight594667.12
Dark, Not Lighted209923.69
Dark, Lighted5115.77
Dusk1381.56
Dawn1251.41
Dark, Unknown Lighting340.38
Other (Explain in Narrative)50.06
Unknown10.01
Crash severityN-NOT INJURED593667.01
B-NON-INCAPACITATING INJURY130714.75
C-POSSIBLE INJURY107712.16
A-SUSPECTED SERIOUS INJURY4024.54
K-KILLED1371.55
Surface typeDry674676.15
Wet114012.87
No Data5205.87
Ice2572.90
Standing Water790.89
Snow640.72
Slush320.36
Sand, Mud, Dirt100.11
Other (Explain in Narrative)80.09
Unknown30.03
Traffic control typeCenter Stripe/Divider307534.71
Marked Lanes228325.77
Stop Sign118713.40
No Passing Zone6927.81
None6237.03
Signal Light5556.26
Yield Sign1721.94
Warning Sign961.08
Other (Explain in Narrative)420.47
Flashing Red Light290.33
Officer270.30
Signal Light with Red Light Running Camera260.29
Flashing Yellow Light220.25
Flagman170.19
RR Gate/Signal60.07
Inoperative (Explain in Narrative)50.06
Crosswalk10.01
Bike Lane10.01
Weather conditionClear652873.69
Cloudy99211.20
Rain97911.05
Snow1401.58
Sleet/Hail961.08
Fog760.86
Blowing Sand/Snow210.24
Severe Crosswinds160.18
Other (Explain in Narrative)80.09
Unknown30.03
Person genderMale522859.01
Female359340.56
Unknown380.43
Person ethnicityWhite639272.15
Hispanic198722.43
Black2502.82
Other800.90
Unknown800.90
Asian550.62
Amer. Indian/Alaskan Native90.10
No Data60.07
Person restraint usedShoulder and Lap Belt846895.59
None2132.40
Unknown1411.59
Shoulder Belt Only190.21
Lap Belt Only80.09
Not Applicable60.07
Other (Explain in Narrative)20.02
No Data20.02
Table A2. Yearly number and causes of teen driver crashes in West Texas rural areas.
Contributing Factor201020112012201320142015201620172018Percentage
Unsafe Speed25123922129829030625027225323.09
Failed to Control Speed17316218320319523222026628719.79
Failed to Yield Right of Way12311612013417114912314017112.95
Driver Inattention7366859478665452456.40
Animal on Road8470657361646364636.36
Fatigued or Asleep5448555457465245495.30
Under Influence5466466649506447443.49
Failed to Drive in Single Lane3325282241313666712.53
Faulty Evasive Action2943494551393318302.42
Distraction in Vehicle2527443428312829151.87
Disregard Stop Sign or Light2831253127231627321.72
Turned When Unsafe1519182422192525161.31
Taking Medication (Explain in Narrative)1919191919191919191.23
Passed on Right Shoulder1818181818181818181.16
Road Rage1818181818181818181.16
Overtake and Pass Insufficient Clearance1717171717171717171.10
Parked in Traffic Lane1717171717171717171.10
Load Not Secured1616161616161616161.03
Opened Door into Traffic Lane1616161616161616161.03
Backed Without Safety19182120719141381.00
Ill (Explain in Narrative)1515151515151515150.97
Impaired Visibility (Explain in Narrative)1515151515151515150.97
Followed Too Closely1414141414141414140.90
Changed Lane When Unsafe9917191771711180.89
Fire in Vehicle1313131313131313130.84
Failed to Pass to Left Safely13171611151071280.78
Had Been Drinking1186611107360.49
Speeding (Over limit)1051396811420.49
Failed to Give Half of Roadway64716788100.41
Fleeing or Evading Police7743552890.36
Turned Improperly33873146100.32
Disregard Stop and Go Signal23225554110.28
Cell/Mobile Device Use00000814820.23
Passed in No Passing Lane3320334530.19
Failed to Pass to Right Safely2233010420.12
Improper Start from Parked Position2113111050.11
Failed to Stop at Proper Place1401212200.09
Failed to Signal or Gave Wrong Signal1220231010.09
Failed to Heed Warning Sign1320110100.06
Failed to Stop for Train0200110220.06
Disabled in Traffic Lane0020000210.04
Drove Without Headlights1100000110.03
Disregard Warning Sign at Construction1000101000.02
Wrong Way/One Way Road0110010000.02
Disregard Turn Marks at Intersection0010001000.01
Oversized Vehicle or Load0011000000.01
Failed to Stop for School Bus0000010000.01

References

  1. TxDOT. TxDOT Crash Report Information System (CRIS). Available online: https://cris.dot.state.tx.us/public/Query/app/welcome (accessed on 30 July 2019).
  2. Kumfer, W.; Liu, H.; Wu, D.; Wei, D.; Sama, S. Development of a supplementary driver education tool for teenage drivers on rural roads. Saf. Sci. 2017, 98, 136–144. [Google Scholar] [CrossRef]
  3. Compton, R.P.; Ellison-Potter, P. Teen Driver Crashes: A Report to Congress; National Highway Traffic Safety Administration: Washington, DC, USA, 2008.
  4. Ankem, G.; Gorman, T.; Klauer, C.; Ehsani, J.P.; Simons-Morton, B.; Gershon, P.; Dingus, T. An Objective Evaluation of Novice Teen Driver Speeding Behavior. In Proceedings of the Transportation Research Board 97th Annual Meeting, Washington, DC, USA, 7–11 January 2018. [Google Scholar]
  5. Ferguson, S.A. Speeding-Related Fatal Crashes among Teen Drivers and Opportunities for Reducing the Risks; Governors Highway Safety Association: Washington, DC, USA, 2013. [Google Scholar]
  6. Gershon, P.; Sita, K.R.; Zhu, C.; Ehsani, J.P.; Klauer, S.G.; Dingus, T.A.; Simons-Morton, B.G. Distracted driving, visual inattention, and crash risk among teenage drivers. Am. J. Prev. Med. 2019, 56, 494–500. [Google Scholar] [CrossRef] [PubMed]
  7. Gershon, P.; Zhu, C.; Klauer, S.G.; Dingus, T.; Simons-Morton, B. Teens’ distracted driving behavior: Prevalence and predictors. J. Saf. Res. 2017, 63, 157–161. [Google Scholar] [CrossRef] [PubMed]
  8. Keating, D.P.; Halpern-Felsher, B.L. Adolescent drivers: A developmental perspective on risk, proficiency, and safety. Am. J. Prev. Med. 2008, 35, S272–S277. [Google Scholar] [CrossRef] [PubMed]
  9. Rhodes, N.; Pivik, K. Age and gender differences in risky driving: The roles of positive affect and risk perception. Accid. Anal. Prev. 2011, 43, 923–931. [Google Scholar] [CrossRef] [PubMed]
  10. Simons-Morton, B.; Lerner, N.; Singer, J. The observed effects of teenage passengers on the risky driving behavior of teenage drivers. Accid. Anal. Prev. 2005, 37, 973–982. [Google Scholar] [CrossRef]
  11. Simons-Morton, B.; Li, K.; Ehsani, J.; Vaca, F.E. Covariability in three dimensions of teenage driving risk behavior: Impaired driving, risky and unsafe driving behavior, and secondary task engagement. Traffic Inj. Prev. 2016, 17, 441–446. [Google Scholar] [CrossRef] [Green Version]
  12. Doherty, S.T.; Andrey, J.C.; MacGregor, C. The situational risks of young drivers: The influence of passengers, time of day and day of week on accident rates. Accid. Anal. Prev. 1998, 30, 45–52. [Google Scholar] [CrossRef]
  13. Bingham, C.R.; Simons-Morton, B.G.; Pradhan, A.K.; Li, K.; Almani, F.; Falk, E.B.; Shope, J.T.; Buckley, L.; Ouimet, M.C.; Albert, P.S. Peer passenger norms and pressure: Experimental effects on simulated driving among teenage males. Transp. Res. Part F Traffic Psychol. Behav. 2016, 41, 124–137. [Google Scholar] [CrossRef] [Green Version]
  14. Micucci, A.; Mantecchini, L.; Sangermano, M. Analysis of the Relationship between Turning Signal Detection and Motorcycle Driver’s Characteristics on Urban Roads; A Case Study. Sensors 2019, 19, 1802. [Google Scholar] [CrossRef] [Green Version]
  15. Penmetsa, P.; Pulugurtha, S.S. Modeling crash injury severity by road feature to improve safety. Traffic Inj. Prev. 2018, 19, 102–109. [Google Scholar] [CrossRef] [PubMed]
  16. Kwigizile, V.; Sando, T.; Chimba, D. Understanding the role of alcohol and drugs on bicyclist injury severity. Adv. Transp. Stud. 2014, 34, 43–54. [Google Scholar]
  17. Dong, C.; Dong, Q.; Huang, B.; Hu, W.; Nambisan, S.S. Estimating factors contributing to frequency and severity of large truck–Involved crashes. J. Transp. Eng. Part A Syst. 2017, 143, 04017032. [Google Scholar] [CrossRef]
  18. Wu, Q.; Chen, F.; Zhang, G.; Liu, X.C.; Wang, H.; Bogus, S.M. Mixed logit model-Based driver injury severity investigations in single-And multi-Vehicle crashes on rural two-Lane highways. Accid. Anal. Prev. 2014, 72, 105–115. [Google Scholar] [CrossRef] [PubMed]
  19. Taylor, S.G.; Russo, B.J.; James, E. A comparative analysis of factors affecting the frequency and severity of freight-Involved and non-Freight crashes on a major freight corridor freeway. Transp. Res. Rec. 2018, 2672, 49–62. [Google Scholar] [CrossRef]
  20. Fan, W.D.; Gong, L.; Washing, E.M.; Yu, M.; Haile, E. Identifying and Quantifying Factors Affecting Vehicle Crash Severity at Highway-Rail Grade Crossings: Models and Their Comparison. In Proceedings of the Transportation Research Board 97th Annual Meeting, Washington, DC, USA, 10–14 January 2016. [Google Scholar]
  21. Wang, X.; Kim, S.H. Prediction and Factor Identification for Crash Severity: Comparison of Discrete Choice and Tree-Based Models. Transp. Res. Rec. 2019, 2673, 640–653. [Google Scholar] [CrossRef]
  22. Li, D.; Ranjitkar, P.; Zhao, Y.; Yi, H.; Rashidi, S. Analyzing pedestrian crash injury severity under different weather conditions. Traffic Inj. Prev. 2017, 18, 427–430. [Google Scholar] [CrossRef]
  23. Mafi, S.; Abdelrazig, Y.; Doczy, R. Machine learning methods to analyze injury severity of drivers from different age and gender groups. Transp. Res. Rec. 2018, 2672, 171–183. [Google Scholar] [CrossRef]
  24. Li, Z.; Liu, P.; Wang, W.; Xu, C. Using support vector machine models for crash injury severity analysis. Accid. Anal. Prev. 2012, 45, 478–486. [Google Scholar] [CrossRef]
  25. Aghayan, I.; Hosseinlou, M.H.; Kunt, M.M. Application of support vector machine for crash injury severity prediction: A model comparison approach. J. Civ. Eng. Urban. 2015, 5, 193–199. [Google Scholar]
  26. Zeng, Q.; Huang, H.; Pei, X.; Wong, S. Modeling nonlinear relationship between crash frequency by severity and contributing factors by neural networks. Anal. Methods Accid. Res. 2016, 10, 12–25. [Google Scholar] [CrossRef] [Green Version]
  27. Sameen, M.; Pradhan, B. Severity prediction of traffic accidents with recurrent neural networks. Appl. Sci. 2017, 7, 476. [Google Scholar] [CrossRef] [Green Version]
  28. Lee, D.; Warner, J.; Morgan, C. Discovering Crash Severity Factors of Grade Crossing With a Machine Learning Approach. In Proceedings of the 2019 Joint Rail Conference, Snowbird, UT, USA, 10–12 April 2019. [Google Scholar] [CrossRef]
  29. Iranitalab, A.; Khattak, A. Comparison of four statistical and machine learning methods for crash severity prediction. Accid. Anal. Prev. 2017, 108, 27–36. [Google Scholar] [CrossRef] [PubMed]
  30. Wikipedia. Available online: https://en.wikipedia.org/wiki/West_Texas (accessed on 30 July 2019).
  31. Yang, H.; Ozbay, K. Estimating Traffic Control Risk Associated with Merging Vehicles on a Highway Merge Section. Transp. Res. Rec. 2011, 2236, 58–65. [Google Scholar] [CrossRef]
  32. National Highway Traffic Safety Administration. Traffic Safety Facts 2016 data: Alcohol-Impaired Driving. Available online: https://crashstats.nhtsa.dot.gov/Api/Public/ViewPublication/812630 (accessed on 30 July 2019).
  33. Tefft, B.C. Teen Driver Crashes: 1994–2013; AAA Foundation for Traffic Safety: Washington, DC, USA, 2015. [Google Scholar]
  34. NHTSA. Teen Distracted Driver Data. Available online: https://crashstats.nhtsa.dot.gov/Api/Public/ViewPublication/812667 (accessed on 30 July 2019).
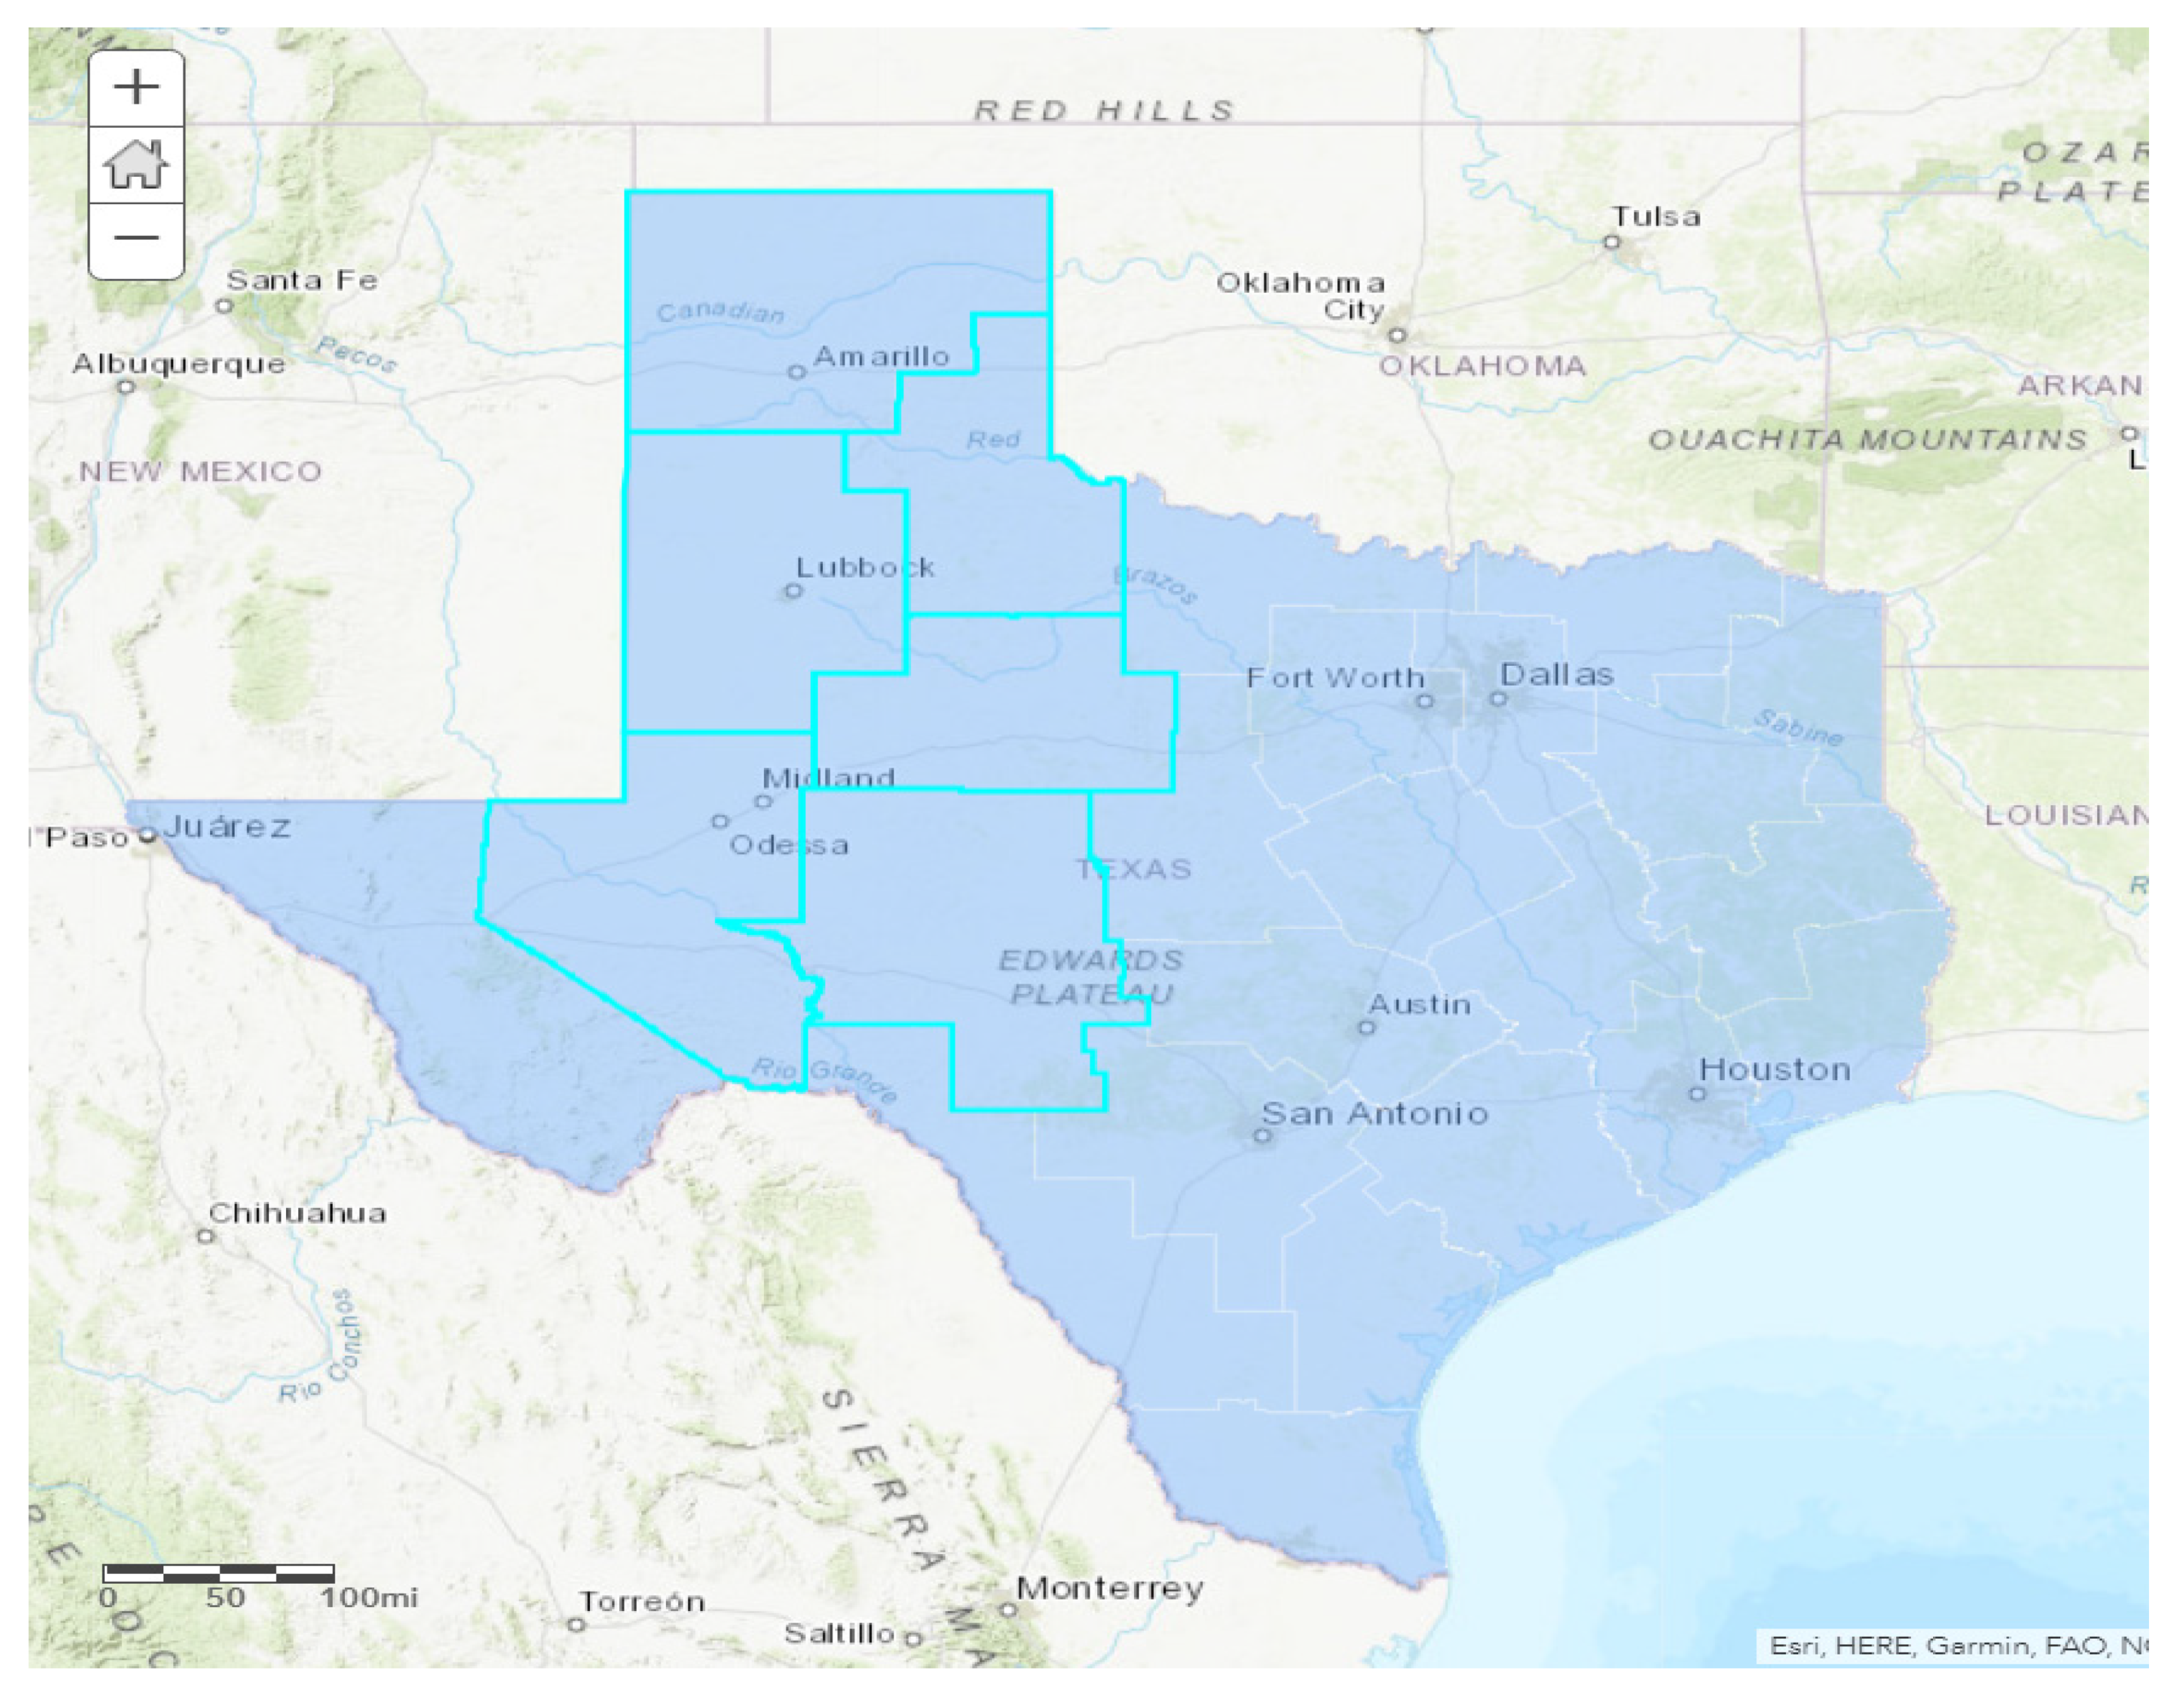
Figure 1. Study area: Five Texas Department of Transportation (TxDOT) districts in the West Texas rural area.
Applsci 10 01675 g001
Figure 2. Major contributing factors to teen driver crashes in West Texas rural areas.
Applsci 10 01675 g002
Figure 3. Yearly trend of teen driver crashes in the West Texas rural area.
Applsci 10 01675 g003
Figure 4. Hourly distribution of teen driver crashes in the West Texas rural area.
Applsci 10 01675 g004
Figure 5. Other exploratory analysis on teen drivers and crash severity.
Applsci 10 01675 g005
Figure 6. The coding and the standard scalar examples in this machine learning process.
Applsci 10 01675 g006
Figure 7. Ranking of feature importance on severity prediction of teen driver crashes in West Texas rural areas.
Applsci 10 01675 g007
Table 1. The prediction accuracy of the developed four models.
Encoding MethodPredictive AlgorithmMean Absolute Error (MAE)
One hot encoderRandom Forest0.7271
One hot encoderXGBoost0.7140
Label encoderRandom Forest1.0634
Label encoderXGBoost0.7804
Table 2. The prediction speeds of the developed four models.
Encoding MethodPredictive AlgorithmTime (second)
One hot encoderRandom Forest3.51
One hot encoderXGBoost2.49
Label encoderRandom Forest1.12
Label encoderXGBoost0.76