Article

Band-Limited Reference-Free Speckle Spectroscopy: Probing the Fluorescent Media in the Vicinity of the Noise-Defined Threshold

1
Physics Department, Yury Gagarin State Technical University of Saratov, 410054 Saratov, Russia
2
Institute of Precision Mechanics and Control, RAS, 410028 Saratov, Russia
*
Author to whom correspondence should be addressed.
Appl. Sci. 2020, 10(5), 1629; https://doi.org/10.3390/app10051629
Submission received: 25 January 2020 / Revised: 24 February 2020 / Accepted: 25 February 2020 / Published: 29 February 2020
(This article belongs to the Special Issue Laser Spectroscopy)

Abstract

:
A method of reference-free speckle spectroscopy based on the statistical analysis of intensity spatial fluctuations of the spectrally-selected multiple-scattered fluorescence radiation is examined in the case of the finite-band spectral selection of fluorescence light emitted by the laser-pumped random medium, and detection conditions far from the ideal case. Intensity fluctuations are recorded during point-to-point scanning of the surface of a random multiple-scattering medium, which is characterized by the dependences of the second- and third-order statistical moments of intensity on the wavelength of detected spectrally selected light. In turn, the statistical moments of intensity fluctuations are determined by the average propagation path of fluorescent radiation in the medium. This makes it possible to analyze the features of the light-medium interactions at a scale of the order of the transport mean free path of radiation propagation in the medium. Depending on the spectral selection conditions, the method is applicable for characterizing micro- or nano-structured fluorescent layers with thicknesses from tens of micrometers to several millimeters. In the examined case, the finite-band spectral selection results in the values of coherence length of the detected fluorescence radiation compared with the ensemble-averaged absolute value of the path-length difference between the stochastically interfering and spectrally selected partial contributions to the fluorescence field. In addition, non-ideal detection conditions (usage of a multimode optical fiber in the light-collecting unit) cause additional strong damping of the detected speckle intensity fluctuations. These factors lead to a remarkable suppression of spatial fluctuations of the fluorescence intensity in the course of spatially- and spectrally-resolved surface scanning of the laser-pumped probed random medium. Nevertheless, with appropriate procedures of the intrinsic noise reduction and data correction, the obtained spectral dependencies of the normalized third-order statistical moment of the band-limited fluorescence intensity clearly indicate the fluorescence propagation features in the probed multiple-scattering random media (such as a strong influence of the scattering strength and multiple self-absorption–re-emission events on the average propagation path of light in the medium).The possibilities of noise reduction and data correction in the case of applying the band-limited reference-free spectroscopic instrumentation with low spectral and spatial resolution are illustrated by the experimental results obtained using the Rhodamine-6G-doped and continuous wave (CW)-laser-pumped layers of the densely packed titania and silica particles.

1. Introduction

Nowadays, the diffusing light techniques are one of the most powerful tools for characterization of the structure and dynamics of the complex random media at the microscopic level (for spatial scales comparable with the wavelength of the probe light). Among the variety of these techniques, a particular emphasis should be placed on a group of methods primarily based on the analysis of spatial, temporal, and frequency correlations of the coherent or partially coherent light propagating in the probed medium. In particular, the diffusing wave spectroscopy (DWS) pioneered by several research groups in the late eighties and early nineties of the past century [1,2] as a probe for scatter dynamics in relatively simple and well-defined multiple-scattering Brownian systems, was widely used to characterize complex non-stationary and non-ergodic media (colloidal and quasi-crystal systems with strong interactions between the particles, mixtures with separating phases, drying paints, biological tissues, etc. [3,4,5,6,7,8,9,10,11,12,13,14,15,16,17,18,19]). An important condition for the fair DWS applicability in the diagnostics of the dynamic random media is the coherence length of the probe light that must exceed the maximal propagation path of the light in the medium. In the opposite case, fluctuations of the detected multiple-scattered light, which are caused by the scatter motions in the medium, will be partially or totally suppressed, depending on the ratio of the average propagation path of light to its coherence length.
At the same time, the suppression effect associated with the blur of the dynamic speckle patterns in the scattered, partially coherent light fields, can be used to recover the path-length distributions of the probe light in the static multiple-scattering media. In turn, this opens the way for evaluation of the structural properties of the examined scattering system using an appropriate scattering model, which establishes the relationships between the structural properties of the system (e.g., the average size of the scattering units and their volume fraction), and its optical transport parameters (e.g., the transport mean free path of light propagation in the system and the absorption length, [20]). A successful attempt of the scattering media characterization using the effect of the laser speckle suppression due to an increasing ratio of the average propagation path of the light in the medium to the coherence length was reported by M.A. Webster, K.J. Webb, and A.M. Weiner [21]. Beginning from this work, several investigations were conducted on the improvement and expansion of this approach [22,23,24,25]. Application of the tunable semiconductor lasers governed, for example, by the temperature, allows for a controllable decorrelation [26] of the acquired speckle patterns, which must be manifested as the speckle blur at large acquisition time intervals. Another way to obtain a controllable speckle blur in the course of the scattering media probing with a tunable laser light is application of the binary modulation of laser light frequency together with a long-exposure recording of time-varying speckles. In particular, this approach can be realized using a semiconductor laser with a diffraction grating as an external tunable element of the laser cavity; the binary modulation of the light frequency is achieved due to repeatable sequences of the mode hops under a condition of periodic changes in the grating tilt with respect to the beam axis [27].
Controllable changes in the coherence length of the probe light can also be provided using a slow modulation of the pumping current in the laser diode in the vicinity of the laser generation threshold [28]. At certain conditions, this approach makes it possible to tune the coherence length of emitting radiation within the range from several tens of micrometers to several millimeters. On the other hand, a disadvantage of this technique is related to sufficient changes in the probe light intensity in the course of the pumping current modulation; however, this disadvantage is minimized due to application of average-intensity-normalized statistical characteristics of the multiple-scattered light fields (such as, e.g., a contrast as a standard deviation of intensity fluctuations normalized by the average intensity} as the diagnostic parameters.
The abovementioned approaches are primarily based on application of the narrow-band probing radiation with a controllable coherence length for illumination of the characterized multiple-scattering system with a follow-up spatially resolvable detection of the scattered partially coherent light. On the other hand, the principle of the narrow-band spectral selection of the detected scattered radiation under a wide-band illumination of a probed object can be applied to provide the necessary conditions for stochastic interference of light waves contributing to the multiple-scattered light field in the probed medium. Moreover, this probing light field can be induced by fluorescence of the medium due to continuous-wave (CW) laser pumping in the presence of the natural or artificially added fluorophores. The spectral selection can be provided using a monochromator between the light-collecting optics with a high spatial resolution and a photodetector; the effective coherence length of the detected light is determined as l c λ ¯ 2 / Δ λ , where λ ¯ is the central wavelength in the spectral interval selected by the monochromator, and Δ λ is the interval width defined by the spectral resolution of the monochromator. This approach was discussed in Ref. [29]; the combined light-collecting, wavelength-selecting, and photo-detecting unit was based on the Raman microscope Horiba Jobin Ivon LabRam HR800 and provided a remarkably high spectral ( Δ λ 0.052 nanometers) and spatial resolution. As the random modulation of the detected optical signal is caused by the stochastic interference of spectrally selected, or band-limited multiple-scattered light waves, the discussed technique can be defined as the band-limited reference-free speckle spectroscopy.
For further development of this technique and expansion of the area of possible applications, it is important to examine its operational ability in the case of almost total suppression of the stochastic interference modulation in the detected signal because of the low spectral and spatial resolution of the light-collecting unit. Under these conditions, the factual content of the detected signal becomes strongly corrupted by the intrinsic noise of the system, and the main problem related to the workability of the system under these conditions is to recover this factual content. In particular, this problem occurs when the detection conditions are far from ideal and the band-limiting unit (the monochromator) in the reference-free speckle-spectroscopic system provides a relatively small coherence length l c of the detected radiation, whereas the average propagation path s of the probe light in the medium becomes sufficiently larger compared with l c . The goal of this work is to examine the workability of the band-limited reference-free speckle spectroscopy (BLRFS) applied as the probing technique for the CW-pumped fluorescent random media in the case of a strong damping of the detected signal due to non-ideal detection conditions and data corruption by an intrinsic noise of the speckle-spectroscopic system. In addition, the discussed technique of data recovery is verified in the experiments with the dye-doped fluorescent random media consisting of densely packed oxide (titania and silica) particles. It should be noted that the physical principles of the BLRFS probing are generally similar to the principles used in the previously discussed reference-free path length interferometry of random media [29]. However, in contrast with the reference-free path length interferometry, the features of the considered BLRFS technique (spectral selection with a relatively low resolution and significant suppression of stochastic interference during radiation transfer from the sample to detector) require a detailed analysis of these effects.

2. BLRFS Principles

The principles of the band-limited reference-free speckle spectroscopy considered in this work are illustrated in Figure 1. The fluorescent random multiple-scattering medium with the slab geometry is illuminated by a continuous-wave laser radiation penetrating into the medium for a certain depth and inducing fluorescence. In turn, the fluorescence radiation diffusively propagating in the slab is partially acquired by a light-collecting system from a small area of the slab surface. The collected fluorescence light passes through a narrow-band filter and is detected by a photodetector unit. In the real system, the filtering and detection functions can be combined and a spectrometer with a linear photosensor can be applied as a narrow-band photodetector. In addition, a cutoff optical filter is used in the light-collecting system to block the pumping laser light. In the course of the medium characterization, the sample surface is scanned by the light-collecting system, and portions of fluorescence radiation are acquired from the various zones of the surface. Due to the narrow-band filtering of the incoming optical signal, the light waves emitted by any fluorescent site and propagating over the various paths in the medium can interfere with each other if the following condition is satisfied: Δ s i , j < l c ( Δ s i , j is the path-length difference for the superposing waves). Occurrence of a stochastic interference contribution in the detected signal should cause its random changes during transitions from one scan position to another due to position-induced changes of an ensemble of Δ s i , j values. These random changes can be characterized by the wavelength-dependent normalized second- and third-order statistical moments of intensity fluctuations in the detected signal I 2 / I 2 and I 3 / I 3 (the angular brackets mean an ensemble averaging over all the scan positions).

2.1. Basic Relationships of the BLRFS Technique

In the random multiple-scattering media, consideration of interference interactions between partial contributions to a partially coherent light field leads to the following expressions for the normalized second- and third-order statistical moments of spatial fluctuations of the scattered light intensity I s (for a detailed derivation in these formulas see [29]):
M 2 = I s 2 I s 2 1 + 0 | g ( Δ s ) | 2 ρ ( Δ s ) d ( Δ s ) ; M 3 = I s 3 I s 3 1 + 3 0 | g ( Δ s ) | 2 ρ ( Δ s ) d ( Δ s ) + 2 ( 0 | g ( Δ s ) | ρ ( Δ s ) d ( Δ s ) ) 2 .
The expressions (1) correspond to the case of stochastic interference of linearly polarized partial contributions; this condition can be achieved by, e.g., applying an additional polarizer in the light-collecting unit. In the case of detection of a non-polarized light, the expressions for the normalized second- and third-order moments are transformed into the following form [29]:
M 2 = I s 2 I s 2 1 + 1 2 0 | g ( Δ s ) | 2 ρ ( Δ s ) d ( Δ s ) ; M 3 = I s 3 I s 3 1 + 3 2 0 | g ( Δ s ) | 2 ρ ( Δ s ) d ( Δ s ) + 1 2 ( 0 | g ( Δ s ) | ρ ( Δ s ) d ( Δ s ) ) 2 .
Here | g ( Δ s ) | is a module of the coherence function of the detected spectrally selected light, which is defined in the domain of the path-length differences Δ s between interfering partial contributions. The probability density distribution ρ ( Δ s ) of the path-length differences depends on illumination and detection conditions and on the presence or absence of polarization discrimination in the detection channel.
Equations (1) and (2) were obtained in terms of the discrete scattering model with the subsequent transition to a continuous path-length distribution ρ ( s ) of probe radiation in the medium [29]. This distribution characterizes the ensemble of propagation paths of partial light waves travelling in the medium in case of irradiation by a short light pulse. In turn, the probability density distribution ρ ( Δ s ) of the path-length differences can be obtained from the path-length probability density ρ ( s ) using the convolution procedure: ρ ( Δ s ) = K 0 ρ ( s ) ρ ( s + Δ s ) d s together with the normalization condition 0 ρ ( Δ s ) d ( Δ s ) = 1 ( K is the normalization constant). This follows from the statistical independence of a pair of propagation paths s i , s j defining a given path-length difference Δ s i , j = s i s j .
The module of the coherence function | g ( Δ s ) | approaches 1 in the case Δ s < < l c and gradually falls to 0 with the increasing path-length difference in the region Δ s > > l c . Consequently, the values of M 2 and M 3 are determined by the relationship between the coherence length of the spectrally selected fluorescence radiation l c and the average path-length difference Δ s . In the case of a large coherence length and a narrow path-length distribution ( Δ s / l c < < 1 ), the fluctuation component of the detected light is maximal and the statistical moments approach to their extreme values ( M 2 2 and M 3 6 in the case of polarization discrimination of detected light, Equation (1), or M 2 1.5 and M 3 3 for the non-polarized light detection). Lower values of M 2 and M 3 in the case of non-polarized light detection are caused by a partial suppression of the intensity fluctuations due to superposition of randomly polarized light waves. On the contrary, if Δ s / l c > > 1 , the integrals on the right sides of Equations (1) and (2) fall to zero, the intensity fluctuations are suppressed, and M 2 M 3 1 .
The average path-length difference Δ s for the considered illumination and detection conditions (Figure 1) is determined by the transport mean free path l * of radiation propagation in the examined medium ( Δ s ~ l * , [29]). The transport mean free path corresponds to the average propagation length at which the directed component of the propagating radiation is completely transformed to a diffuse component.
It was established that for a wide class of unimodal probability distributions ρ ( Δ s ) the integrands J 1 = 0 | g ( Δ s ) | 2 ρ ( Δ s ) d ( Δ s ) and J 2 = ( 0 | g ( Δ s ) | ρ ( Δ s ) d ( Δ s ) ) 2 in the right sides of Equations (1) and (2) are related to each other with an appropriate accuracy as an universal power-law function [29]:
J 2 ( l c , Δ s ) { J 2 ( l c , Δ s ) } 2.26 .

2.2. Intrinsic Noise Reduction in the BLRFS Technique

The problem of noise reduction in the band-limited reference-free speckle spectroscopy becomes important in the case of wide-band spectral selection of the multiple-scattered fluorescence radiation. Due to a strong suppression of stochastic interference under the condition l c / Δ s < 1 , the evaluated statistical moments I s 2 / I s 2 and I s 3 / I s 3 , which are associated with scan-induced intensity fluctuations (the “desired signal”), may be comparable with the similar values related to the noise component of the detected signal. This component can be considered as a non-correlated contribution to the “desired signal” I s caused by interactions of an idealized partially coherent light with the examined system. The noise contribution I n is related to a variety of noisy factors (a detector noise, random fluctuations of the incoming laser radiation, etc.) and can be assumed as having the zero average and, therefore, the detected signal can be presented as the sum of the “desired” value I s and a noisy fluctuation component (an additive model of noise):
I = I s + δ I n
Thus, the first-, second-, and third-order statistical moments of the detected signal can be expressed as:
I = I s ; I 2 = ( I s + δ I n ) 2 = I s 2 + ( δ I n ) 2 ; I 3 = ( I s + δ I n ) 3 = I s 3 + 3 I s ( δ I n ) 2 .
These formulas evidently follow from the absence of correlations between I s , I n and the relationships δ I n = 0 ; ( δ I n ) 3 = 0 . Consequently, the normalized statistical moments have the following forms:
I 2 I 2 = I s 2 I s 2 + ( δ I n ) 2 I 2 = M 2 + ( δ I n ) 2 I 2 ; I 3 I 3 = I s 3 I s 3 + 3 ( δ I n ) 2 I 2 = M 3 + 3 ( δ I n ) 2 I 2 .
These relationships give the basis for recovery of the normalized statistical moments of non-corrupted intensity fluctuations from a sequence of I values obtained in the course of sample scanning, and the reference values ( δ I n ) 2 / I 2 obtained in pre-calibration experiments.

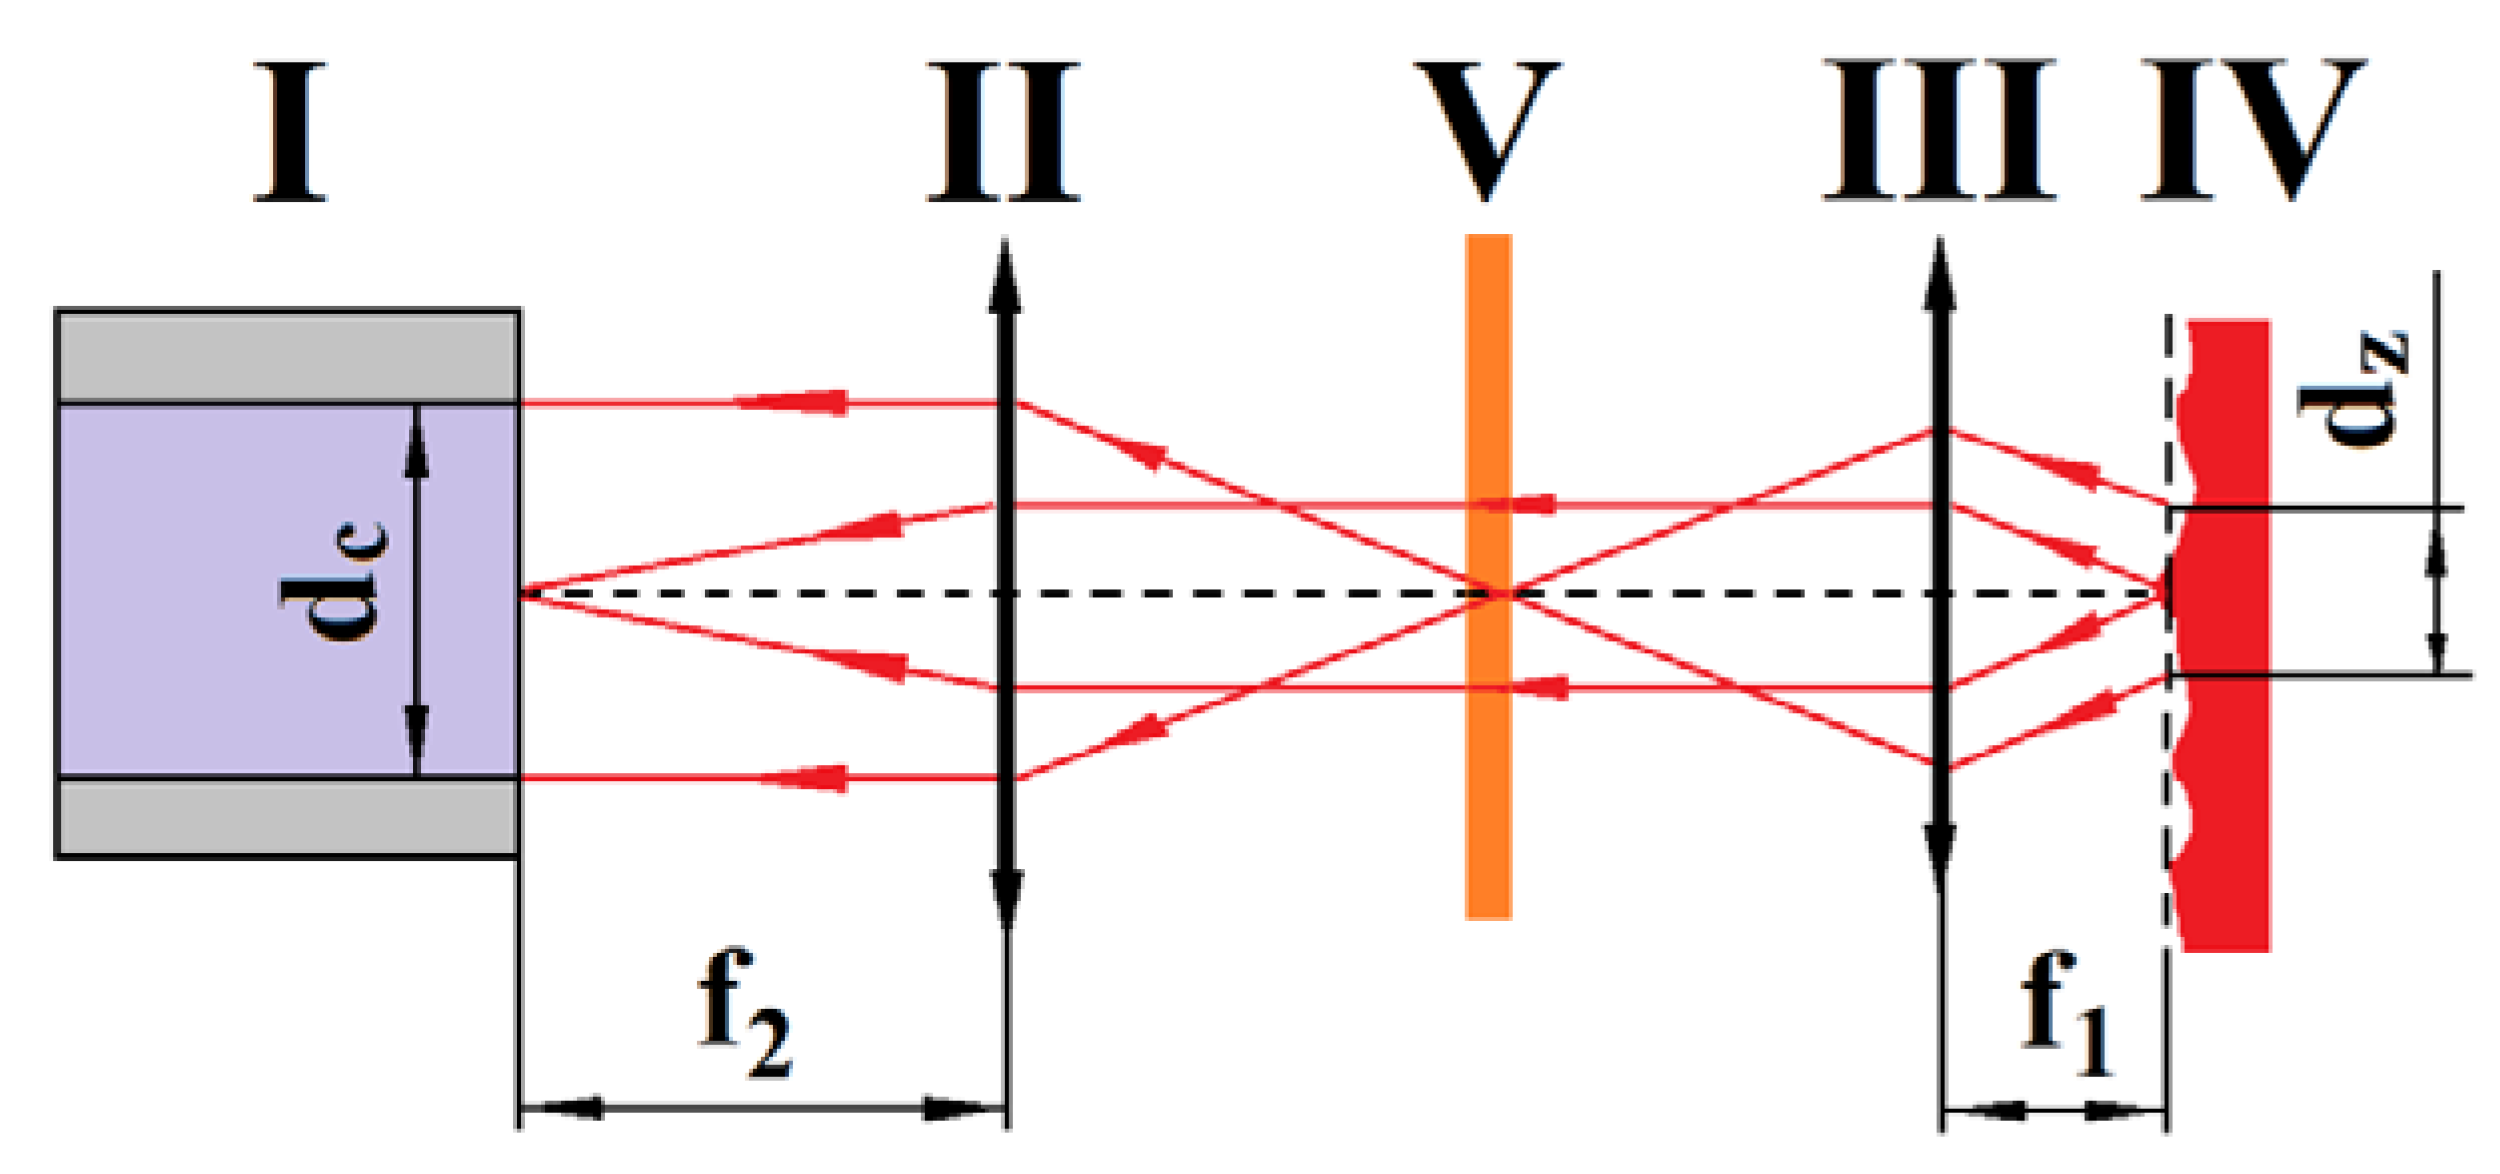
2.3. The Effect of a Finite-Sized Light-Collection Zone

Ideal conditions of light detection in the speckle correlation experiments are achieved when the size of the light-collection zone is small compared to a characteristic size of the coherence area of the scattered light field (the speckle size). In the opposite case (several coherence areas within the light-collection zone), superposition of statistically independent contributions from the various areas causes suppression of the fluctuating component of the detected light. In the DWS probes of the non-stationary random media, this effect is described by a well-known Siegert relationship (see, e.g., any references related to the DWS technique)
g 2 ( t , τ ) = 1 + β | g 1 ( t , τ ) | 2 ,
where g 2 ( t , τ ) , g 1 ( t , τ ) are the normalized temporal autocorrelation functions of intensity and field fluctuations, and β is a dimensionless parameter varying between 0 and 1 (it approaches 1 in the ideal detection conditions and gradually falls to 0 with an increasing number of speckles within the light-collection zone).
In our case, we can assume the following relationship for the noise-free detected intensity
I s = I s + β δ I s ,
where β takes into account the suppression effect due to the finite-sized light-collection zone. Collation of Equations (7) and (8) allows us to conclude that β = β . Evaluating the first-, second-, and third-order statistical moments of I s in the case of a non-unit β value, we can rewrite Equations (2) and (3) in the following forms (for the polarized and non-polarized light):
M 2 = I s 2 I s 2 1 + β { 0 | g ( Δ s ) | 2 ρ ( Δ s ) d ( Δ s ) } ; M 3 = I s 3 I s 3 1 + β { 3 0 | g ( Δ s ) | 2 ρ ( Δ s ) d ( Δ s ) + 2 ( 0 | g ( Δ s ) | ρ ( Δ s ) d ( Δ s ) ) 2 } .
M 2 = I s 2 I s 2 1 + β 2 0 | g ( Δ s ) | 2 ρ ( Δ s ) d ( Δ s ) ; M 3 = I s 3 I s 3 1 + β { 3 2 0 | g ( Δ s ) | 2 ρ ( Δ s ) d ( Δ s ) + 1 2 ( 0 | g ( Δ s ) | ρ ( Δ s ) d ( Δ s ) ) 2 } .

3. Experimental Technique

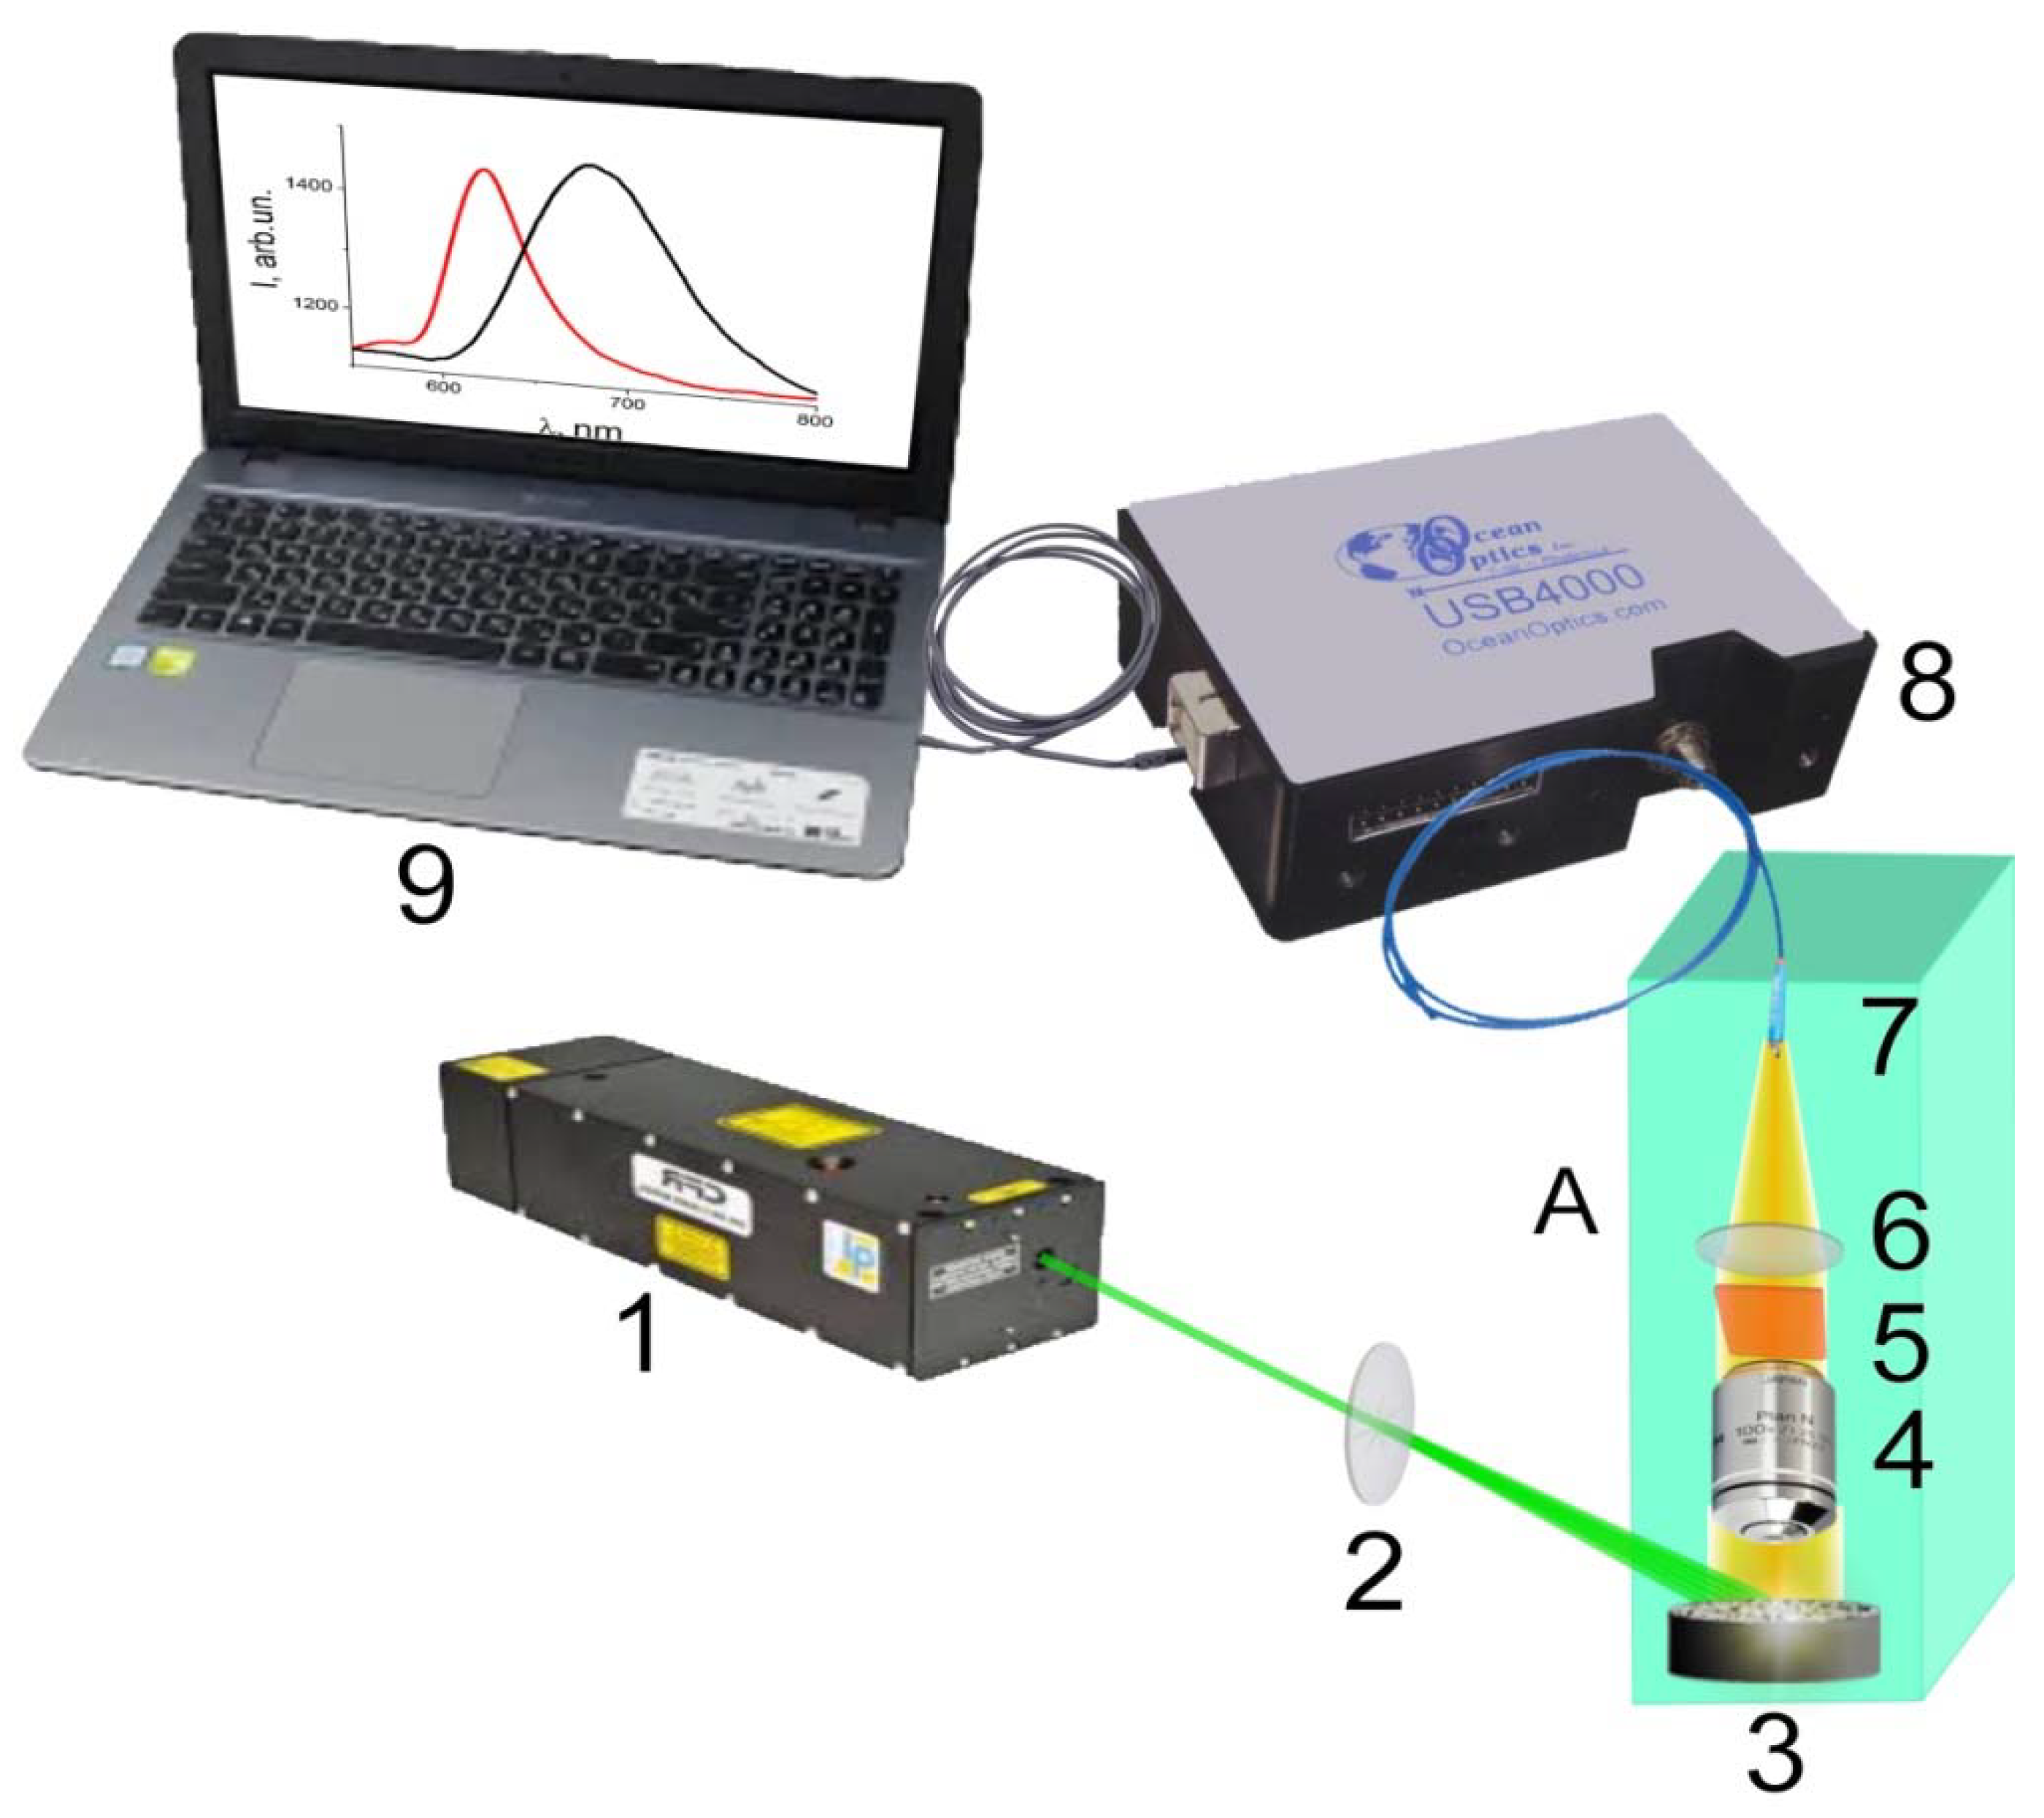
3.1. BLRFS Bench-Top Instrumentation and Probing Technique

In the provided experiments, we studied the statistical properties of spatial fluctuations of spectrally selectable fluorescence radiation propagating in the random media. In general, the methodology of the experiments was similar to that described earlier in Ref. [29], except that the detection system used was characterized by a significantly lower spectral resolution. In this case, the broadband spectral filtering of fluorescence radiation led to a significant suppression of fluctuations caused by the stochastic interference of partial components of the fluorescence radiation field. In turn, this necessitated an accurate accounting of the intrinsic noise of the detection system when analyzing the obtained data.
The general scheme of the experimental setup is shown in Figure 1. The light-collecting unit (Figure 2, see also “A’ in Figure 1) was assembled according to a collimating confocal scheme using a microscope objective (III, Nikon E plan 100X, N.A.1.25), an entrance aperture of the core of the fiber-optic patch-cord (I, Ocean Optics P100 UV-VIS) as a confocal unit diaphragm, and the lens (II) placed between the microscope objective and the entrance aperture. The input tip of the fiber-optic patch-cord was installed in the rear focal plane of the lens (II), and the surfaces of the examined samples (IV) were conjugated with the front focal plane of the microscope objective. In addition, a long-pass optical filter (V, OG590) was placed between the units II and III to block the pumping laser radiation. This configuration of optical components is a collimating unit with a linear magnification determined by the ratio of the focal lengths of the lens ( f 2 ≈ 15 mm) and the microscope objective ( f 1 ≈ 1.6 mm). In other words, within the framework of geometrical-optical approximation, this unit forms an enlarged image of a surface fragment in the rear focal plane of the lens.
A more rigid consideration of the light-collecting unit in the framework of physical optics shows that with large values of the magnification and numerical aperture N A m of the microscope objective the fluorescence radiation is actually collected from a single coherence area (a single speckle) of the fluorescence field within the chosen spectral interval. In fact, the characteristic size of the coherence area d c can be roughly estimated as λ / Ω , where Ω is the width of the angular spectrum of the collected radiation; at the same time, the size of the light-collection zone d z in the front focal plane of the microscope objective corresponds to the diameter of the Airy disk and can be roughly evaluated as the doubled spatial resolution of the objective, d z 2 ( λ / 2 N A m ) λ / Ω . The light collected from this single coherence area excites an ensemble of propagating modes in the multimode fiber patch-cord, which is used as the light-transferring channel. It is the mode on excitation that has the main effect on the detection conditions in the considered instrument (in particular, on β ). Each mode corresponds to a statistically independent contribution to the overall detected signal; the statistical independence, or total decorrelation of the light fields corresponding to various modes, is established by the following condition: Δ s m > > l c , where Δ s m is the characteristic path-length difference between the patch-cord modes (due to existence of the intermode dispersion). Rough estimations show that in the considered system with the patch-cord length of 2 m and the patch-cord numerical aperture N A p equal to 0.22, the path-length difference Δ s m is about 30 mm. As β is inversely proportional to the number of excited modes N m the value of N m for the step index patch-cord can be roughly estimated as 4 π 2 a 2 ( N A p 2 ) / 2 λ 2 , where a is the core radius, in particular, N m ≈ 1550 at λ = 700 nm. Actually, the real effective number of the excited modes occurs smaller than this upper estimation due to non-uniform excitation.
The output tip of the fiber-optic patch-cord was connected to the input optical connector of the Ocean Optics HR4000CG-UV-NIR spectrometer, and the fluorescence spectra of the examined samples were recorded in the spectral ranges corresponding to their fluorescence emission bands (between 600 and 700 nm) with the spectral resolution Δ λ approximately equal to 1 nm. These spectral selection parameters correspond to the coherence length l c λ ¯ 2 / n e f Δ λ of the detected radiation in the examined samples, which varies from ≈250 µm to ≈330 µm (here, λ ¯ is the central wavelength of the radiation selected by the used spectral window Δ λ , and n e f is the effective refractive index of the examined medium).
Fluorescence radiation was collected from the various areas of the sample surface using a step-by-step scanning with the scan step Δ x equal to 10 micrometers. In the course of the scanning, the examined sample was sequentially displaced in the lateral direction with respect to the axis of the light-collection system. For each position of the sample, the fluorescence spectrum from the given light-collection zone was recorded; the data acquisition time was equal to 10 s, and the acquisition procedure began with a 5 s delay after setting the sample to the fixed position (to minimize the influence of mechanical oscillations in the system on the acquired data). A sufficiently larger value of Δ x in comparison with d z provided confidence in statistical independence of the spectral data obtained from the various light-collection zones on the sample surface.
In the course of the spectral data acquisition, the examined samples were irradiated by a diverging continuous-wave laser beam using the oblique incidence illumination geometry (Figure 1); the used concave lens expanding the pumping beam had a focal length equal to −200 mm. The angle of incidence was equal to 86° and the laser light spot totally covered the sample surface. The incidence angle of the given value, which corresponds to an almost sliding fall of the pumping beam onto the sample surface, was chosen to exclude vignetting of the irradiated surface by the objective body. The wavelength of laser radiation was equal to 532 nm (a Nd/YAG DPSS laser with the frequency doubling, 50 mW output), and a roughly estimated value of the energy flux density of the pumping light, which penetrates through the sample surfaces was roughly estimated as ≈1–3 W/cm2.
The samples were scanned along an arbitrarily chosen trace, the number of scan points for each trace was chosen equal to 100. The scan runs were repeated 5 times with an arbitrarily chosen initial point. Thus, the statistical moments of intensity fluctuations I , I 2 , I 3 were averaged for the chosen wavelength over the sampling sets containing 500 values.
The noise-accounting technique included the following procedures: recording of the fluorescence spectra from the dye solution and the dye-impregnated samples without scanning (at a fixed position of the light-collecting unit, the “static” measurements). In the course of spectral data acquisition for noise accounting, the acquisition parameters (in particular, the integration time of the spectrometer) were chosen the same as for the scanning experiments. In addition, the number of acquisition runs ( N r = 500), which was used to estimate I 2 / I 2 and I 3 / I 3 in both “static” cases, corresponded to the number of the sampling points in the course of sample scanning.

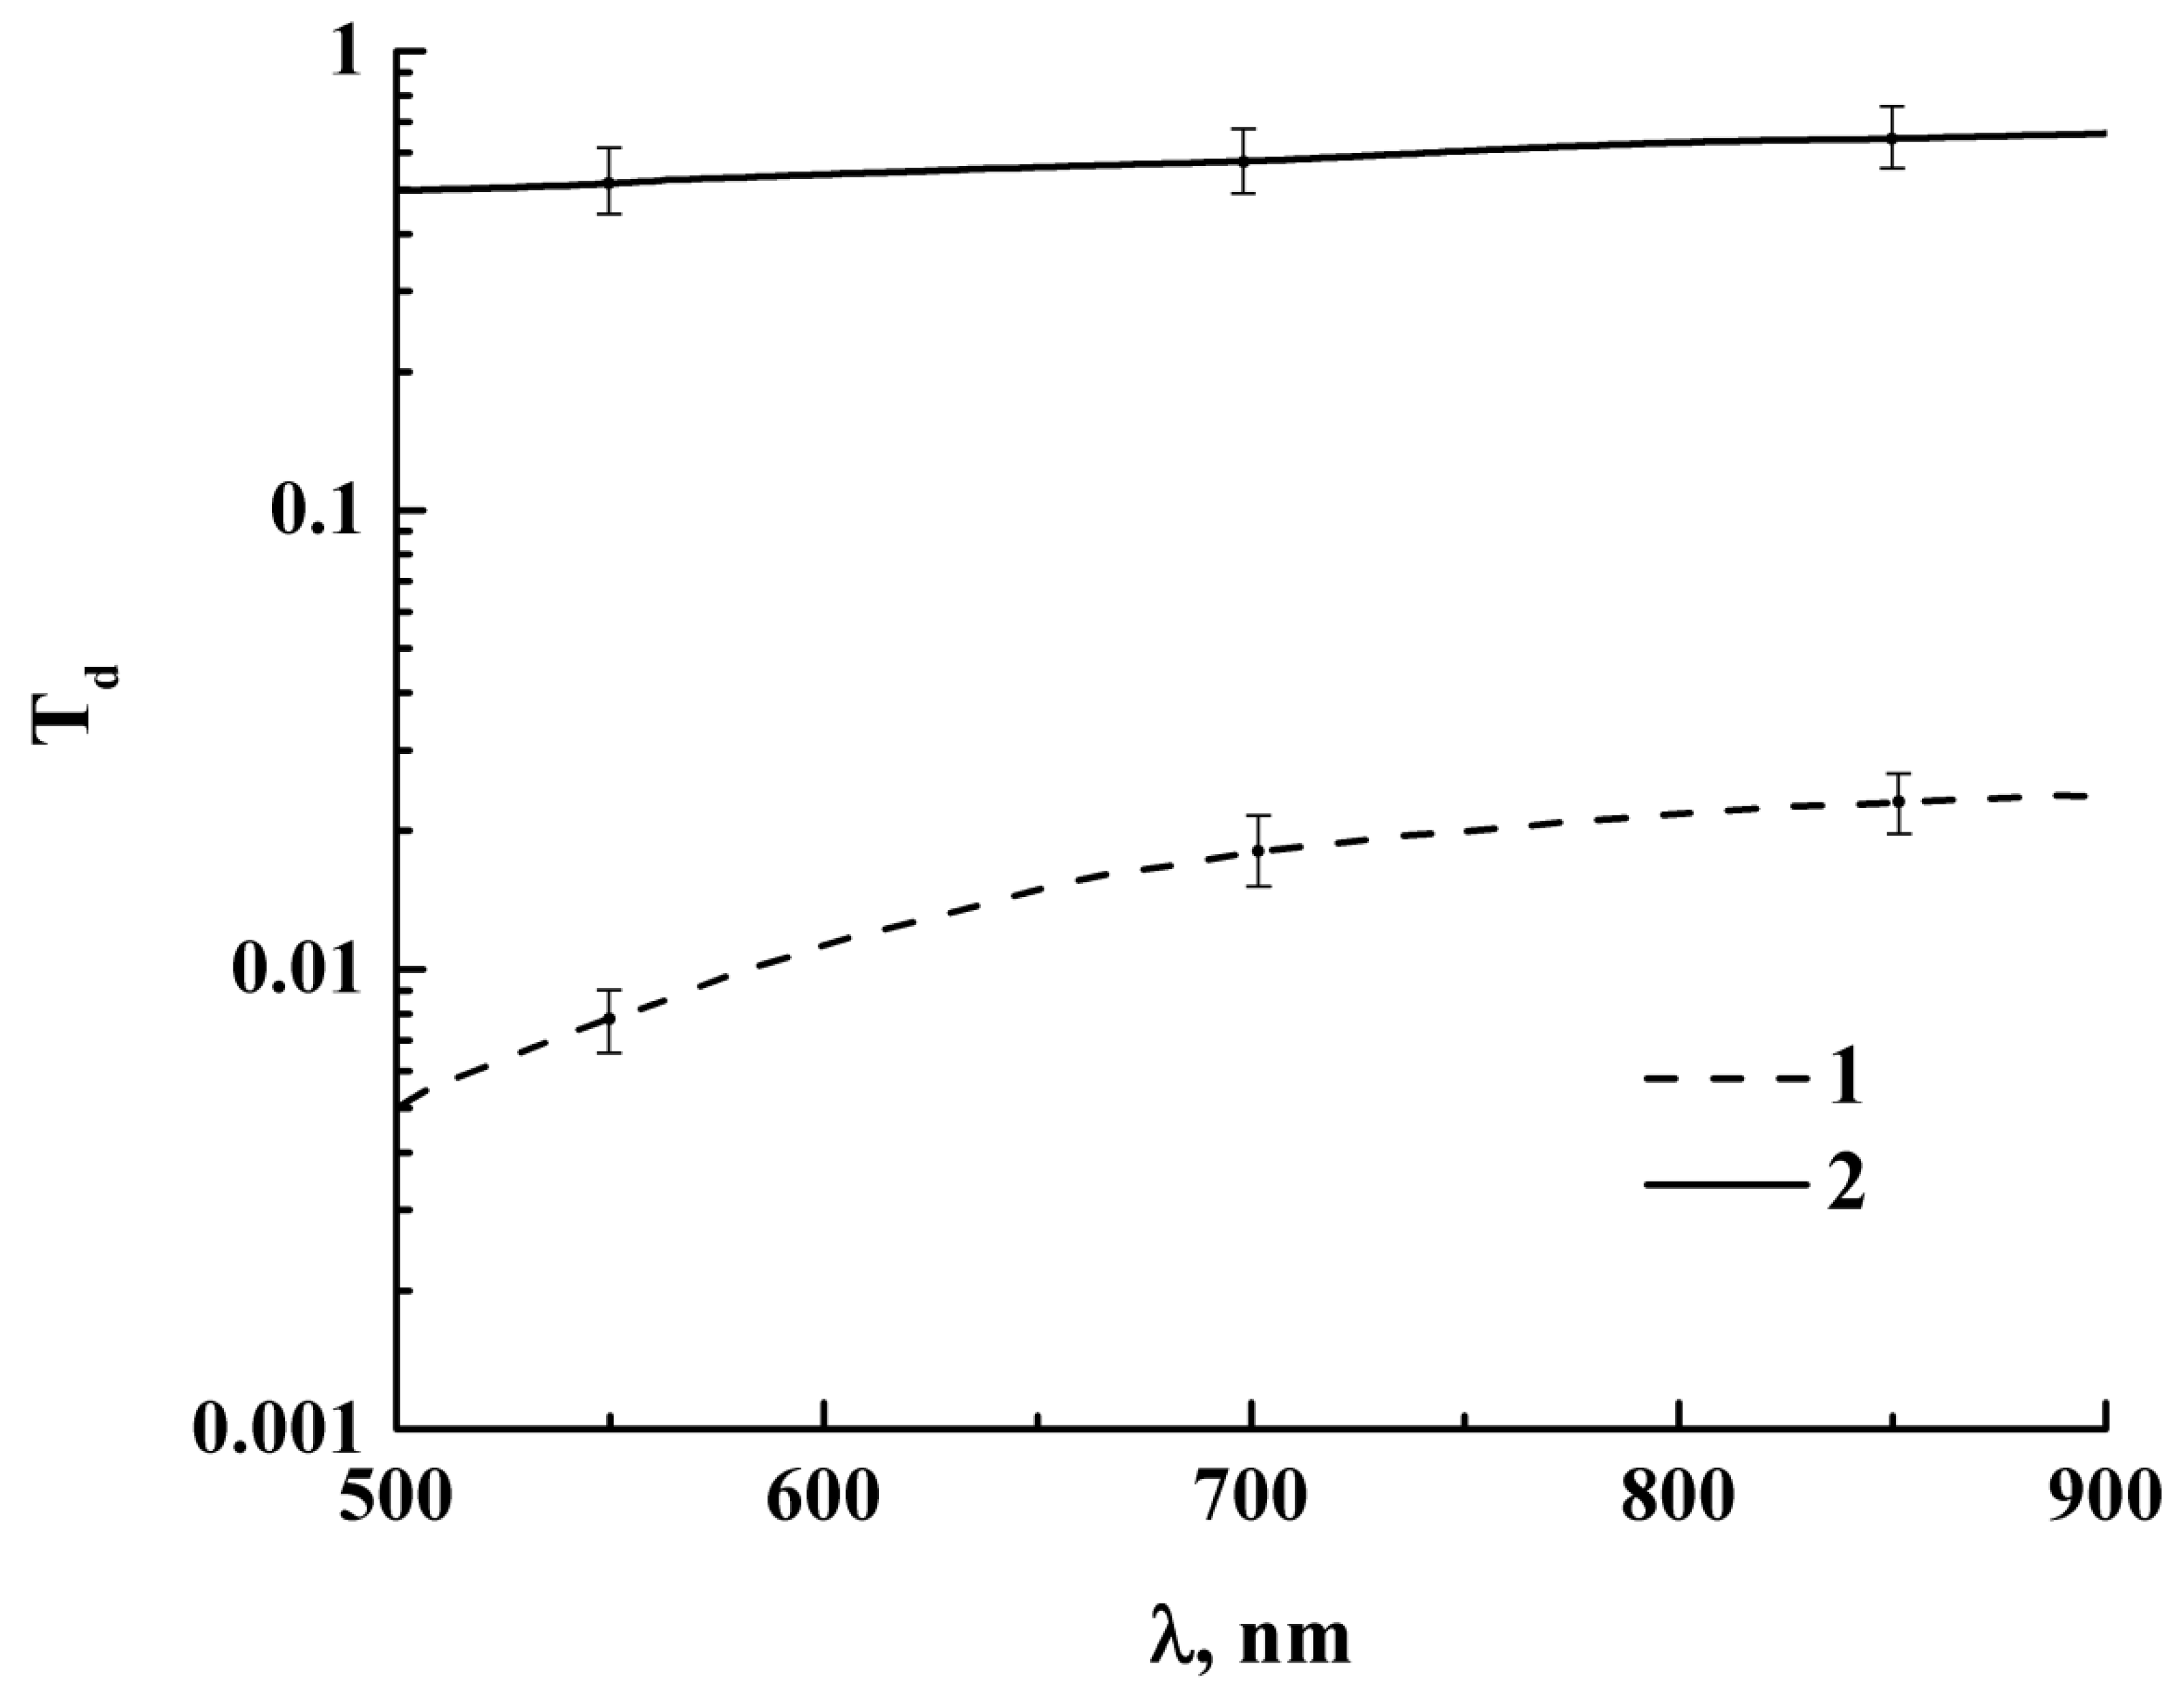
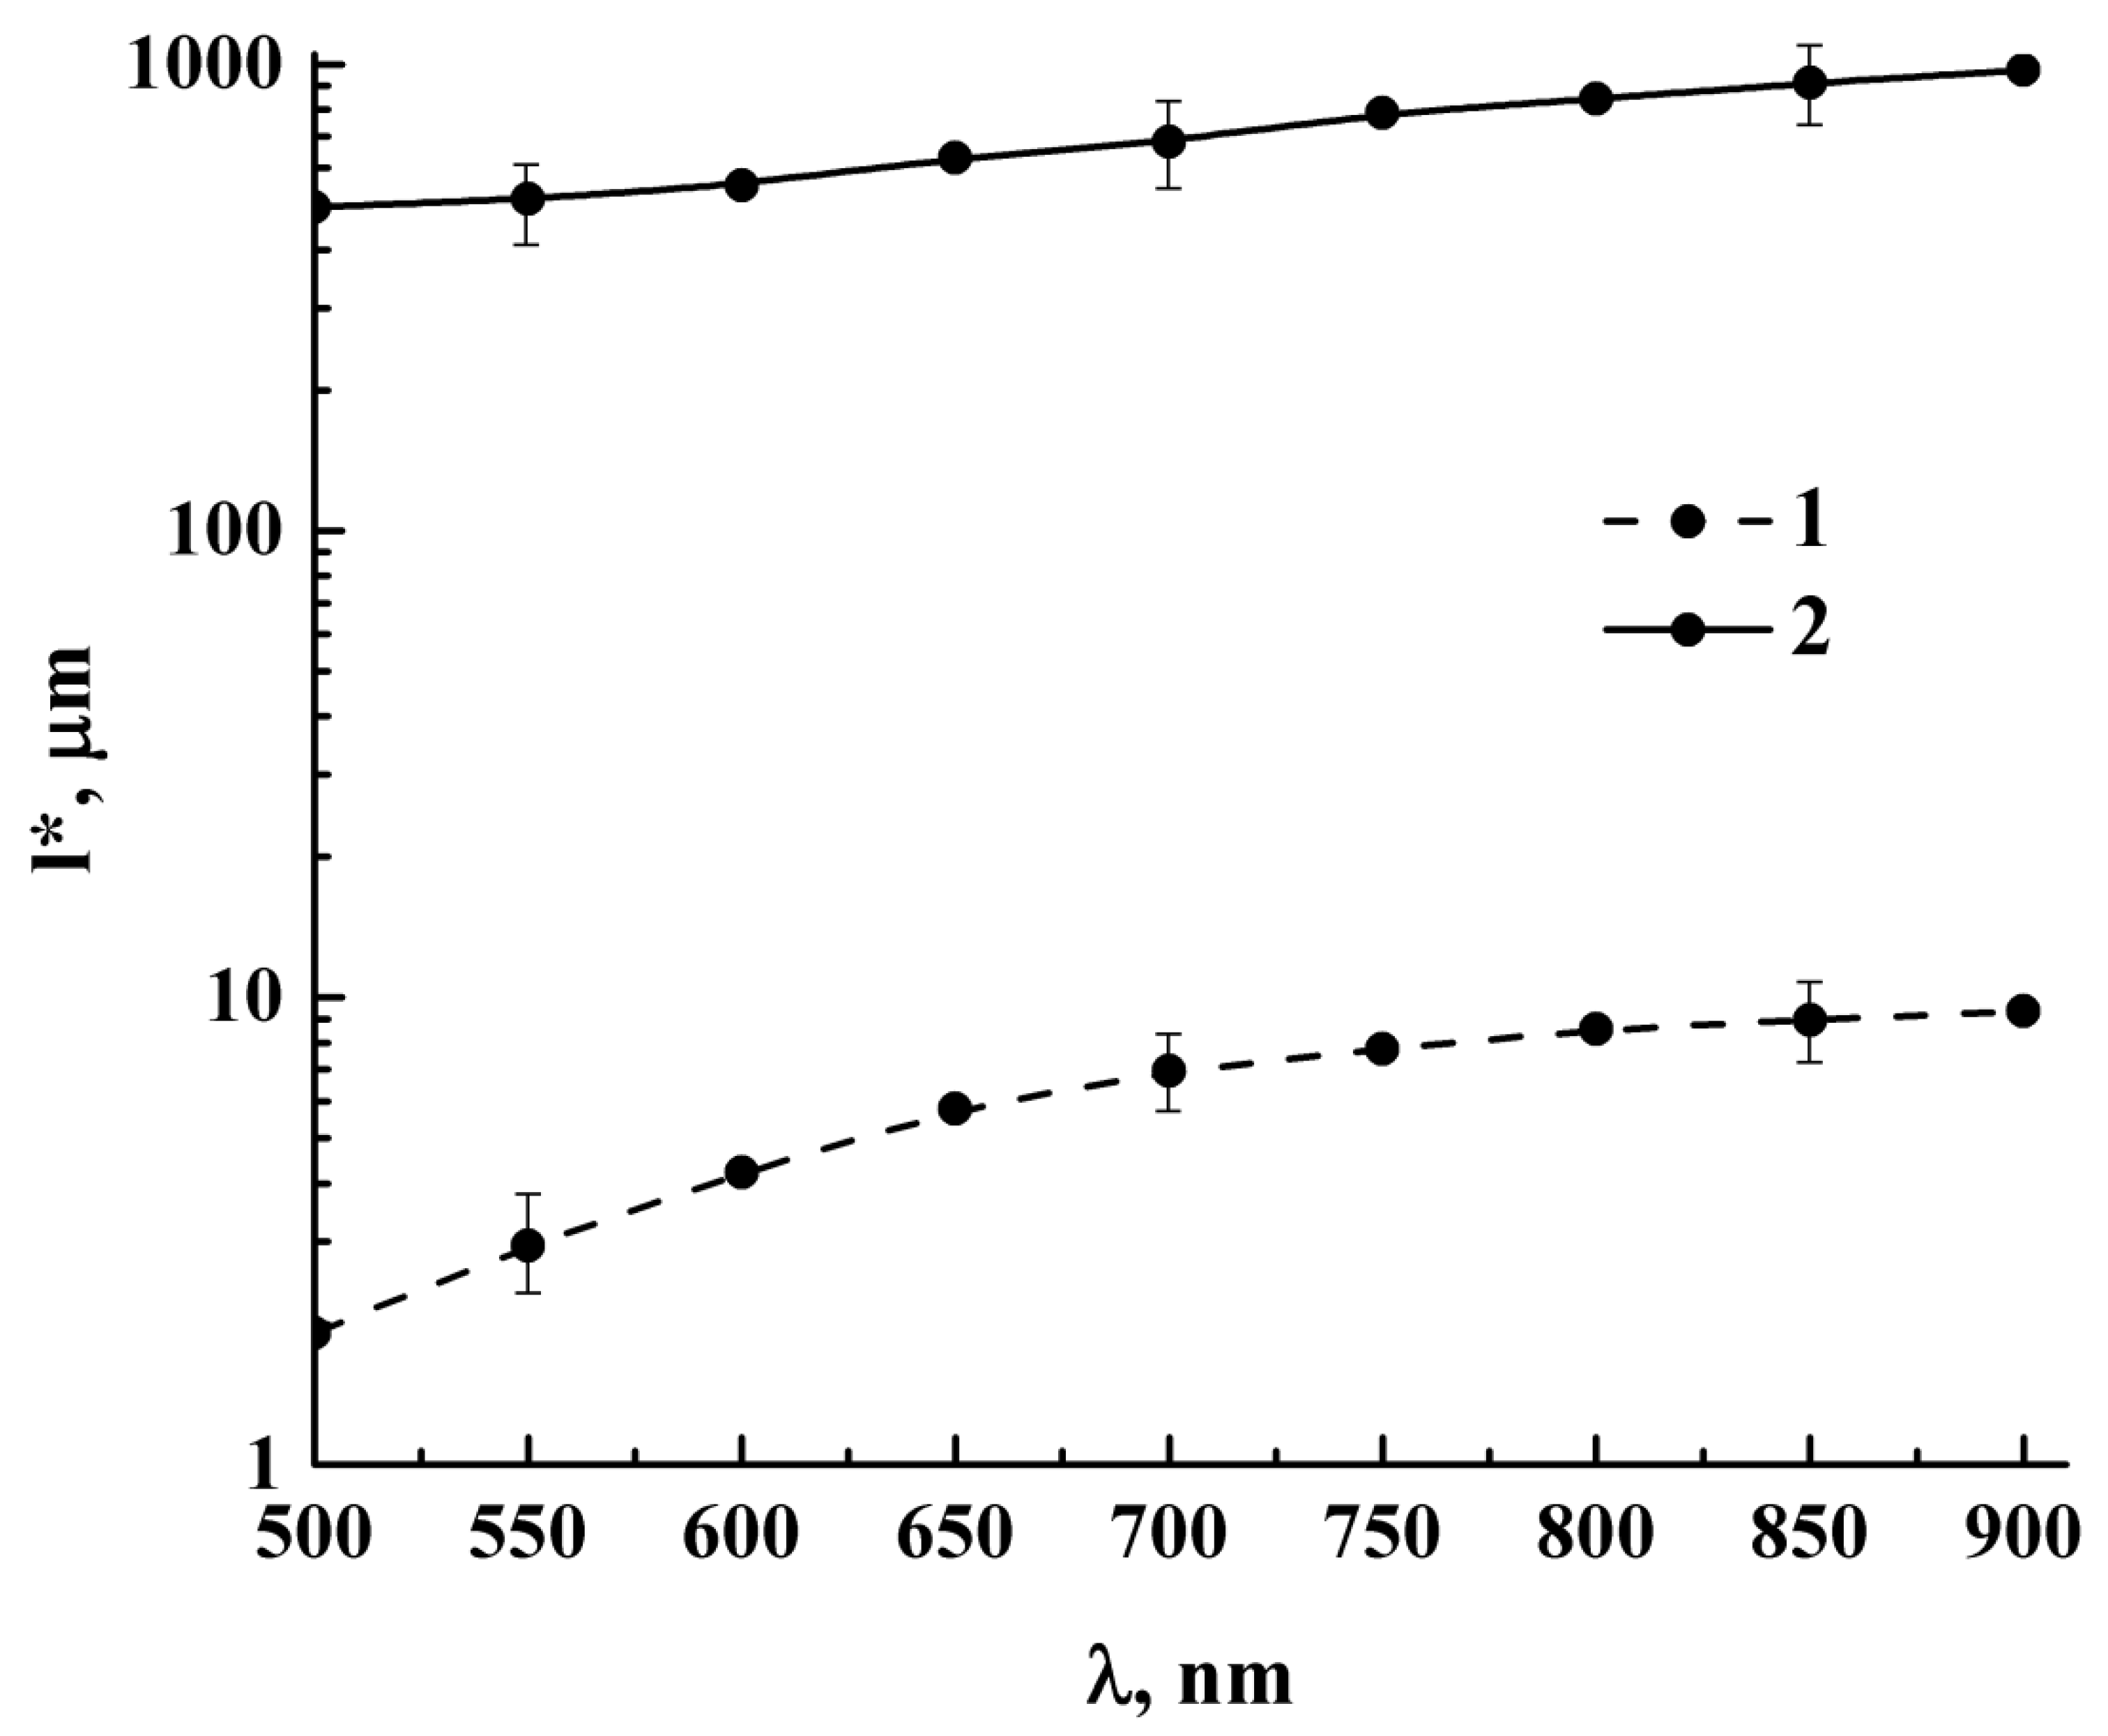
3.2. Sample Preparation and Characterization

The examined samples were prepared as the layers of oxide powders impregnated by the water solution of the dye with a high value of the quantum yield of fluorescence (Rhodamine 6G). The matrix media (powder layers) consisted of TiO2 (anatase) and SiO2 spheroidal nanoparticles; the layers of anatase particles (the product # 637254 from the Sigma Aldrich Inc., the average size is less than 25 nm) were characterized by the volume fraction f T i O 2 of particles approximately equal to 0.20 (in the dye-impregnated state). The prepared silica powder layers (the product #MKBV0382V) had the volume fraction of the silica f S i O 2 in the impregnated state approximately equal to 0.1. The values of f T i O 2 and f S i O 2 were obtained using the volumetric measurements of both systems in the dry and water-impregnated states taking into account the degree of contraction due to impregnation.
The Rhodamine 6G solution was prepared with the dye molar fraction equal to 2.5 × 10⁻⁴ M/l. The measurement of the absorbance of the prepared dye solution in 1-mm thick cell at the wavelength of laser pumping (532 nm) allowed for evaluation of the absorption coefficient μ a as equal to ≈3.7 mm−1; this magnitude fairly agrees with the expected value, estimated using the previously published absorption spectra results for the Rhodamine 6G water solutions [30]. Consequently, the estimated value of the absorption length l a = μ a 1 of the pumping light in the dye solution is equal to ≈270 µm. The prepared samples were placed in cylindrical containers with a height of 2 mm and an inner diameter of 20 mm; 1.5 mm thick glass substrates were used as undersides of the containers. The thicknesses L of the examined dye-saturated TiO2- and SiO2-based layers were approximately equal to 1.46 mm and 1.0 mm.
The matrix media in the water-saturated state were characterized using the measurements of the diffuse transmittance spectra T d ( λ ) within the spectral range from 500 nm to 900 nm. The spectra were obtained using the integrating sphere (Thorlabs IS200-4) with a coupled fiber-optic patchcord (Ocean Optics P100 UV-VIS) as the light-transfer channel from the integrating sphere to the spectrometer (Ocean Optics QE65000). The Ocean Optics DH2000 unit was used as the broadband light source in the spectral measurements. All the necessary pre-calibration and reference-normalization procedures were provided. The obtained T d values were averaged over five independent spectral runs. Figure 3 displays smoothed diffuse transmittance spectra T d ( λ ) for the examined titania- and silica-based water-impregnated systems. The obtained spectra were used for the recovery of spectral dependencies of the transport mean free path l * ( λ ) as one of the most important parameters characterizing the light transport in strongly scattering media. The necessity to characterize the examined specimens using the wavelength-dependent values l * ( λ ) evidently follows from the relationship between the average path-length difference Δ s as the key parameter affecting the stochastic interference of multiple-scattered partial waves in the specimens and the transport mean free path ( Δ s ~ l * , see above).
In the diffusion mode of the light propagation through a strongly scattering slab, the diffuse transmittance of the slab can be expressed as [31,32]
T d ( λ ) = { 1 + Z 1 ( λ ) } l * ( λ ) L + { Z 1 ( λ ) + Z 2 ( λ ) } l * ( λ ) ,
where Z 1 ( λ ) , Z 2 ( λ ) are dimensionless parameters dependent on the effective refractive index n e f of the slab. As was previously established [32], the relationship (11) can be used to evaluate the diffuse transmittance of the multiple-scattering media with the slab geometry in the case that the slab thickness is at least 5–6 times larger than the transport mean free path. Therefore, this relationship can be fairly applied to estimate l * for the TiO2-based system (Figure 3).
On the contrary, following from the data presented in Figure 3 for the SiO2-based system, it can be concluded that its diffuse transmittance cannot be adequately described in terms of the diffusion approximation ( l * occurs larger than L / 5 ÷ L / 6 ). Therefore, the spectral dependence l * ( λ ) was recovered using the inverse Monte Carlo (MC) modeling with the core MC algorithm repeatedly described in [33].
Figure 4 displays the recovered spectral dependencies of the transport mean free path for the examined water-impregnated matrix media in the spectral range from 500 nm to 900 nm. Note that the titania-based system exhibits a dramatically larger scattering strength compared to the silica-based system (the values of the transport mean free path in the former case are at least two and a half orders of magnitude lower than in the latter case). A remarkable decrease in T d ( λ ) (and, correspondingly, in l * ( λ ) ) in the short-wavelength region (below 600 nm) for the titania-based system is obviously caused by an abruptly increasing refractive index of TiO2 particles near the fundamental absorption band).
Note that a characteristic size of the scattering sites in the prepared samples can differ from the particle sizes in raw powders declared by the manufacturers due to the particle aggregation. Actually, only the volume fractions of the hard phase and the chemical compositions of the prepared samples are the well-established characteristics. It is interesting to compare these sizes. The calculations of l * ( λ ) for the various sizes of the scattering sites, providing a reasonable fit of the recovered spectral dependencies, can be used to estimate the characteristic sizes of scattering sites. These calculations can be carried out using an appropriate wavelength-dependent effective medium model. For this purpose, we applied a wavelength-dependent effective medium model developed in the framework of the coherent potential approximation [34], that was successfully used for calculations of the optical transport parameters ( l * and n e f ) in the various strongly scattering systems consisting of densely packed dielectric particles (see, e.g., Refs. [35,36] for a detailed description of the model and examples of the applications). The simulation showed that the characteristic sizes of the scattering sites, which correspond to the experimentally observed spectral dependencies l * ( λ ) are several times (5–8) larger than the declared particle sizes in the raw powders.

4. Experimental Results

Figure 5 and Figure 6 display the “raw” dependencies I ( λ ) , I 2 ( λ ) , I 3 ( λ ) obtained in the course of scanning of the examined TiO2- and SiO2-based fluorescent systems within the spectral range from 600 nm to 900 nm, which corresponds to a long-wavelength region of fluorescence emission of the Rhodamine 6G solution. Figure 7 shows the fragments (600 nm–800 nm) of the smoothed and normalized emission spectra I ( λ ) / I ( 600 ) obtained for pure solution of Rhodamine 6G (1) and two examined dye-impregnated fluorescent systems in the scan mode. Note the practical identity of the spectra (1), (2), and a long-wavelength expansion of the spectrum for the TiO2-based system (3). In addition, the integrated spectral outputs of the excited fluorescence Q = 600 900 I ( λ ) d λ for the silica- and titania-based systems under the same excitation and detection conditions differ by more than ten times: Q T i O 2 / Q S i O 2 ≈ 15.26.
Evidence of the stochastic interference effect of partial fluorescence waves on fluctuations in the detected optical signal is illustrated by Figure 8 and Figure 9; the presented I 3 ( λ ) / I ( λ ) 3 dependencies were obtained using both “static” and scanning modes: the recording and time averaging of the fluorescence spectra from the pure Rhodamine 6G solution (1, the noise-accounting mode, see Section 3.2), recording and time averaging of the fluorescence spectra for the TiO2- and SiO2-based system in the fixed zone without scanning (2, the noise-accounting mode), and recording and ensemble averaging of the fluorescence spectra for the titania- and silica-based system in the course of scanning (3, the working mode) are similar.

5. Discussion of the Results

5.1. The Wavelength-Averaged Dispersion of the Third-Order Statistical Moments of Intensity Fluctuations

The differences between the recovered I 3 ( λ ) / I ( λ ) 3 spectra obtained for the examined systems under various conditions can be quantified using the estimations of the wavelength-averaged dispersion of the normalized third-order moment M 3 ( λ ) :
D I 3 / I 3 ¯ = λ 1 λ 2 d ( I 3 / I 3 ) d λ d λ λ 2 λ 1
The dispersion values D I 3 / I 3 ¯ estimated for various experimental conditions in the spectral region from λ 1 = 600 nm to λ 2 = 750 nm are presented in Table 1.
Figure 10 displays the noise-corrected spectral dependencies M 3 ( λ ) for the examined fluorescent systems in the case of the scanning mode; the noise reduction was carried out in accordance with Equation (5) using the “static” reference data (the time-averaged values I 2 / I 2 , I 3 / I 3 obtained without scanning).
Comparing these data with the previously reported results for Rhodamine-6G-doped coarse-grained silica layers, which were obtained using the Horiba Jobin Ivon Lab Ram HR800 microscope as a detection unit [29], we clearly see the abovementioned suppression effect due to mode excitation in the light-transferring multimode channel. Typically, the ratios ( M 3 1 ) i / ( M 3 1 ) i i are in the range from ≈1.0 × 10⁻³ to ≈ 5.0 × 10⁻³ for the wavelengths changing from 600 nm to 700 nm ( i corresponds to the data for the examined silica-based system presented in Figure 8, i i corresponds to the data taken from [29]). Despite a certain difference in the optical transport properties of the examined systems and fluorescence excitation conditions, the wavelength-averaged value β = ( M 3 1 ) i / ( M 3 1 ) i i can be used to characterize the “random generation” of uncorrelated radiation sources due to mode excitation in the patch-cord (in the case of application of the Horiba Jobin Ivon Lab Ram HR800 microscope this effect is absent). The estimated value β ¯ = 600 700 β ( λ ) d λ / 100 is approximately equal to 2 × 10⁻³, which is in a reasonable agreement with the abovementioned estimation of the number of excited modes ( N m ~ β 1 ).
Note that such rapid increase M 3 for the examined fluorescent systems with the increasing wavelength (see Figure 10) cannot be explained only in terms of the decreasing number of excited modes. N m is inversely proportional to λ 2 , and transition from 600 nm to 700 nm causes only 1.36-fold decrease in N m , while a multiple increase in M 3 takes place. Also, note that the damping factor β is the same for both examined systems, and this allows for a comparison of their radiation transfer properties on the basis of the obtained experimental dependencies.

5.2. Influence of the Optical Transport Parameters of the Examined Systems

A sufficiently larger rate of M 3 increase with an increasing wavelength for the titania-based system can be interpreted in terms of high efficiency of fluorescence excitation in a relatively thin subsurface layer of the system compared to the silica-based system. This is consistent with a significantly larger integrated fluorescence yield Q and fluorescence spectrum expansion in the long-wavelength region (Figure 6, curve 3) which resulted from a significantly smaller value of the transport mean free path in the ensemble of densely packed titania particles. These features can be considered using the following qualitative phenomenological model. Under the used fluorescence excitation conditions (in particular, a sliding fall of the laser beam onto the sample surface), the penetrating pumping light propagates in a thin subsurface layer of the sample undergoing gradual absorption and simultaneous transformation to a diffuse component. The characteristic scale of the light propagation in the random media is related to the extinction length l e x t , which is inverse of the extinction coefficient μ e x t :
l e x t 1 = μ e x t = μ a + μ s = l a 1 + l s 1 ,
where μ a , μ s are absorption and scattering coefficients of the medium, and l s is the scattering mean free path. A near-isotropic scattering occurs in the examined systems and, therefore, we can set l s l * . Consequently, the extinction length is approximately equal to l e x t l a l * / ( l a + l * ) . Based on the characterization results for the examined systems we can see that, in the case of titania-based system at 532 nm, the absorption length is significantly larger than l T i O 2 * . Correspondingly, l e x t , T i O 2 l T i O 2 * . The SiO2 -based system is characterized by a sufficiently larger value of the extinction length l e x t , S i O 2 > > l e x t , T i O 2 . Therefore, we can conclude that transformation of the pumping light to the fluorescence radiation occurs in a sufficiently thinner subsurface layer in the TiO2-based system compared to the SiO2-based system. In the spectral region of interest, from 600 nm to 700 nm, the absorbance of the system is governed only by self-absorption of fluorescence radiation and the absorption length is expected to be larger than in the case of 532 nm. As a result of sample characterization (Section 3.2), we can assume that the fluorescence radiation field is mainly localized in the subsurface layer of the TiO2-based sample with the thickness of the order of few micrometers. In this case, the average path-length difference Δ s , which determines M 3 for the non-polarized light under the given value of l c , is proportional to l T i O 2 * . In contrast, the zone of fluorescence radiation localization is distributed over the entire thickness of the SiO2-based sample. For such radiation conditions, the average path-length difference becomes dependent not only on the transport mean free path l T i O 2 * , but also on the sample thickness. In any case, Δ s S i O 2 > Δ s T i O 2 , and this is manifested in the larger values of M 3 for the TiO2-based samples. In addition, it is necessary to note that the average volume density of fluorescence radiation energy is substantially higher in titania-based systems due to a smaller localization zone compared with the silica-based system. This is the reason for the abovementioned features of the fluorescence spectrum of the TiO2-based system.

5.3. Comparison with Other Experimental Data

It is interesting to compare the estimated optical properties of the examined systems with the characteristics of the previously studied similar systems applied in the random lasing experiments. In particular, in one of the early works on random lasing, Lawandy et al. [37] studied the radiative properties of the laser dye (Rhodamine 640 perchlorate in methanol) dispersed in strongly scattering matrix media (colloidal suspensions of titanium dioxide particles). The Al2O3-coated titania particles with an average diameter d of 250 nm were used to obtain the dye-containing random media with the particle densities ρ varying between 1.4·109 cm−3 and 8.6·1011 cm−3. Accordingly, the particle volume fractions f π d 3 ρ / 6 varied between ≈ 1.1·10−5 and ≈ 7.0·10−3. These small values of f allow for estimation of the scattering mean free path l and the transport mean free path l * for the examined systems in the absence of absorption using the weak scattering approximation: l 1 / σ s ρ and l * 1 / σ s ρ ( 1 g ) , where σ s is the scattering cross-section of particles and g is the scattering anisotropy parameter. Application of the Mie scattering calculator [38] to these systems gives the values of l and l * at the lowest and highest particle concentrations and λ = 600 nm equal to l max 4000 µm, l max * 7630 µm, and l min 6.5 µm, l min * 12.4 µm. Note that in accordance with the experimental data presented in [37], the evident transition from spontaneous amplification of fluorescence radiation to the random lasing in the studied titania-based systems with an increasing pump intensity occurs when the particle concentration is equal to ≈2.8 × 1010 cm−3 ( l 200 µm, l * 382 µm) or more. It should be mentioned that a non-linear optical behavior of this system (in particular, broadening of the fluorescence emission spectrum due to the scattering-enhanced self-absorption of the dye resulting in re-emission) was only observed in the cuvettes thicker than 100 µm. Thus, the critical ratio of the system thickness to the transport mean free path Ψ c r = L c r / l * , which is necessary for a non-linear optical behavior of the examined system under pulse laser pumping, can be estimated at λ = 600 nm as Ψ c r 0.262.
In our case, the titania- and silica-based fluorescent random systems are continuously irradiated by the laser light at significantly lower pump intensities in comparison with [37] (at least seven decades below the peak intensity used by Lawandy’s group, taking into account the laser beam parameters and a large oblique incidence angle in our case). In addition, the examined systems are specified by a larger value of the scattering strength (in the case of the TiO2-based system) and lower dye concentration. Nevertheless, the applied CW pumping of TiO2-based system stimulates its non-linear behavior. The L / l * ratios in the spectral range between 600 nm and 700 nm vary between ≈1.5 and ≈1.8 for the silica-based system and between ≈200 and ≈350 for the titania-based system.
The primary effect observed in both systems examined in this work is a remarkable elongation of the average propagation path s of fluorescence radiation (and, consequently, the average path-length difference Δ s ) in the spectral region corresponding to the dye fluorescence band). This feature observed in the spectral region of fluorescence peak localization is presumably caused by a slight negative absorption and, correspondingly, spontaneous amplification of fluorescence radiation inducing long-range random walks of fluorescence photons in the systems before leaving. The s values associated with such random travelling of fluorescence photons become larger compared to the characteristic travel paths in the non-fluorescent random media with the same values of the scattering strength.

6. Conclusions

In this work, we have verified applicability of the band-limited reference-free speckle spectroscopy (BLRFS) with the moderate spectral resolution of the applied bench-top instrument to characterize a fluorescence radiation transport in multiple-scattering random media. Another important feature of the examined BLRFS instrument is “random mixing” of the collected fluorescence radiation at the optical path between the light-collecting system and the monochomator. This “mixing” occurs due to application of a multimode fiber-optic patch-cord as a radiation-transferring channel and causes significant suppression of the detected intensity fluctuations. The considered noise-reduction and data-correction procedures allow for recovery of the spectral dependencies of statistical moments of scan-induced intensity fluctuations even in the case of relatively small coherence lengths of spectrally selected fluorescence radiation compared to the characteristic propagation path of fluorescence photons in the medium. Despite a significant suppression of intensity fluctuations resulting from non-ideal detection conditions (in particular, a small value of β ), the features of fluorescence radiation transfer in the probed media caused by an expressed multiple-scattering can be clearly identified using the BLRFS system assembled from commonly available components. These features are elongation of the characteristic propagation path of fluorescence photons due to a presumable negative absorption of fluorescence radiation in a certain spectral interval and a strong influence of the scattering strength on this process.
A key point in the application of the BLRFS method for characterization of the light transport in random media is to provide a satisfactory sensitivity of the measured informative parameters (the statistical moments of intensity fluctuations at various wavelengths) to wavelength-dependent changes in the characteristics of the light-medium interactions (in particular, the transport mean free path and the absorption length). A general criterion for such satisfactory sensitivity can be represented in the following form: Δ s / l c ~ 1 . In the opposite cases Δ s / l c 0 and Δ s / l c > > 1 , the measured statistical moments of intensity fluctuations are practically insensitive to variations in the interaction characteristics. It should be noted that for a given probed medium, the average path-length difference Δ s for a given wavelength is fixed, while the coherence length l c can be adjusted. The achievable upper limit of the coherence length adjustment is defined by the maximal spectral resolution of the applied spectral selection unit (the monochromator), and the coherence length of detected light can be reduced from this limit using enlargement of an output slit of the monochomator (or, similarly, smoothing of the spectral data by a running window at the data processing stage). Another way to reduce the coherence length examined in this work is to apply a multimode fiber-optic patch-cord with a given length as a light-transferring channel between the light-collecting assembly and the monochromator. The enforced reduction of the coherence length of detected radiation can be especially useful in the case of the BLRFS probes of micro- or nano-structured composite systems consisting of dielectric or semiconductor nanoparticles characterized by a large permittivity in the optical range. For these systems, the transport mean free paths of visible and near-infrared light are typically equal to a few micrometers (in our case, see the obtained data for the titania-based samples). Consequently, the average path-length differences are of the order of the same value, and the expected values of the non-reduced coherence length l c ~ λ ¯ 2 / Δ λ for BLRFS instruments with an intermediate spectral resolution ( Δ λ 1 nm or less) significantly exceed the Δ s values for the examined samples. Therefore, in this case the enforced reduction of the coherence length is necessary.
Further studies will be focused on the creation of a phenomenological model to establish the relationship between spectral dependencies of statistical moments of spectrally selected intensity fluctuations and parameters characterizing the fluorescence radiation transport at the microscopic level in strongly scattering random media (such as, e.g., probabilities of self-absorption and re-emission processes depending on the photon fluence rate and photon energy). In our opinion, these efforts can be useful for further developments of photonic applications in the fields of non-linear and active random media.

Author Contributions

A.I. and D.Z. designed the plan for theoretical investigation and experiments; E.I., and S.V. fabricated the samples and performed the measurements. D.Z., E.I., A.I., and S.V. developed the physical model and performed mathematical calculations. All the authors contributed to scientific discussions and writing and editing of the manuscript. All authors have read and agreed to the published version of the manuscript.

Funding

The reported study was funded by RFBR according to the research project No. 18-32-00584. S.V. acknowledges the support from the Russian Foundation for Basic Research (project No. 19-32-90221) in the part of designing the experimental setup.

Conflicts of Interest

The authors declare no conflict of interest.

References

  1. Maret, G.; Wolf, P.E. Multiple light scattering from disordered media. The effect of Brownian motion of scatterers. Zeitschrift für Physik B Condensed Matte 1987, 65, 409–413. [Google Scholar] [CrossRef]
  2. Pine, D.J.; Weitz, D.A.; Chaikin, P.M.; Herbolzheimer, E. Diffusing wave spectroscopy. Phys. Rev. Lett. 1988, 60, 1134–1137. [Google Scholar] [CrossRef] [PubMed] [Green Version]
  3. Pine, D.J.; Weitz, D.A.; Zhu, J.X.; Herbolzheimer, E. Diffusing-wave spectroscopy: Dynamic light scattering in the multiple scattering limit. J. Phys. Fr. 1990, 51, 2101–2127. [Google Scholar] [CrossRef] [Green Version]
  4. Yodh, A.G.; Kaplan, P.D.; Pine, D.J. Pulsed diffusing-wave spectroscopy: Pathlengthspecific observation of speckle fluctuation spectra from dense colloids. Springer Ser. Chem. Phys. 1990, 53, 169–171. [Google Scholar] [CrossRef]
  5. Morin, F.; Borrega, R.; Cloitre, M.; Durian, D. Static and dynamic properties of highly turbid media determined by spatially resolved diffusive-wave spectroscopy. Appl. Opt. 2002, 41, 7294–7299. [Google Scholar] [CrossRef]
  6. Scheffold, F.; Skipetrov, S.E.; Romer, S.; Schurtenberger, P. Diffusing-wave spectroscopy of nonergodic media. Phys. Rev. E 2001, 63, 061404. [Google Scholar] [CrossRef] [Green Version]
  7. Wu, X.-L.; Pine, D.J.; Chaikin, P.M.; Huang, J.S.; Weitz, D.A. Diffusing-wave spectroscopy in a shear flow. JOSA B 1990, 7, 15–20. [Google Scholar] [CrossRef]
  8. Bicout, D.; Maynard, R. Diffusing wave spectroscopy in inhomogeneous flows. Physica A 1993, 199, 387–411. [Google Scholar] [CrossRef]
  9. Heckmeier, M.; Skipetrov, S.E.; Maret, G.; Maynard, R. Imaging of dynamic heterogeneities in multiple scattering media. JOSA A 1997, 14, 185–191. [Google Scholar] [CrossRef]
  10. Viasnoff, V.; Lequeux, F.; Pine, D.J. Multispeckle diffusing-wave spectroscopy: A tool to study slow relaxation and time-dependent dynamics. Rev. Sci. Instrum. 2002, 73, 2336–2344. [Google Scholar] [CrossRef] [Green Version]
  11. Durian, D.J.; Weitz, D.A.; Pine, D.J. Multiple light-scattering probes of foam structure and dynamics. Science 1991, 252, 686–688. [Google Scholar] [CrossRef] [PubMed]
  12. Zakharov, P.; Scheffold, F. Monitoring spatially heterogeneous dynamics in a drying colloidal thin film. Soft Mater. 2010, 8, 102–113. [Google Scholar] [CrossRef] [Green Version]
  13. Brunel, L.; Brun, A.; Snabre, P.; Cipelletti, L. Adaptive speckle imaging interferometry: A new technique for the analysis of microstructure dynamics, drying processes and coating formation. Opt. Express 2007, 15, 15250–15259. [Google Scholar] [CrossRef] [Green Version]
  14. Romero, G.; Alanis, E.; Rabal, H.J. Statistics of the dynamic speckle produced by a rotating diffuser and its application to the assessment of paint drying. Opt. Eng. 2000, 39, 1652–1658. [Google Scholar] [CrossRef]
  15. Brun, A.; Dihang, H.; Brunel, L. Film formation of coatings studied by diffusing-wave spectroscopy. Prog. Org. Coat. 2008, 61, 181–191. [Google Scholar] [CrossRef]
  16. Bednov, A.; Ulyanov, S.; Cheung, C.; Yodh, A.G. Correlation properties of multiple scattered light: Implication to coherent diagnostics of burned skin. J. Biomed. Opt. 2004, 9, 347–352. [Google Scholar] [CrossRef] [PubMed]
  17. Scheffold, F. Particle sizing with diffusing wave spectroscopy. J. Dispers. Sci. Technol. 2002, 23, 591–599. [Google Scholar] [CrossRef]
  18. Rovati, L.; Cattini, S.; Zambelli, N.; Viola, F.; Staurenghi, G. In-vivo diffusing-wave-spectroscopy measurements of the ocular fundus. Opt. Express 2007, 15, 4030–4038. [Google Scholar] [CrossRef]
  19. Lee, J.Y.; Hwang, J.W.; Jung, H.W.; Kim, H.C.; Lee, S.J.; Yoon, K.; Weitz, D.A. Fast dynamics and relaxation of colloidal drops during the drying process using multispeckle diffusing wave spectroscopy. Langmuir 2013, 29, 861–866. [Google Scholar] [CrossRef]
  20. Ishimaru, A. Diffusion of light in turbid materials. Appl. Opt. 1989, 28, 2210–2215. [Google Scholar] [CrossRef]
  21. Thompson, C.A.; Webb, K.J.; Weiner, A.M. Diffusive media characterization with laser speckle. Appl. Opt. 1997, 36, 3726–3734. [Google Scholar] [CrossRef] [PubMed]
  22. McKinney, J.D.; Webster, M.A.; Webb, K.J.; Weiner, A.M. Characterization and imaging in optically scattering media by use of laser speckle and a variable-coherence source. Opt. Lett. 2000, 25, 4–6. [Google Scholar] [CrossRef] [PubMed]
  23. Webster, M.A.; Gerke, T.D.; Weiner, A.M.; Webb, K.J. Spectral and temporal speckle field measurements of a random medium. Opt. Lett. 2004, 29, 1491–1493. [Google Scholar] [CrossRef]
  24. Webster, M.A.; Webb, K.J.; Weiner, A.M. Temporal response of a random medium from third-order laser speckle frequency correlations. Phys. Rev. Lett. 2002, 88, 033901. [Google Scholar] [CrossRef] [Green Version]
  25. Zang, W.; Weiner, A.M.; Webb, K.J. Interferometry from a scattering medium. Opt. Lett. 2007, 32, 2013–2015. [Google Scholar] [CrossRef]
  26. Rojas, L.F.; Bina, M.; Cerchiari, G.; Escobedo-Sánches, M.A.; Ferri, F.; Scheffold, F. Photon path length distribution in random media from spectral speckle intensity correlations. Eur. Phys. J. Spec. Top. 2011, 199, 167–180. [Google Scholar] [CrossRef] [Green Version]
  27. Zimnyakov, D.A.; Vilensky, M.A. Blink speckle spectroscopy of scattering media. Opt. Lett. 2006, 31, 429–431. [Google Scholar] [CrossRef]
  28. Zimnyakov, D.A.; Oh, J.-T.; Sinichkin, Y.P.; Trifonov, V.A.; Gurianov, E.V. Polarization-sensitive speckle spectroscopy beyond the diffusion limit. JOSA A 2004, 21, 59–70. [Google Scholar] [CrossRef]
  29. Zimnyakov, D.A.; Yuvchenko, S.A.; Pavlova, M.V.; Alonova, M.V. Reference-free path length interferometry of random media with the intensity moments analysis. Opt. Express 2017, 25, 13953–13972. [Google Scholar] [CrossRef]
  30. Bindhu, C.V.; Harilal, S.S.; Nampoori, V.P.N.; Vallabhan, C.P.G. Studies of non-linear absorption and aggregation in aqueous solutions of rhodamine 6G using a transient thermal lens technique. J. Phys. D Appl. Phys. 1999, 32, 407–411. [Google Scholar] [CrossRef] [Green Version]
  31. Johnson, P.M.; Imhof, A.; Bret, B.P.J.; Rivas, J.G.; Lagendijk, A. Time-resolved pulse propagation in a strongly scattering material. Phys. Rev. E 2003, 68, 016604. [Google Scholar] [CrossRef] [Green Version]
  32. Kaplan, P.D.; Kao, M.H.; Yodh, A.G.; Pine, D.J. Geometric constraints for the design of diffusing-wave spectroscopy experiments. Appl. Opt. 1993, 32, 3828–3836. [Google Scholar] [CrossRef] [PubMed]
  33. Zimnyakov, D.A.; Chekmasov, S.P.; Ushakova, O.V.; Isaeva, E.A.; Bagratashvili, V.N.; Yermolenko, S.B. Laser speckle probes of relaxation dynamics in soft porous media saturated by near-critical fluids. Appl. Opt. 2014, 53, B12–B21. [Google Scholar] [CrossRef] [PubMed]
  34. Soukoulis, C.M.; Datta, S.; Economou, E.N. Propagation of classical waves in random media. Phys. Rev. B 1994, 49, 3800–3810. [Google Scholar] [CrossRef] [PubMed]
  35. Zimnyakov, D.A.; Yuvchenko, S.A.; Sina, J.S.; Ushakova, O.V. Effect of the “inversion” of a scattering medium in layers of close-packed titanium dioxide nanoparticles. JETP Lett. 2013, 98, 326–330. [Google Scholar] [CrossRef]
  36. Zimnyakov, D.A.; Pravdin, A.B.; Kuznetsova, L.V.; Kochubey, V.I.; Tuchin, V.V.; Wang, R.K.; Ushakova, O.V. Random media characterization using the analysis of diffusing light data on the basis of an effective medium model. JOSA A 2007, 24, 711–723. [Google Scholar] [CrossRef]
  37. Lawandy, N.M.; Balachandran, R.M.; Gomes, A.S.L.; Sauvain, E. Laser action in strongly scattering media. Nature 1994, 368, 436–438. [Google Scholar] [CrossRef]
  38. Scattering Mie Calculator. Available online: https://omlc.org/calc/mie_calc.html (accessed on 25 November 2019).
Figure 1. The scheme of the band-limited reference-free speckle spectroscopy (BLRFS) instrument used in this work: 1—a continuous wave (CW) pumping laser; 2—a concave lens; 3—a probed sample (a fluorescent dye-doped layer consisting of TiO2 or SiO2 nanoparticles); 4—a microscope objective; 5—a pump-blocking filter; 6—a light-collecting lens; 7—an input tip of the fiber-optic patch-cord as the entrance aperture; 8–a spectrometer; 9–a PC.“A” denotes a light-collecting unit (see Figure 2).
Applsci 10 01629 g001
Figure 2. A diagram displaying the operation principle of the light-collecting unit (“A” in Figure 1); I—input tip of the fiber-optic patch-cord; II—lens; III—microscope objective (Nikon E plan 100X, N.A.1.25); IV—sample under study; V—pump = blocking filter (OG590).
Applsci 10 01629 g002
Figure 3. The diffuse transmittance spectra of the examined samples in the wet state. 1—TiO2-based system; 2—SiO2-based system. Selectively shown error bars correspond to a confidence level of 0.9.
Applsci 10 01629 g003
Figure 4. The recovered spectral dependencies of the transport mean free path for the examined systems in the wet state. Selectively shown error bars correspond to a confidence level of 0.9.
Applsci 10 01629 g004
Figure 5. Spectral dependencies of the statistical moments of fluorescence intensity fluctuations obtained in the course of the TiO2 sample scanning. 1— I ; 2— I 2 ; 3— I 3 .
Applsci 10 01629 g005
Figure 6. Spectral dependencies of the statistical moments of fluorescence intensity fluctuations obtained in the course of the SiO2 sample scanning. 1— I ; 2— I 2 ; 3— I 3 .
Applsci 10 01629 g006
Figure 7. The normalized fluorescence spectra of the examined samples; 1—pure dye solution (“static” mode); 2—SiO2-based system (scan mode); 3—TiO2-based system (scan mode).
Applsci 10 01629 g007
Figure 8. Wavelength-dependent values of the normalized third-order moment of intensity fluctuations in the examined spectral region for the TiO2-based system in the “static” (2) and scan (3) modes. The values of I 3 ( λ ) / I ( λ ) 3 for the dye solution (1) are given for reference.
Applsci 10 01629 g008
Figure 9. The same as in Figure 8 for the SiO2-based (b) system.
Applsci 10 01629 g009
Figure 10. The noise-corrected wavelength-dependent values of the normalized third-order moment of intensity fluctuations in the spectral region of interest for TiO2-based (1) and SiO2-based (2) systems.
Applsci 10 01629 g010
Table 1. The wavelength-averaged dispersion of the third normalized moment I 3 / I 3 , nm−1.
(I), Dye Solution(II), SiO2-Based
System, Static
(III), SiO2-Based
System, Scan
(IV), TiO2-Based
System, Static
(V), TiO2-Based
System, Scan
≈1.0 × 10⁻⁶≈1.53 × 10⁻⁶≈97.33 × 10⁻⁶≈2.40 × 10⁻⁶≈240.27 × 10⁻⁶

