Energy Sustainability of Bio-Based Building Materials in the Cold and Severe Cold Regions of China—A Case Study of Residential Buildings

 ,
, 
Abstract
1. Introduction
1.1. Energy Consumption of Residential Buildings in Northern China
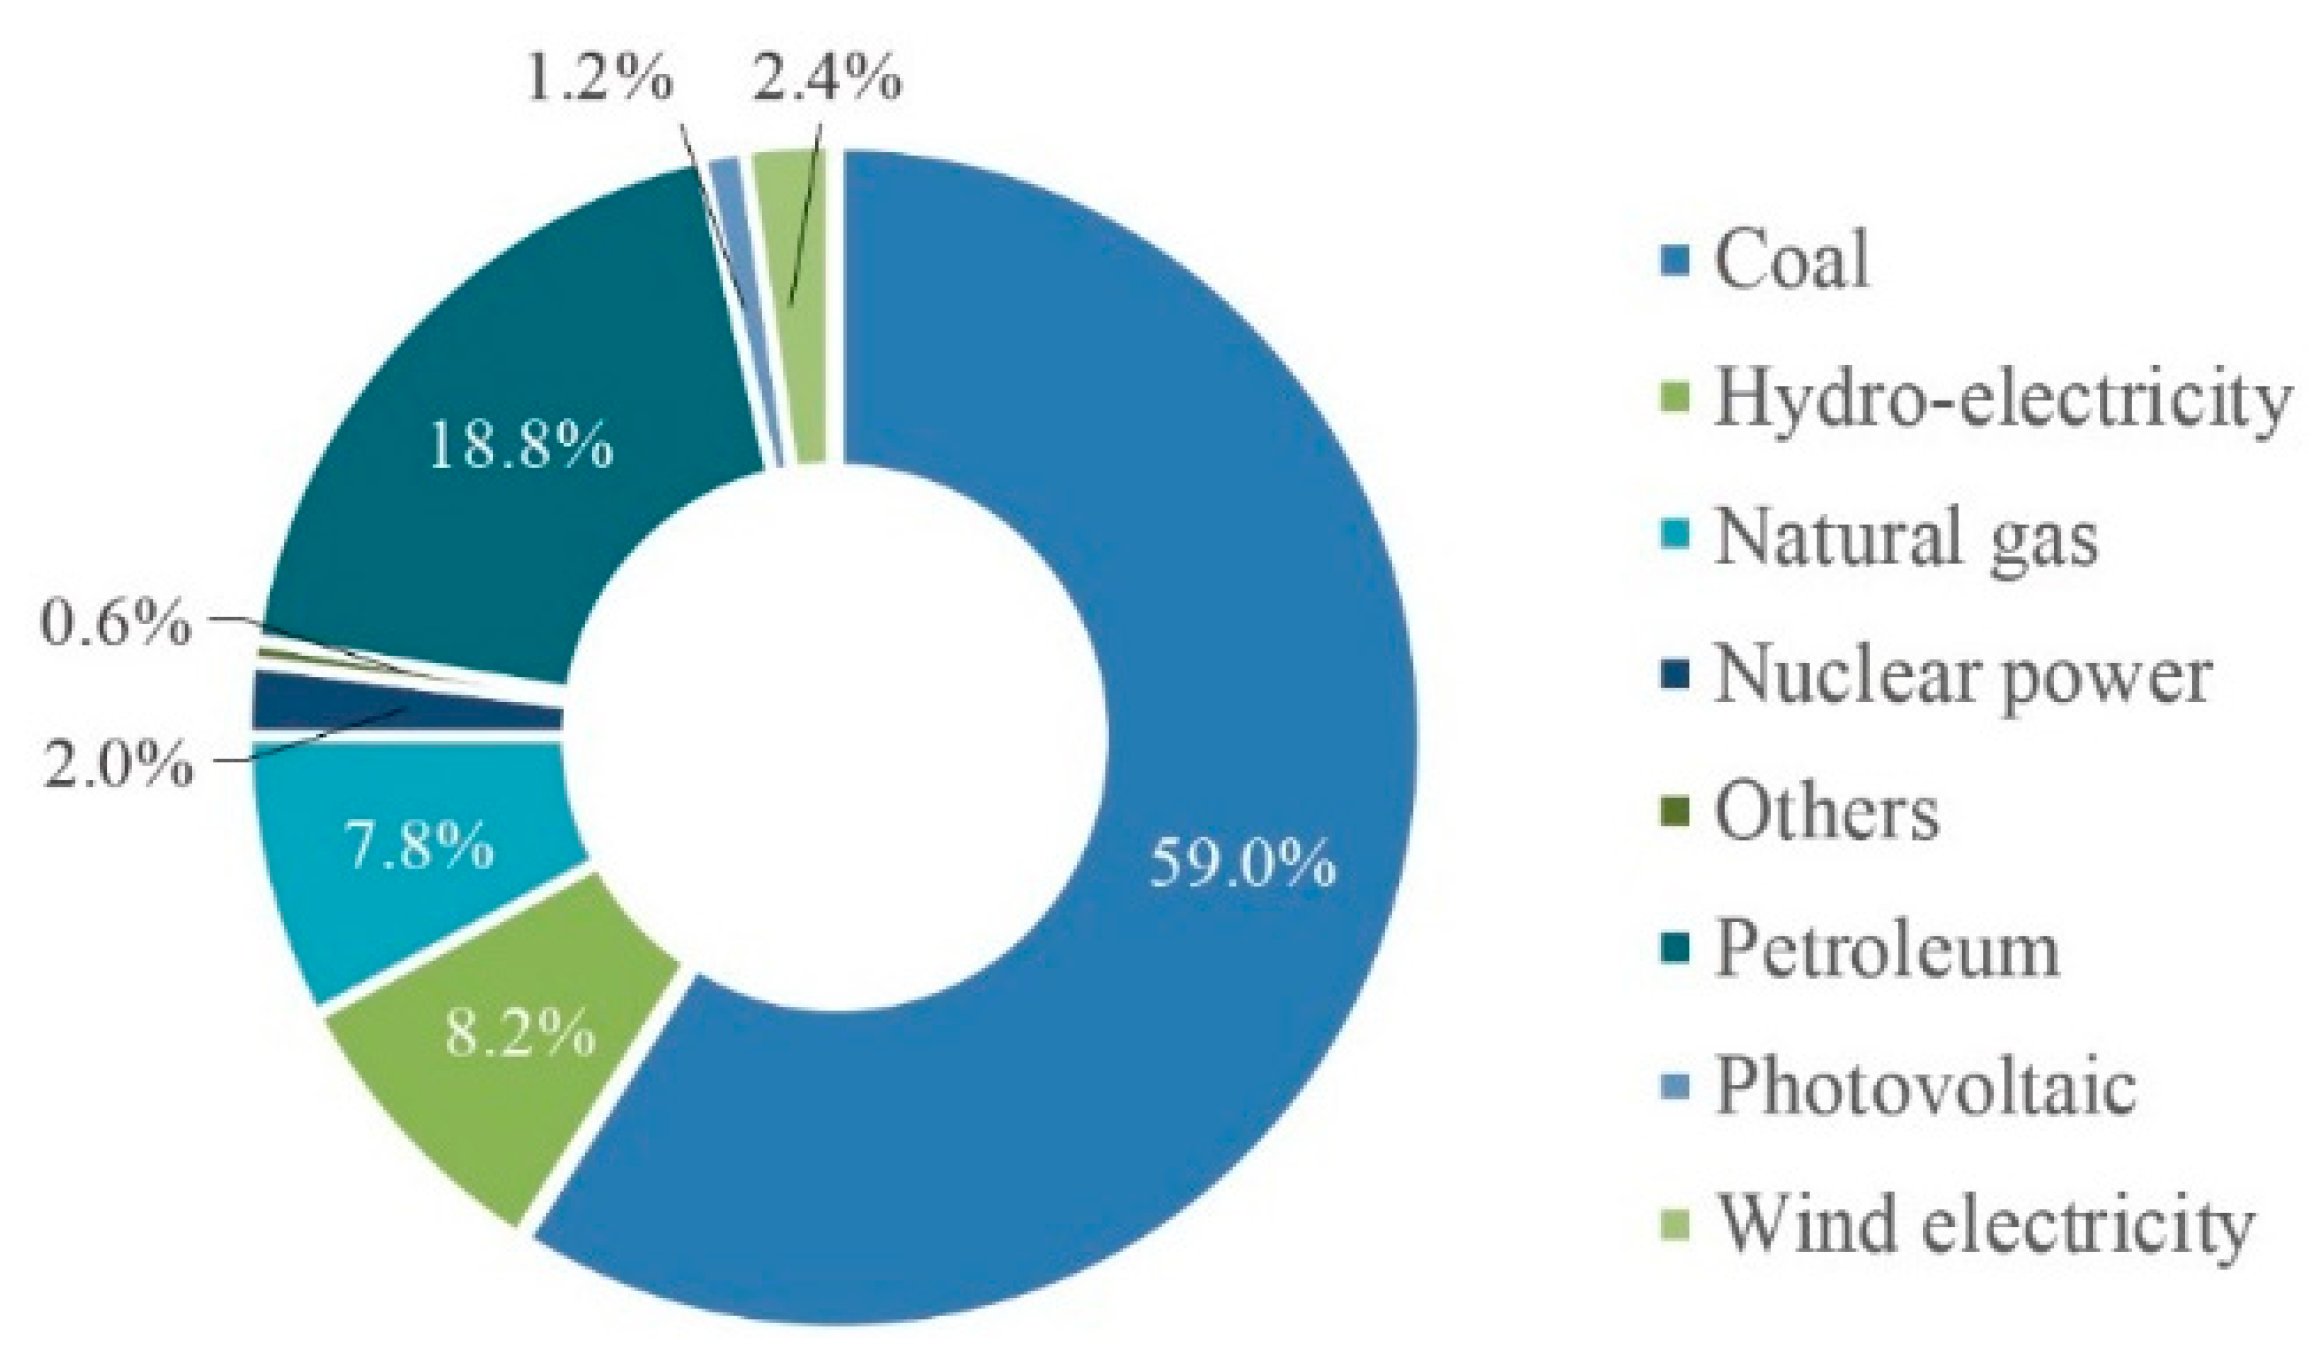
1.1.1. Overall Energy Consumption
1.1.2. Energy Policies in China
1.2. Bio-Based Building Materials in Northern China
1.2.1. Bio-Based Building Material Policies
1.2.2. Timber
1.2.3. Straw Bale
1.3. Study Scope and Objectives
2. Simulation Environment and Introduction of Case Buildings
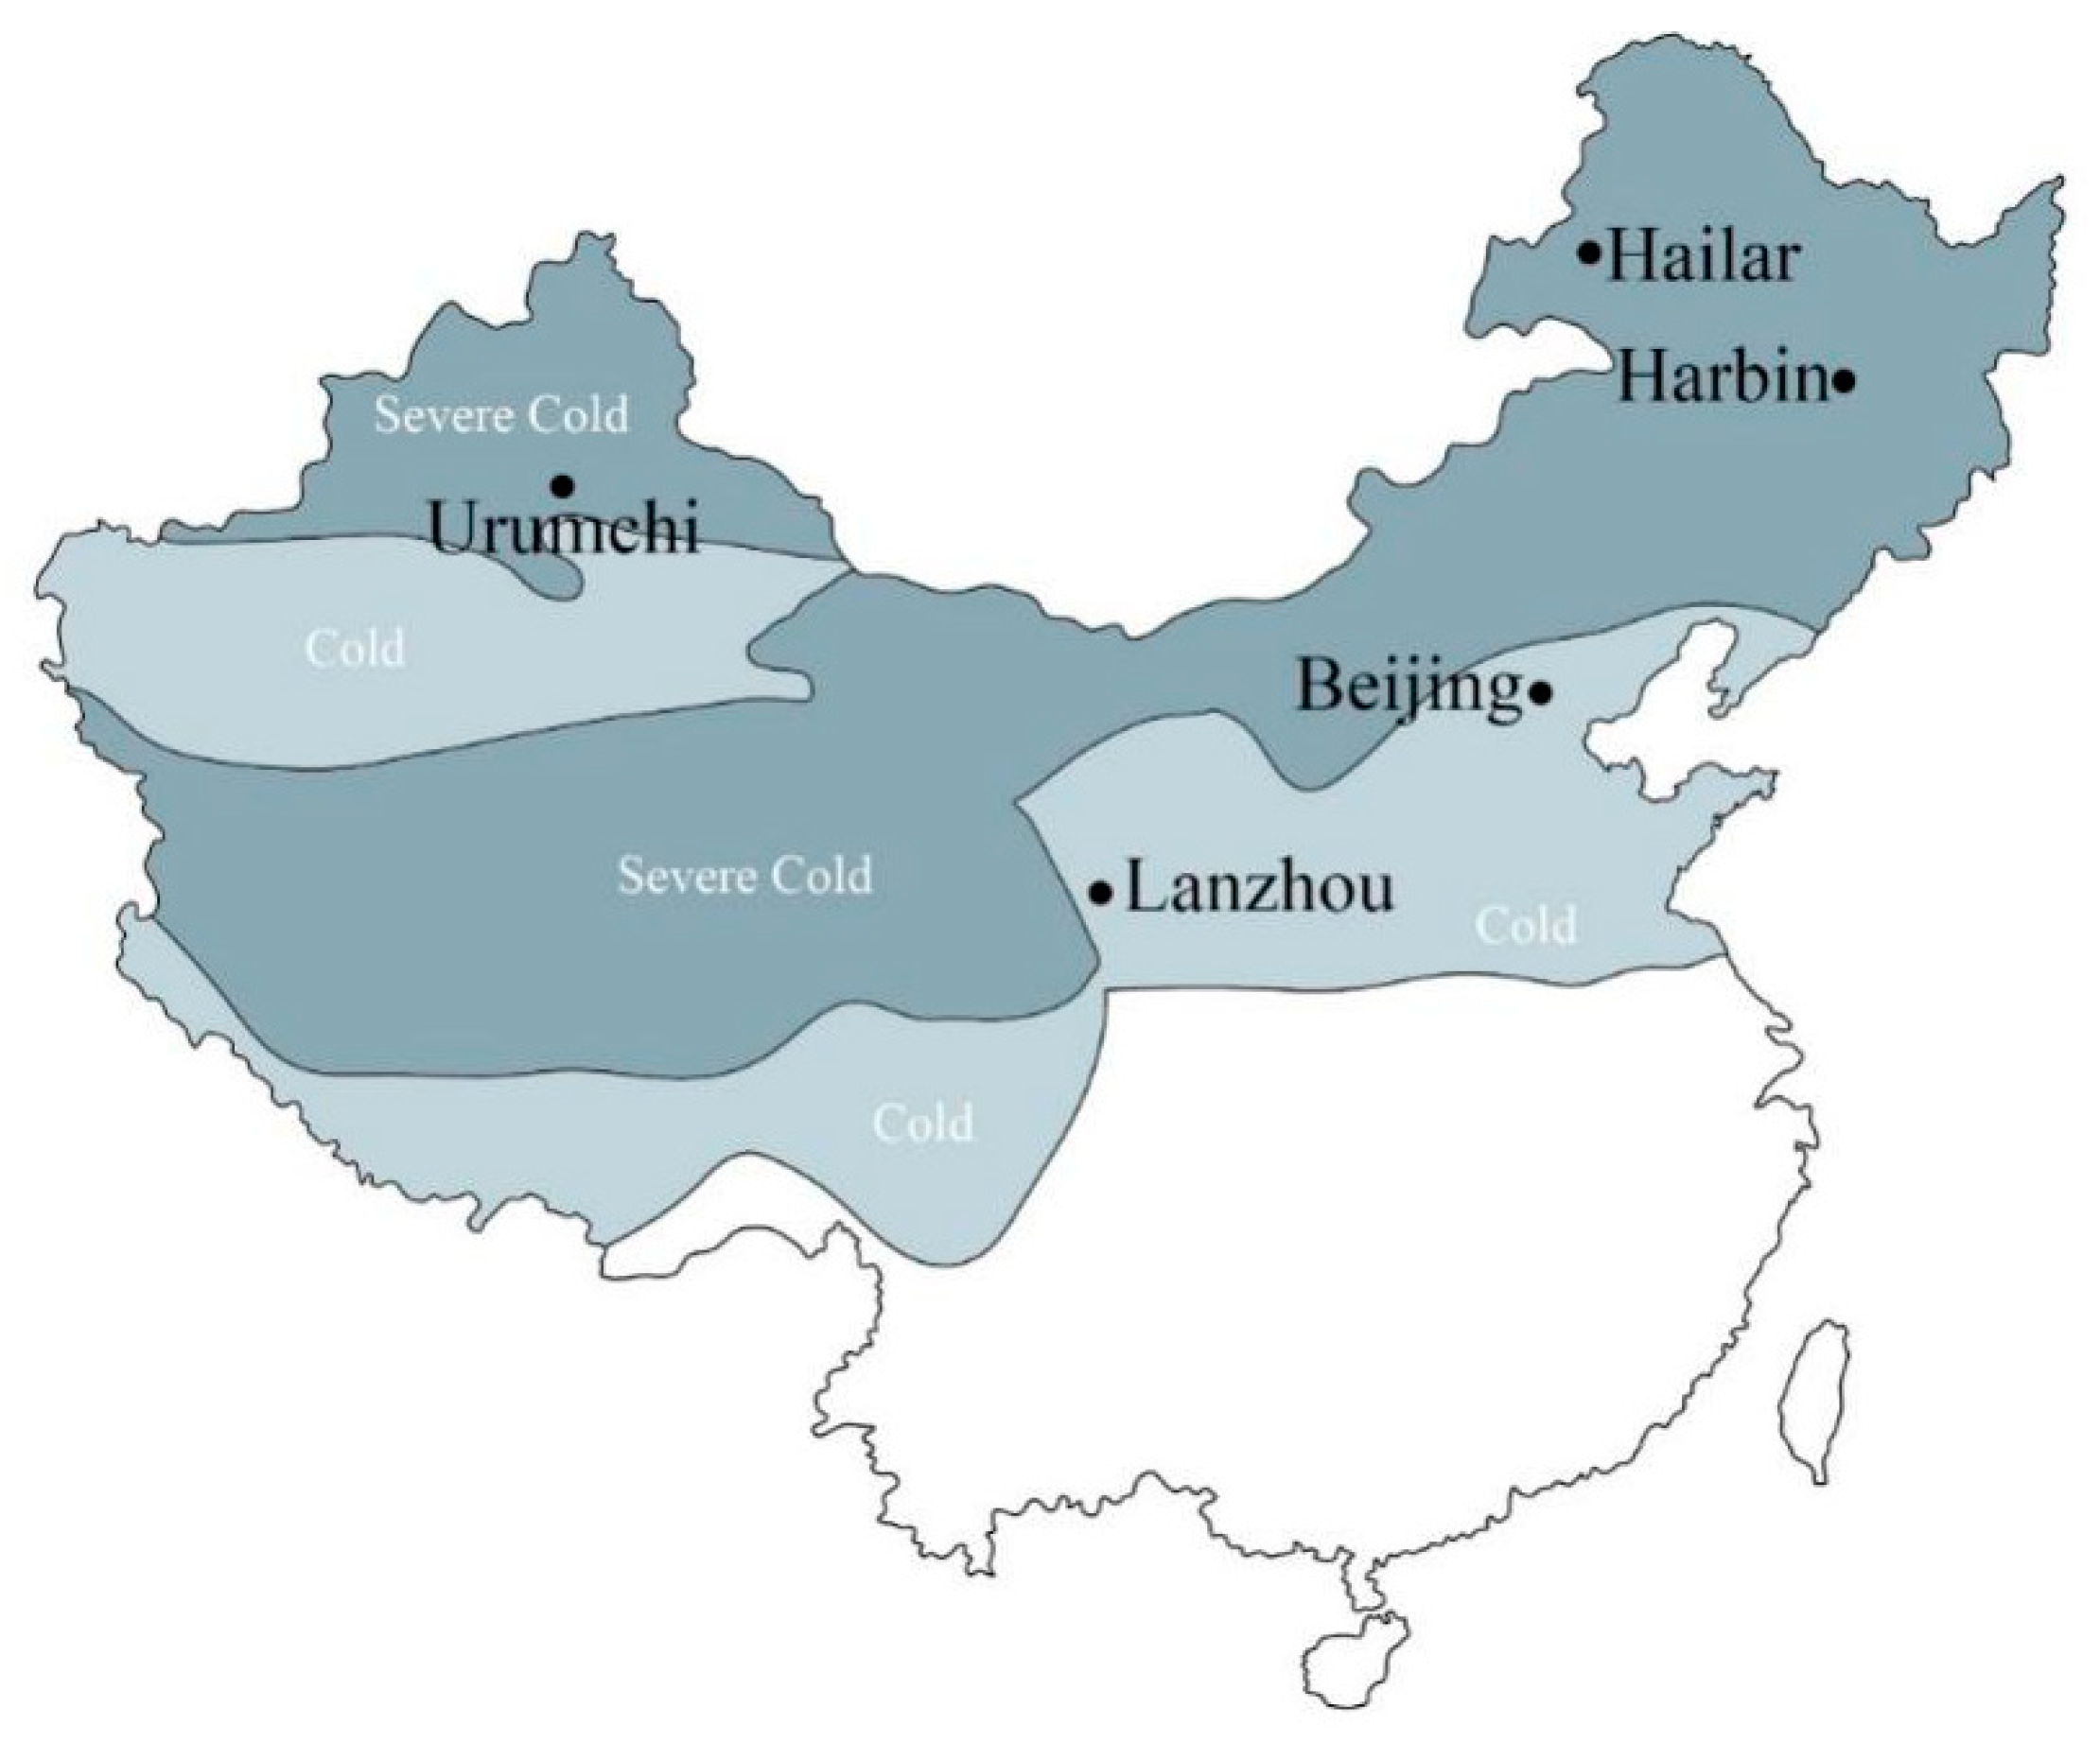
2.1. Basic Information about the Five Selected Cities
2.2. Details of Simulation Buildings
2.2.1. Parameters of Case Study Buildings
2.2.2. Building Materials and Structural Design
3. Methodology
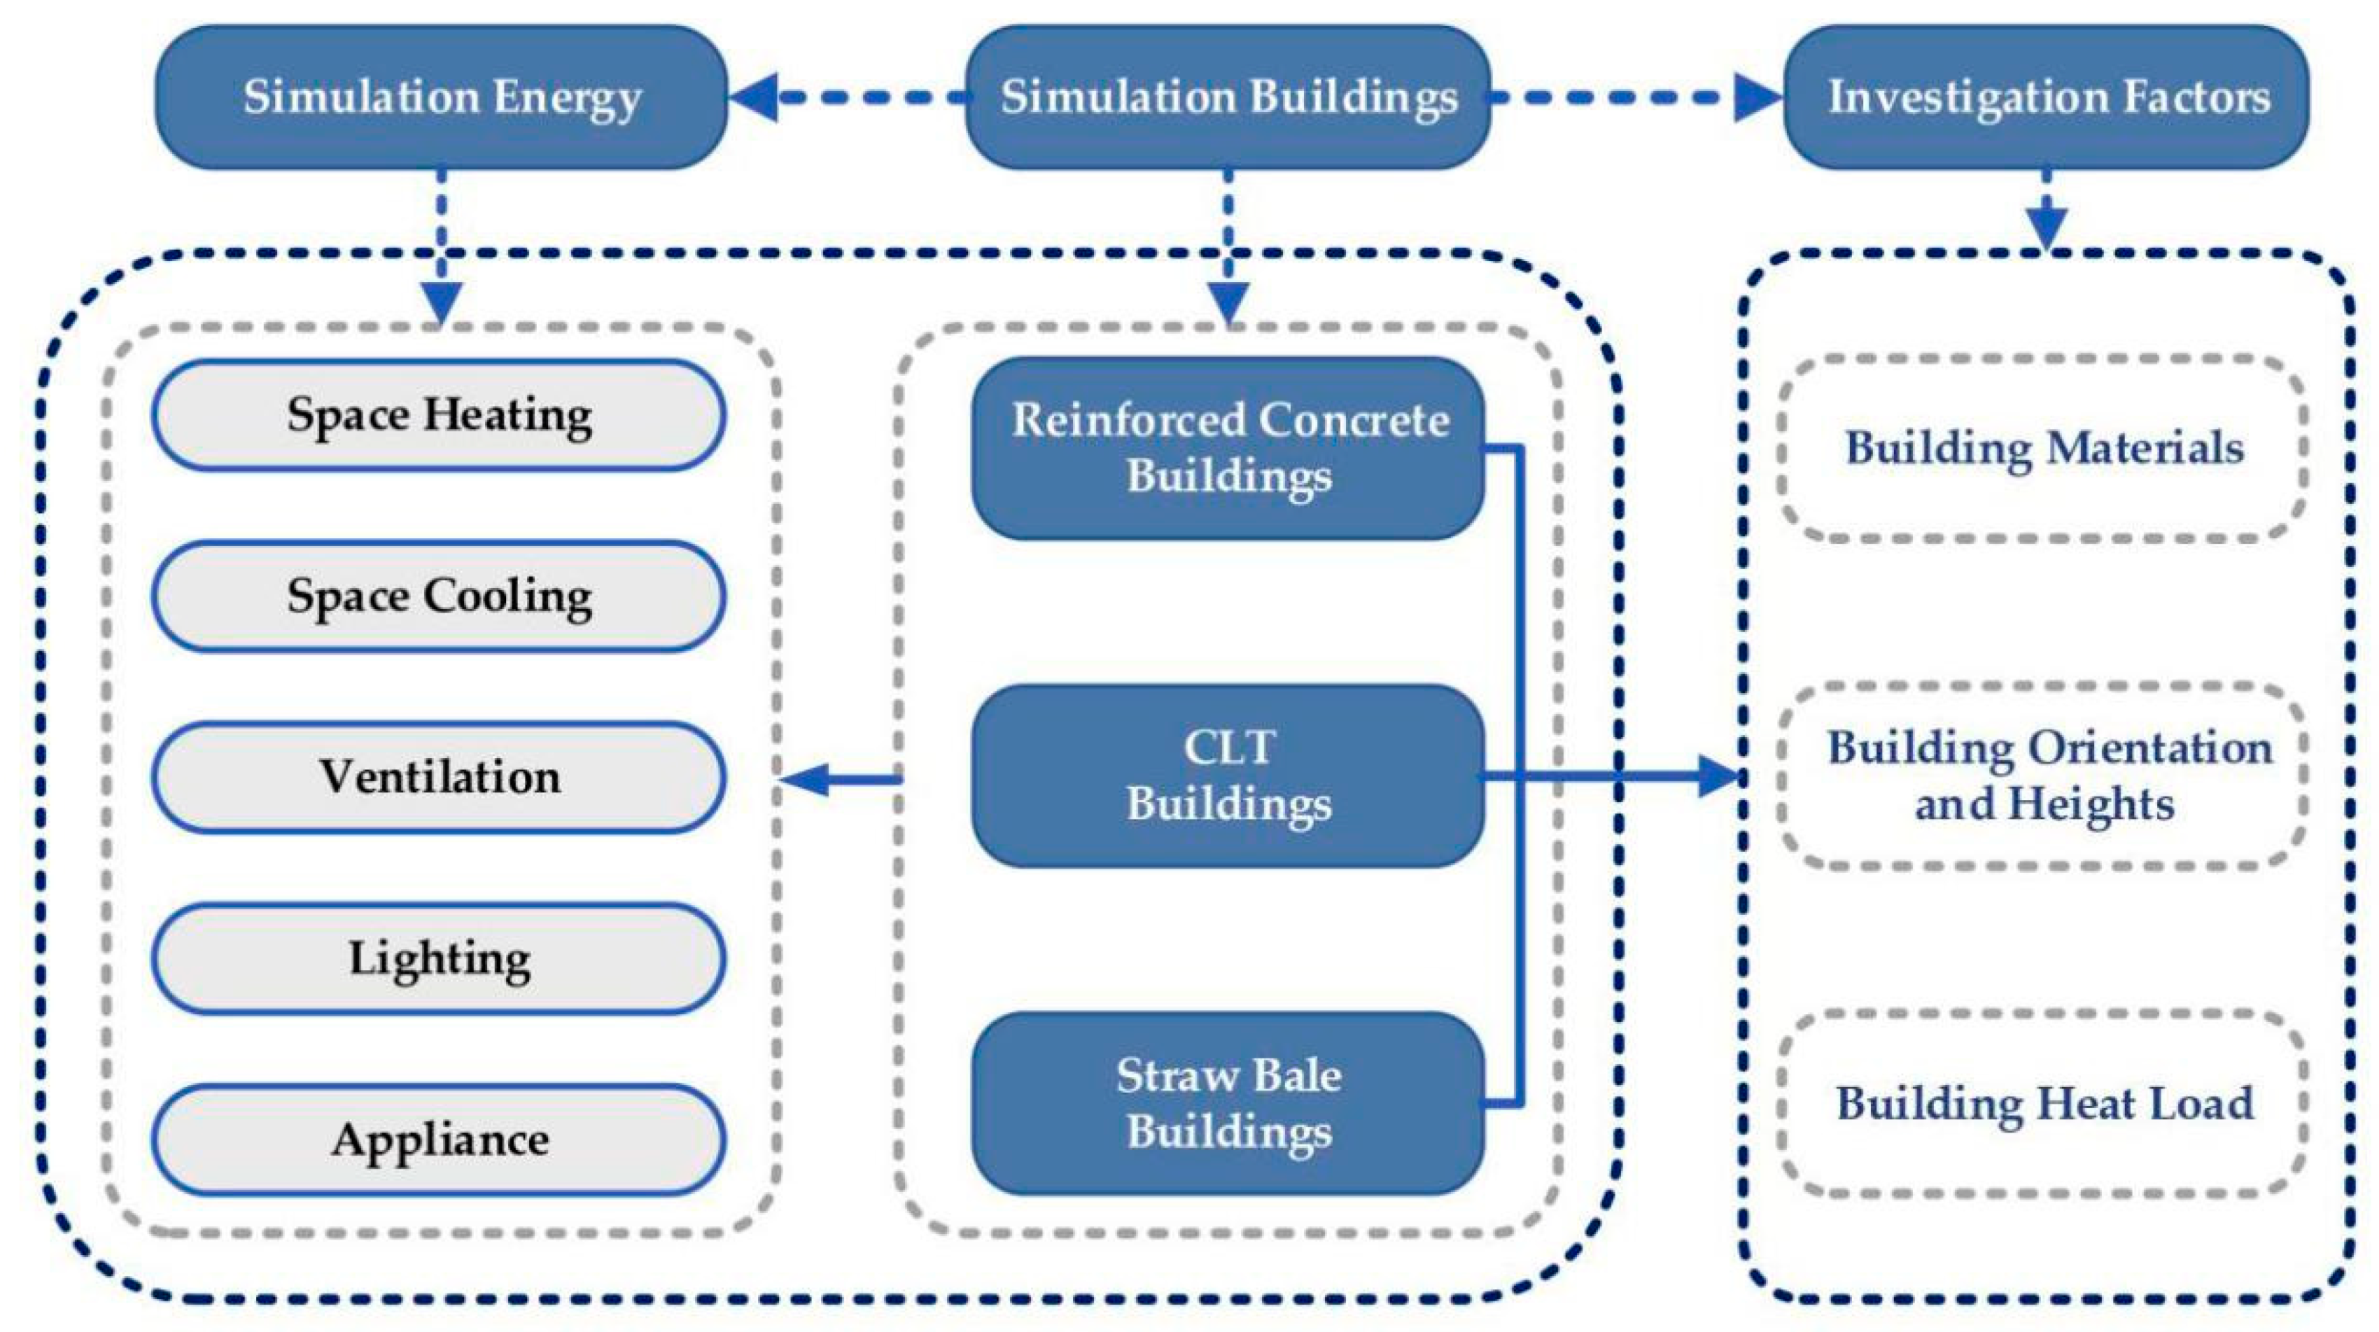
3.1. Study Scope
- (1)
- Building materials. The initial building constructed in RC was simulated as a reference, and the building material was then replaced by the two bio-based building materials, namely CLT and straw bales, in the following simulation process. The energy efficiency of the three building materials was studied and compared.
- (2)
- Heating load. According to the existing research, heating energy consumption is dominant in the Cold and Severe Cold regions [62]. Reduction of the heating energy consumption in the building is effective in lowering the overall energy consumption in these regions. The thermal performance of the three materials during heating was studied.
- (3)
- Building orientation and height. In the Cold and Severe Cold regions, building orientation is frequently planned to take maximum advantage of daily and seasonal variations of sunlight. In the simulation process, the main orientation of the studied residential building was changed from the east to the west in steps of 10 degrees. The influence of building orientation on building energy consumption and the differences in energy efficiency for each floor were also examined.
3.2. Simulation Parameters
4. Results and Discussion
5. Conclusions
Author Contributions
Funding
Conflicts of Interest
References
- British Petroleum. BP Statistical Review of World Energy; British Petroleum: London, UK, 2019; p. 2018. [Google Scholar]
- National Bureau of Statistics of China. China Energy Statistical Yearbook (2018); China Statistics Press: Beijing, China, 2018. (In Chinese)
- Yuan, T.; Zhu, N.; Shi, Y.; Chang, C.; Yang, K.; Ding, Y. Sample data selection method for improving the prediction accuracy of the heating energy consumption. Energy Build. 2018, 158, 234–243. [Google Scholar] [CrossRef]
- Chiara, D.; Lavagno, E.; Mutani, G. Chinese residential energy demand: Scenarios to 2030 and policies implication. Energy Build. 2015, 89, 49–60. [Google Scholar] [CrossRef]
- Hu, S.; Yan, D.; Guo, S.; Cui, Y.; Dong, B. A survey on energy consumption and energy usage behavior of households and residential building in urban China. Energy Build. 2017, 148, 366–378. [Google Scholar] [CrossRef]
- The State Development and Reform Commission. Winter Clean Heating Plan in Northern China (2017–2021); The State Development and Reform Commission: Beijing, China, 2017; p. 56. (In Chinese)
- Chen, S.; Li, N.; Guan, J.; Xie, Y.; Sun, F.; Ni, J. A statistical method to investigate national energy consumption in the residential building sector of China. Energy Build. 2008, 40, 654–665. [Google Scholar] [CrossRef]
- Zhao, M.; Künzel, H.M.; Antretter, F. Parameters influencing the energy performance of residential buildings in different Chinese climate zones. Energy Build. 2015, 96, 64–75. [Google Scholar] [CrossRef]
- Building Energy Conservation Research Center, Tsinghua University. China Building Energy Saving Annual Development Research Report 2019; Tsinghua University: Beijing, China, 2019. (In Chinese) [Google Scholar]
- China Electric Power Planing & Engineering Institute. China Energy Development Report 2018; China Electric Power Planing & Engineering Institute: Beijing, China, 2018. (In Chinese)
- Cnpc Economics & Technology Research Institute. World and China’s Energy Outlook in 2050 (2019); Cnpc Economics & Technology Research Institute: Beijing, China, 2019. (In Chinese) [Google Scholar]
- Ministry of Construction of the People’s Republic of China. Energy Conservation Design Standard for New Heating Residential Buildings; Institute of Standard Quota of Ministry of Construction of People’s Republic of China: Beijing, China, 1996; Volume JGJ26-95, p. 30.
- Zhang, G.; Gao, X.; Wang, Y.; Guo, J.; Wang, S. Measurement, Coordination and Evolution of Energy Conservation and Emission Reduction Policies in China: Based on the Research of the Policy Data from 1978 to 2013. China Popul. Resour. Environ. 2014, 24, 62–73. [Google Scholar] [CrossRef]
- National Development and Reform Commission; National Energy Administration. Circular of the National Development and Reform Commission and the State Energy Administration on Printing and Distributing the 13th Five Year Plan for Energy Development. Available online: http://www.gov.cn/xinwen/2017-01/17/content_5160588.htm (accessed on 20 December 2019). (In Chinese)
- People’s Government of Shandong Province. Measures to Promote the Development of Green Building in Shandong Province. Available online: http://www.shandong.gov.cn/art/2019/1/28/art_2259_30552.html (accessed on 20 December 2019). (In Chinese)
- General Office of Qinghai Provincial Government. Notice of the General Office of the People’s Government of Qinghai Province on Printing and Distributing the Work Plan of Building Qinghai into a National Clean Energy Demonstration Province (2018–2020). Available online: http://zwgk.qh.gov.cn/zdgk/zwgkzfxxgkml/zfxxaqsc/201812/t20181229_32671.html (accessed on 21 December 2019). (In Chinese)
- Department of Housing and Urban-Rural Development of Heilongjiang Province. Notice on Implementing the Implementation Plan of Green Building Action in Heilongjiang Province and Accelerating the Development of Green Building. Available online: http://zfcxjst.hlj.gov.cn/plus/view.aspx?aid=47856 (accessed on 21 December 2019). (In Chinese)
- Jones, D. 1-Introduction to the Performance of Bio-Based Building Materials. In Performance of Bio-Based Building Materials; Jones, D., Brischke, C., Eds.; Woodhead Publishing: Cambridge, UK, 2017. [Google Scholar] [CrossRef]
- Ke, S.; Qiao, D.; Zhang, X.; Feng, Q. Changes of China’s forestry and forest products industry over the past 40 years and challenges lying ahead. For. Policy Econ. 2019, 106, 101949. [Google Scholar] [CrossRef]
- Mao, D.; He, X.; Wang, Z.; Tian, Y.; Xiang, H.; Yu, H.; Man, W.; Jia, M.; Ren, C.; Zheng, H. Diverse policies leading to contrasting impacts on land cover and ecosystem services in Northeast China. J. Clean. Prod. 2019, 240, 117961. [Google Scholar] [CrossRef]
- National Development and Reform Comission; Ministry of Housing and Urban-Rural Development of the People’s Republic of China. Green Building Action Plan. Available online: http://www.nea.gov.cn/2013-01/07/c_132085767.htm (accessed on 22 December 2019). (In Chinese)
- Stanić, A.; Hudobivnik, B.; Brank, B. Economic-design optimization of cross laminated timber plates with ribs. Compos. Struct. 2016, 154, 527–537. [Google Scholar] [CrossRef]
- Ministry of Industry and Information Technology of the People’s Republic of China; Ministry of Housing and Urban Rural Development of the People’s Republic of China. Action Plan for Promoting the Production and Application of Green Building Materials. Available online: http://www.mohurd.gov.cn/wjfb/201509/t20150906_224666.html (accessed on 15 November 2019).
- Government of Heilongjiang Province. Implementation Plan of Green Building Action in Heilongjiang Province; Government of Heilongjiang Province: Harbin, China, 2018.
- People’s Government of Shandong Province. Opinions of Shandong Provincial People’s Government on Vigorously Promoting Green Building; People’s Government of Shandong Province: Jinan, China, 2013.
- Forest Products Laboratory (US). Wood Handbook: Wood as an Engineering Material; United States Department of Agriculture Forest Service: Washington, DC, USA, 2010; Volume 190, p. 509.
- Rattasepp, T.; Mang, H.J.B. Regarding stability of flat edge supported hypar shells in timber with straight-lined edge girders. Bauingenieur 1989, 64, 255–266. (In German) [Google Scholar]
- Lehmann, S.; Hamilton, C. Sustainable Infill Development Using Low Carbon CLT Prefabrication: Adaptation for the South Australian Context; Zero Waste SA Research Centre for Sustainable Design and Behaviour: University of South Australia, Adelaide, Australia, 2011. [Google Scholar]
- Gagnon, S.; Pirvu, C. Cross-Laminated Timber (ÇTK) Handbook; FPInnovations: Vancouver, QC, Canada, 2012; p. 594. [Google Scholar]
- Moser, K. Dickholz through vacuum. Bau. Holz 1995, 11, 941–947. (In German) [Google Scholar]
- Crespell, P.; Gagnon, S. Cross Laminated Timber: A Primer; Fpinnovations: Vancouver, QC, Canada, 2010. [Google Scholar]
- Plackner, H. Undisputable—Solid Timber has Created Its Market; Holzkurier BSP Special: Berlin, Germany, 2014. (In German) [Google Scholar]
- Brandner, R.; Flatscher, G.; Ringhofer, A.; Schickhofer, G.; Thiel, A. Cross laminated timber (CLT): Overview and development. Eur. J. Wood Wood Prod. 2016, 74, 331–351. [Google Scholar] [CrossRef]
- Shahnewaz, M.; Tannert, T.; Alam, M.S.; Popovski, M. Seismic Performance of Cross Laminated Timber (CLT) Platform Building by Incremental Dynamic Analysis. In Proceedings of the 39th IABSE Symposium–Engineering the Future, Vancouver, QC, Canada, 21–23 September 2017; pp. 422–428. [Google Scholar]
- Takeda, H.; Mehaffey, J. WALL2D: A model for predicting heat transfer through wood-stud walls exposed to fire. Fire Mater. 1998, 22, 133–140. [Google Scholar] [CrossRef]
- König, J. Timber Frame Assemblies Exposed to Standard and Parametric Fires. Part 2 A Design Model for Standard Fire Exposure. 2000. Available online: https://pdfs.semanticscholar.org/016e/1f82cb5825db687d7f44b0e4fee1114d400c.pdf (accessed on 15 November 2019).
- Young, S.; Clancy, P. Structural modelling of light-timber framed walls in fire. Fire Saf. J. 2001, 36, 241–268. [Google Scholar] [CrossRef]
- Frangi, A.; Fontana, M.; Hugi, E.; Jübstl, R. Experimental analysis of cross-laminated timber panels in fire. Fire Saf. J. 2009, 44, 1078–1087. [Google Scholar] [CrossRef]
- Lineham, S.A.; Thomson, D.; Bartlett, A.I.; Bisby, L.A.; Hadden, R.M. Structural response of fire-exposed cross-laminated timber beams under sustained loads. Fire Saf. J. 2016, 85, 23–34. [Google Scholar] [CrossRef]
- Dodoo, A.; Gustavsson, L.; Sathre, R. Lifecycle carbon implications of conventional and low-energy multi-storey timber building systems. Energy Build. 2014, 82, 194–210. [Google Scholar] [CrossRef]
- Setter, L.; Smoorenburg, E.; Wijesuriya, S.; Tabares-Velasco, P.C. Energy and hygrothermal performance of cross laminated timber single-family homes subjected to constant and variable electric rates. J. Build. Eng. 2019, 25, 100784. [Google Scholar] [CrossRef]
- Khavari Ali, M.; Pei, S.; Tabares-Velasco Paulo, C. Energy Consumption Analysis of Multistory Cross-Laminated Timber Residential Buildings: A Comparative Study. J. Archit. Eng. 2016, 22, 04016002. [Google Scholar] [CrossRef]
- Darby, H.; Elmualim, A.A.; Kelly, F. A case study to investigate the life cycle carbon emissions and carbon storage capacity of a cross laminated timber, multi-storey residential building. In Proceedings of the Sustainable Building Conference, Munich, Germany, 10–12 September 2013; pp. 10–12. [Google Scholar]
- Khan, T.S.; Mubeen, U. Wheat straw: A pragmatic overview. Curr. Res. J. Biol. Sci. 2012, 4, 673–675. [Google Scholar]
- Lacinski, P.; Bergeron, M. Serious Straw Bale, A Home Construction Guide for All Climates; Chelsea Green Publishing Company: White River Junction, VT, USA, 2000. [Google Scholar]
- King, B. Design of Straw Bale Buildings: The State of the Art; Green Books: Cambridge, UK, 2006. [Google Scholar]
- Minke, G.; Mahlke, F. Building with Straw: Design and Technology of a Sustainable Architecture; Birkhauser: Basel, Switzerland, 2005. [Google Scholar]
- Goodhew, S.; Carfrae, J.; De Wilde, P. Briefing: Challenges related to straw bale construction. In Proceedings of the Institution of Civil Engineers-Engineering Sustainability; Thomas Telford Ltd.: London, UK, 2010; pp. 185–189. [Google Scholar]
- Nickson, C. Straw Bale Construction. Available online: http://www.sustainablebuild.co.uk/constructionstrawbale.html (accessed on 5 December 2019).
- Cui, R.; Zhang, S.; Peng, Y. The Application of Grass-Brick Building in Northeast China. Construction of Small Towns 2001, 90. Available online: http://118.24.11.132:81/kns/brief/Default_Result.aspx (accessed on 15 December 2019). (In Chinese).
- Gao, X.S.; Adventist Development Relief Agency (ADRA). China Development Brief. Available online: http://www.chinadevelopmentbrief.org.cn/news-13062.html (accessed on 27 July 2019).
- Cao, B.Z.; Zhao, Y.M.; Duan, W.F.; Bai, A.H. The possibility analysis on application of new light-weight steel straw bale thermal insulating dwellings in northeast rural areas. New Build. Mater. 2010, 37, 34–36. [Google Scholar]
- McCabe, J. The Thermal Resistivity of Straw Bales for Construction; University of Arizona Environmental Research Laboratory (UAERL): Tucson, AZ, USA, 1993; p. 17. [Google Scholar]
- Ashour, T.; Georg, H.; Wu, W. Performance of straw bale wall: A case of study. Energy Build. 2011, 43, 1960–1967. [Google Scholar] [CrossRef]
- Ashour, T.; Wieland, H.; Georg, H.; Bockisch, F.; Wu, W. The influence of natural reinforcement fibres on insulation values of earth plaster for straw bale buildings. Mater. Des. 2010, 31, 4676–4685. [Google Scholar] [CrossRef]
- D’Alessandro, F.; Bianchi, F.; Baldinelli, G.; Rotili, A.; Schiavoni, S. Straw bale constructions: Laboratory, in field and numerical assessment of energy and environmental performance. J. Build. Eng. 2017, 11, 56–68. [Google Scholar] [CrossRef]
- González, A.D. 21-Assessment of the energy and carbon embodied in straw and clay masonry blocks. In Eco-Efficient Masonry Bricks and Blocks; Pacheco-Torgal, F., Lourenço, P.B., Labrincha, J.A., Kumar, S., Chindaprasirt, P., Eds.; Woodhead Publishing: Oxford, UK, 2015; pp. 461–480. [Google Scholar] [CrossRef]
- Brojan, L.; Petric, A.; Clouston, P. Comparative study of brick and straw bale wall systems from environmental, economical and energy perspectives. ARPN J. Eng. Appl. Sci. 2013, 8, 920–926. [Google Scholar]
- Ricciardi, P.; Torchia, F.; Belloni, E.; Lascaro, E.; Buratti, C. Environmental characterisation of coffee chaff, a new recycled material for building applications. Constr. Build. Mater. 2017, 147, 185–193. [Google Scholar] [CrossRef]
- Yin, X.; Lawrence, M.; Maskell, D.; Chang, W.S. Construction and monitoring of experimental straw bale building in northeast China. Constr. Build. Mater. 2018, 183, 46–57. [Google Scholar] [CrossRef]
- Yin, X.; Lawrence, M.; Maskell, D. Straw bale construction in northern China – Analysis of existing practices and recommendations for future development. J. Build. Eng. 2018, 18, 408–417. [Google Scholar] [CrossRef]
- Dong, Y.; Cui, X.; Yin, X.; Chen, Y.; Guo, H. Assessment of Energy Saving Potential by Replacing Conventional Materials by Cross Laminated Timber (CLT)—A Case Study of Office Buildings in China. Appl. Sci. 2019, 9, 858. [Google Scholar] [CrossRef]
- Leccese, F.; Salvadori, G.; Asdrubali, F.; Gori, P. Passive thermal behaviour of buildings: Performance of external multi-layered walls and influence of internal walls. Appl. Energy 2018, 225, 1078–1089. [Google Scholar] [CrossRef]
- Fantozzi, F.; Galbiati, P.; Leccese, F.; Salvadori, G.; Rocca, M. Thermal analysis of the building envelope of lightweight temporary housing. J. Phys. Conf. Ser. 2014, 547. [Google Scholar] [CrossRef]
- Fantozzi, F.; Gargari, C.; Rovai, M.; Salvadori, G. Energy Upgrading of Residential Building Stock: Use of Life Cycle Cost Analysis to Assess. Interventions on Social Housing in Italy. Sustainability 2019, 11, 1452. [Google Scholar] [CrossRef]


| Climate Zones | Detailed Partition | City | Basis for Partition |
|---|---|---|---|
| Severe Cold | I(A) | Hailar | 6000 ≤ HDD18 |
| I(B) | Harbin | 5000 ≤ HDD18 < 6000 | |
| I(C) | Urumchi | 3800 ≤ HDD18 < 5000 | |
| Cold | II(A) | Lanzhou | 2000 ≤ HDD18 < 3800, CDD26 ≤ 90 |
| II(B) | Beijing | 2000 ≤ HDD18 < 3800, CDD26 > 90 |
| Climate Regions | Detailed Partition | City | Heating Period (Days) | Heating Load (W/m2) | U-Value [W/ m2 (·K)] | R [(m2·K)/W] |
|---|---|---|---|---|---|---|
| Severe Cold Region | I(A) | Hailar | 206 | 18.9 | Roof: ≤0.25 | Ground: ≥1.10 |
| Wall: ≤0.50 | ||||||
| Window: ≤2.2 | ||||||
| Door: ≤1.5 | ||||||
| I(B) | Harbin | 167 | 18.3 | Roof: ≤0.30 | Ground: ≥0.83 | |
| Wall: ≤0.55 | ||||||
| Window: ≤2.2 | ||||||
| Door: ≤1.5 | ||||||
| I(C) | Urumchi | 149 | 17.4 | Roof: ≤0.40 | Ground: ≥0.56 | |
| Wall: ≤0.60 | ||||||
| Window: ≤2.2 | ||||||
| Door: ≤1.5 | ||||||
| Cold Region | II(A) | Lanzhou | 126 | 13.1 | Roof: ≤0.45 | - |
| Wall: ≤0.70 | ||||||
| Window: ≤2.8 | ||||||
| Door: ≤2.0 | ||||||
| II(B) | Beijing | 114 | 13.4 | Roof: ≤0.45 | - | |
| Wall: ≤0.70 | ||||||
| Window: ≤2.8 | ||||||
| Door: ≤2.0 |
| Parameters | Figures |
|---|---|
| Total Floor Area (m2) | 4036.32 |
| External Wall Area (m2) | 3136.32 |
| External Opening Area (m2) | 700.44 |
| Total Volume (m3) | 12,237.80 |
| Total Height (m) | 32.40 |
| Number of Layers | 12 |
| Standard Layer Height (m) | 2.70 |
| Identifier | Material | External Wall Design |
|---|---|---|
| Reinforced Concrete |  |  |
| Cross-laminated Timber |  |  |
| Straw Bale |  |  |
| Climate Regions | U-Value [W/(m2·K)] | |||
|---|---|---|---|---|
| Building Construction | Concrete Building | CLT Building | Straw Bale Building | |
| I(A) Hailar | Roof | 0.20 | 0.17 | 0.20 |
| Wall | 0.24 | 0.21 | 0.16 | |
| Window | 1.60 | 1.60 | 1.60 | |
| Door | 1.44 | 1.44 | 1.44 | |
| I(B) Harbin | Roof | 0.24 | 0.20 | 0.24 |
| Wall | 0.44 | 0.35 | 0.16 | |
| Window | 1.60 | 1.60 | 1.60 | |
| Door | 1.44 | 1.44 | 1.44 | |
| I(C) Wulumuqi | Roof | 0.24 | 0.20 | 0.24 |
| Wall | 0.44 | 0.35 | 0.16 | |
| Window | 1.60 | 1.60 | 1.60 | |
| Door | 1.44 | 1.44 | 1.44 | |
| II(A) Lanzhou | Roof | 0.39 | 0.30 | 0.39 |
| Wall | 0.57 | 0.43 | 0.16 | |
| Window | 1.60 | 1.60 | 1.60 | |
| Door | 1.69 | 1.69 | 1.69 | |
| II(B) Beijing | Roof | 0.39 | 0.30 | 0.39 |
| Wall | 0.57 | 0.43 | 0.16 | |
| Window | 1.60 | 1.60 | 1.60 | |
| Door | 1.69 | 1.69 | 1.69 | |
| RC | CLT | Straw Bale | |
|---|---|---|---|
| Roof |  |  |  |
| Wall |  |  |  |
| Ground |  |  |  |
| RC | CLT | Straw Bale | |
|---|---|---|---|
| Roof |  |  |  |
| Wall |  |  |  |
| Ground |  |  |  |
| RC | CLT | Straw Bale | |
|---|---|---|---|
| Roof |  |  |  |
| Wall |  |  |  |
| Ground |  |  |  |
| RC | CLT | Straw Bale | |
|---|---|---|---|
| Roof |  |  |  |
| Wall |  |  |  |
| Ground |  |  |  |
| RC | CLT | Straw Bale | |
|---|---|---|---|
| Roof |  |  |  |
| Wall |  |  |  |
| Ground |  |  |  |
| Room | Time | Occupant Density | Power(W/person) | |
|---|---|---|---|---|
| Bedroom | 0:00–7:00 | 2 people | 90 | |
| Living Room | Workday | 7:00–9:00 | ||
| 17:00–24:00 | ||||
| Weekend | 7:00–24:00 | |||
| Room | Cooling Set Point | Cooling Month | Working Time | ||
|---|---|---|---|---|---|
| Bedroom Living Room | 26 °C | Hailar | 15 June–31 August | Workday | 7:00–9:00 |
| 26 °C | Harbin | 15 June–15 September | 17:00–24:00 | ||
| Weekend | 7:00–24:00 | ||||
| 26 °C | Urumchi | 15 June–15 September | |||
| 26 °C | Lanzhou | 1 June–30 September | |||
| 26 °C | Beijing | 1 June–30 September | |||
| Room | Heating Set Point | Heating Month | Working Time | |
|---|---|---|---|---|
| Bedroom | 20 °C | Hailar | 1 October–10 April | 24 h |
| Living Room | 20 °C | Harbin | 10 October–10 April | |
| Bathroom | 20 °C | Urumchi | 20 October–31 March | |
| Kitchen | 20 °C | Lanzhou | 10 November–20 March | |
| Corridor | 12 °C | Beijing | 15 November–15 March | |
| Stairs | 12 °C | |||
| Elevator | 12 °C | |||
| Room | Ventilation Month | Ventilation Time | Ventilation Condition | Max Flow | |
|---|---|---|---|---|---|
| Bedroom Living Room | 1 May–14 June | Workday | 7:00–9:00 | - | 1.000 ach |
| 17:00–24:00 | |||||
| Weekend | 7:00–24:00 | ||||
| 15 June–31 August | 0:00–7:00 | - | |||
| Workday | 7:00–9:00 | Outdoor Temp < 26 °C and Room Temp > Outdoor Temp | |||
| 17:00–24:00 | |||||
| Weekend | 7:00–24:00 | ||||
| 1 September–30 September | Workday | 7:00–9:00 | - | ||
| 17:00–24:00 | |||||
| Weekend | 7:00–24:00 | ||||
| 1 October–30 April | 7:00–7:10 | - | |||
| Room | Equipment | Time (/day) | Power |
|---|---|---|---|
| Bedroom | Computer | 2 h | 300 W |
| Living Room | Television | 3 h | 200 W |
| Bathroom | Water heater | 20 min | 2000 W |
| Kitchen | Refrigerator | 24 h | 60 W |
| Cooking | 20 min | 2000 W |
| Room | Lighting Hours | Power Density |
|---|---|---|
| Bedroom | 1 h | 60 W |
| Living Room | 4 h | 180 W |
| Bathroom | 20 min | 40 W |
| Kitchen | 20 min | 40 W |
| Corridor | 20 min | 40 W |
| Stairs | 20 min | 40 W |
| Lift | 24 h | 40 W |
| Service Shaft | - | - |
| Orientation | Hailar | Harbin | Urumchi | Lanzhou | Beijing |
|---|---|---|---|---|---|
| East | 134.18 | 119.30 | 106.13 | 78.47 | 86.31 |
| 80 Degrees East of South | 133.39 | 118.49 | 105.80 | 78.05 | 85.92 |
| 70 Degrees East of South | 132.46 | 117.62 | 105.38 | 77.55 | 85.43 |
| 60 Degrees East of South | 131.41 | 116.64 | 104.86 | 76.96 | 84.80 |
| 50 Degrees East of South | 130.26 | 115.63 | 104.28 | 76.29 | 84.07 |
| 40 Degrees East of South | 129.06 | 114.59 | 103.65 | 75.59 | 83.26 |
| 30 Degrees East of South | 127.91 | 113.58 | 103.03 | 74.91 | 82.41 |
| 20 Degrees East of South | 126.91 | 112.76 | 102.51 | 74.34 | 81.68 |
| 10 Degrees East of South | 126.19 | 112.19 | 102.17 | 73.98 | 81.17 |
| South | 125.82 | 112.02 | 102.08 | 73.92 | 81.01 |
| 10 Degrees West of South | 125.86 | 112.19 | 102.25 | 74.18 | 81.23 |
| 20 Degrees West of South | 126.30 | 112.78 | 102.66 | 74.74 | 81.79 |
| 30 Degrees West of South | 127.08 | 113.62 | 103.25 | 75.52 | 82.57 |
| 40 Degrees West of South | 128.12 | 114.66 | 103.92 | 76.37 | 83.45 |
| 50 Degrees West of South | 129.30 | 115.75 | 104.59 | 77.18 | 84.29 |
| 60 Degrees West of South | 130.51 | 116.78 | 105.19 | 77.88 | 85.03 |
| 70 Degrees West of South | 131.67 | 117.74 | 105.69 | 78.45 | 85.66 |
| 80 Degrees West of South | 132.74 | 118.57 | 106.06 | 78.87 | 86.15 |
| West | 133.67 | 119.33 | 106.33 | 79.15 | 86.54 |
| Orientation | Hailar | Harbin | Urumchi | Lanzhou | Beijing |
|---|---|---|---|---|---|
| East | 131.35 | 113.54 | 101.54 | 73.79 | 81.71 |
| 80 Degrees East of South | 130.57 | 112.73 | 101.21 | 73.38 | 81.32 |
| 70 Degrees East of South | 129.64 | 111.87 | 100.80 | 72.89 | 80.84 |
| 60 Degrees East of South | 128.60 | 110.90 | 100.29 | 72.31 | 80.23 |
| 50 Degrees East of South | 127.46 | 109.90 | 99.71 | 71.67 | 79.52 |
| 40 Degrees East of South | 126.27 | 108.88 | 99.09 | 70.99 | 78.73 |
| 30 Degrees East of South | 125.12 | 107.88 | 98.49 | 70.33 | 77.91 |
| 20 Degrees East of South | 124.13 | 107.07 | 97.98 | 69.78 | 77.21 |
| 10 Degrees East of South | 123.42 | 106.51 | 97.64 | 69.43 | 76.72 |
| South | 123.05 | 106.34 | 97.55 | 69.38 | 76.57 |
| 10 Degrees West of South | 123.09 | 106.51 | 97.72 | 69.63 | 76.78 |
| 20 Degrees West of South | 123.54 | 107.08 | 98.13 | 70.18 | 77.32 |
| 30 Degrees West of South | 124.32 | 107.91 | 98.72 | 70.94 | 78.08 |
| 40 Degrees West of South | 125.36 | 108.94 | 99.38 | 71.76 | 78.93 |
| 50 Degrees West of South | 126.54 | 110.02 | 100.03 | 72.55 | 79.75 |
| 60 Degrees West of South | 127.75 | 111.04 | 100.62 | 73.24 | 80.47 |
| 70 Degrees West of South | 128.90 | 112.00 | 101.12 | 73.80 | 81.09 |
| 80 Degrees West of South | 129.97 | 112.83 | 101.49 | 74.22 | 81.57 |
| West | 130.89 | 113.59 | 101.75 | 74.51 | 81.96 |
| Orientation | Hailar | Harbin | Urumchi | Lanzhou | Beijing |
|---|---|---|---|---|---|
| East | 126.67 | 101.93 | 92.04 | 66.31 | 74.60 |
| 80 Degrees East of South | 125.89 | 101.13 | 91.72 | 65.90 | 74.23 |
| 70 Degrees East of South | 124.97 | 100.27 | 91.31 | 65.43 | 73.77 |
| 60 Degrees East of South | 123.93 | 99.32 | 90.81 | 64.88 | 73.19 |
| 50 Degrees East of South | 122.80 | 98.34 | 90.25 | 64.28 | 72.51 |
| 40 Degrees East of South | 121.62 | 97.34 | 89.65 | 63.65 | 71.78 |
| 30 Degrees East of South | 120.48 | 96.38 | 89.07 | 63.03 | 71.03 |
| 20 Degrees East of South | 119.50 | 95.59 | 88.58 | 62.52 | 70.38 |
| 10 Degrees East of South | 118.79 | 95.05 | 88.25 | 62.19 | 69.93 |
| South | 118.44 | 94.89 | 88.16 | 62.14 | 69.79 |
| 10 Degrees West of South | 118.48 | 95.04 | 88.32 | 62.37 | 69.99 |
| 20 Degrees West of South | 118.92 | 95.59 | 88.72 | 62.89 | 70.49 |
| 30 Degrees West of South | 119.70 | 96.39 | 89.28 | 63.60 | 71.20 |
| 40 Degrees West of South | 120.74 | 97.40 | 89.93 | 64.38 | 71.99 |
| 50 Degrees West of South | 121.90 | 98.45 | 90.56 | 65.13 | 72.75 |
| 60 Degrees West of South | 123.10 | 99.46 | 91.14 | 65.78 | 73.44 |
| 70 Degrees West of South | 124.25 | 100.41 | 91.62 | 66.32 | 74.03 |
| 80 Degrees West of South | 125.31 | 101.24 | 91.99 | 66.73 | 74.50 |
| West | 126.23 | 102.00 | 92.25 | 67.02 | 74.87 |
| Hailar | Harbin | Urumchi | Lanzhou | Beijing | |||||||||||
|---|---|---|---|---|---|---|---|---|---|---|---|---|---|---|---|
| RC | CLT | Straw | RC | CLT | Straw | RC | CLT | Straw | RC | CLT | Straw | RC | CLT | Straw | |
| 1F | 201.92 | 199.57 | 194.87 | 202.24 | 197.30 | 186.04 | 177.56 | 173.61 | 164.45 | 121.01 | 116.90 | 108.46 | 122.08 | 117.95 | 109.62 |
| 2F | 133.00 | 130.81 | 126.38 | 114.16 | 109.44 | 98.76 | 105.13 | 101.27 | 92.35 | 76.29 | 72.46 | 64.95 | 84.21 | 80.44 | 73.22 |
| 3F | 129.03 | 126.81 | 122.34 | 110.24 | 105.48 | 94.73 | 102.12 | 98.22 | 89.24 | 74.36 | 70.49 | 62.94 | 82.61 | 78.81 | 71.58 |
| 4F | 127.20 | 124.97 | 120.49 | 108.99 | 104.21 | 93.42 | 101.14 | 97.23 | 88.22 | 73.80 | 69.91 | 62.32 | 82.20 | 78.38 | 71.10 |
| 5F | 125.40 | 123.18 | 118.69 | 107.85 | 103.07 | 92.27 | 100.22 | 96.31 | 87.28 | 73.31 | 69.41 | 61.81 | 81.85 | 78.04 | 70.74 |
| 6F | 123.33 | 121.11 | 116.62 | 106.60 | 101.81 | 91.01 | 99.16 | 95.25 | 86.20 | 72.76 | 68.87 | 61.27 | 81.50 | 77.68 | 70.39 |
| 7F | 121.53 | 119.30 | 114.80 | 105.51 | 100.72 | 89.90 | 98.25 | 94.33 | 85.27 | 72.28 | 68.38 | 60.79 | 81.19 | 77.36 | 70.07 |
| 8F | 120.90 | 118.67 | 114.17 | 105.08 | 100.29 | 89.47 | 98.01 | 94.08 | 85.00 | 72.16 | 68.26 | 60.67 | 81.08 | 77.25 | 69.95 |
| 9F | 120.69 | 118.45 | 113.95 | 104.92 | 100.12 | 89.30 | 97.97 | 94.04 | 84.96 | 72.17 | 68.27 | 60.69 | 81.05 | 77.23 | 69.94 |
| 10F | 120.77 | 118.52 | 114.04 | 104.98 | 100.17 | 89.40 | 98.10 | 94.16 | 85.11 | 72.35 | 68.43 | 60.91 | 81.17 | 77.34 | 70.10 |
| 11F | 122.09 | 119.66 | 115.42 | 106.21 | 101.24 | 90.76 | 99.14 | 95.06 | 86.25 | 73.52 | 69.43 | 62.21 | 82.20 | 78.23 | 71.21 |
| 12F | 148.63 | 142.84 | 141.46 | 131.02 | 122.25 | 114.42 | 120.14 | 113.14 | 106.53 | 93.67 | 84.73 | 80.79 | 102.01 | 92.84 | 89.29 |
© 2020 by the authors. Licensee MDPI, Basel, Switzerland. This article is an open access article distributed under the terms and conditions of the Creative Commons Attribution (CC BY) license (http://creativecommons.org/licenses/by/4.0/).
Share and Cite
Guo, H.; Zhou, S.; Qin, T.; Huang, L.; Song, W.; Yin, X. Energy Sustainability of Bio-Based Building Materials in the Cold and Severe Cold Regions of China—A Case Study of Residential Buildings. Appl. Sci. 2020, 10, 1582. https://doi.org/10.3390/app10051582
Guo H, Zhou S, Qin T, Huang L, Song W, Yin X. Energy Sustainability of Bio-Based Building Materials in the Cold and Severe Cold Regions of China—A Case Study of Residential Buildings. Applied Sciences. 2020; 10(5):1582. https://doi.org/10.3390/app10051582
Chicago/Turabian StyleGuo, Haibo, Siyuan Zhou, Tongyu Qin, Lu Huang, Wenjie Song, and Xunzhi Yin. 2020. "Energy Sustainability of Bio-Based Building Materials in the Cold and Severe Cold Regions of China—A Case Study of Residential Buildings" Applied Sciences 10, no. 5: 1582. https://doi.org/10.3390/app10051582
APA StyleGuo, H., Zhou, S., Qin, T., Huang, L., Song, W., & Yin, X. (2020). Energy Sustainability of Bio-Based Building Materials in the Cold and Severe Cold Regions of China—A Case Study of Residential Buildings. Applied Sciences, 10(5), 1582. https://doi.org/10.3390/app10051582