Abstract
Sound absorbing surfaces are being increasingly requested for the acoustical treatment of spaces, like offices and restaurants, where high aesthetic standards are requested. In these cases, perforated and micro-perforated panels may represent the ideal solution in terms of low maintenance, durability, and mechanical resistance. In addition, such a solution might be conveniently realized while using optically transparent panels, which might offer extra value, as they could ensure visual contact, while remaining neutral in terms of design. The paper first investigates the reliability of prediction models by comparison with measured data. Subsequently, while taking advantage of a parametric optimization algorithm, it is shown how to design an absorber covering three octave bands, from 500 Hz to 2 kHz, with an average sound absorption coefficient of about 0.8.
1. Introduction
Investigating noise annoyance problems in places where users are the main sound source and spaces are strictly confined, like open-plan offices [1], restaurants [2,3,4], and call centers and markets [5], has become a frequent research topic in recent years. In these cases, adding sound absorbing treatments proved to be an easy and efficient method for limiting the problem of high sound pressure level and controlling the speech intelligibility [6]. Among the various sound absorbing materials that are available for the purpose, with different finishing and different acoustic behavior, aesthetic factors combined with ease of maintenance often play a major role in the selection process [7]. Perforated and micro-perforated panels, when compared to more conventional porous absorbers, may offer significant advantages in terms of hygiene, fire-proofing, and durability. Moreover, their acoustic properties could be precisely targeted, achieving a strong absorption at specified frequency band, while being optimized and predicted by computational methods [8,9,10]. In addition, by using proper materials, such absorbers might easily become eco-friendly, which is an ever increasing requirement among sound absorbers [11,12].
In practical applications, perforated and micro-perforated panels are normally placed in front of a rigid surface with an air cavity between them, forming a series of parallel Helmholtz resonant cells. The sound is absorbed by the viscous loss and specific acoustic impedance of the air in holes and cavity. Accordingly, their sound absorption coefficients are dominated by the diameter and depth of the hole, the perforation rate, and the cavity thickness [10]. After decades of development, the fundamental laws underlying the design of perforated and micro-perforated panel absorbers have been clarified [8,9,10,13,14] and several proposed prediction models have been validated against measurements [15,16,17,18,19]. For the predictions of homogeneously perforated absorbers, the theoretical models that were proposed by Maa [16], Zwikker, and Kosten [17], are better used to model absorbers with circular perforations, while for other cross-sectional perforations, the models of Stinson [18] or Atalla and Sgard [19] can be used instead. Maa and other researchers have also developed a method to model multi-layer perforated absorbers, while using a transfer matrix solution, taking each layer in turn [8,9,20]. Finite Element Method (FEM) [21,22], Equivalent Circuit Method (ECM) [23], Parallel Transfer Matrix Method (PTMM) [24,25], and Admittance Sum Method (ASM) [26] are other computing methods used to model heterogeneous perforated absorbers. Carbajo et al. [27] explored the adequacy of these four different methodologies in the case of heterogeneous absorbers with isolated or shared cavities, and found that only ECM and FEM yield correct results for both conditions.
Depending on the resonance system, single-leaf perforated panel absorbers always have a limited frequency band, showing only one sharp-narrow absorption peak. Many researchers proposed the use of more complex perforated absorbers, including multi-layer systems [28], three-dimensional (3D) micro-perforated panels [29], combinations of micro-perforated panels with membranes [30,31], arranging the parallel micro-perforated panel absorbers with different cavity depths [32], or combining perforated panels with micro-perforated partitions [33], to achieve a wider absorption band. Sakagami and colleagues studied the theory behind the acoustical property of multi-leaf membranes [34], double-leaf micro-perforated panel [35], their combinations [26,31], and the combination with porous materials [36]. Ayub et al. [37] investigated the sound absorption coefficient of multiple perforated panel systems that were composed of coir fiber and one air gap. The results showed that using such combinations of multi-layer perforated panels and coir fiber could further enhance the sound absorption coefficient in a wider frequency range. Similarly, Shen et al. [38] demonstrated that combining microperforated panels with porous metal could further extend the frequency response of the absorber towards the low frequencies.
However, when investigating the possibility of using those perforated absorbers in modern spaces, like restaurants, open offices, or call centers, the sound absorption material needs to fulfill both acoustic and aesthetic requirements [7]. In this situation, transparent panels may be an optimal choice, because this allows for better visual contact between occupants and is architecturally less intrusive, as demonstrated by the several commercial solutions currently available. Meanwhile, a number of other limitations may be observed: thickness, restricted by space availability, and materials, as to preserve its transparency a resistive layer could not be used in this device. Consequently, a significant contribution may be given by micro-perforation installed behind the perforated panel in order to improve the acoustic performance despite such limitations. In this way, the reduced opening dimension generates more viscous losses inside individual holes. Thus, it makes achieving absorption over a wider frequency band while using a thinner air cavity possible. Therefore, the sound absorbing potential of multiple-leaf perforated panel with micro-perforated membrane was investigated in this paper.
The proposed absorbing elements, in this work, consisted of one or two perforated panels layers, with micro-perforated membranes laying at different distances between perforated panels or between the panels and rigid surface. An analytical model that was based on the theory of Maa [8,9,16,39] and other researchers [13], combined together while using the transfer matrix approach [10,25] was used to investigate the effects of different cavity thickness, hole diameter. and hole spacing, and to find the optimal combination for each type of absorber. The reliability and efficiency of the prediction model was validated by comparison with measured results from single and multiple-leaf and, then, once the method was validated, a triple-leaf panel was developed by means of numerical optimization techniques.
2. Materials
A 5 mm thick transparent Methyl Methacrylate sheet was used to manufacture the perforated panels (PP) in this study. The surface mass of the panel was 6 kg/m2. This material has high optical transmittance when compared with the conventional glass, and great strength and good toughness. The panels were laser cut by a computer controlled process. Figure 1 shows the design of the perforated panels used for the preliminary investigation. Four different perforated panels, named A, B, C, and D were made, with their hole diameter and hole spacing, as given in Table 1. Two perforation rates were calculated. The first was the actual rate that was obtained by dividing the hole area by the tube diameter (only considering the 10 cm diameter, corresponding to the “low frequency” tube, see Section 3.1), while the second was calculated assuming the hole pattern to be reproduced on an ideally infinite surface, and it was obviously higher than the first one.
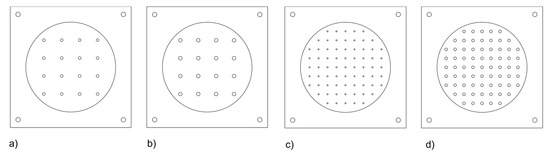
Figure 1.
Different layout of the four perforated panels: (a) panel A; (b) panel B; (c) panel C; and, (d) panel D.

Table 1.
Summary of the characteristics of different panels under investigation.
The micro-perforated membrane (MPM) absorbers that were studied in this paper were made while using a polyester transparent film, having a thickness of 0.09 mm and a surface density of 137 g/m2. The holes in MPM were made by micro-driller that was mounted on a three-axis numerically controlled system. A proper drill bit was chosen, as the application of theoretical models suggested that the best performance could be obtained by using a hole diameter of 0.30 mm, so that the actual resulting diameter was as close as possible to the desired value. However, microscopic analysis (Figure 2) showed unavoidable fluctuations in actual hole diameters that spanned from 0.20 to 0.35 mm. Therefore, taking advantage of a segmentation algorithm that was applied to microscopic images, the actual hole area was calculated, and the “effective” circular hole diameter was found. According to the actual frequency distribution of the effective diameters, the average value of 0.267 mm was considered in the subsequent calculations. Three MPM, named M4, M5, and M6, were prepared with the hole spacing being set accordingly at 4 mm, 5 mm, and 6 mm. Their perforation rates were 0.36%, 0.23%, and 0.16%, respectively. No significant difference appeared between actual and “infinite-extension” perforation rate, given the hole dimension. Sample M6 resulted from the optimization process and was, consequently, only used in the preparation of the triple-layer panel.
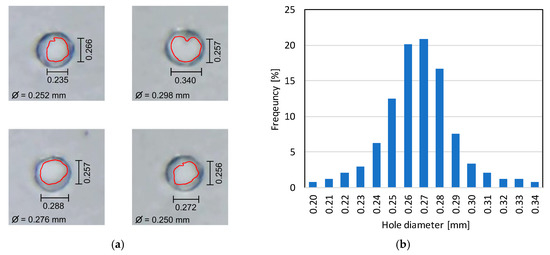
Figure 2.
(a) Magnified image of a sample of the holes of the micro-perforated panels with major dimensions and effective diameter (in mm). Red line highlights the hole perimeter obtained by means of the segmentation algorithm; and, (b) Frequency distribution of effective hole diameters.
Laying the selected specimens and spacers in series formed the multi-layer structures that were studied in this paper. The different layers could be tightly combined together through fixing screws at the panel corners. The spacers were made of the same material as the perforated panels mentioned above, which were adapted to form an air cavity of desired thickness. The spacers had different diameters, so that they fitted the tube diameter, in order to ensure that air volume behind each hole corresponded to the expected value. Plasticine and adhesive tape was used to seal every visible gap to avoid that measurements could be affected by sound escaping through air gaps between different parts. It should be noted that the last air cavity, the one right in front of the rigid surface, was formed while using the measuring tube termination, so that its thickness could be conveniently controlled. One sample for each configuration was made, but several measurements were carried out. For the sake of clarity, standard deviations among the measurements were not included in plots if they were negligible.
Several configurations of multi-layer resonant structures were investigated in the study to test the reliability of the prediction methods. Table 2 summarizes the analyzed combinations, starting from the layer nearest to the sound source to the farthest one. The combinations could be divided into four classes (Figure 3): double perforated panels (PP-PP), one perforated panel and a micro-perforated membrane (PP-MPM), double micro-perforated membranes (MPM-MPM), and a triple leaf panel with one PP and two MPM. All of the layers will be described, starting from the outer layer (exposed to sound) to the backing rigid surface, for the sake of clarity and consistence throughout the paper.
Table 2.
Configurations of multi-leaf resonant absorbers used in the preliminary test.
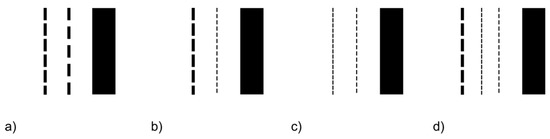
Figure 3.
Schematic configuration of the different samples under investigation: (a) double leaf perforated panels (PP); (b) double leaf one perforated panel and a micro-perforated membrane (PP-MPM); (c) double leaf double micro-perforated membranes (MPM-MPM); (d) triple leaf optimized triple-layer absorber (PP-MPM-MPM). Black box represents the rigid surface.
3. Methods
3.1. Impedance Tube Method
The two-microphones impedance tube method was applied in this paper to measure the acoustic absorption of resonant absorbers, according to the process that is detailed in ISO 10534-2:1998 standard [40]. In this method, the plane sound wave is generated by a loudspeaker at one end of the tube and is reflected by the specimen at the other end. Two microphones that are set at different positions on the internal surface of the tube are used to record the sound energy decay. The reflection coefficient R of the specimen is calculated from the corrected complex acoustic transfer function. Subsequently, the normal incidence sound absorption coefficient α is calculated as α = 1 − |R|2. The frequency range in which the measurements are reliable depends on the length of the tube for the minimum frequency and on the tube diameter and the microphone spacing for the maximum frequency. Two impedance tubes with different internal diameters (10 cm and 4 cm) are needed in order to cover the whole spectrum range in which the specimens are expected to absorb. These tubes are made of transparent Methyl Methacrylate, 5 mm thick and 85 cm long. At the sending end of the larger tube, a 11 cm loudspeaker is sealed into a wooden case and properly isolated from the tube structure by means of an elastic pad, while a 5 cm loudspeaker is used for the smaller tube (Figure 4). On the other end, there is a shorter tube with a movable rigid termination, which is suitable to form the last air cavity of the test structure. All of the gaps between the interfaces are carefully sealed with plasticine. In the measurements, two microphones (Core Sound) with a flat frequency response from 20 Hz to 20 kHz are used. In the large tube, two different spacings are available, one at 6 cm and one at 20 cm, which correspond to a low frequency limit, respectively, of 283 Hz and 85 Hz, and a high frequency limit of 2 kHz and 770 Hz, respectively. Thus, the large tube covers one-third octave bands from 100 Hz to 1.6 kHz. In the smaller tube a 3 cm spacing between microphones is used, resulting in a frequency range from 566 Hz to 4.9 kHz, allowing for measurements up to the 4 kHz one-third octave band.
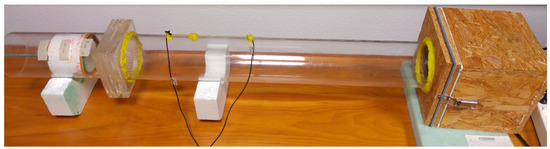
Figure 4.
The 10 cm standing wave tube used to measure sound absorption coefficients in the frequency range from 100 Hz to 1.6 kHz. One of the triple layer samples is mounted in place.
The whole measurement system is controlled by a MATLAB (2018, Mathworks, Natick, MA, USA) graphic user interface, which generated and played a 5 s linear sweep from 70 Hz to 3 kHz, used in the combination with the larger impedance tube, and from 500 Hz to 5 kHz used in combination with the smaller one. In the measurements, the temperature and the relative humidity were monitored with a precision electronic thermo-hygrometer and were subsequently applied in the calculation process.
3.2. Analytical Prediction Formulation
In order to calculate the overall acoustic impedance, and hence the corresponding sound absorption coefficient, the transfer matrix method was used [10], according to which, if the bottom of layer i has an impedance of zsi, and the layer i has a characteristic acoustic impedance zi, and then the impedance at the bottom of layer i + 1 is:
where j is the imaginary unit, kxi is the wavenumber for layer i, and di the corresponding thickness. The above formula can be recursively applied to calculate the surface impedance of a multi-layered absorbent, as many researchers have demonstrated [10,25]. In the subsequent sections, its application to the specific case of a series of perforated and micro-perforated panels will be further validated. Obviously, as the final value of the impedance results from the recursive application of Equation (1), it is not possible to obtain a simple and straightforward expression to relate sound absorption and the different input parameters.
The impedance for the different layers can be calculated according to theoretical expressions briefly summarized below. For an air layer (with thickness d), in front of a rigid surface (for which zsi is infinite), Equation (1) yields:
where ρ is the air density (assumed equal to 1.21 kg/m3) and c is the speed of sound in air (assumed equal to 340 m/s).
zsi+1 = −j ρc cot(kd),
The presence of a perforated panel behaving as a Helmholtz resonator in the front of the air cavity alters its impedance by the addition of mass (jωm) and resistance (rm) terms, so that:
zp = rm + j[ωm − ρc cot(kd)],
m being the mass of the vibrating plug of air within the perforations and ω the angular frequency.
The mass of the vibrating plug must take the effect of the radiation impedance and of the mutual interactions between neighboring elements into account, resulting in the addition of an “end correction” to the thickness of the panel. A typical expression for the mass is [10]:
where ε is the perforation rate, t is the panel thickness, a is the hole radius, ν is the kinematic viscosity of air (assumed equal to 1.5·10−7 m2/s), and δ is the end correction factor. The latter can be calculated by means of different formulas, among which one that is suitable for more open structures [10] assumes that δ = 0.8(1 − 1.47ε1/2 + 0.47ε3/2).
m = ρ/ε [t + 2δa + (8ν/ω (1+t/2a))0.5],
The resistance term rm is responsible for the losses within the device and, consequently, of the absorption as a function of frequency. For normal holes (not sub-millimeter in size), and if no additional porous layers are used, the term can be expressed as:
rm = ρ/ε (8νω)0.5 (1 + t/2a),
Finally, for microperforated panels the losses occur because of viscous boundary layer effects in the perforations, provided that the diameter is sub-millimeter and comparable to the layer thickness. Maa mostly developed the theoretical formulation for this device [8,9] and starts by determining the specific acoustic impedance of a cylindrical hole:
Where J0 and J1 are the Bessel functions of the first kind, respectively, of zero and first order, t is the tube length (i.e., the layer thickness), while k’ depends on the tube diameter a and on the viscosity of the air η (assumed equal to 1.85·10−5 Pa·s), according to the relation k’ = a (ρω/η)1/2.
zc must be divided by the perforation rate ε and added to the impedance of the cavity in order to get the surface impedance of the Helmholtz resonator (Equation (2)), to the radiation resistance and the end correction:
zmp = zc /ε − jρc cot(kd) + (2ωρη)0.5/(2ε) + j1.7ωρa/ε,
Once the values of the surface impedances are determined, any combination of different layers can be handled while using the transfer matrix approach. In the subsequent sections, the theoretical model was first validated by comparison with the experimental values and finally used to optimize the design of a broad-band sound absorber.
4. Results and Discussion
4.1. Single-Leaf Resonant Absorber
Only the larger tube was used and, consequently, the frequencies of interest were limited to the one-third octave bands from 100 Hz to 1600 Hz in order to validate the prediction models. Figure 5a shows the predicted and experimental values of sound absorption coefficient for single-leaf perforated panels backed by a 20 mm thick cavity. It was observed that the measured sound absorption coefficients for panel A, B, and C were in a reasonable agreement with their predictions in terms of the maximum absorption coefficient and the resonant frequency. In particular, while using actual perforation rates instead of the infinite-pattern values yielded better results and the agreement was even better for panel C, the one with hole distribution closer to the “ideal” one, showing the smallest differences between the resonant frequencies, as well as the peak sound absorption coefficient value. In fact, the measured peak frequency was at 630 Hz (α = 0.92), while the predicted peak was at 620 Hz with α = 0.93 when the actual perforation rate was used (while it moved to 660 Hz with α = 0.89 when the “infinite” pattern value was used). The deviations of sound absorption coefficient values at the remaining frequencies were almost everywhere below 0.05. For panel A and panel B, the resonant frequency that was measured in laboratory occurred at a frequency a little lower than that predicted, while the peak absorption value was somewhat higher than the corresponding predictions, especially for panel B. The misalignment that was observed between measurements and predictions could be attributed to the influence of further border effects, as the cavity cell behind the holes near the sample edge (close to the boundary) might show a different behavior than the cavity cells of the other holes (close to the center).
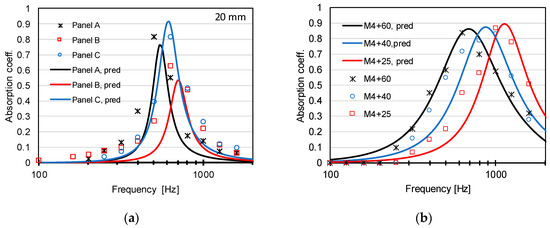
Figure 5.
Comparison of the predicted and measured sound absorption coefficients for: (a) different perforated panels with a 20 mm cavity; (b) micro-perforated membrane M4 with different cavity depth: 25 mm, 40 mm, 60 mm thick.
Figure 5b presents the validation of single layer micro-perforated membranes, showing the sound absorption coefficient of sample M4 as a function of varying cavity thickness. The measured resonant frequencies of membrane cases were in general agreement with those that were given by the analytical method and calculated while assuming a hole diameter of 0.267 mm. Some measured results had lower absorption than the corresponding predicted values. This deviation could be explained as a consequence of the small variations in hole diameters, as well as of the possible vibration of the membrane, thus modifying the actual behavior of the panel. As expected, when compared with perforated panels, the micro-perforated membranes showed an improvement of sound absorption, with broader bandwidth, higher absorption peak, and extended high frequency response.
Overall, for single-leaf resonant absorbers, the results that were measured in experiments showed good agreement with those that were predicted in terms of resonant frequency and peak sound absorption coefficient, thus confirming that the prediction method in this case was reliable and robust.
4.2. Double-Leaf Resonant Absorber
Different combinations of perforated panels and micro-perforated membranes were analyzed, in terms of double-panel, double-membrane, and panel-membrane combinations, in order to achieve better absorbing performance over a wider frequency range and validate the prediction model under more complex conditions (testing the use of the transfer matrix method to calculate the absorption).
First, a double-panel combination that consisted of panel C (backed by 10 mm cavity) and panel B (backed by 50 mm cavity, close to rigid surface) was studied by experiments and analytic method. As a consequence of the addition of a second PP (Figure 6a), two peaks appeared at 300 Hz (α = 0.82) and 1320 Hz (α = 0.98), with predicted absorption coefficients fitting well with the measured results, with only few deviations occurring at the frequency below 300 Hz with a maximum error being 0.16 (at 200 Hz). The agreement of two results indicates the reliability of the prediction method for double-panel combination.
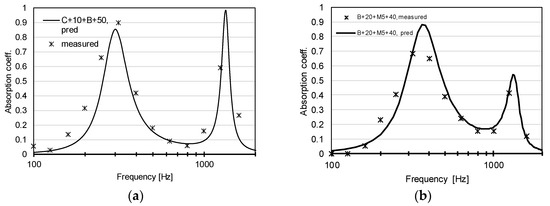
Figure 6.
Comparison of the predicted and measured sound absorption coefficients for: (a) double-panel structure: perforated panel C followed by a 10 mm cavity combined with panel B followed by a 50 mm cavity, (b) perforated panel B followed by a 20 mm cavity combined with M5 followed by a 40 mm cavity.
The absorption characteristic of one combination consisting of perforated panel (B) and micro-perforated membrane (M5) was investigated in order to check the validity of the prediction model for a combination of microperforated membrane and panel (Figure 6b). Even in this case, the second layer caused a new peak to appear. The measured results were in good agreement with the predictions, as the one-third octave band values reasonably matched the predicted curve.
For the case of a double-leaf micro-perforated membrane, a combination of samples M4 (surface layer) and M5 both backed by a 25 mm cavity was taken into account (Figure 7a). The predicted sound absorption coefficient showed a sufficient agreement with the measured values, with the most evident difference appearing on the second peak where the absorption was lower than the predicted value by approximately 0.2. In the comparison with individual micro-perforated membrane (M4 and M5), the combined sample showed a much more efficient absorption capability, with two distinct peaks and a broader bandwidth spanning from 420 Hz to 1940 Hz (the absorption values in this range being always over 0.5). This time the absorption coefficients in the “valley” between the two peaks were higher, unlike previous cases, in which two layers were combined, confirming that micro-perforated panels behave better than normal perforated panels.
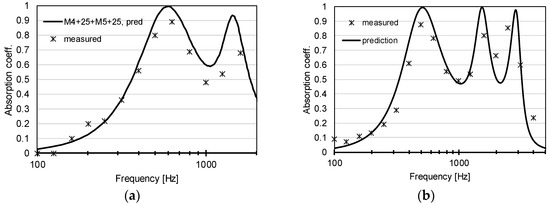
Figure 7.
Comparison of the predicted and measured sound absorption coefficients for (a) double-membrane structure: micro-perforated membrane M4 followed by a 25 mm cavity combined with M5 followed by a 25 mm cavity. (b) triple-membrane structure: panel D, 10 mm cavity, micro-perforated membrane M4 followed by a 15 mm cavity, combined with M5 followed by a 30 mm cavity.
Finally, the configuration with three layers was investigated to validate the prediction model. In this case, measurements were carried out using both tubes given the extended frequency range of the absorber, thus including frequencies up to 4 kHz one-third octave band. For testing purposes, the following assembly was considered to ensure that the peaks were evenly spaced over a wider range and well identifiable: the outer layer was panel D, followed by a 10 mm air gap, and then micro-perforated membrane M4, 15 mm air gap, micro-perforated membrane M5, and a final 30 mm cavity. The results, as shown in Figure 7b, demonstrated that the agreement between measurements and predictions was generally good, with the largest variations appearing around 400 Hz, where the measured absorption was lower, and around 2 kHz, where measurements outperformed predictions.
5. Parametric Study and Panel Optimization
Given the complex relationship between the characteristics of each individual layer, air gaps and the overall absorption, and while considering the good agreement observed with analytical relations, a parametric study was carried out to better understand which combinations of parameters may maximize sound absorption. The parameter chosen as the target value of the optimization was the mean of the sound absorption coefficients that were calculated over the one-third octave bands from 400 Hz to 2.5 kHz (αavg). No conventional single number descriptor was used to underline the complete customization of the process. Among the possible optimized solutions, the one that ensured an average α not differing by more than 2% from the maximum and having the smallest thickness was selected. The overall thickness of the multi-layer combination was arbitrarily limited to 70 mm, because beyond that threshold there are several conventional (and likely cheaper) solutions that could be used. The thickness of the perorated layers was kept constant at 5 mm in order to ensure good mechanical resistance for the external finishing, while the thickness of the microperforated layers was kept at 0.09 mm to avoid changing the available materials.
First, the case of a double leaf perforated panel was considered, obtaining an αavg of 0.45 that resulted from a first panel with 1 mm holes with a 8 mm spacing, over a 15 mm air gap, and a second panel with 1 mm holes with a 4 mm spacing, over a second air gap 25 mm thick. The analysis of the best and worst combinations showed that the essential condition that was needed to obtain high absorption was to keep hole diameter to 1 mm for both layers, with a 4 mm spacing for the outermost layer (resulting in a 4.9% perforation rate). Conversely, the lowest average absorption (below 0.05) was obtained when the spacing between the holes of the outermost layer exceeded 14 mm, while the hole diameter was 1 mm. It can be observed (Figure 8a) that the distance between the two peaks increases by increasing the hole spacing of the innermost layer, mostly because the lowest frequency peak moves towards lower frequencies at a faster pace than the high frequency peak. An increase in the spacing of the outermost layer (Figure 8b) moves the low frequency peak towards even lower frequencies, and at the same time significantly reduces the high frequency peak, thus resulting in the observed poor performance. Similarly, by increasing the thickness of the first air gap (or by decreasing that of the second air gap) the two peaks move away and out of the desired frequency range.
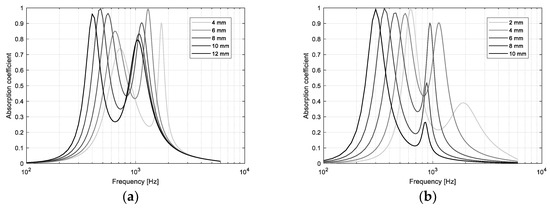
Figure 8.
Sound absorption coefficient of a double layer perforated panel for different parameter modifications: (a) distance between holes of the innermost layer; and, (b) distance between holes of the outermost layer.
A second optimization exercise was carried out with reference to the combination of one perforated and one micro-perforated layer, while assuming the first to be the outermost layer. In this case the best performance yielded an αavg of 0.63 when the first air gap (closest to wall) was 35 mm, the distance between holes in the MPM was 5 mm, the second air gap was 25 mm, and the perforated panel had 1 mm holes with a 2 mm spacing. The analysis of the best performing configurations showed that a spacing of 5 or 6 mm in the MPM was an essential condition, while the hole diameter had to be 1 or 2 mm in the perforated layer, while their spacing had to be 2 or 6 mm, respectively. As in the previous case, the worst performance was attributed to combinations where the perforated layer had a hole diameter of 1 mm, and a spacing exceeding 14 mm. Parametric analysis showed that increasing the distance between holes in the MPM (Figure 9a) caused the low frequency peak to shift towards even lower frequencies, while the high frequency peak remained more or less in the same position but its magnitude significantly decreased. The analysis of the variations as a function of the perforated layer parameters showed (Figure 9b) that using a 1 mm hole determined, despite the slightly higher average value, a quite unbalanced response with increased absorption towards the lower frequencies. Conversely, using the 2 mm hole with 6 mm spacing resulted in a more evenly distributed sound absorption.
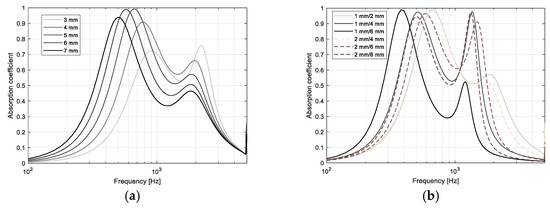
Figure 9.
Sound absorption coefficient of a double layer PP-MPM panel for different parameter modifications: (a) distance between holes of the innermost layer (microperforated); and, (b) hole diameter and distance between holes of the outermost layer.
The third scenario that was investigated, following the previous discussion, was that both the layers could be micro-perforated. In this case, only air gap thickness and hole spacings were changed given the constraints applied to layer thickness and hole dimensions. The best result, according to previously stated criteria, was given by a first micro-perforated layer with a 5 mm spacing and a 30 mm air gap, followed by the second micro-perforated layer with a 3 mm spacing and a 25 mm air gap. The resulting αavg was about 0.72. The analysis of the best performing combinations showed that all of them shared a 3 mm spacing for the outermost layer, while, for the other one, the spacing varied between 4 and 6 mm. The parameters that minimized average α were, as for the previous cases, a large spacing (exceeding 14 mm) for the holes in the outermost layer. Parametric analysis showed that, by increasing the spacing between holes in the inner layer (Figure 10a), the two resonant peaks in the absorption curve moved towards the lower frequencies, obtaining the maximum values around 5 mm spacing. Similarly, the increase in the hole spacing for the external layer (Figure 10b) caused a more evident shift towards lower frequencies, together with a significant drop in the sound absorption coefficient pertaining to the second peak. It is interesting to point out that, starting from the optimized configuration, a change in the thickness of the air gaps caused a shift of the peaks with no significant reduction of the peaks of absorption (Figure 10 c,d). Thus, the effect on the average absorption was generally negligible, provided that the peaks fell within the desired frequency range.
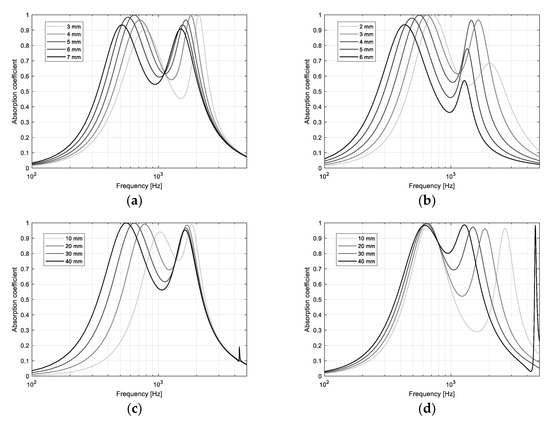
Figure 10.
Comparison of the predicted sound absorption coefficients for double-membrane structure. (a) distance between holes of the innermost layer; (b) distance between holes of the outermost layer; (c) thickness of first air gap; and, (d) thickness of second air gap.
The final optimization was carried out by adopting a three layer scheme, with two inner micro-perforated layers and the perforated layer being used as the exterior finishing surface, to offer more protection to the MPM. The boundary conditions for the optimization were the same used in the previous cases, with the only difference being the presence of the extra layer. The best possible result that could be achieved in this case was an αavg of about 0.81, but the overall thickness was approximately 10 cm, which was well beyond the 7 cm limit. However, accepting a 2% reduction in the mean α it was nonetheless possible to obtain a suitable panel configuration with an overall thickness of 70 mm and a sound absorption coefficient never falling below 0.7 in the preferred frequency interval. The panel arrangement included a perforated layer with 4 mm holes that were spaced at 10 mm, forming a 20 mm air gap with the subsequent layer being made of a micro-perforated membrane with 4 mm spacing over a 20 mm air gap, and, finally, a second micro-perforated layer with 6 mm spacing with a 25 mm air gap.
The analysis of the best performing parameter combinations (Figure 11) showed that, once again, the spacing in the micro-perforated layers played a major role, as in the first one it varied between 5 and 6 mm, while in the second one it was mostly equal to 3 or 4 mm. With reference to the PP, the optimal hole diameter varied between 3 and 6 mm provided that the spacing varied accordingly between 6 and 12 mm (so that the ratio remained optimally around 2.3 in most of the cases and the perforation rate was about 13%). The air gaps had to vary between 20 and 30 mm, with the one closest to wall, which could span over a much larger interval. Conversely, the worst combinations resulted from a very small perforation rate (below 1%) for the outermost layer, independent of the other parameters.
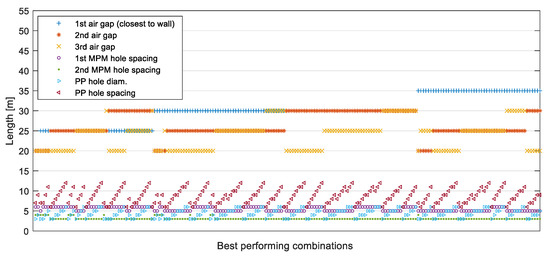
Figure 11.
Plot of best 200 combinations of the seven input parameters returned by the optimization and yielding an average absorption coefficient (calculated over the one-third octave bands from 400 Hz to 2.5 kHz) within 2% of the maximum, equal to 0.81.
The effect of their variations was investigated starting from the selected best performing combination of parameters. The increase in hole spacing in the first MPM (Figure 12a) yielded a general shifting of the peaks towards lower frequencies, with significant changes in their amplitude. In particular, a higher perforation rate made the high frequency peaks less effective, while decreasing the perforation rate (by increasing the distance) made the low frequency peak less effective. Similarly, increasing hole spacing in the second MPM (Figure 12b) resulted in shifting the peaks towards lower frequency (except the central peak which remained substantially stable around 1.25 kHz), with the interesting effect that, when the distance was larger than 4 mm, the third peak started merging with the second one.
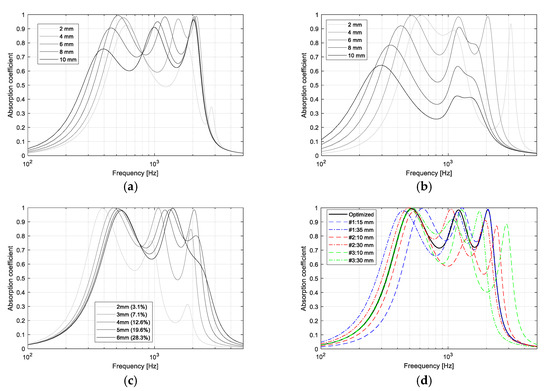
Figure 12.
Comparison of the predicted sound absorption coefficients for triple-membrane structure as a function of individual parameter changes: (a) spacing of the first MPM; (b) spacing of the second MPM; (c) perforation rate of PP; and, (d) air gaps thickness. Reference parameters were: 25 mm back cavity; 1st MPP with 6 mm spacing and 0.27 mm holes; 20 mm cavity; 2nd MPP with 4 mm spacing and 0.27 holes; 20 mm cavity; PP with 4 mm holes with 10 mm spacing.
The variations in hole diameter and spacing for the outermost layer were analyzed as a function of hole diameter and, consequently, in terms of the perforation rate (Figure 12c), although viscous losses due to actual hole dimension may also affect the result. A low perforation rate implies a shifting of the peaks towards low frequencies and a significant depression of the second and third peaks, thus dramatically reducing the average sound absorption coefficient, as shown in Figure 3c, in agreement with the results of the optimization. Conversely, an increase in perforation rate beyond the optimal value only affects the high frequency peak, while the absorption due to the MPM remains substantially unchanged.
Finally, the effect of the air gaps was investigated (Figure 12d). Increasing the thickness of the layer closest to the rigid surface mostly shifted the first peak towards the lowest frequencies, without affecting the maximum absorption, except for a small reduction of the value in the “valley” between the two peaks. It is interesting to notice that the high frequency peak remained unchanged, independent of the air gap value. When the intermediate air gap was increased, it was the second peak (and to a smaller extent the third one) that showed the largest variations, moving towards low frequencies and changing amplitude. A too thin air gap caused the peaks to drop dramatically, thus making the absorber ineffective. However, a reduction in the absorption values also appeared when the air gap was too large. Finally, an increase in thickness of the air gap closer to the exterior layer had no influence at all on the first peak, while it shifted the second and particularly the third one towards lower frequencies. Again, a variation in peaks amplitude appeared, but they remained around and above 0.8, with larger variations appearing in the valleys.
Once the best configuration was identified through the optimization procedure, the resulting information was used to assemble the panel (Figure 13a) and measure its sound absorption coefficient in the impedance tube according to the previously described methods. The results showed (Figure 13b) fairly good agreement between measurements and predictions. The predicted absorption peaks occurred at 500 Hz, 1200 Hz, and 2100 Hz, respectively, and the peak values were all very close to unity, while the lowest absorption values in the valleys were always above 0.7. The measured results showed slightly lower maximum values, particularly for the first peak, compensated by higher values that were observed in the second valley (around 1.25 kHz). This combination shows a clear advantage in terms of absorption range as well as in terms of αavg when compared with previous results corresponding to single and double layers. In addition, under diffuse field conditions, the panel will likely be able to provide an even smoother response over the selected frequency range, as demonstrated by Asdrubali and Pispola [28].
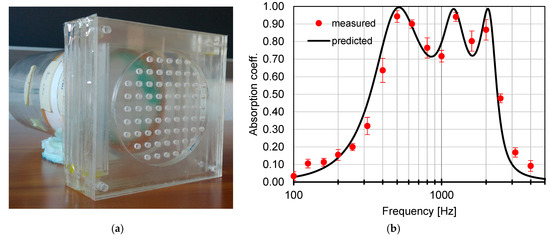
Figure 13.
(a) The optimized three-layers panel mounted on the sample holder of the standing wave tube. (b) Sound absorption coefficient of a triple-leaf resonant absorber, formed by a perforated panel D (with a 20 mm backing cavity, first layer), a micro-perforated membrane with a 4 mm spacing and a 20 mm backing cavity, and a micro-perforated membrane with a 6 mm spacing and a 25 mm backing cavity, close to rigid surface. Error bars represent measured standard deviation.
6. Conclusions
In this paper, the potential of multiple layers of optically transparent sound absorbing materials was investigated. Perforated panels and micro-perforated membranes were first used to validate the predictive models, and the latter were then used to carry out a parametric study of the influence of the different variables and finally optimize an absorber to be effective in the one-third octave bands from 400 Hz up to 2500 Hz while keeping an overall thickness below 7 cm. The optimized triple-layer absorber (PP-MPM-MPM) provided a sound absorption curve that was characterized by three high peaks (close to unity) and two relatively shallow valleys. This type of absorber also had the most uniform sound absorption coefficient over the frequency range of interest, with an average absorption of about 0.80. Accordingly, by arranging perforated panels and micro-perforated membranes in a correct way, it could be possible to obtain the same absorption provided by combinations, including the use of porous materials, properly targeting the desired absorption in the preferred frequency range, while keeping a reduced thickness of the absorber, and, using proper materials, also its transparency. Further studies are under way to extend the number of layers, so as to control sound absorption over an even broader frequency range.
Author Contributions
Conceptualization, F.M.; Methodology, F.M.; Software, F.M.; Formal Analysis, L.P. and F.M.; Investigation, L.P. and F.M.; Data Curation, L.P.; Writing—Original Draft Preparation, L.P.; Writing—Review and Editing, F.M.; Visualization, L.P and F.M. All authors have read and agreed to the published version of the manuscript.
Funding
This research received no external funding.
Conflicts of Interest
The authors declare no conflict of interest.
References
- Yadav, M.; Kim, J.; Cabrera, D.; de Dear, R. Auditory distraction in open-plan office environments: The effect of multi-talker acoustics. Appl. Acoust. 2017, 126, 68–80. [Google Scholar] [CrossRef]
- Novak, C.C.; La Lopa, J.; Novak, R.E. Effects of Sound Pressure Levels and Sensitivity to Noise on Mood and Behavioral Intent in a Controlled Fine Dining Restaurant Environment. J. Culinary Sci. Techn. 2010, 8, 191–218. [Google Scholar] [CrossRef]
- Hodgson, M.; Steininger, G.; Razavi, Z. Measurement and prediction of speech and noise levels and the Lombard effect in eating establishments. J. Acoust. Soc. Am. 2007, 121, 2023–2033. [Google Scholar] [CrossRef]
- Bottalico, P. Lombard effect, ambient noise, and willingness to spend time and money in a restaurant. J. Acoust. Soc. Am. 2018, 144, EL209. [Google Scholar] [CrossRef]
- Della Crociata, S.; Simone, A.; Martellotta, F. Acoustic comfort evaluation for hypermarket workers. Build. Environ. 2013, 59, 369–378. [Google Scholar]
- Nijs, L.; Saher, K.; den Ouden, D. Effect of room absorption on human vocal output in multitalker situations. J. Acoust. Soc. Am. 2008, 123, 803. [Google Scholar] [CrossRef]
- Adams, T. Sound Materials; Frame Pub.: NY, USA, 2017. [Google Scholar]
- Maa, D.Y. Theory and Design of Microperforated-Panel Sound-Absorbing Construction. Sci Sinica 1975, 18, 55–71. [Google Scholar]
- Maa, D.Y. Practical single MPP absorber. Int. J. Acoust. Vib. 2007, 12, 3–6. [Google Scholar] [CrossRef]
- Cox, T.J.; d’Antonio, P. Acoustic Absorbers and Diffusers: Theory, Design, and Application; Taylor & Francis: New York, NY, USA, 2009. [Google Scholar]
- Martellotta, F.; Cannavale, A.; De Matteis, V.; Ayr, U. Sustainable sound absorbers obtained from olive pruning wastes and chitosan binder. Appl. Acoust. 2018, 141, 71–78. [Google Scholar] [CrossRef]
- Rubino, C.; Aracil, M.B.; Gisbert-Payá, J.; Liuzzi, S.; Stefanizzi, P.; Cantó, M.Z.; Martellotta, F. Composite eco-friendly sound absorbing materials made of recycled textile waste and biopolymers. Materials 2019, 12, 4020. [Google Scholar] [CrossRef]
- Ingard, U. On the theory and design of acoustic resonators. J. Acoust. Soc. Am. 1953, 25, 1037–1061. [Google Scholar] [CrossRef]
- Toyoda, M.; Mu, R.-L.; Daiji, T. Relationship between Helmholtz-resonance absorption and panel-type absorption in finite flexible microperforated-panel absorbers. Appl. Acoust. 2010, 71, 315–320. [Google Scholar] [CrossRef]
- Laly, Z.; Atalla, N.; Meslioui, S.-A. Acoustical modeling of micro-perforated panel at high sound pressure levels using equivalent fluid approach. J. Sound Vib. 2018, 427, 134–158. [Google Scholar] [CrossRef]
- Maa, D.Y. Microperforated-panel wideband absorbers. Noise Control. Eng. J. 1987, 29, 77–84. [Google Scholar] [CrossRef]
- Zwikker, C.; Kosten, C.W. Sound Absorbing Materials; Elsevier: New York, NY, USA, 1949. [Google Scholar]
- Stinson, M.R. The propagation of plane sound waves in narrow and wide circular tubes, and generalization to uniform tubes of arbitrary cross-sectional shape. J. Acoust. Soc. Am. 1991, 89, 550–558. [Google Scholar] [CrossRef]
- Atalla, N.; Sgard, F. Modeling of perforated plates and screens using rigid frame porous models. J. Sound Vib. 2007, 303, 195–208. [Google Scholar] [CrossRef]
- Guignouard, P.; Meisser, M.; Allard, J.F.; Rebillard, P.; Depollier, C. Prediction and measurement of the acoustical impedance and absorption coefficient at oblique incidence of porous layer with perforated facings. Noise Control Eng. J. 1991, 36, 129–135. [Google Scholar] [CrossRef]
- Wang, C.; Huang, L. On the acoustic properties of parallel arrangement of multiple micro-perforated panel absorbers with different cavity depths. J. Acoust. Soc. Am. 2011, 130, 208–218. [Google Scholar] [CrossRef]
- Okuzono, T.; Sakagami, K. A frequency domain finite element solver for acoustic simulations of 3D rooms with microperforated panel absorbers. Appl. Acoust. 2018, 129, 1–12. [Google Scholar] [CrossRef]
- Pieren, R.; Heutschi, K. Modelling parallel assemblies of porous materials using the equivalent circuit method. J. Acoust. Soc. Am. 2015, 137, 131–136. [Google Scholar] [CrossRef]
- Allard, J.F.; Atalla, N. Propagation of sound in porous media. In Modelling Sound Absorbing Materials; Wiley Chichester: Chichester, UK, 2009. [Google Scholar]
- Verdière, K.; Panneton, R.; Elkoun, S.; Dupont, T.; Leclaire, P. Transfer matrix method applied to parallel assembly of sound absorbing materials. J. Acoust. Soc. Am. 2013, 134, 4648–4658. [Google Scholar] [CrossRef]
- Sakagami, K.; Nagayama, Y.; Morimoto, M.; Yairi, M. Pilot study on wideband sound absorber obtained by combination of two different microperforated panel (MPP) absorbers. Acoust. Sci. Technol. 2009, 30, 154–156. [Google Scholar] [CrossRef]
- Carbajo, J.; Ramis, J.; Godinho, L.; Amado-Mendes, P. Assessment of methods to study the acoustic properties of heterogeneous perforated panel absorbers. Appl. Acoust. 2018, 133, 1–7. [Google Scholar] [CrossRef]
- Asdrubali, F.; Pispola, G. Properties of transparent sound-absorbing panels for use in noise barriers. J. Acoust. Soc. Am. 2007, 121, 214–221. [Google Scholar] [CrossRef]
- Toyoda, M.; Sakagami, K.; Okano, M.; Okuzono, T.; Toyoda, E. Improved sound absorption performance of three-dimensional MPP space sound absorbers by filling with porous materials. Appl. Acoust. 2017, 116, 311–316. [Google Scholar] [CrossRef]
- Gai, X.; Li, X.; Zhang, B.; Xing, T.; Zhao, J.; Ma, Z. Experimental study on sound absorption performance of microperforated panel with membrane cell. Appl. Acoust. 2016, 110, 241–247. [Google Scholar] [CrossRef]
- Sakagami, K.; Fukutani, Y.; Yairi, M.; Morimoto, M. A theoretical study on the effect of a permeable membrane in the air cavity of a double-leaf microperforated panel space sound absorber. Appl. Acoust. 2014, 79, 104–109. [Google Scholar] [CrossRef]
- Mosa, A.I.; Putra, A.; Prasetiyo, I.; Ramlan, R.; Esraa, A.A. Absorption Coefficient of Inhomogeneous MPP Absorbers with Multi-Cavity Depths. Appl. Acoust. 2019, 146, 409–419. [Google Scholar] [CrossRef]
- Carbajo, J.; Ramis, J.; Godinho, L.; Amado-Mendes, P. Perforated panel absorbers with micro-perforated partitions. Appl. Acoust. 2019, 149, 108–113. [Google Scholar] [CrossRef]
- Kiyama, M.; Sakagami, K.; Tanigawa, M.; Morimoto, M. A Basic Study on Acoustic Properties of Double-leaf Membranes. Appl. Acoust. 1998, 54, 239–254. [Google Scholar] [CrossRef]
- Sakagami, K.; Nakamori, T.; Morimoto, M.; Yairi, M. Double-leaf microperforated panel space absorbers: A revised theory and detailed analysis. Appl. Acoust. 2009, 70, 703–709. [Google Scholar] [CrossRef]
- Sakagami, K. Sound absorption systems with the combination of a microperforated panel (mpp), permeable membrane and porous material: Some ideas to improve the acoustic performance of mpp sound absorbers. Int. J. Recent Res. Appl. Stud. 2015, 24, 59–66. [Google Scholar]
- Ayub, M.; Hosseini Fouladi, M.; Ghassem, M.; Mohd Nor, M.J.; Najafabadi, H.S.; Amin, N.; Zulkifli, R. Analysis on Multiple Perforated Plate Sound Absorber Made of Coir Fiber. Int. J. Acoust. Vib. 2014, 19, 203–211. [Google Scholar] [CrossRef]
- Shen, X.; Bai, P.; Yang, X.; Zhang, X.; To, S. Low Frequency Sound Absorption by Optimal Combination Structure of Porous Metal and Microperforated Panel. Appl. Sci. 2019, 9, 1507. [Google Scholar] [CrossRef]
- Maa, D.Y. Potential of microperforated panel absorber. J. Acoust. Soc. Am. 1997, 104, 2861–2866. [Google Scholar] [CrossRef]
- ISO 10534-2:1998 Acoustics—Determination of Sound Absorption Coefficient and Impedance in Impedance Tubes—Part 2: Transfer-function Method; International Organization for Standardization: Geneva, Switzerland, 1998.


© 2020 by the authors. Licensee MDPI, Basel, Switzerland. This article is an open access article distributed under the terms and conditions of the Creative Commons Attribution (CC BY) license (http://creativecommons.org/licenses/by/4.0/).