Abstract
Most mines choose the drilling and blasting method which has the characteristics of being a cheap and efficient method to fragment rock mass, but blast-induced ground vibration damages the surrounding rock mass and structure and is a drawback. To predict, analyze and control the blast-induced ground vibration, the random forest (RF) model, Harris hawks optimization (HHO) algorithm and Monte Carlo simulation approach were utilized. A database consisting of 137 datasets was collected at different locations around the Tonglvshan open-cast mine, China. Seven variables were selected and collected as the input variables, and peak particle velocity was chosen as the output variable. At first, an RF model and a hybrid model, namely a HHO-RF model, were developed, and the prediction results checked by 3 performance indices to show that the proposed HHO-RF model can provide higher prediction performance. Then blast-induced ground vibration was simulated by using the Monte Carlo simulation approach and the developed HHO-RF model. After analyzing, the mean peak particle velocity value was 0.98 cm/s, and the peak particle velocity value did not exceed 1.95 cm/s with a probability of 90%. The research results of this study provided a simple, accurate method and basis for predicting, evaluating blast-induced ground vibration and optimizing the blast design before blast operation.
1. Introduction
In blasting, only 25% to 30% of the explosive energy is spent in rock mass fragmentation, and more than 70% is wasted and causes side effects such as back break, fly rock, and blast-induced ground vibration [1,2,3]. Among these blast-induced side effects, blast-induced ground vibration is considered as the most common, important and dangerous side effects for nearby structures, human life and the environment [4,5,6]. Therefore, establishing the prediction methods to predict and analyze the blast-induced ground vibration and then to optimize the blasting design and building structure by using that model is of great significance to decrease the damage caused by blast-induced ground vibration.
Blast-induced ground vibration can be described by using peak particle velocity (PPV) and frequency. According to previous literature [7], the peak particle velocity is normally considered to be more important than frequency and always selected to describe the blast-induced ground vibration.
After reviewing the previous literature, some empirical models [8,9,10,11] were proposed and most of them predict PPV by using the distance between blast blocks to monitor location and max charge per delay. Although some studies show these empirical models can predict PPV in some mines with high precision, there are also some research works [5,12,13] that show these models are not sufficient for all field sites.
In recent years, artificial intelligence (AI) technology has been widely developed and applied in many areas for solving special problems such as the prediction of blast-induced rock movement [14], flyrock distance [15,16], overbreak [17,18], air overpressure [19,20], rockburst [21,22,23], mechanical properties of material [24,25,26,27,28,29], tunnel convergence [30] and tunnel boring machine penetration rate [31]. In practice, AI technology is also applied to predict blast-induced ground vibration and yield high prediction precision [32,33,34]. For example, Zhang et al. [2] combined the particle swarm optimization (PSO) algorithm and extreme gradient boosting machine (XGBoost) for peak particle velocity prediction. In his paper, the PSO was utilized to search the optimal hyperparameters of XGBoost and a promising result was obtained. Shang et al. [35] proposed a hybrid model that is combined with the firefly algorithm (FFA) and an artificial neural network (ANN). The prediction performance of FFA-ANN was compared with classification and regression tree (CART), support vector machine (SVM), and k-nearest neighbor (KNN) models, and the FFA-ANN model provided the best performance. Azimi [36] utilized the genetic algorithm (GA) to optimize the ANN, and have developed an efficient model for PPV prediction after comparing the performance of the neuro-fuzzy inference system by using 70 blast vibration datasets. In 2009, Khandelwal and Singh [37] developed an ANN model for blast-induced ground vibration prediction, and the prediction results of the ANN model is highly encouraging. Bui et al. [38] tested the feasibility of the FCM-QRNN (fuzzy C-means clustering and quantile regression neural network) model and found that the model has higher accuracy than other soft computing models such as ANN and QRNN. Nguyen et al. [39] combined the k-means clustering algorithm (HKM) and ANN and utilized that model to predict blast-induced ground vibration. In this model, the input datasets should be clustered first by the HKM algorithm, and the result obtained will be used to train the ANN model. In addition to these studies, the blast-induced ground vibration in some famous mines such as the Nui Beo open-cast mine [7], Miduk copper mine [40] and Gol-E-Gohar iron ore mine [41] were studied by using the artificial intelligence technology in previous literature. It can be found that the artificial intelligence technology shows strong prediction ability in blast-induced ground vibration prediction, and research into new AI technology and the new prediction model is necessary and meaningful for hazard control.
In this study, AI technology was tested to predict the blast-induced ground vibration of Tonglvshan open-cast mine. According to the no free lunch theorem, if the performance of algorithm A is better than algorithm B in this problem, there must be other problems that algorithm B has better performance at resolving. Hence, although a series of prediction models such as HKM-ANN [39], MLPNN (multilayer perceptron neural network) [42] and CART [43] were utilized in some mines, the proposed algorithms are far from solving all possible problems and being suited for all field sites. As far as the authors know, the combination of the Harris hawks optimization algorithm (HHO) and random forest (RF) has not been tried in predicting blast-induced ground vibration. In this paper, a new hybrid model namely HHO-RF is proposed to predict and control the PPV value of Tonglvshan open-cast mine. Considering the uncertainty of blasting parameters in field sites, a Monte Carlo process was considered as a stochastic approach to analyze the probability distribution with various combinations of blasting parameters for hazard control. Eventually, a sensitivity investigation was carried out to measure the impact of various parameters on peak particle velocity.
After analyzing, engineers can use the accurate prediction model proposed in this study to predict and evaluate the PPV value caused by blast operation before a blast, which is helpful for optimizing blast design and reducing disputes between mines and surrounding residents. In addition, the security department can stipulate measures for protecting the buildings and industrial facilities based on the probability distribution of PPV because all the probable combinations of variables will be examined. Last, the analysis method and research results in this paper can provide a reference for controlling blast-induced ground vibration in similar mines.
2. Materials and Methods
2.1. Data Set
To achieve the objectives of this study, blast-induced ground vibration of Tonglvshan open-cast mine was monitored by using an accurate blast-induced ground vibration monitoring machine (EXP3850-3) in Hubei province, China (see Figure 1). That mine is situated 3 km west of Daye city, and the drilling and blasting technique is utilized for rock fragmentation. In addition, the geological structure of the Tonglvshan open-cast mine is a skarn deposit, and the ore deposit is mainly composed of granodiorite porphyry, sodium porphyry, skarn, marble, copper-bearing skarn, copper-iron ore, etc. Meanwhile, the value of Protodyakonov impact strength coefficient of different rock type varies greatly, which leads to the significant difficulty of accurate peak particle velocity prediction.
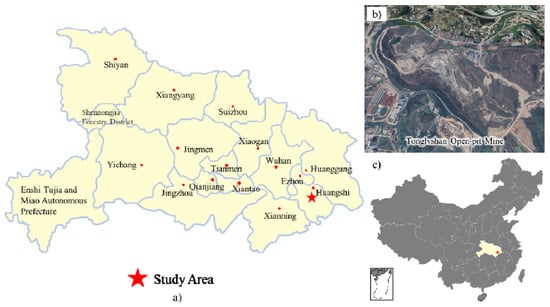
Figure 1.
Tonglvshan open-cast mine: (a) location of mine in Hubei province; (b) a view of the mine (Resourced from Google Earth); (c) location of the mine in China.
A total number of 137 blasting operations were analyzed, and 8 variables including peak particle velocity (PPV), Protodyakonov impact strength coefficient (f), max charge per delay (Qmax), total charge (Qtotal), delay time of detonator (T), burden of the first row (B), horizontal (DH) and vertical (DV) distance between blast block and monitoring station were collected. After analyzing by using the box plot, 20 outliers were moved from the database to improve the model performance [44] and the remaining 117 datasets were utilized in this study (see Table 1).

Table 1.
Some of the datasets used for peak particle velocity (PPV) prediction.
2.2. Random Forest (RF) Model
The RF model was invented by Breiman [45]. In this model, randomly selected input variables and datasets were utilized to train the classification or regression model, and a large number of decision trees were developed and combined to make a final decision. Limited by the article length, the detailed introduction was not shown here but readers can find it in the published papers of Breiman [45] and Liaw and Wiener [46].
2.3. Harris Hawks Optimization (HHO) Algorithm
As an important branch of artificial intelligence, the random forest model has been widely used in many areas such as civil areas [47], energy areas [48] and medical areas [49]. Meanwhile, previous literature [50] shows that the using of meta-heuristic optimization technique can significantly improve prediction performance by search the optimal combination of prediction models. In fact, many meta-heuristic optimization techniques are inspired by natural phenomena and have widely applied in mining [51], healthcare [52,53,54,55], finance [56] and query optimization problems [57] with good optimization performance. Hence, a nature-inspired algorithm (the Harris hawks optimization (HHO) algorithm) was tested in this paper because of its superior performance compared with the other 11 methods through 29 unconstrained benchmark problems and 6 constrained engineering design tasks carried out by Heidari et al. [58].
The Harris hawk (also called Parabuteo unicinctus), a well-known bird in the southern half of Arizona, USA, often be considered as a truly cooperative predator because these birds usually discover, attack and share prey with other family members [58,59] (Figure 2). Inspired by the social behavior of Harris hawks, the HHO algorithm was proposed for solving optimization problems with the proper formulation. The HHO algorithm includes three phases: the exploration phase, the transition from exploration to exploitation and exploitation phase. After reviewing the study of Heidari et al. [58], a brief introduction of the HHO algorithm was performed here.
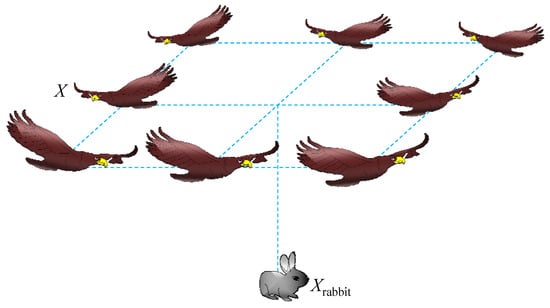
Figure 2.
Harris hawks optimization (HHO) algorithm.
(1) Exploration phase:
In this part, the Harris hawks try to discover, search and find the prey in the desert site by using eyes. The position of a Harris hawk in the mathematical model means the closest position to the prey and can be obtained by using the following equations [58]:
where X(t + 1) and X(t) are the positions of Harris hawk in iteration t + 1 and t, respectively. Xrabbit(t) and Xrand(t) are the position of prey in the t iteration and randomly selected Harris hawk in the current population. r1, r2, r3, r4, q are the random values, UB and LB are the upper and lower bounds, respectively.
Besides these parameters, Xm(t) is the mean position of Harris hawks.
where N is the number of Harris hawks; Xi(t) is the position of each hawk in iteration t.
(2) The transition from exploration to exploitation:
According to the escaping energy of prey, the behavior of Harris hawks in the HHO algorithm will be changed. For example, the exploitation behavior will be performed when the escaping energy is less than 1, and the Harris hawks continue to search for prey when escaping energy is greater than or equal to 1. In that model, the escaping energy (E) can be obtained as [58]:
where E0 is the initial escaping energy, and E is the escaping energy in iteration t, and T is the maximum number of iterations.
(3) Exploitation phase
After searching for prey in the desert site, a Harris hawk will attempt to attack the prey and the prey will correspondingly attempt to escape the surprise pounce. According to the different escaping behavior of the prey, several possible strategies may be performed during the exploitation phase. To evaluate the possibility of successfully escaping, r, a random value range from 0 to 1, was utilized in this algorithm, and four situations were divided with different range of r value and E value.
(a)
In this situation, the prey still has enough energy, so the Harris hawks hope to exhaust it and then perform the attack. The following equations can be used to calculate the position of the Harris hawk in iteration t + 1 [58].
where r5 is a random value range from 0 to 1.
(b)
In this situation, the prey is tired and the Harris hawks can perform the surprise pounce. The position can be updated using the following equation [58]:
(c)
In this situation, the prey still has enough energy and has a low chance of successfully escaping. The position of Harris hawks can be updated by the following rules [58]:
The hawks can dive according to the following rule:
Subjected to
here, is Gamma function; β is 1.5; S is a random vector; u and v are the random value range from 0 to 1.
After calculation, the final position can be shown as follows:
(d)
In this situation, the prey is exhausted and the escaping chance is low. Therefore, the Harris hawks can perform the hard siege behavior and can be modeled as follows [58]:
where
here, LF is levy flight function.
2.4. HHO-RF Model
The procedure of developing an HHO-RF model is shown in Figure 3. Firstly, the collected database should be divided into training datasets and testing datasets with a ratio of 80% and 20% [60,61,62,63]. Then the Harris hawks optimization algorithm will be used to search the best combination of the number of variables used to grow each try (mtry) and the number of trees (ntree) in the RF model, and the final RF model will be established. Finally, the testing datasets can be used to evaluate the RF model by using some performance metrics such as correlation coefficient (R2), mean absolute error (MAE) and root mean square error (RMSE).
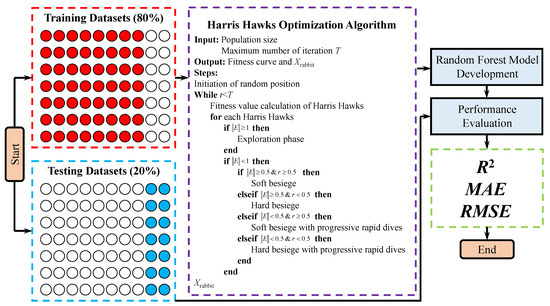
Figure 3.
Procedure for developing a Harris hawks optimization-random forest (HHO-RF) model.
2.5. Performance Metrics
In this section, an RF model and a HHO-RF model were developed to establish a stable and accurate relationship between the input variables (f, B, T, DV, DH, Qtotal, Qmax) and output variable (PPV). To evaluate the predictive performance, three performance indices including RMSE, R2 and MAE, were introduced and utilized here [64,65,66,67,68].
here xi, f(xi) and n are the actual PPV value, predicted PPV value and number of input datasets, respectively.
2.6. Monte Carlo Simulation
The Monte Carlo (MC) simulation method is a typical sampling technique in stochastic modeling and has the ability to realize the risk and uncertainty in many problems such as financial cost and purchase decision [69]. Monte Carlo simulation can achieve two important functions; the first is the quantitative investigation of uncertainty and variation of problems regarding risk; and the second is the investigation of parameters affecting variation and uncertainty and their percentage [70]. In the calculation process, the repeated sampling method was utilized to create a large number of combinations of input variables, then these input variables will be calculated by using the HHO-RF model developed. Finally, statistical analysis will be carried out for obtaining the probability distribution of PPV values (see Figure 4).
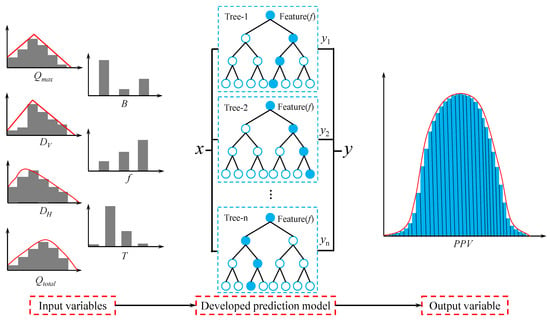
Figure 4.
Monte Carlo (MC) simulation model.
In recent years, the MC simulation approach has been utilized to solve many engineering problems such as flyrock assessment [70], backbreak analysis [71], compression coefficient prediction [72], blasting fragmentation [73] and drilling rate evaluation [74]. In the following section, the MC simulation method will be utilized to analyze the probability distribution of blast-induced ground vibration caused by the blasting operation in Tonglvshan open-cast mine.
3. Results and Discussion
3.1. Results of RF Model
In order to predict the PPV by using the RF model, two typical model parameters including mtry and ntree should be determined first. Hence a parameter investigation was carried out by using the grid search method with mtry of 1 to 7 and ntree of 2000, and 7 was selected as the optimal mtry value (Figure 5a). In addition, the parameter investigation with mtry of 7 and ntree of 1 to 2000 show that the prediction performance will vary within a range and that range will be stable when ntree = 2000. So 2000 was selected as the optimal value of ntree (Figure 5b). After optimal RF model development, the testing datasets were inputted into the established RF model for prediction, the prediction performance shows the prediction performance with using the training datasets with R2 of 0.92, MAE of 0.19 and RMSE of 0.27 and using the testing datasets with R2 of 0.90, MAE of 0.35 and RMSE of 0.40 (see Figure 6).
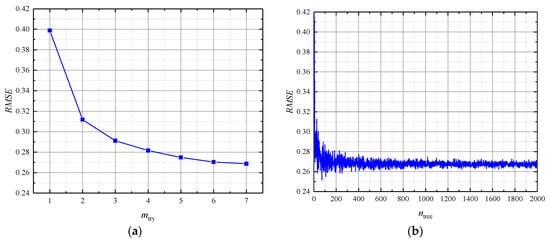
Figure 5.
Optimization of hyperparameters of RF model: (a) ntree = 2000 and various mtry; (b) mtry = 7 and various ntree.

Figure 6.
Peak particle velocity (PPV) prediction by RF model: (a) training datasets; (b) testing datasets.
3.2. Results of HHO-RF Model
To obtain the best combination of mtry and ntree, 8 HHO-RF models with the maximum number of iterations of 500 and variable numbers of Harris hawks ranging from 20 to 250 were developed. The fitness curve of these HHO-RF models checked by RMSE can be found in Figure 7. As shown in Figure 7, there is no significant change after 350 iterations. But the escaping energy of the rabbit has a relationship with the maximum number of iterations in the HHO algorithm according to Equation (3). The change of the maximum number of iterations may affect the optimization performance of the HHO algorithm. Hence, 500 and 150 were chosen as the best parameter combination of HHO-RF modeling in view of the excellent prediction performance.
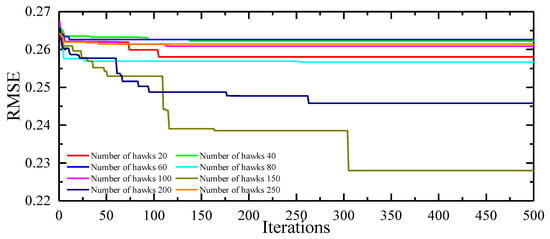
Figure 7.
The fitness curve of the HHO-RF model with various numbers of Harris hawks and 500 iterations.
As shown in Figure 8, the established HHO-RF model can predict and evaluate the PPV with R2 of 0.94, MAE of 0.17 and RMSE of 0.23 for training datasets and R2 of 0.94, MAE of 0.29 and RMSE of 0.34 for testing datasets. After comparing the prediction performance obtained by the RF model and HHO-RF model, the comparison results show that the HHO-RF model can be used to predict the PPV with a higher level of prediction accuracy.
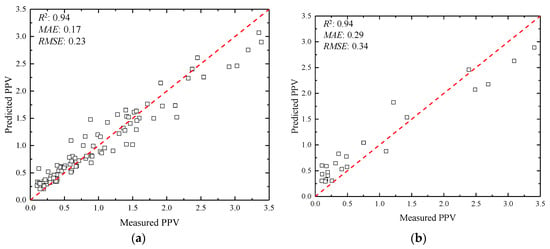
Figure 8.
PPV prediction by HHO-RF model: (a) training datasets; (b) testing datasets.
3.3. Results of Monte Carlo Simulation
As mentioned in the previous sections, an RF model and a HHO-RF model were developed for peak particle velocity prediction, and the results obtained show that the HHO-RF model can provide more accurate prediction performance. Hence, the HHO-RF model was used here for Monte Carlo simulation, and four input variables including DV, DH, Qtotal, and Qmax were considered as the continuous probability distributions (CPD) and two input variables including T and B were considered as the discrete probability distribution (DPD) (see Table 2).

Table 2.
Probability distribution functions of seven input variables.
After inputting the probability distribution functions into the MC simulation, a large number of combinations should be randomly selected by using the sampling method. In this regard, two sampling methods including Latin hypercube sampling and simple random sampling are recommended. According to the previous literature, the Latin hypercube sampling method is much better than the simple random sampling method because it can achieve the same calculation performance with fewer simulations. It should be noted that the relationship between input variables should be considered in the MC simulation to guarantee the consistency of input variable combinations in MC simulation and monitoring databases.
In order to achieve a high level of simulation and probability distribution, 20,000 simulation runs were performed by using the Latin hypercube sampling method, and the relationship of 20,000 randomly selected combinations can be found in Figure 9. It is found that the correlations between input values in MC simulation and blast-induced ground vibration database agree well, so the 20,000 simulation runs developed can be used to analyze the probability distribution of blast-induced ground vibration.
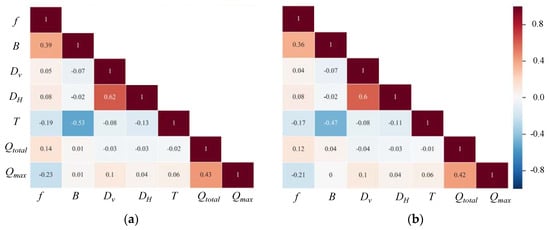
Figure 9.
Correlation coefficient of the seven input variables: (a) blast-induced ground vibration database; (b) Monte Carlo simulation.
After analyzing, the probability distribution of blast-induced ground vibration is shown in Figure 10. As can be seen, the mean value of PPV in MC simulation results is determined as 0.98 cm/s while the mean value of PPV is 1.0 cm/s in the database, and the PPV value does not exceed 1.95 cm/s with a probability of 90%. Moreover, the measured PPV values, the predicted PPV values by the HHO-RF model, and the Monte Carlo simulation results are also shown in Figure 10. It can be observed that these three cumulative frequency curves are closely related and the curve performed by the MC simulation is smoother. It is also found that these cumulative frequency curves still have some differences, and the differences may be due to the small amount of the monitoring database being too small and the error of the prediction model.
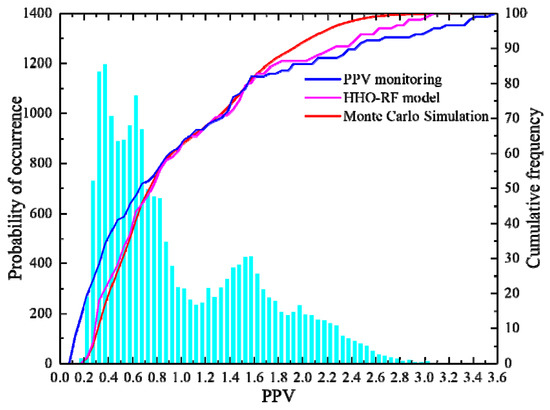
Figure 10.
Statistical results of the blast-induced ground vibration obtained from MC simulation.
After obtaining the probability distribution of PPV values, the engineer can adjust the blasting parameters such as the max charge per delay and burden to control the peak particle velocity and minimize the damage upon the building structure. Moreover, for a case that needs special protection, the engineer is advised to assume the most dangerous situation with the probability of 0.001% to arrange safeguards.
3.4. Variable Importance
To analyze the impact of various blasting parameters on blast-induced ground vibration, a sensitivity analysis was performed to measure the impact of various parameters on peak particle velocity. In this section, with the help of SPSS (Statistical Product and Service Solutions), the relationships between two variables can be calculated with the range of −1 to +1 after sorting the database and comparing the rank of each value. Figure 11 shows the impact of these input variables on PPV values both in blast-induced ground vibration database and MC simulation results. As shown, the DH with the correlation coefficient of −0.795 and −0.563 is the most sensitive variable, and the input variables can be divided into controllable parameters and uncontrollable parameters. The controllable parameters can be listed in descending order as DH, DV, Qtotal, Qmax, T and B in the PPV monitoring database and DH, DV, Qtotal, Qmax, B, T in MC simulation results. It is found that there is a difference in the ranking of T and B in these two databases. The reason may be that the PPV monitoring database is too small and the ranking order obtained from the MC simulation results is more reliable according to the big data principle. Meanwhile, the roughly same order of input variables demonstrates that the Monte Carlo simulation is reliable.
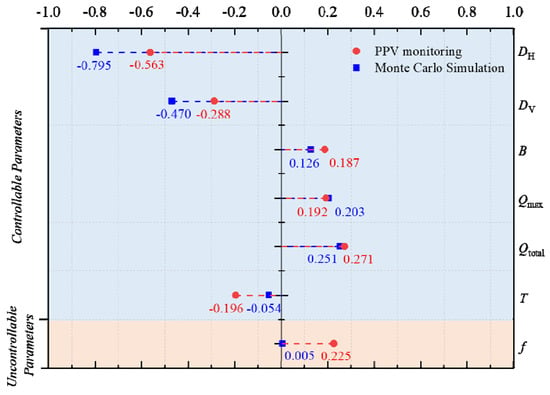
Figure 11.
Sensitivity analysis results.
3.5. Limitations
Four limitations can be found in this paper and need to be considered in the future study. First, only 137 datasets were collected and utilized to develop the RF model and HHO-RF model, a larger database should be established for evaluating, improving model reliability and obtaining more accurate prediction performance. Then, only 8 variables including PPV, f, Qmax, Qtotal, T, B, DH, and DV were collected, more qualitative parameters such as the detonation velocity of the explosive may have an impact on the PPV prediction and should be considered in future investigations. Third, although the HHO algorithm shows good results in improving the prediction performance of the RF model, there are many optimization algorithms such as the GA, grey wolf optimization algorithm (GWO), artificial bee colony algorithm (ABC) and cuckoo search algorithm (CS) that can also be tried to select the hyperparameters of the random forest algorithm and no prediction performance comparison was carried out in this paper for these optimization algorithms. Finally, as a typical character of the machine learning method, the prediction performance is dependent on the fitness of the collected database and the complex relationship between prediction results and input variables is difficult to describe due to its “black box” nature.
4. Conclusions
This study aims to propose a new hybrid model for accurate blast-induced ground vibration prediction and use the stochastic modeling approach to obtain the probability distribution. At first, a simple RF model and a new proposed HHO-RF model were developed and utilized to predict the peak particle velocity; the prediction performance showed by HHO-RF model is much better than the prediction performance yield by RF model. In addition, the Monte Carlo simulation showed that the mean PPV value of the MC simulation results is 0.98 cm/s and the PPV value does not exceed 1.95 cm/s with the probability of 90%. Finally, the results of the sensitivity analysis showed that the DH is the most influential factor on blast-induced ground vibration. Based on the high-precision prediction model developed and the results of Monte Carlo simulation obtained, the engineers of Tonglvshan open-cast mine can accurately predict blast-induced ground vibration and ameliorate blast design before a blast operation, which is beneficial for controlling the blast’s impact on nearby structures, human life, and the environment.
Author Contributions
Conceptualization, Z.Y. and J.Z.; methodology, Z.Y. and X.Q.; formal analysis, Z.Y.; data curation, X.Z.; writing—review and editing, Z.Y.; supervision, X.C.; funding acquisition, Z.Y., X.S. and J.Z. All authors have read and agreed to the published version of the manuscript.
Funding
This research was funded by National Natural Science Foundation Project of China (Grant Nos. 51874350 and 41807259), the National Key R&D Program of China (2017YFC0602902), the Fundamental Research Funds for the Central Universities of Central South University (2018zzts217), the Innovation-Driven Project of Central South University (2020CX040).
Conflicts of Interest
The authors declare no conflict of interest.
References
- Hasanipanah, M.; Monjezi, M.; Shahnazar, A.; Jahed Armaghani, D.; Farazmand, A. Feasibility of indirect determination of blast induced ground vibration based on support vector machine. Meas. J. Int. Meas. Confed. 2015, 75, 289–297. [Google Scholar] [CrossRef]
- Zhang, X.; Nguyen, H.; Bui, X.N.; Tran, Q.H.; Nguyen, D.A.; Bui, D.T.; Moayedi, H. Novel Soft Computing Model for Predicting Blast-Induced Ground Vibration in Open-Pit Mines Based on Particle Swarm Optimization and XGBoost. Nat. Resour. Res. 2019, 1–11. [Google Scholar] [CrossRef]
- Nguyen, H.; Bui, X.-N.; Tran, Q.-H.; Le, T.-Q.; Do, N.-H.; Hoa, L.T.T. Evaluating and predicting blast-induced ground vibration in open-cast mine using ANN: A case study in Vietnam. SN Appl. Sci. 2019, 1, 125. [Google Scholar] [CrossRef]
- Dong, L.; Li, X.; Xu, M.; Li, Q. Comparisons of random forest and Support Vector Machine for predicting blasting vibration characteristic parameters. Procedia Eng. 2011, 26, 1772–1781. [Google Scholar]
- Monjezi, M.; Ghafurikalajahi, M.; Bahrami, A. Prediction of blast-induced ground vibration using artificial neural networks. Tunn. Undergr. Sp. Technol. 2011, 26, 46–50. [Google Scholar] [CrossRef]
- Gou, Y.; Shi, X.; Zhou, J.; Qiu, X.; Chen, X.; Huo, X. Attenuation assessment of blast-induced vibrations derived from an underground mine. Int. J. Rock Mech. Min. Sci. 2020, 127, 104220. [Google Scholar] [CrossRef]
- Nguyen, H.; Bui, X.N.; Tran, Q.H.; Mai, N.L. A new soft computing model for estimating and controlling blast-produced ground vibration based on Hierarchical K-means clustering and Cubist algorithms. Appl. Soft Comput. J. 2019, 77, 376–386. [Google Scholar] [CrossRef]
- Duvall, W.I.; Petkof, B. Spherical Propagation of Explosion-Generated Strain Pulses in Rock; US Department of the Interior, Bureau of Mines: Washington, DC, USA, 1959.
- Davies, B.; Farmer, I.W.; Attewell, P.B. Ground vibration from shallow sub-surface blasts. Engineer 1964, 217, 553–559. [Google Scholar]
- Langefors, U.; Kihlström, B. The Modern Technique of Rock Blasting; Wiley: Hoboken, NJ, USA, 1963; ISBN 9780470992821. [Google Scholar]
- Pal Roy, P. Putting ground vibration predictions into practice. Colliery Guard. Redhill 1993, 241, 63–67. [Google Scholar]
- Hajihassani, M.; Jahed Armaghani, D.; Marto, A.; Tonnizam Mohamad, E. Vibrations au sol prédiction dans quarry dynamitage à travers un réseau neural artificiel optimisé par une concurrence impérialiste algorithme. Bull. Eng. Geol. Environ. 2015, 74, 873–886. [Google Scholar] [CrossRef]
- Ghasemi, E.; Ataei, M.; Hashemolhosseini, H. Development of a fuzzy model for predicting ground vibration caused by rock blasting in surface mining. J. Vib. Control 2013, 19, 755–770. [Google Scholar] [CrossRef]
- Yu, Z.; Shi, X.; Zhou, J.; Chen, X.; Miao, X.; Teng, B.; Ipangelwa, T. Prediction of Blast-Induced Rock Movement During Bench Blasting: Use of Gray Wolf Optimizer and Support Vector Regression. Nat. Resour. Res. 2019. [Google Scholar] [CrossRef]
- Koopialipoor, M.; Fallah, A.; Armaghani, D.J.; Azizi, A.; Mohamad, E.T. Three hybrid intelligent models in estimating flyrock distance resulting from blasting. Eng. Comput. 2019, 35, 243–256. [Google Scholar] [CrossRef]
- Armaghani, D.J.; Mahdiyar, A.; Hasanipanah, M.; Faradonbeh, R.S.; Khandelwal, M.; Amnieh, H.B. Risk Assessment and Prediction of Flyrock Distance by Combined Multiple Regression Analysis and Monte Carlo Simulation of Quarry Blasting. Rock Mech. Rock Eng. 2016, 49, 3631–3641. [Google Scholar] [CrossRef]
- Koopialipoor, M.; Ghaleini, E.N.; Tootoonchi, H.; Jahed Armaghani, D.; Haghighi, M.; Hedayat, A. Developing a new intelligent technique to predict overbreak in tunnels using an artificial bee colony-based ANN. Environ. Earth Sci. 2019, 78, 165. [Google Scholar] [CrossRef]
- Koopialipoor, M.; Jahed Armaghani, D.; Haghighi, M.; Ghaleini, E.N. A neuro-genetic predictive model to approximate overbreak induced by drilling and blasting operation in tunnels. Bull. Eng. Geol. Environ. 2019, 78, 981–990. [Google Scholar] [CrossRef]
- Nguyen, H.; Bui, X.N. Predicting Blast-Induced Air Overpressure: A Robust Artificial Intelligence System Based on Artificial Neural Networks and Random Forest. Nat. Resour. Res. 2019, 28, 893–907. [Google Scholar] [CrossRef]
- Jahed Armaghani, D.; Hasanipanah, M.; Mahdiyar, A.; Abd Majid, M.Z.; Bakhshandeh Amnieh, H.; Tahir, M.M.D. Airblast prediction through a hybrid genetic algorithm-ANN model. Neural Comput. Appl. 2018, 29, 619–629. [Google Scholar] [CrossRef]
- Zhou, J.; Li, X.; Mitri, H.S. Evaluation method of rockburst: State-of-the-art literature review. Tunn. Undergr. Sp. Technol. 2018, 81, 632–659. [Google Scholar] [CrossRef]
- Zhou, J.; Li, X.; Mitri, H.S. Classification of rockburst in underground projects: Comparison of ten supervised learning methods. J. Comput. Civ. Eng. 2016, 30, 4016003. [Google Scholar] [CrossRef]
- Zhou, J.; Shi, X.; Huang, R.; Qiu, X.; Chen, C. Feasibility of stochastic gradient boosting approach for predicting rockburst damage in burst-prone mines. Trans. Nonferrous Met. Soc. China Engl. Ed. 2016, 26, 1938–1945. [Google Scholar] [CrossRef]
- Asteris, P.G.; Armaghani, D.J.; Hatzigeorgiou, G.D.; Karayannis, C.G.; Pilakoutas, K. Predicting the shear strength of reinforced concrete beams using artificial neural networks. Comput. Concr. 2019, 24, 469–488. [Google Scholar]
- Plevris, V.; Asteris, P.G. Modeling of masonry failure surface under biaxial compressive stress using Neural Networks. Constr. Build. Mater. 2014, 55, 447–461. [Google Scholar] [CrossRef]
- Asteris, P.; Roussis, P.; Douvika, M. Feed-Forward Neural Network Prediction of the Mechanical Properties of Sandcrete Materials. Sensors 2017, 17, 1344. [Google Scholar] [CrossRef]
- Asteris, P.G.; Apostolopoulou, M.; Skentou, A.D.; Moropoulou, A. Application of artificial neural networks for the prediction of the compressive strength of cement-based mortars. Comput. Concr. 2019, 24, 329–345. [Google Scholar]
- Apostolopoulou, M.; Armaghani, D.J.; Bakolas, A.; Douvika, M.G.; Moropoulou, A.; Asteris, P.G. Compressive strength of natural hydraulic lime mortars using soft computing techniques. Procedia Struct. Integr. 2019, 17, 914–923. [Google Scholar] [CrossRef]
- Huang, L.; Asteris, P.G.; Koopialipoor, M.; Armaghani, D.J.; Tahir, M.M. Invasive Weed Optimization Technique-Based ANN to the Prediction of Rock Tensile Strength. Appl. Sci. 2019, 9, 5372. [Google Scholar] [CrossRef]
- Hajihassani, M.; Abdullah, S.S.; Asteris, P.G.; Armaghani, D.J. A Gene Expression Programming Model for Predicting Tunnel Convergence. Appl. Sci. 2019, 9, 4650. [Google Scholar] [CrossRef]
- Xu, H.; Zhou, J.; Asteris, P.G.; Jahed Armaghani, D.; Tahir, M.M. Supervised Machine Learning Techniques to the Prediction of Tunnel Boring Machine Penetration Rate. Appl. Sci. 2019, 9, 3715. [Google Scholar] [CrossRef]
- Mohammadnejad, M.; Gholami, R.; Ramezanzadeh, A.; Jalali, M.E. Prediction of blast-induced vibrations in limestone quarries using Support Vector Machine. JVC/J. Vib. Control 2012, 18, 1322–1329. [Google Scholar] [CrossRef]
- Rajabi, A.M.; Vafaee, A. Prediction of blast-induced ground vibration using empirical models and artificial neural network (Bakhtiari Dam access tunnel, as a case study). J. Vib. Control 2019. [Google Scholar] [CrossRef]
- Xue, X.; Yang, X. Predicting blast-induced ground vibration using general regression neural network. JVC/J. Vib. Control 2014, 20, 1512–1519. [Google Scholar] [CrossRef]
- Shang, Y.; Nguyen, H.; Bui, X.N.; Tran, Q.H.; Moayedi, H. A Novel Artificial Intelligence Approach to Predict Blast-Induced Ground Vibration in Open-Pit Mines Based on the Firefly Algorithm and Artificial Neural Network. Nat. Resour. Res. 2019, 1–15. [Google Scholar] [CrossRef]
- Azimi, Y.; Khoshrou, S.H.; Osanloo, M. Prediction of blast induced ground vibration (BIGV) of quarry mining using hybrid genetic algorithm optimized artificial neural network. Meas. J. Int. Meas. Confed. 2019, 147, 106874. [Google Scholar] [CrossRef]
- Khandelwal, M.; Singh, T.N. Prediction of blast-induced ground vibration using artificial neural network. Int. J. Rock Mech. Min. Sci. 2009, 46, 1214–1222. [Google Scholar] [CrossRef]
- Bui, X.N.; Choi, Y.; Atrushkevich, V.; Nguyen, H.; Tran, Q.H.; Long, N.Q.; Hoang, H.T. Prediction of Blast-Induced Ground Vibration Intensity in Open-Pit Mines Using Unmanned Aerial Vehicle and a Novel Intelligence System. Nat. Resour. Res. 2019. [Google Scholar] [CrossRef]
- Nguyen, H.; Drebenstedt, C.; Bui, X.N.; Bui, D.T. Prediction of Blast-Induced Ground Vibration in an Open-Pit Mine by a Novel Hybrid Model Based on Clustering and Artificial Neural Network. Nat. Resour. Res. 2019. [Google Scholar] [CrossRef]
- Taheri, K.; Hasanipanah, M.; Golzar, S.B.; Majid, M.Z.A. A hybrid artificial bee colony algorithm-artificial neural network for forecasting the blast-produced ground vibration. Eng. Comput. 2017, 33, 689–700. [Google Scholar] [CrossRef]
- Saadat, M.; Khandelwal, M.; Monjezi, M. An ANN-based approach to predict blast-induced ground vibration of Gol-E-Gohar iron ore mine, Iran. J. Rock Mech. Geotech. Eng. 2014, 6, 67–76. [Google Scholar] [CrossRef]
- Monjezi, M.; Ahmadi, M.; Sheikhan, M.; Bahrami, A.; Salimi, A.R. Predicting blast-induced ground vibration using various types of neural networks. Soil Dyn. Earthq. Eng. 2010, 30, 1233–1236. [Google Scholar] [CrossRef]
- Khandelwal, M.; Armaghani, D.J.; Faradonbeh, R.S.; Yellishetty, M.; Majid, M.Z.A.; Monjezi, M. Classification and regression tree technique in estimating peak particle velocity caused by blasting. Eng. Comput. 2017, 33, 45–53. [Google Scholar] [CrossRef]
- Lin, Y.; Zhou, K.; Li, J. Prediction of slope stability using four supervised learning methods. IEEE Access 2018, 6, 31169–31179. [Google Scholar] [CrossRef]
- Breiman, L. Random forests. Mach. Learn. 2001, 45, 5–32. [Google Scholar] [CrossRef]
- Liaw, A.; Wiener, M. Classification and Regression by randomForest. R News 2003, 3, 18–22. [Google Scholar]
- Chen, W.; Xie, X.; Wang, J.; Pradhan, B.; Hong, H.; Bui, D.T.; Duan, Z.; Ma, J. A comparative study of logistic model tree, random forest, and classification and regression tree models for spatial prediction of landslide susceptibility. Catena 2017, 151, 147–160. [Google Scholar] [CrossRef]
- Ahmad, M.W.; Mourshed, M.; Rezgui, Y. Trees vs Neurons: Comparison between random forest and ANN for high-resolution prediction of building energy consumption. Energy Build. 2017, 147, 77–89. [Google Scholar] [CrossRef]
- Shaikhina, T.; Lowe, D.; Daga, S.; Briggs, D.; Higgins, R.; Khovanova, N. Decision tree and random forest models for outcome prediction in antibody incompatible kidney transplantation. Biomed. Signal Process. Control 2019, 52, 456–462. [Google Scholar] [CrossRef]
- Bian, X.Q.; Zhang, L.; Du, Z.M.; Chen, J.; Zhang, J.Y. Prediction of sulfur solubility in supercritical sour gases using grey wolf optimizer-based support vector machine. J. Mol. Liq. 2018, 261, 431–438. [Google Scholar] [CrossRef]
- Mojtahedi, S.F.F.; Ebtehaj, I.; Hasanipanah, M.; Bonakdari, H.; Amnieh, H.B. Proposing a novel hybrid intelligent model for the simulation of particle size distribution resulting from blasting. Eng. Comput. 2019, 35, 47–56. [Google Scholar] [CrossRef]
- Sharma, M.; Singh, G.; Singh, R. Stark Assessment of Lifestyle Based Human Disorders Using Data Mining Based Learning Techniques. IRBM 2017, 38, 305–324. [Google Scholar] [CrossRef]
- Gautam, R.; Kaur, P.; Sharma, M. A comprehensive review on nature inspired computing algorithms for the diagnosis of chronic disorders in human beings. Prog. Artif. Intell. 2019, 8, 401–424. [Google Scholar] [CrossRef]
- Dey, N.; Ashour, A.; Bhattacharyya, S. Applied Nature-Inspired Computing Algorithms and Case Studies. In Springer Tracts in Nature-Inspired Computing; Dey, N., Ashour, A.S., Bhattacharyya, S., Eds.; Springer: Singapore, 2020; ISBN 9789811392627. [Google Scholar]
- Ponce, H.; González-Mora, G.; Morales-Olvera, E.; Souza, P. Development of fast and reliable nature-inspired computing for supervised learning in high-dimensional data. In Studies in Computational Intelligence; Springer: New York, NY, USA, 2020; Volume 871, pp. 109–138. [Google Scholar]
- Davies, I.N.; Anireh, V.I.E.; Bennett, E.O. Stock Market Analysis and Prediction System Using Fuzzy Logic Type-2. J. Adv. Math. Comput. Sci. 2019, 2, 33–46. [Google Scholar]
- Sharma, S.; Singh, G.; Singh, D. Role and Performance of Different Traditional Classification and Nature-Inspired Computing Techniques in Major Research Areas. ICST Trans. Scalable Inf. Syst. 2019, 6, 158419. [Google Scholar] [CrossRef]
- Heidari, A.A.; Mirjalili, S.; Faris, H.; Aljarah, I.; Mafarja, M.; Chen, H. Harris hawks optimization: Algorithm and applications. Futur. Gener. Comput. Syst. 2019, 97, 849–872. [Google Scholar] [CrossRef]
- Bednarz, J.C. Cooperative hunting in Harris’ hawks (Parabuteo unicinctus). Science (80-) 1988, 239, 1525–1527. [Google Scholar] [CrossRef]
- Mahdiyar, A.; Jahed Armaghani, D.; Koopialipoor, M.; Hedayat, A.; Abdullah, A.; Yahya, K. Practical Risk Assessment of Ground Vibrations Resulting from Blasting, Using Gene Expression Programming and Monte Carlo Simulation Techniques. Appl. Sci. 2020, 10, 472. [Google Scholar] [CrossRef]
- Zhou, J.; Li, E.; Wei, H.; Li, C.; Qiao, Q.; Armaghani, D.J. Random forests and cubist algorithms for predicting shear strengths of rockfill materials. Appl. Sci. 2019, 9, 1621. [Google Scholar] [CrossRef]
- Yu, Z.; Shi, X.; Zhou, J.; Rao, D.; Chen, X.; Dong, W.; Miao, X.; Ipangelwa, T. Feasibility of the indirect determination of blast-induced rock movement based on three new hybrid intelligent models. Eng. Comput. 2019. [Google Scholar] [CrossRef]
- Armaghani, D.J.; Koopialipoor, M.; Marto, A.; Yagiz, S. Application of several optimization techniques for estimating TBM advance rate in granitic rocks. J. Rock Mech. Geotech. Eng. 2019, 11, 779–789. [Google Scholar] [CrossRef]
- Hasanipanah, M.; Naderi, R.; Kashir, J.; Noorani, S.A.; Zeynali Aaq Qaleh, A. Prediction of blast-produced ground vibration using particle swarm optimization. Eng. Comput. 2017, 33, 173–179. [Google Scholar] [CrossRef]
- Kaloop, M.R.; Kumar, D.; Samui, P.; Gabr, A.R.; Hu, J.W.; Jin, X.; Roy, B. Particle Swarm Optimization algorithm-Extreme Learning Machine (PSO-ELM) model for predicting resilient modulus of stabilized aggregate bases. Appl. Sci. 2019, 9, 3221. [Google Scholar] [CrossRef]
- Zhang, H.; Zhou, J.; Jahed Armaghani, D.; Tahir, M.M.; Pham, B.T.; Huynh, V. Van A Combination of Feature Selection and Random Forest Techniques to Solve a Problem Related to Blast-Induced Ground Vibration. Appl. Sci. 2020, 10, 869. [Google Scholar] [CrossRef]
- Van Dao, D.; Trinh, S.H.; Ly, H.B.; Pham, B.T. Prediction of compressive strength of geopolymer concrete using entirely steel slag aggregates: Novel hybrid artificial intelligence approaches. Appl. Sci. 2019, 9, 1113. [Google Scholar] [CrossRef]
- Chen, X.; Shi, X.; Zhang, S.; Chen, H.; Zhou, J.; Yu, Z.; Huang, P. Fiber-Reinforced Cemented Paste Backfill: The Effect of Fiber on Strength Properties and Estimation of Strength Using Nonlinear Models. Materials (Basel) 2020, 13, 718. [Google Scholar] [CrossRef]
- Ghasemi, E.; Sari, M.; Ataei, M. Development of an empirical model for predicting the effects of controllable blasting parameters on flyrock distance in surface mines. Int. J. Rock Mech. Min. Sci. 2012, 52, 163–170. [Google Scholar] [CrossRef]
- Zhou, J.; Aghili, N.; Ghaleini, E.N.; Bui, D.T.; Tahir, M.M.; Koopialipoor, M. A Monte Carlo simulation approach for effective assessment of flyrock based on intelligent system of neural network. Eng. Comput. 2019, 1–11. [Google Scholar] [CrossRef]
- Sari, M.; Ghasemi, E.; Ataei, M. Stochastic modeling approach for the evaluation of backbreak due to blasting operations in open pit mines. Rock Mech. Rock Eng. 2014, 47, 771–783. [Google Scholar] [CrossRef]
- Pham, B.T.; Nguyen, M.D.; Van Dao, D.; Prakash, I.; Ly, H.B.; Le, T.T.; Ho, L.S.; Nguyen, K.T.; Ngo, T.Q.; Hoang, V.; et al. Development of artificial intelligence models for the prediction of Compression Coefficient of soil: An application of Monte Carlo sensitivity analysis. Sci. Total Environ. 2019, 679, 172–184. [Google Scholar] [CrossRef]
- Morin, M.A.; Ficarazzo, F. Monte Carlo simulation as a tool to predict blasting fragmentation based on the Kuz-Ram model. Comput. Geosci. 2006, 32, 352–359. [Google Scholar] [CrossRef]
- Ru, Z.; Zhao, H.; Zhu, C. Probabilistic evaluation of drilling rate index based on a least square support vector machine and Monte Carlo simulation. Bull. Eng. Geol. Environ. 2019, 78, 3111–3118. [Google Scholar] [CrossRef]
© 2020 by the authors. Licensee MDPI, Basel, Switzerland. This article is an open access article distributed under the terms and conditions of the Creative Commons Attribution (CC BY) license (http://creativecommons.org/licenses/by/4.0/).