1. Introduction
With the worldwide occurrence of earthquakes, the seismic strengthening of buildings plays an important role in earthquake risk reduction. Many buildings that are designed in accordance with the early codes lack detail in terms of ductility. Therefore, these structures exhibit low-ductility performance and tend to damage or even collapse when subjected to a severe earthquake. However, these types of structures remain valuable after maintenance. Mitigating earthquake loss by strengthening buildings to reduce seismic risk is an economic strategy. The first important step in strengthening structures is to define the extent to which structural performance must be improved. Structures are expected not only to ensure collapse prevention when subjected to a maximum considered earthquake (MCE) but also to possess a certain collapse safety margin after strengthening. The direct quantification of the safety levels of structures has become increasingly important in recent years, especially after the development of performance-based earthquake engineering. A global structural performance index is desired to measure the acceptable collapse safety margin and facilitate an assessment of collapse resistance capacity in future seismic research.
Many seismic strengthening methods have been used to improve the seismic performance of structures. The use of dissipative braces seems promising because such braces provide a supplemental path for earthquake-induced horizontal actions; thus, they enhance the seismic behavior of the frame by adding energy dissipation capacity and stiffness [
1,
2,
3]. Fiber-reinforced polymers are widely used to retrofit existing reinforced concrete (RC) structures. It can improve the global seismic performance of structures by increasing the ductility of the columns and preventing brittle failure mode [
4]. Beschi et al. [
5] used a high-performance, fiber-reinforced concrete jacket to retrofit the RC corner beam–column joint of an existing structure with structural deficiencies. This technique was effective for increasing the shear strength of the joint by approximately 40%. An integrated approach was also proposed to ensure sustainability, safety, and resilience for the renovation of existing RC building stocks; the approach targets energy efficiency and architectural restyling by complementing the building with a technological double skin that supports itself on an independent exoskeleton [
6,
7]. Many other retrofitting methods, such as adding concrete shear walls, enlarging the column section, reinforcing the column with carbon fiber, and installing an energy dissipation damper, have been used [
8]. These strategies mostly characterize the collapse resistance capacity of structures through the bearing capacity of the beam/column components or ductility factor(s). However, these indexes are simple, partial, and unable to express the global collapse performance of structures exactly and directly.
The collapse safety margin evaluation approach based on incremental dynamic analysis (IDA) and vulnerability analysis can be considered a comprehensive tool to reflect the complete seismic performance of structures experiencing minor to severe damage or even collapse. The collapse margin ratio (CMR) was introduced into the FEMA P695 report [
9] and defined as the ratio of the median spectral intensity
IM50% (such as spectral acceleration, as suggested in the report) of the collapse-level ground motions to the spectral acceleration with the MCE level
IMMCE at the fundamental period of structures. CMR is used to quantify the margin between MCE- and collapse-level earthquakes. It is a case-specific factor that reflects all structural design information and varies from one case to another. CMR is not only a technical term; it can be understood and accepted by risk decision-makers or house owners because they can easily, rapidly, and approximately assess the total seismic performance of their buildings in future earthquakes and whether the damage-induced economic loss can be tolerable. CMR has been extensively applied to the collapse resistance assessment of different types of buildings [
10,
11,
12]. To judge whether a structural system meets the performance objective, acceptable CMR values are defined in terms of an acceptably low probability of collapse for MCE ground motions in consideration of the uncertainty in collapse vulnerability in the FEMA P695 report [
1]. These acceptable CMR values are appropriate for judging the collapse safety ability of any structure type and can guide the anticollapse design of building structures [
13,
14].
The differences in theoretical background and seismic precautionary levels between the seismic design codes of China and the United States [
15,
16] may cause a difference in the acceptable collapse probabilities of structures. Hence, the acceptable CMR proposed in FEMA P695 cannot be used to judge the collapse resistance ability of structures that are designed in accordance with China’s code, and an acceptable CMR conforming to the seismic code of China must be proposed.
An acceptable CMR is usually determined on the basis of the acceptable collapse probability. Collapse probabilities, such as that of MCE [
9,
17], annualized collapse probability [
18,
19], and that in the design reference period [
20], are extensively used as assessment parameters for the collapse performance of structures. However, quantitative research on the acceptable values of these collapse probabilities remains deficient. Earlier editions of the provisions indicate that “if a structure experiences a level of ground motion 1.5 times the design level, i.e., the MCE ground motion, the structure should have a low likelihood of collapse” [
21]. However, this provision is only a qualitative concept and is unquantified. In the following years, this “low likelihood of collapse” has been estimated as 10% [
9] using the state-of-the-art IDA [
22,
23] of structures designed in accordance with the National Earthquake Hazards Reduction Program (NEHRP) Recommended Seismic Provisions [
20]. However, this value requires considerable experience and must be adjusted in accordance with actual situations, such as the importance of the structure and the owner’s acceptable level. The acceptable probability of collapse at MCE was proposed for the first time in the newly implemented Code for the Anticollapse Design of Building Structures of China [
24], and the acceptable probabilities of B- and C-class buildings are set to 1% and 5%, respectively. Such regulation of quantitative acceptable collapse risk at MCE improves the operability in collapse resistance design, but the explanation about various collapse uncertainty sources that influence collapse probability at MCE remains inadequate. Thus, the suggested values must be improved and adjusted through research development and adequate statistical data. With regard to the randomness of earthquake occurrence during a certain period, confining to the acceptable probability at a given earthquake intensity (such as MCE) is unsuitable regardless of seismic risk. The average annual collapse probability of structures obtained by coupling collapse vulnerability and seismic risk not only considers the acceptable probability at MCE but also exhibits the collapse uncertainty within the design life of structures, and hence it can reflect the exact collapse performance of structures.
Risk targeting has recently emerged in the seismic design of structures; it considers many uncertainties that are disregarded in the uniform-hazard spectrum method and allows the achievement of consistent performance levels for structures with different properties through the definition of uniform risk design maps [
25]. The 50-year collapse probability, which is derived from the average annual collapse probability, is suggested to be less than 1% in FEMA P-750 [
20] as a uniform collapse risk target. Therefore, the acceptable CMR determined using the acceptable average annual collapse probability is more reasonable than that determined using the collapse probability at MCE per FEMA P695 [
9] because it is essentially the acceptable collapse safety margin of structures during their design service life.
The acceptable CMR suggested by FEMA P695 [
9] is determined using the collapse probability at MCE and can only represent the collapse risk at a given earthquake intensity level. Compared with the above-mentioned CMR, the one based on the average annual collapse probability or collapse probability in the design reference period covers a vast range of seismic hazard levels and is more suitable as an indicator of the global collapse performance of built or seismic-strengthened structures. In this study, the acceptable collapse probability proposed by the Code for the Anticollapse Design of Building Structures [
24] is used to determine the acceptable average annual collapse probability. The acceptable CMR is then derived with the acceptable average annual collapse probability to serve as global structural collapse performance index and seismic retrofitting target. The acceptable CMR is used to evaluate the improvement of the anticollapse capability of structures before and after strengthening. The superiority of two structure-strengthening methods, i.e., installing steel braces and increasing the section size of columns, is demonstrated. The potential of the acceptable CMR as an effective guiding tool in the anticollapse design of structures is explored.
4. Strengthening Scheme and the Strengthened Model
The design principles for the seismic strengthening of available buildings should satisfy the provisions of the Technical Specification for the Seismic Strengthening of Buildings [
34]. Prior to seismic strengthening, seismic appraisal should be implemented in accordance with the Standard for the Seismic Appraisal of Buildings, with consideration to seismic precautionary intensity, seismic precautionary category, continuing seismic service life, and structural type of the available building. Seismic measures and seismic check should be considered in seismic strengthening. The strengthened buildings should possess at least the seismic performance required by the Code for the Seismic Design of Buildings [
32].
Enlarging column sections is a traditional seismic strengthening method widely applied in the seismic strengthening practices of Chinese building structures. This method is easy to operate and reliable, and it can improve structural bearing capacity and stiffness. Placing a steel tube around a column and filling the gap with concrete can strengthen the column effectively. Jacketing the column with an RC jacket has been proven to increase ductility and column-carrying capacity [
35].
Adding steel braces is a convenient and commonly used seismic strengthening method [
1,
2,
36]. The installation of additional steel braces in a frame structure can improve its lateral stiffness and ductility and reduce structural lateral drift. This method requires a short construction period, small spaces, and few influences in architectural elevation and function. In case the building suffers from a major earthquake, the plastic deformation of steel braces can help dissipate the energy input by the earthquake and then elevate the anticollapse capacity of the strengthened building.
In view of their positive features, the above-mentioned methods are used in this study to retrofit a low-ductility RC frame structure and then investigate the seismic performance of the frame before and after retrofitting.
4.1. Strengthening Scheme
4.1.1. Enlarging the Column Section
The method in which column sections are enlarged is implemented by placing a steel skeleton around the column and filling the gap with concrete up to the periphery of the unreinforced column. The skeleton is made of eight longitudinal steels with a diameter of 10 mm and stirrup steels with a diameter of 10 mm. Section details are shown in
Figure 5 and
Figure 6 (RS-1).
In this method, the following conditions are assumed:
- (1)
The deformation of the section at different stress stages conforms to flat section hypothesis.
- (2)
When the ultimate failure of the reinforced column occurs, the joints of new and old surfaces do not break apart, and no relative slip exists between the skeleton reinforcement and concrete.
4.1.2. Additional Steel Braces
The arrangement of diagonal steel braces meets the use requirements and can prevent a large structural deformation during an earthquake. The principle of the symmetrical force of the architectural structure is also considered. The diagonal brace is arranged between two columns, thereby improving lateral stiffness and ductility [
15].
Figure 7 shows the layout of the steel braces.
4.2. Model Parameters
Four RC structures are designed to investigate the seismic performance of the RC frame structures with design deficiency before and after retrofitting. For comparison, a four-story, three-span RC frame structure (No. S-1) is designed to meet the minimum requirements of Chinese seismic code GB 50011-2010, and its column section is 450 × 500 mm
2. NS-1 is a four-story RC structure with a design deficiency in which its column section is smaller than the minimum design requirements in accordance with the design code of China and exhibits low ductility. The column sections of NS-1 are 400 × 400 mm
2 smaller than the S-1’s. The low-ductility structure (NS-1) is then strengthened by enlarging the column section (RS-1) and adding steel braces (RS-2). The RC column section of RS-2 is the same as NS-1’s, whereas RS-1’s is 500 × 550 mm
2, the largest among the four structures.
Figure 6 demonstrates the design parameters and column sections of the first three frame structures.
Figure 7 illustrates the arrangement scheme of the steel braces, which are all DN 100 mm, 20 mm-thick steel pipe with Q235. Additional details are presented in
Figure 6 and
Figure 7.
A two-dimensional finite element model of structures is developed in OpenSees [
37]. The fiber element model is the closest to the actual mechanical behavior in the nonlinear analysis of RC frame structures; thus, the fiber section element is used to describe the nonlinear behavior of beams and columns. The beam and column members are set with five integration points. The concrete behavior is described by the nonlinear degrading Concrete02 material model. The reinforcement behavior is modeled by the Giuffre–Menegotto–Pinto model and steel02 material [
2,
37]. The steel structure design code states that the ratio of the outer diameter of the steel tube to the wall thickness should not exceed 100, and the ratio of the member length to the section height (or diameter) should be greater than 12 in the truss plane to meet the anti-buckling requirements [
38]. Slenderness ratio should also be considered in brace buckling and tension [
1,
3]. In this study, the ratio is 39.11. The truss element model is used to model the diagonal braces and does not buckle in the simulation. The diagonal braces are the buckling restrained. The behavior of the braces is also described using the steel02 material.
The structures are located in a region with seismic precautionary intensity 8, seismic design category A, and site class II. The spectral acceleration at fundamental period
Sa (
T1) is regarded as ground motion IM. The fundamental period T
1 of NS-1, RS-1, RS-2, and S-1 is 1.15, 0.90, 0.65, and 0.98 s, respectively. The spectral accelerations at the fundamental periods of the four structures under MCE according to GB 50011-2010 are 0.35, 0.44, 0.58, and 0.40 g. The aforementioned average annual collapse probability-based acceptable CMR is taken here as a collapse performance criterion. The OpenSees platform [
37] is used to implement IDA for computing parameters, such as structural collapse probability. The seismic performance of these structures is analyzed to compare the considered seismic strengthening method.
4.3. Determination of Uncertainties
The collapse probability of structure can be affected by the difference in collapse intensity which is caused by the random ground motion that the structures suffered during its service life. The record-to-record variability
σRTR of ground motion records is found using the logarithmic standard deviation of the earthquake intensities of collapse from the IDA analysis in presented work.
Table 2 shows the specific values taken in reference to FEMA P695. The parameters of structural numerical model in IDA analysis, such as damping, geometric size and material strength, are also uncertain, which has a certain impact on the collapse fragility curve. The models designed in this study are relatively accurate, so the model uncertainty of the structures, the quality class is good, i.e.,
σMDL = 0.2. A comprehensive experimental investigation program is necessary to establish material properties, develop design criteria, calibrate and validate component models, confirm behavior, and calibrate analyses for a proposed seismic-force-resisting system. The accuracy of test data derived in experiment is influenced by the measurement error, and this error will affect the of evaluation accuracy for the performance of proposed structures. For the test data uncertainty that arises while making and checking the model, the quality class is also good, i.e.,
σTD = 0.2. How well the structure is designed according to the design requirements of the current code will have a direct influence on the structural performance. In terms of design requirement uncertainty, the quality class is superior (i.e.,
σDR = 0.1) for the structure designed in accordance with the current Chinese codes (S1) [
32], poor (i.e.,
σDR = 0.5) for the structures needing ductility details (NS-1), and fair (i.e.,
σDR = 0.35) for the strengthened structures (RS-1 and RS-2).
5. Structural Seismic Performance Analysis
5.1. Structural Collapse Performance Considering Record-to-Record Variability
On the basis of the Chinese specifications [
15], the maximum interstory drift ratio of 2% is used to determine the collapse limit state. The IDA method is used to obtain the seismic collapse fragility curves under 21 suites of ground motion records.
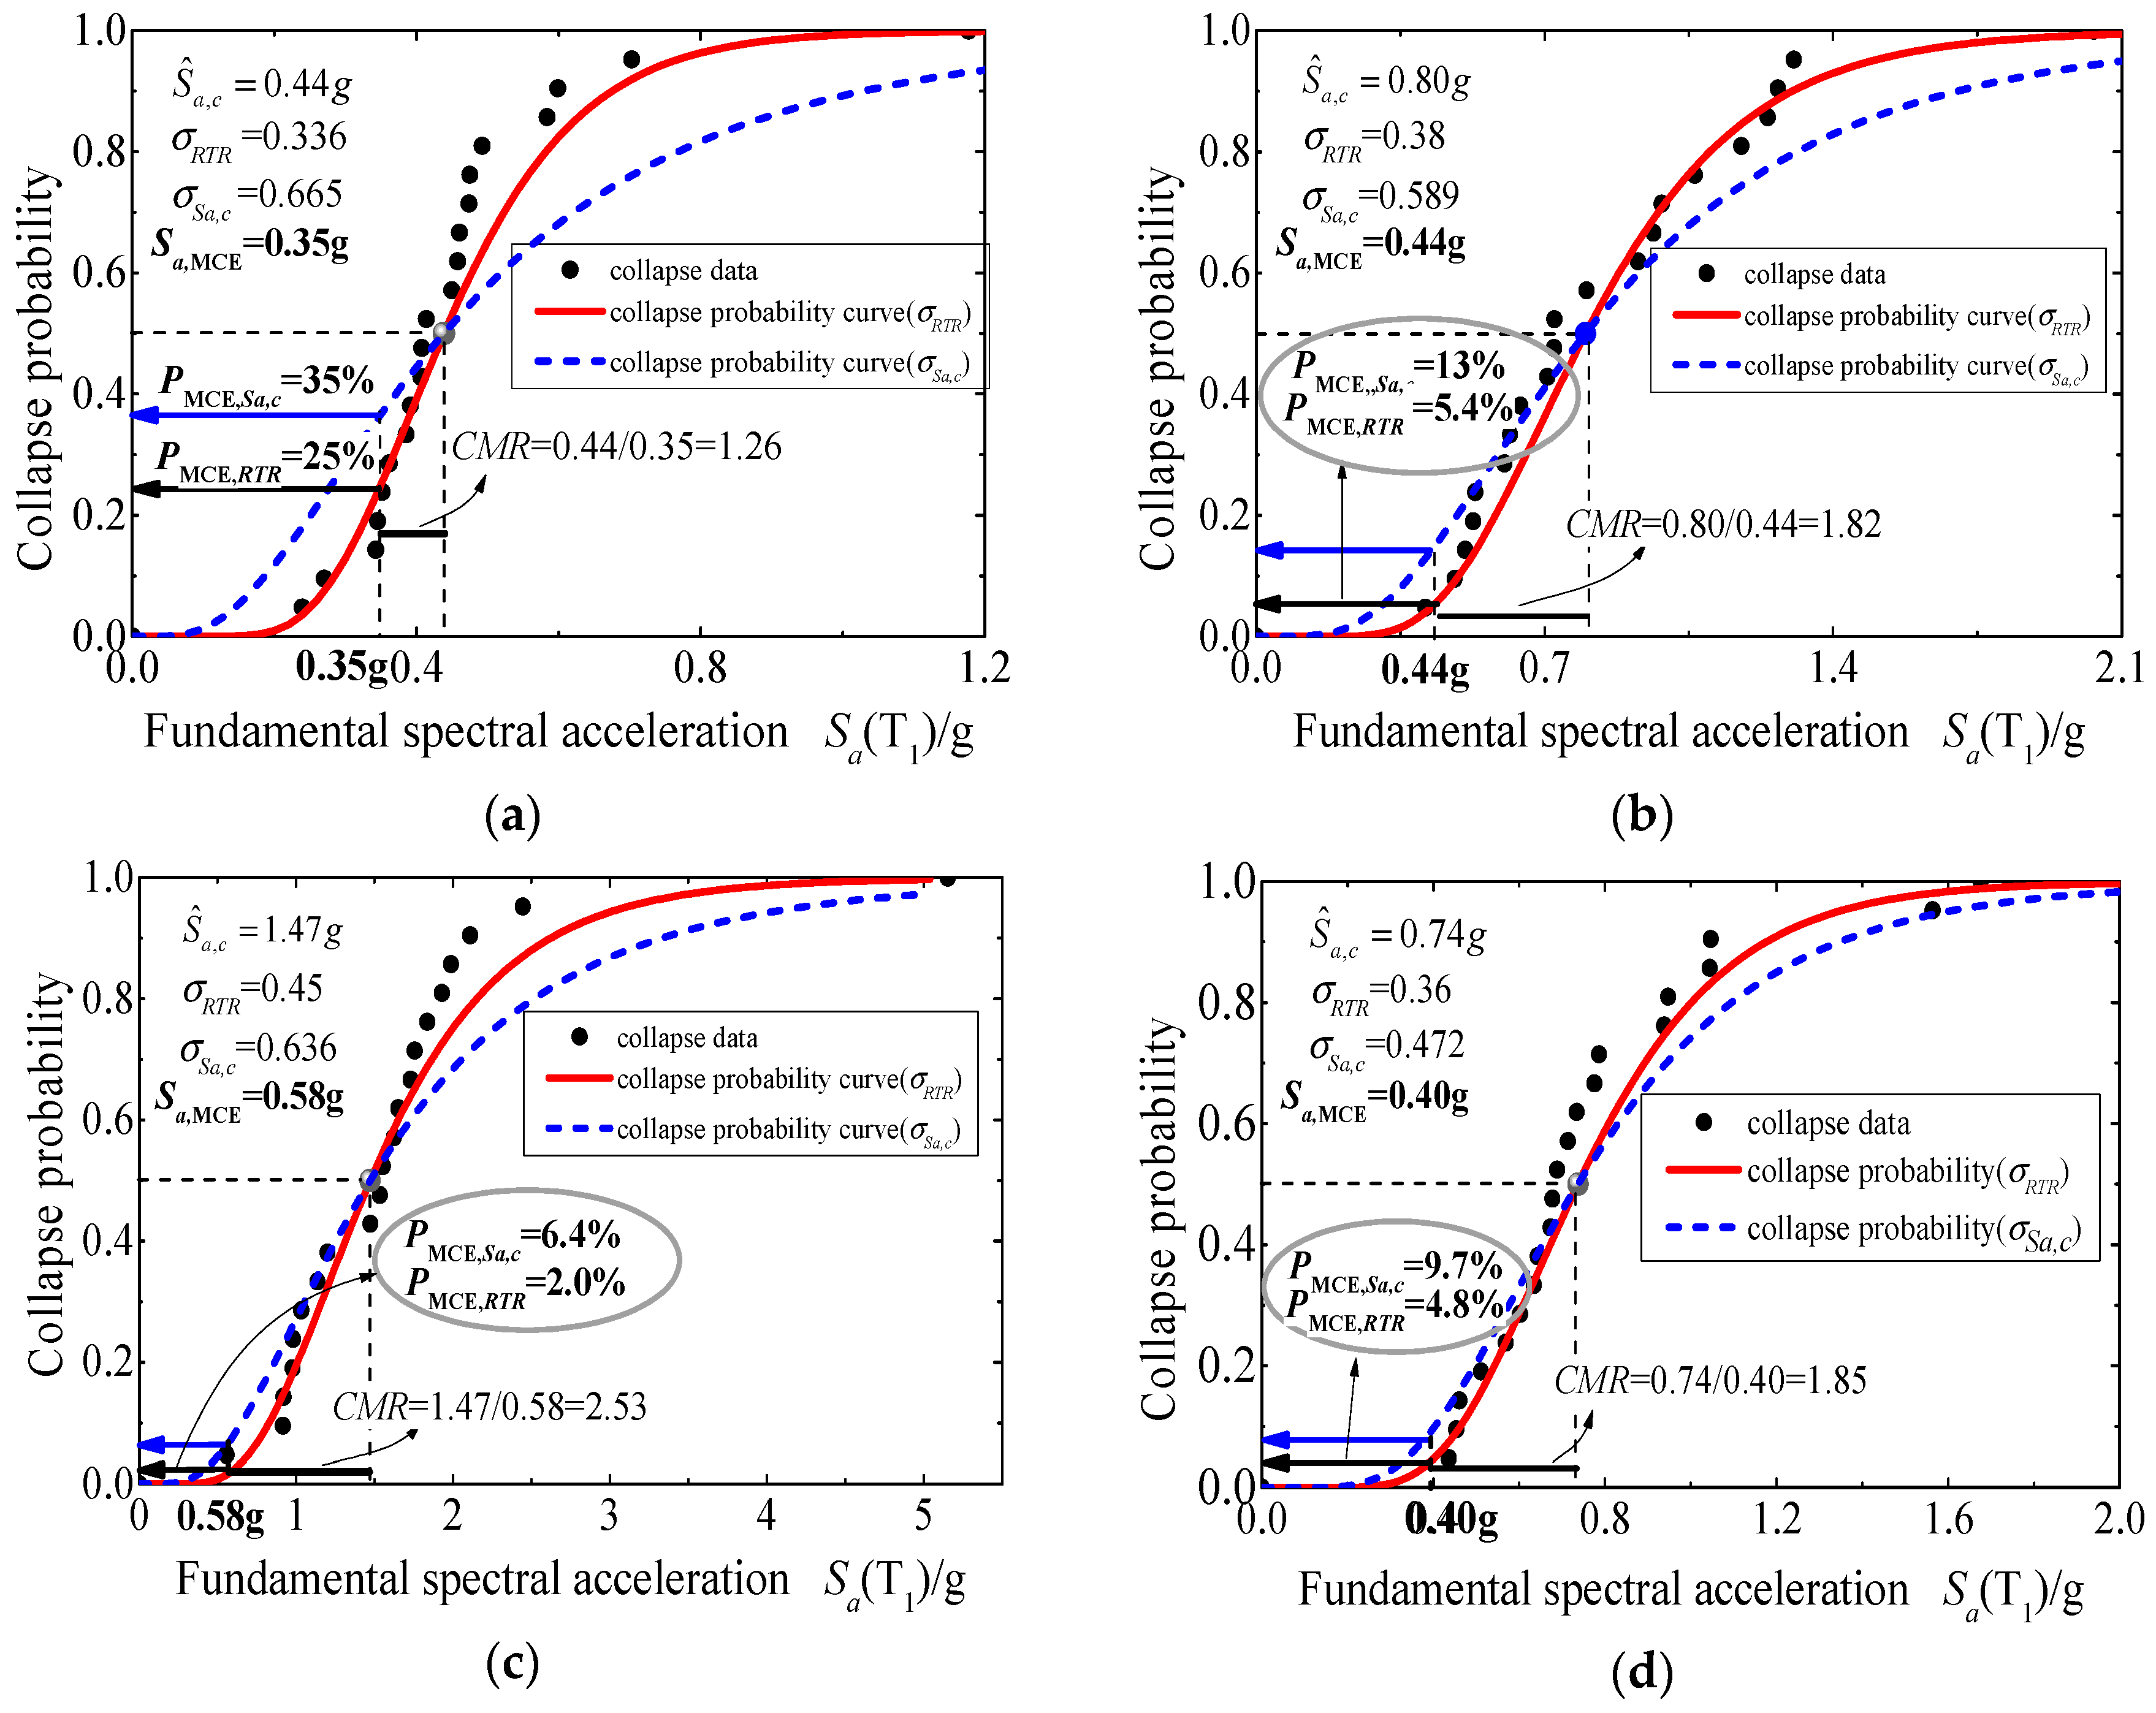
The collapse vulnerability curves of the four structures with only record-to-record variability considered are illustrated in
Figure 8a–d in red. The collapse data points are well fitted by the collapse vulnerability curves calculated with the lognormal distribution function. The corresponding collapse probabilities at MCE for NS-1, RS-1, RS-2, and S-1 are 25%, 5.4%, 2%, and 4.8%, respectively.
The prestrengthened low-ductility structure NS-1 has the highest collapse probability, exceeding 10% (the acceptable collapse probability at MCE suggested by FEMA P695) and 5% (as stipulated by Chinese specification CECS 392). This condition implies the high collapse risk of the building, although the collapse probability remains smaller than 50%, and the associated CMR is larger than 1. The collapse probability of the steel brace-strengthened structure RS-2 is the lowest (only 1/12.5 of the collapse probability of NS-1). The additional steel braces provide a low-performance structure with an unsatisfactory collapse probability at MCE to meet the requirements of CECS 392. The enlarged column sections decrease the collapse probability from 25% to 5.4%, an improvement of 78.4% jump. This result accounts for the capability of the column section enlargement method in reducing the collapse probability at MCE of a structure. However, the collapse probability at MCE of RS-1 remains beyond the limit set by the Chinese code CECS 392. In a strict sense, the first strengthening method is not good enough but it is acceptable with the influences of other uncertainties except record-to-record variability. The structure designed with the current Chinese specifications meets the requirements of CECS 392 and FEMA P695 for collapse probability at MCE.
Its collapse probability at MCE is only approximately 1/5 that of NS-1 but remains larger than that of the steel brace-strengthened structure.
Additional steel braces can improve structural stiffness and reduce collapse probability at MCE more effectively than the two strengthening methods. The collapse probability at MCE of RS-1 is slightly larger than that of S-1. Although RS-1 has column sections that are 50 mm larger than those of S-1 at each side and a larger overall stiffness compared with that of the original structure, the reinforcement ratio of each column is decreased when the reinforcement remains the same. The improvement of stiffness and the decrease in reinforcement ratio show a counter-reaction with each other. The record-to-record variability of RS-1 is larger than that of S-1 because the structural period is smaller, leading to the slight inferior structural performance of RS-1. The section parameters, collapse probability at MCE, and record-to-record variability of RS-1 are similar to those of S-1. The calculation outcomes are similar to that considering record-to-record variability.
As required by CECS 392, the acceptable collapse probability at MCE of Category-C buildings is 5% when record-to-record variability is considered. Among the four structures, the steel-braced structure (RS-2) and the structure designed with the current Chinese specifications (S-1) satisfy the requirement, whereas the structure with enlarged column sections (RS-1) is close to the requirement. In case only the record-to-record uncertainty is considered, the section sizes can be enlarged singly or together with reinforcement to obtain a satisfactory strengthening structure using the column enlargement method.
5.2. Structural Collapse Performance Considering All Uncertainties
The collapse vulnerability curves of the four structures with total collapse uncertainties considered are illustrated in
Figure 8a–d in blue dashed lines. The total collapse uncertainties include all the mentioned uncertainties, i.e., the record-to-record variability, model uncertainties
σMDL, design requirement uncertainties
σDR, and test data uncertainties
σTD.
The blue collapse vulnerability curves have a comparatively gentler slope because the increasing collapse uncertainties raise the collapse probability of the observed data points before the median collapse intensity, whereas the MCE and median collapse intensities remain the same. The low-ductility structure NS-1 is lowest in seismic performance, but its collapse earthquake intensity at MCE remains less than the median earthquake intensity of collapse. Therefore, with an increase in collapse uncertainties, the collapse probability at MCE increases simultaneously. This finding implies the considerable influence of structural collapse uncertainty on the result of collapse performance assessment.
The collapse probabilities at MCE of NS-1, RS-1, RS-2, and S-1 become 35%, 13%, 6.4%, and 9.7%, respectively, after considering total collapse uncertainty. These values exceed the acceptable collapse probability at MCE set by the Chinese code CECS 392 for Category-C buildings. Strict seismic strengthening measures should be adopted to meet the requirements of Chinese specifications.
Figure 8d proves that with all uncertainties considered, the collapse probability at MCE of the structure design according to GB 50011-2010 is 9.7%. This value is larger than 5%, which is the limit of CECS 392.
Discussions can be made from two aspects. On the one hand, the obtained collapse probabilities at MCE satisfy the requirements of CECS 392 when only record-to-record variability is considered but fail when other uncertainties are considered. The effect of collapse uncertainties on the assessment outcome must thus be controlled in the process of collapse performance assessment. On the other hand, if IDA is used to calculate structural collapse probability at MCE, then a relatively small change in total collapse uncertainty could induce an alternation in the found collapse probability at MCE and the failure to remain below the suggested limit value in CECS 392. The question of whether the acceptable collapse probability at MCE in Chinese specifications is excessively strict is raised: Should a more appropriate acceptable collapse probability in the design reference period or an acceptable average annual collapse probability be proposed under the background of Chinese codes?
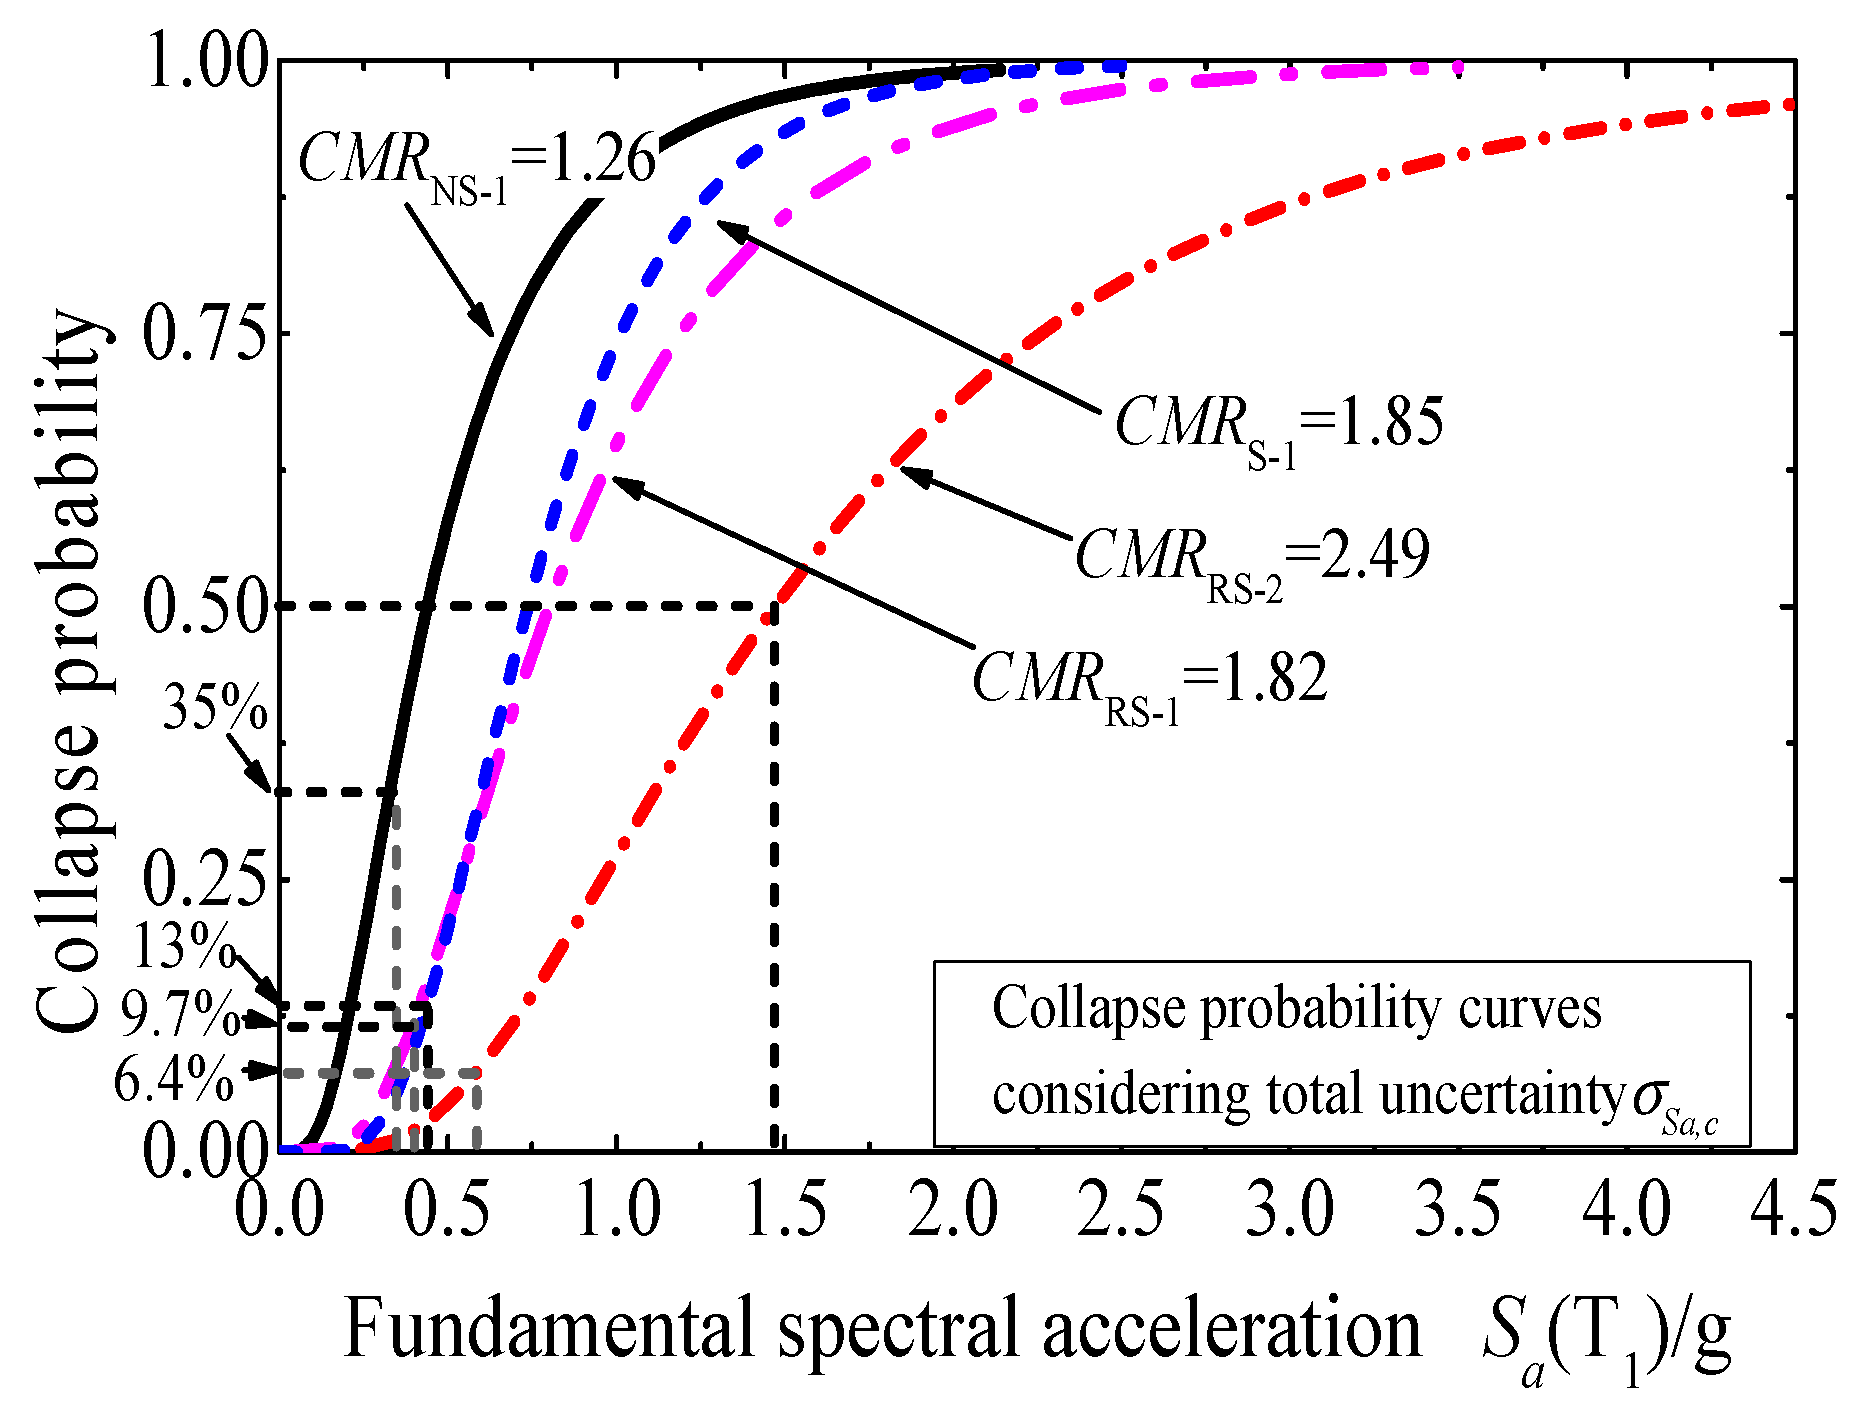
5.3. Comparison of CMRs
Figure 9 compares the collapse vulnerability curves with consideration to the total collapse uncertainty of the four structures. The collapse probability curve of NS-1 is steeper than those of other structures and increases rapidly with changing earthquake intensity, behaving like typical low-ductility structures. The calculated CMR is the smallest, i.e., 1.26. Additional steel braces improve structural stiffness and ductility efficiently. The CMR of RS-2 is boosted by 97.6% and reaches 2.49, which is the highest among those of the four structures. The column section enlargement method adopted in this study raises the CMR of NS-1 by 44%. RS-1 has similar parameters, such as column sections, to those of S-2, which is a structure designed in accordance with the current Chinese codes; thus, the two structures have close calculated CMRs. However, the collapse vulnerability curves of RS-1 are relatively flatter after the median collapse probability because of the large total collapse uncertainty.
5.4. Determination of Collapse Performance
Table 3 presents the collapse performance parameters of the four structures of concern calculated through IDA. The calculated CMRs of the four structures are less than the acceptable CMR found with the proposed average collapse probability of 1.24 × 10
−4 if total collapse uncertainty is considered; in other words, the collapse safety margins are insufficient. In the case in which only record-to-record variability is considered, the CMR of the steel brace-strengthened frame of 2.49 surpasses the corresponding acceptable CMR of 2.19. The structural collapse safety margin of RS-1 is hence adequate under this requirement. However, this case does not apply to the remaining structures.
The acceptable average annual collapse probability is assumed to be 2.0 × 10
−4, as suggested by FEMA P750, i.e., the 50-year collapse probability is less than 1%. All structures, except NS-1, are acceptable in terms of collapse safety margin, considering only record-to-record variability
σRTR. RS-1 and RS-2 have surpluses of 11% and 44%, respectively, compared with those in columns 6 and 11 in
Table 3. By considering the total collapse uncertainty, RS-2 and S-1 remain acceptable in terms of collapse safety margin; RS-1, the frame with an enlarged column section, is inferior. The underlying reason is the limitation of the relatively low reinforcement ratio of RS-1 on its collapse performance.
The results also show that the acceptable CMRs obtained with 1.24×10⁻⁴, which are the acceptable average annual collapse probability determined with the collapse probability at MCE 5% given by CECS 392 for structures of seismic precautionary intensity 8, are relatively large and hardly reached by structures designed with GB 50011-2010. However, once the acceptable average annual collapse probability is increased to 2 × 10⁻⁴, the associated results can be satisfied by structures designed with GB 50011-2010. Therefore, further studies should be executed to investigate a specific, unified value for the acceptable average annual collapse probability in Chinese codes. In this manner, structures designed with GB 50011-2010 can possess the equivalent collapse performance required by the related provisions of CECS 392.
Differences in the capacity of the two adopted seismic strengthening methods are observed. A surge in structural collapse safety margin occurs in the brace addition method. In this method, drastic steel tubes characterized by good ductility are used as steel braces in the bracing scheme shown in
Figure 6. However, a similar improvement in structural stiffness does not happen in the column section enlargement method because steel reinforcement is not increased simultaneously. In summary, adding steel braces is superior to enlarging column sections in terms of improving collapse performance. As a supplementary solution to the enlarged column sections, the use of larger column sections with adequate reinforcement are suggested until a CMR that satisfies the acceptable CMR is obtained in the collapse safety margin analysis.


