Abstract
The quantitative assessment of cardiovascular functions is particularly complicated, especially during any physiological challenge (e.g., exercise), with physiological signals showing intricate oscillatory properties. Signal complexity is one of such properties, and reflects the adaptability of the physiological systems that generated them. However, it is still underexplored in vascular physiology. In the present study, we calculate the complexity of photoplethysmography (PPG) signals and their frequency components obtained with the wavelet transform (WT), with two analytical tools—(i) texture analysis (TA) of WT scalograms, and (ii) multiscale entropy (MSE) analysis. PPG signals were collected from twelve healthy young subjects (26.0 ± 5.0 y.o.) during a unilateral leg lowering maneuver to evoke the venoarteriolar reflex (VAR) while lying supine, with the contralateral leg remaining stationary. Results showed that TA was able to detect a decrease in complexity, viewed as an increase in texture entropy (TE), of the PPG scalograms during VAR, similarly to MSE, suggesting that a decrease in the competence of vascular regulation mechanisms might be present during VAR. Nonetheless, TA showed lower sensitivity than MSE for low frequency spectral regions. TA seems to be a promising and straightforward analytical tool for the assessment of the complexity of PPG perfusion signals.
1. Introduction
The regulation of the cardiovascular system results from the adjustment of several biophysical phenomena, both electrical and mechanical. Their coordination is highly complex, depending on the continuous feedback and cross-talk between effector organs and controlling systems [1]. The heart pump and respiration are the most notorious “central” processes governing the performance of the cardiovascular system, while on a more “peripheral” level, the phenomena that control vascular tone, such as the myogenic activity of the vessel wall, the sympathetic activity and the endothelial release of vasoactive substances, play crucial roles [2,3,4]. Microcirculation signals are composed of both these central and peripheral components and therefore provide an “integrated” view of cardiovascular function [4,5]. The contributions from these multiple regulation systems and their intricate interplay explain the oscillatory properties of microcirculation signals. From an analytical standpoint, these oscillatory properties are increasingly considered as a means to extract more sensible information not apparent from the general analysis of the raw signals, in particular their spectral origin and the significance of their fractal and chaotic profiles [5,6,7]. In recent years, much attention has been given to the study of the complexity of physiological signals, a property that reflects the adaptability of the systems that generated them. Intuitively, the term complexity is often associated with “structural richness” [8], which can be applied to the study of biological signals and images. Complexity is typically assessed as “entropy,” a general measure of “disorganization” in physical, chemical and biological phenomena [9]. In biomedical research, entropy is used as a quantitative parameter, and is typically assessed in continuous, but temporally unpredictable, physiological signals, such as electrocardiography [10], electroencephalography [11], blood pressure [12], laser Doppler flowmetry (LDF) [13], and photoplethysmography (PPG) [14]. Physiological signals may be regular (e.g., more periodic) or irregular. The higher entropy measured in irregular signals reflects the adaptation capability to changing internal and external conditions of the biological system that generated them [15]. Overall, the entropy of physiological signals tends to decrease whenever the systems that generated them lose adaptability, which can result in a compromise of their function or even in disease. Therefore, a suitable metric of complexity should assign higher values to the output signal of a “healthier” system with a rich and meaningful structure and lower values to either random dynamics or predictable systems, which are often associated with disease [8,16,17]. This has been observed in the aging process [18,19] and in cardiovascular, metabolic and neurological diseases [18], among several others. In addition to pathological states, some experimental procedures are sufficiently “challenging” to temporarily provoke tissue dysfunction, especially those that reduce perfusion [6]. For continuous signals, the multiscale entropy analysis (MSE) is considered a robust analytical tool, having shown superiority over other measures for its ability to assess entropy over different time scales [19]. Entropy can also be assessed in texturally rich biological images, reflecting their textural “disorganization.” Texturally rich images can be assessed with texture analysis (TA), an analytical tool allowing the detection of various features on a gray-level image to discriminate textural differences, such as texture entropy (TE), contrast, correlation, homogeneity, and energy. Entropy calculated from TA of images may reflect different information than that conveyed by the entropy assessment of continuous numerical series. When applied to a grayscale image, high entropy means that the pixels can adopt a high number of gray levels, expressing richer information [20]. TA has been used in medical imaging with the purpose of improving diagnostic capacity, given that human visual inspection constitutes a process that is expensive, time-consuming and prone to interpretation errors [21]. Thus far, TA in medical imaging has been more frequently applied to mammography [22], ultrasonography, computerized tomography (CT) [23], and magnetic resonance imaging (MRI) [24] techniques [25], as well as to dermatoscopy [26] and microscopy images [27]. In particular, TE has been used to explore immune competence of lymphoid tissue in microscopic images [28], to assess the onset organ (liver) disease and tumor (colorectal cancer) evolution in CT scans [29,30,31], and to assess bone regeneration in fractures [32] and osteoarthritis [33], among others. In medical imaging, TE does not necessarily decrease when images display abnormal features. In fact, since abnormal or dysmorphic features often increase the coarseness of smooth or uniform images from healthy subjects, increases in TE are often seen in pathological images, such as in the case of aged tissues and organs [34] as well as the case of neoplastic formations [30,31]. In these situations, a richer texture and therefore, higher entropy, is associated with dysfunction. Although currently underexplored in vascular physiology, the complexity assessment of microcirculation signals, both raw and decomposed, may deepen our knowledge of the mechanisms underlying perfusion regulation. Microcirculation signals are easily decomposed into their frequency components by the wavelet transform (WT) [4]. One of the WT main outputs is a scalogram, i.e., a multi-patterned image representation of the time evolution of all components of the decomposed signal. Given their textural richness, WT scalograms seem suitable candidates for TE analysis, however, to our knowledge this analysis has not been previously attempted. Since WT scalograms are not medical images, the interpretation of TE in this context must be necessarily different from the one performed in medical diagnosis. Given the fact that a WT scalogram is a 2D projection of a 3D frequency spectrum, (i.e., the 3D spectrum seen from above), it is only logical to assume that a change in the entropy of the numerical series that constitute the 3D spectrum would also be observed in corresponding WT scalograms. Therefore, the assumption that similar trends in complexity would be observed with MSE and TA seems legitimate. Our objective was to compare the complexity of microcirculation PPG signals calculated with TE against MSE during a typical venoarteriolar reflex (VAR).
2. Materials and Methods
2.1. Experimental
Twelve healthy young adult subjects (26.0 ± 5.0 y.o., seven females, five males) participated in this study after giving informed written consent. All subjects were healthy, with no cardiovascular diseases, were non-smokers, and abstained from consuming alcohol and caffeine-containing beverages 24 hours prior to the experimental procedure. The protocol was approved by the School of Health Sciences and Technologies’ Ethical Commission. All subjects gave written informed consent, and the study was conducted in accordance with the Declaration of Helsinki and subsequent amendments [35]. After 20 minute acclimatization to room conditions (temperature: 22 ± 1 °C, humidity: 40–60%), a postural challenge to elicit the VAR was applied, as previously described [4]—10 minutes lying supine with both legs extended (baseline, Phase I); 10 minutes with one foot lowered 50 cm from heart level (challenge, Phase II); and 10 minutes resuming the initial posture (recovery, Phase III). The contralateral foot remained stationary and served as control. Blood flow signals, expressed in arbitrary units (AU), were acquired from the first toe of both feet at a 100 Hz sampling rate with a reflection photoplethysmography Blood Pulse Volume sensor (Biosignals Plux, Lisboa, Portugal) connected to a BITalino Plugged microprocessor board (Biosignals Plux).
2.2. Numerical
The raw PPG signals were imported to Matlab (Mathworks R2012, Natick, MA, USA) and smoothed with a moving average filter.
The WT (http://noc.ac.uk/using-science/crosswavelet-wavelet-coherence) was then applied to the smoothed signals, which allowed the decomposition into their main frequency components. Wavelets are a family of functions constructed from translations and dilations of a single function called the “mother wavelet” , collectively defined by:
The parameter a is the scaling parameter or scale, measuring the degree of compression, while parameter b is the translation parameter, determining the time location of the wavelet. If |a| < 1, then the wavelet in the above equation is the compressed version of the mother wavelet and corresponds mainly to higher frequencies. If |a| > 1, then has a larger time-width than and corresponds to lower frequencies. Thus, wavelets have time-widths adapted to their frequencies.
In this case, the central frequency of the wavelet was 6 Hz, with a discretization factor of 10 scales per octave. The detected components of the PPG signals occurred at the following frequency ranges: cardiac [1.6–0.7 Hz], respiratory [0.7–0.26 Hz], myogenic [0.26–0.1 Hz], neurogenic/sympathetic [0.1–0.045 Hz], endothelial NO-dependent (NOd) [0.045–0.015 Hz] and NO-independent (NOi) [0.015–0.007 Hz], which were in line with the ranges previously described for LDF [36]. From the WT, two main outputs were generated for each subject: (1) a scalogram and (2) a 3D periodogram. The WT scalogram (Figure 1) shows the time (here converted to sample number) evolution of the amplitude with a factor of 2n (here in color scale) for each signal scale. The approximate frequency of a component is obtained by dividing the central wavelet frequency by the scale of the component. From a visual inspection, the WT scalogram also presents an oscillatory pattern in pixel distribution on different scales, making it a suitable candidate for TA. The scalogram was then used as a grayscale image, where several regions of interest (ROI) were marked, each per component per phase of the protocol. Each ROI was then converted to a gray-level co-occurrence matrix (GLCM), a matrix where the number of rows and columns is equal to the number of gray levels (G) in the image, from which the TE was calculated as follows [37]:
where P(i, j) denotes the probability of occurrence of a given element in the matrix.
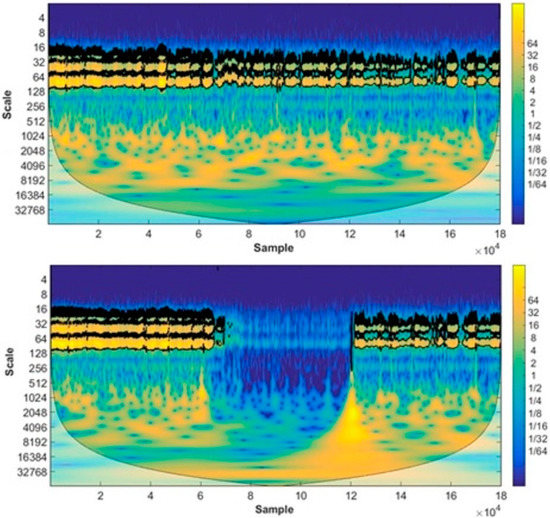
Figure 1.
WT scalogram of the PPG signal from the control (top) and test (bottom) feet from a representative subject (20 y.o.).
To correctly select each ROI, a control sine wave signal was generated with multiple components occurring at known frequencies (f1=3.2 Hz; f2=1.6 Hz; f3=0.7 Hz, f4=0.26 Hz; f5=0.1 Hz; f6=0.045 Hz; f7=0.015 Hz; f8=0.007 Hz), where each frequency is close to the ones that define the borders of the PPG components’ detected frequency ranges. The sine wave signal was then deconstructed with the WT, and a reference scalogram was generated (Figure 2).
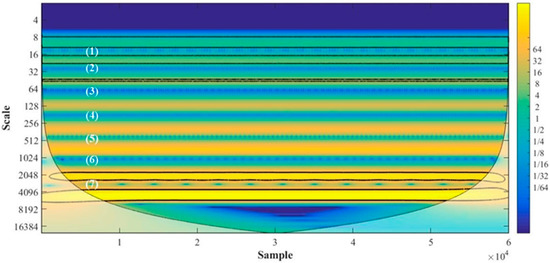
Figure 2.
WT scalogram of the reference sine wave signal. The region corresponding to each component frequency interval is shown (1—first harmonic of the cardiac component; 2—cardiac; 3—respiratory; 4—myogenic; 5—sympathetic; 6—endothelial NO-dependent; 7—endothelial NO-independent).
From the 3D periodogram (Figure 3), a 2D time evolution of the amplitude of each component was constructed by averaging the amplitude at each time point for each spectral interval (Figure 4). Signals were acquired at a 100 Hz sampling rate, which translates to a total number of 180,000 samples for the entire 30 minute protocol. The wavelet period is a natural logarithmic representation of the wavelet scale, with the frequency in Hz exponentially related to this period. The time evolution was analyzed for both the raw PPG signal and its components with MSE, an algorithm that quantifies the randomness/unpredictability of a signal over different time scales as follows [19]:
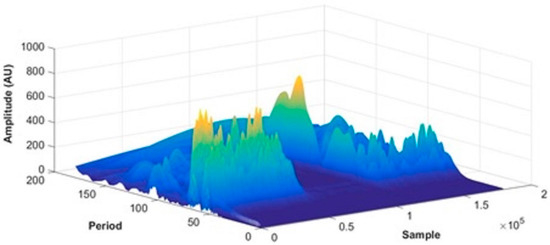
Figure 3.
PPG 3D frequency spectrum (period vs. sample vs. amplitude) for the test foot of a representative subject (20 y.o.). Signals were acquired at a 100 Hz sampling rate, which translates to a total of 180,000 signal samples for a 30 minute acquisition period. Period is a natural logarithmic representation of the wavelet scale.
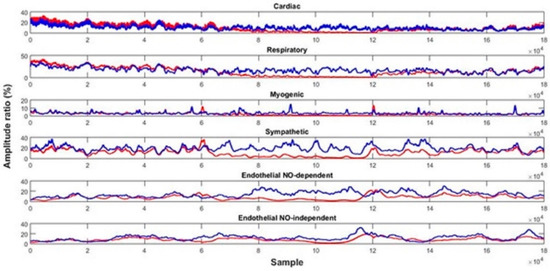
Figure 4.
Time evolution of the PPG signal components’ amplitude ratio for the control (blue) and test (red) feet throughout the protocol (baseline: signal samples 0–60,000; challenge: signal samples 60,000–120,000; recovery: signal samples 120,000–180,000) for a representative subject (20 y.o.).
Given a time series = 1,..., N, a consecutive coarse-grained time series y(τ) is constructed:
where represents the scale factor and . The sample entropy (SampEn) of each coarse-grained time series is then computed. SampEn(m, r, N) is the negative natural logarithm of the conditional probability that a dataset of length N, having repeated itself with a tolerance of r points, will also repeat itself for m + 1 points, without allowing self matches:
where Am(r) is the probability that two sequences will match for m + 1 points and Bm(r) is the probability that two sequences will match for m points. The more regular and predictable a time series is, the lower the value of SampEn. The more random a time series is, the higher the value of SampEn. Plotting the SampEn over the scale factor yields the MSE curve, which gives insight into the integrated complexity of the system over the time scales of interest, which can be of interest when comparing groups where differences in specific time scales are probable. The randomness/unpredictability of the signal can finally be straightforwardly summarized as the complexity index (CI), which corresponds to the area under the MSE curve [38]. The CI and TE were statistically compared between each phase of the protocol with the Wilcoxon signed-rank test, and were compared between feet for each phase with the Mann-Whitney independent sample test, adopting a 95% confidence interval.
3. Results
As previously published, during the postural challenge, perfusion decreased significantly on both the test and control feet [4]. The mean and standard deviation (SD) of the entropy parameter (CI) calculated with MSE is presented in Table 1. For the test foot, the CI of the raw PPG signal and all its components decreased significantly during the challenge (Phase II, raw signal: p = 0.005; cardiac: p = 0.012; respiratory: p = 0.002; myogenic: p = 0.003; sympathetic: p = 0.002; NOd: p = 0.002; NOi: p = 0.002). For the control foot, the CI of the raw PPG signal showed an increase without statistical significance. All the components’ CI decreased, with the exception of the cardiac, although not so pronounced as in the test foot (respiratory: p = 0.002; myogenic: p = 0.003; sympathetic: p = 0.002; NOd: p = 0.002; NOi: p = 0.002). During recovery (Phase III), significant differences were still detected on both feet regarding baseline for the respiratory (test: p = 0.002; control: p = 0.002), myogenic (test: p = 0.008; control: p = 0.008), sympathetic (test: p = 0.002; control: p = 0.002), NOd (test: p = 0.002; control: p = 0.002) and NOi (test: p = 0.002; control: p = 0.003). The mean and SD of the entropy parameter (TE) calculated for the sine wave and PPG signals with TA is shown in Table 2. For the sine wave signal scalogram, TE decreased from the cardiac component towards the low frequency components, where it increased again for the NOi. For the test foot PPG scalogram, TE decreased significantly in the cardiac (p = 0.004), respiratory (p = 0.013), and myogenic (p = 0.008) components, increased significantly in the NOd (p = 0.012) and NOi (p = 0.010), and showed no change in the sympathetic component. During recovery, all components’ TE returned except for the NOd, which showed a significant difference regarding baseline (p = 0.007). For the control foot PPG scalogram, changes in TE were not so pronounced as in the test foot, with only the cardiac component showing a significant difference regarding baseline (p = 0.001). During recovery, only the cardiac component showed a significant difference (p = 0.022) regarding baseline. No significant differences in entropy were found between feet at baseline (Table 1 and Table 2) either with CI or TE. During the challenge phase, significant differences were found for the raw signal (p < 0.001) and all components (p=0.001 for the respiratory; p < 0.001 for the remaining) with CI. Similarly, TE showed significant differences in all components (cardiac: p = 0.001; respiratory: p = 0.045; myogenic: p = 0.028; NOd: p = 0.001; NOi: p = 0.001), except the sympathetic. During recovery, the CI of the sympathetic (p = 0.012), NOd (p = 0.002) and NOi (p < 0.001) were significantly different, while with TE no statistical differences were found.

Table 1.
Mean and standard deviation (SD) of the MSE complexity index for each foot on each phase of the protocol (card—cardiac, resp—respiratory, myo—myogenic, sym—sympathetic, NOd—endothelial NO-dependent, NOi—endothelial NO-independent). Statistical comparison to Phase I is shown (*—p < 0.05).
Table 2.
Mean and standard deviation (SD) of the texture entropy for each foot on each phase of the protocol (card—cardiac, resp—respiratory, myo—myogenic, sym—sympathetic, NOd—endothelial NO-dependent, NOi—endothelial NO-independent). Statistical comparison to Phase I and between the test and control limbs are shown (*—p < 0.05).
4. Discussion
In this study, the acquired PPG signals and an artificial sine wave signal were decomposed with the WT into their respective components so that TE and CI could be calculated. The relative contributions of each of the components to the overall signal, expressed as amplitude ratios, are typical WT outputs but were not considered for this study as these results were previously published [4]. During leg lowering, perfusion decrease in the test foot is explained by a constriction of arterioles secondary to the increased venous distension when the foot is in a pendent posture, which constitutes the VAR [39]. The fast perfusion decreases in the control foot (not so pronounced as in the test foot) is thought to be due to a centrally mediated neurogenic reflex initiated to maintain the vascular homeostasis in the lower limb [4]. The sine wave signal scalogram showed TE values generally invariant regarding the component, which reflects the regularity of these signals. The highest TE values were recorded for both the highest (cardiac) and lowest (NOi) frequency components, meaning a richer texture was found in the corresponding ROIs, likely explained by the particular overlap of the spectral waves that define them. Contrarily, the PPG signal scalogram showed that the higher frequency (HF) components (cardiac, respiratory, myogenic) displayed higher TE values in either foot, meaning the corresponding ROIs are more texturally rich, i.e., more complex in comparison to the lower frequency components. This suggests that TE assessment of PPG scalograms is sensitive to the underlying phenomena that explain the physiological complexity of these signals. In our data, both TE and MSE analyses showed an overall decrease in the PPG signal and in the respective components’ entropies during leg lowering in both the test and control feet. This result seems to indicate a bilateral decrease in the vascular adaptation capacity to the lower perfusion levels observed during leg lowering. This apparent decrease in adaptation capacity is further reinforced by the observation that several PPG components’ entropies show significant differences between the recovery and baseline phases, suggesting that full recovery was not attained at the end of the protocol. In our view, these results indicate that that VAR creates a state of reduced perfusion that, while not compromising tissue viability, destabilizes the evoked regulatory mechanisms. When considering the test foot, MSE detected a significant decrease in the entropy of all components during VAR. TE, however, detected an entropy decrease in the cardiac, respiratory, and myogenic components, an increase in both endothelial components and no change in the sympathetic. Regarding the control foot, an overall entropy decrease was observed with both tools. MSE recorded a decrease in the complexity of all components, although not so pronounced as in the test foot, which again is likely attributable to the magnitude of the perfusion decrease. Again, TE showed more subtle changes, only significant for the respiratory and NOi components. Overall, MSE and TE showed similar responses in the high frequency components (cardiac, respiratory, myogenic), and dissimilar responses in the low frequency components (sympathetic, NOd, NOi), suggesting that TE loses analytical sensitivity in the latter regions. This loss of sensitivity may be attributed to an incomplete visual resolution of the scalogram bands of the low frequency components, leading to a less precise identification of the respective ROIs. Nevertheless, TE was able to differentiate the entropies of most components during VAR between the test and control limbs. Overall, although both TE and MSE were able to detect differences in entropy, MSE was consistently more sensitive. One should keep in mind that MSE and TE ensure different scale evaluations—frequency for TE and time for MSE, which are two aspects of the same reality (i.e., perfusion signal). Thus, both analytical strategies provide different views into the same physiological event, which can also help to explain the differences in sensitivity found. MSE detected changes in entropy between limbs during both VAR and recovery phases, while TE was only able to detect the more pronounced changes that occurred during VAR. Furthermore, MSE was sensitive to changes in entropy for a greater number of components in comparison to TE. Although the performance of the reference MSE method was superior under the conditions studied, these results suggest that TE is an interesting and suitable tool for assessing the complexity of PPG microcirculation signals considered as WT scalograms, in particular for the analysis of high frequency components.
5. Conclusions
In this paper we present for the first time the use of texture entropy (TE) for the quantification of complexity in microcirculatory perfusion signals, using MSE as a reference analytical tool. Our results show that TE was able to detect a decrease in complexity of the PPG scalograms during VAR, similarly to MSE. This complexity decrease suggests that a decrease in the competence of vascular regulation mechanisms might be present during VAR and should be further investigated. Results from both tools were aligned for the high frequency components, but not for the low frequency components, suggesting a decrease in sensitivity of TE in the latter spectral regions. Recognizing the value of increasing the sample size (and heterogeneity) in future studies, our results have shown Texture Analysis (TA) to be a promising method to assess the complexity of PPG perfusion signals.
Author Contributions
Conceptualization, H.S.; Methodology, H.S., C.R. and H.A.F.; Software, H.S. and H.A.F.; Validation, H.A.F., and L.M.R.; Formal Analysis, H.S.; Investigation, H.S. and C.R.; Resources, H.A.F. and L.M.R.; Data Curation, H.S. and H.A.F.; Writing—Original Draft Preparation, H.S.; Writing—Review & Editing, H.A.F.; Visualization, H.A.F. and L.M.R.; Supervision, L.M.R.; Project Administration, L.M.R.; Funding Acquisition, L.M.R. All authors have read and agreed to the published version of the manuscript.
Funding
This work was supported by national funds from FCT—Fundação para a Ciência e a Tecnologia, I.P, within the project UID/DTP/04567/2019.
Acknowledgments
The authors would like to express their thanks to all the volunteers for their participation in this study.
Conflicts of Interest
The authors declare that the research was conducted in the absence of any commercial or financial relationships that could be construed as a potential conflict of interest.
Ethics Statement
This study was carried out in accordance with the recommendations of Ethical Principles for Medical Research Involving Human Subjects, Declaration of Helsinki. The protocol was approved by the School of Health Sciences and Technologies’ Ethical Commission. All subjects gave written informed consent in accordance with the Declaration of Helsinki.
References
- Stefanovska, A. Coupled Oscillators: Complex but Not Complicated Cardiovascular and Brain Interactions. IEEE Eng. Med. Biol. 2007, 26, 25–29. [Google Scholar] [CrossRef] [PubMed]
- Stefanovska, A.; Lotric, M.B.; Strle, S.; Haken, H. The cardiovascular system as coupled oscillators? Physiol. Meas. 2001, 22, 535–550. [Google Scholar] [CrossRef]
- Bernjak, A.; Stefanovska, A. Importance of wavelet analysis in laser Doppler flowmetry time series. In Proceedings of the 29th Annual International Conference of the IEEE Engeniring in Medicine and Biology Society, Lyon, France, 22–26 August 2007; pp. 4064–4067. [Google Scholar]
- Silva, H.; Ferreira, H.A.; Da Silva, H.P.; Rodrigues, L.M. The Venoarteriolar Reflex Significantly Reduces Contralateral Perfusion as Part of the Lower Limb Circulatory Homeostasis in vivo. Front. Physiol. 2018, 9, 1–9. [Google Scholar] [CrossRef] [PubMed]
- Silva, H.; Bento, M.; Vieira, H.; Rodrigues, L.M. Comparing the spectral components of laser Doppler flowmetry and photoplethysmography signals for the assessment of the vascular response to hyperoxia. J. Biomed. Biopharm. Res. 2017, 14, 187–194. [Google Scholar] [CrossRef]
- Silva, H.; Ferreira, H.; Rodrigues, L.M. Studying the Oscillatory Components of Human Skin Microcirculation. In Measuring the Skin; Springer Science and Business Media LLC: Berlin, Germany, 2015; pp. 1–15. [Google Scholar]
- Mizeva, I.; Di Maria, C.; Frick, P.; Podtaev, S.; Allen, J. Quantifying the correlation between photoplethysmography and laser Doppler flowmetry microvascular low-frequency oscillations. J. Biomed. Opt. 2015, 20, 37007. [Google Scholar] [CrossRef] [PubMed]
- Costa, M.; Goldberger, A.L.; Peng, C.-K. Multiscale entropy analysis of biological signals. Phys. Rev. E 2005, 71, 021906. [Google Scholar] [CrossRef]
- Rangel, J.A.O. The Systemic Theory of Living Systems and Relevance to CAM Part I: The Theory. Evid-Based Compl. Alt. 2005, 2, 13–18. [Google Scholar] [CrossRef]
- Zhang, Y.; Wei, S.; Long, Y.; Liu, C. Performance Analysis of Multiscale Entropy for the Assessment of ECG Signal Quality. J. Electr. Comput. Eng. 2015, 2015, 1–9. [Google Scholar] [CrossRef]
- Chung, C.-C.; Kang, J.-H.; Yuan, R.-Y.; Wu, D.; Chen, C.-C.; Chi, N.-F.; Chen, P.-C.; Hu, C.-J. Multiscale Entropy Analysis of Electroencephalography During Sleep in Patients With Parkinson Disease. Clin. EEG Neurosci. 2013, 44, 221–226. [Google Scholar] [CrossRef]
- Trunkvalterova, Z.; Javorka, M.; Tonhajzerova, I.; Javorkova, J.; Lazárová, Z.; Javorka, K.; Baumert, M. Reduced short-term complexity of heart rate and blood pressure dynamics in patients with diabetes mellitus type 1: multiscale entropy analysis. Physiol. Meas. 2008, 29, 817–828. [Google Scholar] [CrossRef]
- Humeau, A.; Buard, B.; Mahé, G.; Rousseau, D.; Chapeau-Blondeau, F.; Abraham, P. Multiscale entropy of laser Doppler flowmetry signals in healthy human subjects. Med. Phys. 2010, 37, 6142. [Google Scholar] [CrossRef] [PubMed]
- Schack, T.; Harb, Y.S.; Muma, M.; Zoubir, A.M. Computationally efficient algorithm for photoplethysmography-based atrial fibrillation detection using smartphones. In 2017 39th Annual International Conference of the IEEE Engineering in Medicine and Biology Society (EMBC); Institute of Electrical and Electronics Engineers (IEEE): Piscataway, NJ, USA, 2017; pp. 104–108. [Google Scholar]
- Zhang, X.D.; Shen, B. Entropy for the Complexity of Physiological Signal Dynamics. Adv. Exp. Med. Biol. 2017, 1028, 39–53. [Google Scholar] [PubMed]
- Yang, D.; Luo, Z.; Ma, S.; Wong, W.T.; Ma, L.; Zhong, J.; He, H.; Zhao, Z.; Cao, T.; Yan, Z.; et al. Activation of TRPV1 by dietary capsaicin improves endothelium-dependent vasorelaxation and prevents hypertension. Cell Metab. 2010, 12, 130–141. [Google Scholar] [CrossRef] [PubMed]
- Liu, Y.; Lin, Y.; Wang, J.; Shang, P. Refined generalized multiscale entropy analysis for physiological signals. Phys. A: Stat. Mech. its Appl. 2018, 490, 975–985. [Google Scholar] [CrossRef]
- Vargas, B.; Cuesta-Frau, D.; Ruiz-Esteban, R.; Cirugeda, E.; Varela, M. What Can Biosignal Entropy Tell Us About Health and Disease? Applications in Some Clinical Fields. Nonlinear Dyn. Psychol. Life Sci. 2015, 19, 419–436. [Google Scholar]
- Costa, M.; Goldberger, A.L.; Peng, C.-K. Multiscale Entropy Analysis of Complex Physiologic Time Series. Phys. Rev. Lett. 2002, 89, 068102. [Google Scholar] [CrossRef]
- Tsai, D.-Y.; Lee, Y.; Matsuyama, E. Information Entropy Measure for Evaluation of Image Quality. J. Digit. Imaging. 2008, 21, 338–347. [Google Scholar] [CrossRef]
- Larroza, A.; Bodí, V.; Moratal, D. Texture Analysis in Magnetic Resonance Imaging: Review and Considerations for Future Applications. In Assessment of Cellular and Organ Function and Dysfunction using Direct and Derived MRI Methodologies; IntechOpen: London, UK, 2016; pp. 75–106. [Google Scholar]
- Pharwaha, A.P.S.; Singh, B. Shannon and Non-Shannon Measures of Entropy for Statistical Texture Feature Extraction in Digitized Mammograms. In Proceedings of the World Congres on Engineering nd Computer Science, San Francisco, CA, USA, 20–22 October 2009. [Google Scholar]
- Al-Kadi, O.; Watson, D. Texture Analysis of Aggressive and Nonaggressive Lung Tumor CE CT Images. IEEE Trans. Biomed. Eng. 2008, 55, 1822–1830. [Google Scholar] [CrossRef]
- Gibbs, P.; Turnbull, L.W. Textural analysis of contrast-enhanced MR images of the breast. Magn. Reson. Med. 2003, 50, 92–98. [Google Scholar] [CrossRef]
- Castellano, G.; Bonilha, L.; Li, L.; Cendes, F. Texture analysis of medical images. Clin. Radiol. 2004, 59, 1061–1069. [Google Scholar] [CrossRef]
- Shrestha, B.; Bishop, J.; Kam, K.; Chen, X.; Moss, R.H.; Stoecker, W.V.; Umbaugh, S.; Stanley, R.J.; Celebi, M.E.; Marghoob, A.A.; et al. Detection of atypical texture features in early malignant melanoma. Skin. Res. Technol. 2010, 16, 60–65. [Google Scholar] [CrossRef] [PubMed][Green Version]
- Gao, Y.; Helgeson, M.E. Texture analysis microscopy: quantifying structure in low-fidelity images of dense fluids. Opt. Express 2014, 22, 10046–10063. [Google Scholar] [CrossRef] [PubMed]
- Pantic, I.; Pantic, S. Germinal Center Texture Entropy as Possible Indicator of Humoral Immune Response: Immunophysiology Viewpoint. Mol. Imaging. Biol. 2012, 14, 534–540. [Google Scholar] [CrossRef] [PubMed]
- Mir, A.; Hanmandlu, M.; Tandon, S. Texture Analysis of CT. IEEE Eng. Med. Biol. 1995, 14, 781–786. [Google Scholar] [CrossRef]
- Ng, F.; Ganeshan, B.; Kozarski, R.; Miles, K.A.; Goh, V. Assessment of Primary Colorectal Cancer Heterogeneity by Using Whole-Tumor Texture Analysis: Contrast-enhanced CT Texture as a Biomarker of 5-year Survival. Radiology 2013, 266, 177–184. [Google Scholar] [CrossRef] [PubMed]
- Ng, F.; Kozarski, R.; Ganeshan, B.; Goh, V. Assessment of tumor heterogeneity by CT texture analysis: Can the largest cross-sectional area be used as an alternative to whole tumor analysis? Eur. J. Radiol. 2013, 82, 342–348. [Google Scholar] [CrossRef]
- El Hassani, A.; El Hassouni, M.; Jennane, R.; Rziza, M.; Lespessailles, E. Texture Analysis for Trabecular Bone X-Ray Images Using Anisotropic Morlet Wavelet and Rényi Entropy. In Image and Signal Processing, Proceedings of the 5th International Conference on Image and Signal Processing, Agadir, Morocco, 28–30 June 2012; Elmoataz, A., Mammass, D., Lezoray, O., Nouboud, F., Aboutajdine, D., Eds.; Springer: Berlin, Germany, 2012; pp. 290–297. [Google Scholar]
- Kołaciński, M.; Kozakiewicz, M.; Materka, A. Textural entropy as a potential feature for quantitative assessment of jaw bone healing process. Arch. Med. Sci. 2015, 11, 78–84. [Google Scholar] [CrossRef]
- Shamir, L.; Wolkow, C.A.; Goldberg, I.G. Quantitative measurement of aging using image texture entropy. Bioinformatics 2009, 25, 3060–3063. [Google Scholar] [CrossRef]
- WMA. World Medical Association Declaration of Helsinki: Ethical principles for medical research involving human subjects. J. Am. Med. Assoc. 2013, 310, 2191–2194. [Google Scholar] [CrossRef]
- Kvandal, P.; Landsverk, S.A.; Bernjak, A.; Stefanovska, A.; Kvernmo, H.D.; Kirkebøen, K.A. Low-frequency oscillations of the laser Doppler perfusion signal in human skin. Microvasc. Res. 2006, 72, 120–127. [Google Scholar] [CrossRef]
- Gonzalez, R.; Woods, R.E.; Eddins, S.L. Digital Image Processing Using MATLAB, 2nd ed.; Gatesmark Publishing: USA, 2009. [Google Scholar]
- Ferreira, H.; Rodrigues, F.; Meyer, M.; Santos-Ribeiro, A.; Gonçalves-Pereira, P.; Manaças, R.; Andrade, A. Complexity analysis of resting-state networks. MAGMA 2013, 26, 2013. [Google Scholar]
- Gabrielsen, A.; Norsk, P. Effect of spaceflight on the subcutaneous venoarteriolar reflex in the human lower leg. J. Appl. Physiol. 2007, 103, 959–962. [Google Scholar] [CrossRef] [PubMed]
© 2020 by the authors. Licensee MDPI, Basel, Switzerland. This article is an open access article distributed under the terms and conditions of the Creative Commons Attribution (CC BY) license (http://creativecommons.org/licenses/by/4.0/).