1. Introduction
Multimaterial waste is a significant group of waste that requires the application of special recycling techniques in order to reduce its negative impact on the environment [
1]. In general, it is made of at least two different materials connected permanently [
2]. According to the regulations (Polish Act of 13 June 2013 on Packaging and Packaging Waste and Polish Act of 14 December 2012 on Waste), it is treated like the material that is present in the highest amount, i.e., if the material consists of 70% paper and 30% plastic it should be treated like paper and collected in the designated container [
3,
4].
The European Union’s strategy in the plastics field is closely linked to the circular economy. This strategy pays special attention to plastic recycling and the possibilities of reducing it. Currently, 59% of plastic products are plastic packaging, including blisters for drugs, which are very difficult to manage. Packaging recycling is very difficult, but the pyrolysis of waste medicine blisters is one of the answers to the challenges of the circular economy. In the future, the process proposed in this article can be treated as a closed circuit in this group of packaging waste.
Waste pharmaceutical blisters (WPBs) are a type of multimaterial waste. They are the most commonly used type of packaging to store pharmaceutical products [
5,
6]. They contain approx. 80% thermoformable plastic films (usually polypropylene (PP) and pure polyvinyl chloride (PVC), or polyvinyl with diaphone addition (PVC/PVDC) or chlorotrifluoroethylene PVC/CTFE)) and 20% aluminum alloy (containing approx. 85% Al, 11,5% Mg, and 0,8% Ti) [
7,
8]. The type of plastic used to produce the blister is usually chosen based on moisture permeability, which has a huge influence on the durability of the products and the price. In order to provide the highest protection from external conditions, the companies sometimes use the Al/Al type blisters, which contain polyamide, aluminum, and PVC. Two layers of aluminum protect the products from moisture, which may decompose the active ingredients and affect the expiration date of the medicine, oxygen, and sunlight [
9].
Currently, used blisters are either treated as plastic waste or collected at pharmacies together with the expired medicine and directed to thermal utilization plants, where metal is not recovered [
4,
10]. As for most multimaterial waste, the mechanical separation of the materials used to produce them is complicated or, sometimes, impossible [
11]. Therefore, in order to comply with the circular economy requirements, WPBs require a special treatment to efficiently recycle both metal and plastic fractions [
12,
13]. Wang et al. [
5] analyzed the hydrometallurgical method to recycle waste blisters. The method was based on the leaching of 1 cm x 2 cm pieces of WPBs in hydrochloric acid. Under optimum conditions, this method allowed to separate as much as 100% of plastic from the metal. The obtained aluminum was of excellent quality, but the metal recovery required additional steps, i.e., precipitation, solvent extraction, adsorption, or the application of the ion-exchange method. Also, large amounts of HCl were required to separate the materials. Yin et al. [
14] analyzed the thermal method of aluminum recovery, which also generates high-quality gaseous fuel. The material used in the research was a similar multimaterial packaging waste used to store face mask sheets—a postconsumer Neutrogena face mask packaging made of aluminum foil, PET (polyethylene terephthalate), and PP (polypropylene). The produced aluminum was characterized by a high purity and an extremely low surface oxidation level. The process also resulted in the production of 67 wt% of hydrocarbon gases, which can be used as a fuel.
Pyrolysis is a thermal decomposition process that occurs in the absence of oxygen. The products can be divided into a solid, a liquid, and a gaseous fraction. The solid fraction may contain the materials that do not pyrolyze, i.e., metals, which can be easily separated from the char and recovered in a simple metallurgical process. In addition, other products can be further used, i.e., as a fuel or carbon black [
15]. This paper is focused on the gases generated during the process. If their quality is high enough, the gases can be used as a fuel, i.e., to generate heat for the pyrolysis. Such a holistic approach can contribute to making even a thermal process sustainable.
2. Materials and Methods
The literature provides no detailed information about the composition of the gases generated during the pyrolysis of WPBs. The presented research was focused on the analysis of the influence of the process temperature on the composition of the gases, with a special focus on hydrocarbons. Two waste materials were analyzed in order to determine the potential influence of the trace amounts of medical products on the quality of the gases. The potential of the process gases to be used as a fuel, individually or mixed with natural gas, was analyzed.
2.1. Materials
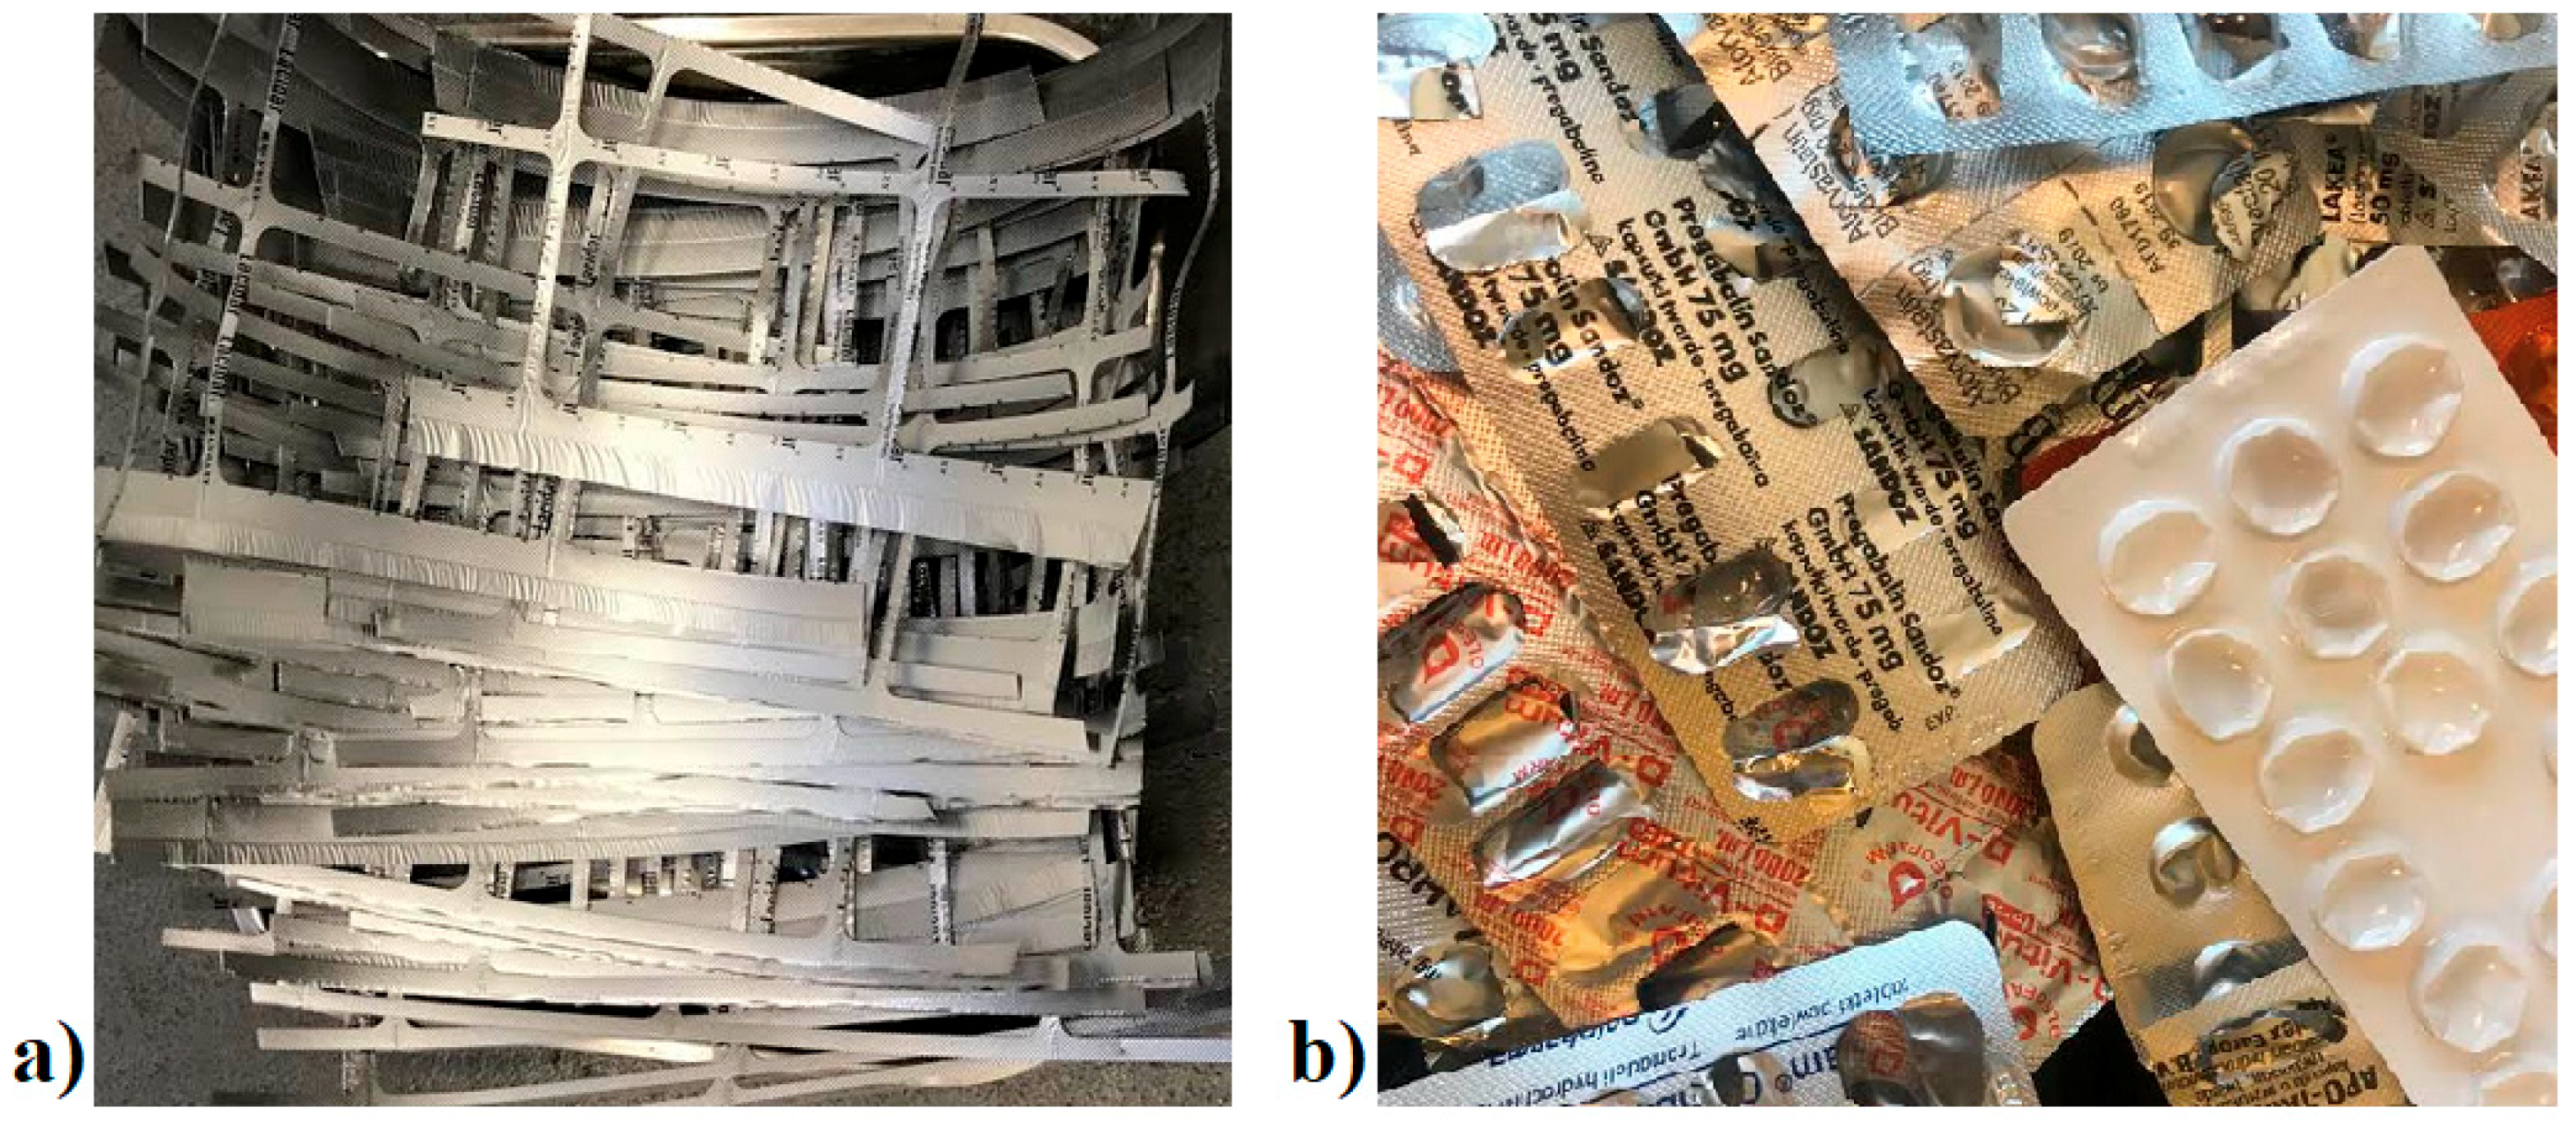
Two waste materials were analyzed—pre- and postconsumer waste. The preconsumer WPBs, delivered by the manufacturer of a dietary supplement, were collected after the production line. The preconsumer waste had no contact with the product, and the plastic used as a lidding material was transparent.
Postconsumer WPBs included various mixed pharmaceutical blisters after the medicines had been removed. The material had contact with various products and was not washed before the analysis, in order to provide a reliable source of information that could be used for a real process. The analyzed portion of the mixed types of blisters contained:
The illustrative pictures of the pre- and postconsumer waste used for the tests are presented in
Figure 1.
Both materials were analyzed for the content of the basic elements. The results of the analysis are presented in
Table 1.
The contents of carbon (approx. 45%), hydrogen (approx. 4%), nitrogen (below 1%), and sulfur (approx. 11%) were similar for both materials. The differences were mainly caused by the impurities present in the postconsumer waste as a result of the contact with the pharmaceutical products. The chlorine content in preconsumer waste was much higher (approx. 44%) than that found in postconsumer waste (35%). The reason for such differences was the lidding material. For preconsumer waste, the results suggest that PVC was the main material, while postconsumer waste contained various materials. However, the high chlorine content suggests that PVC was one of the most commonly used materials.
2.2. Experimental Method
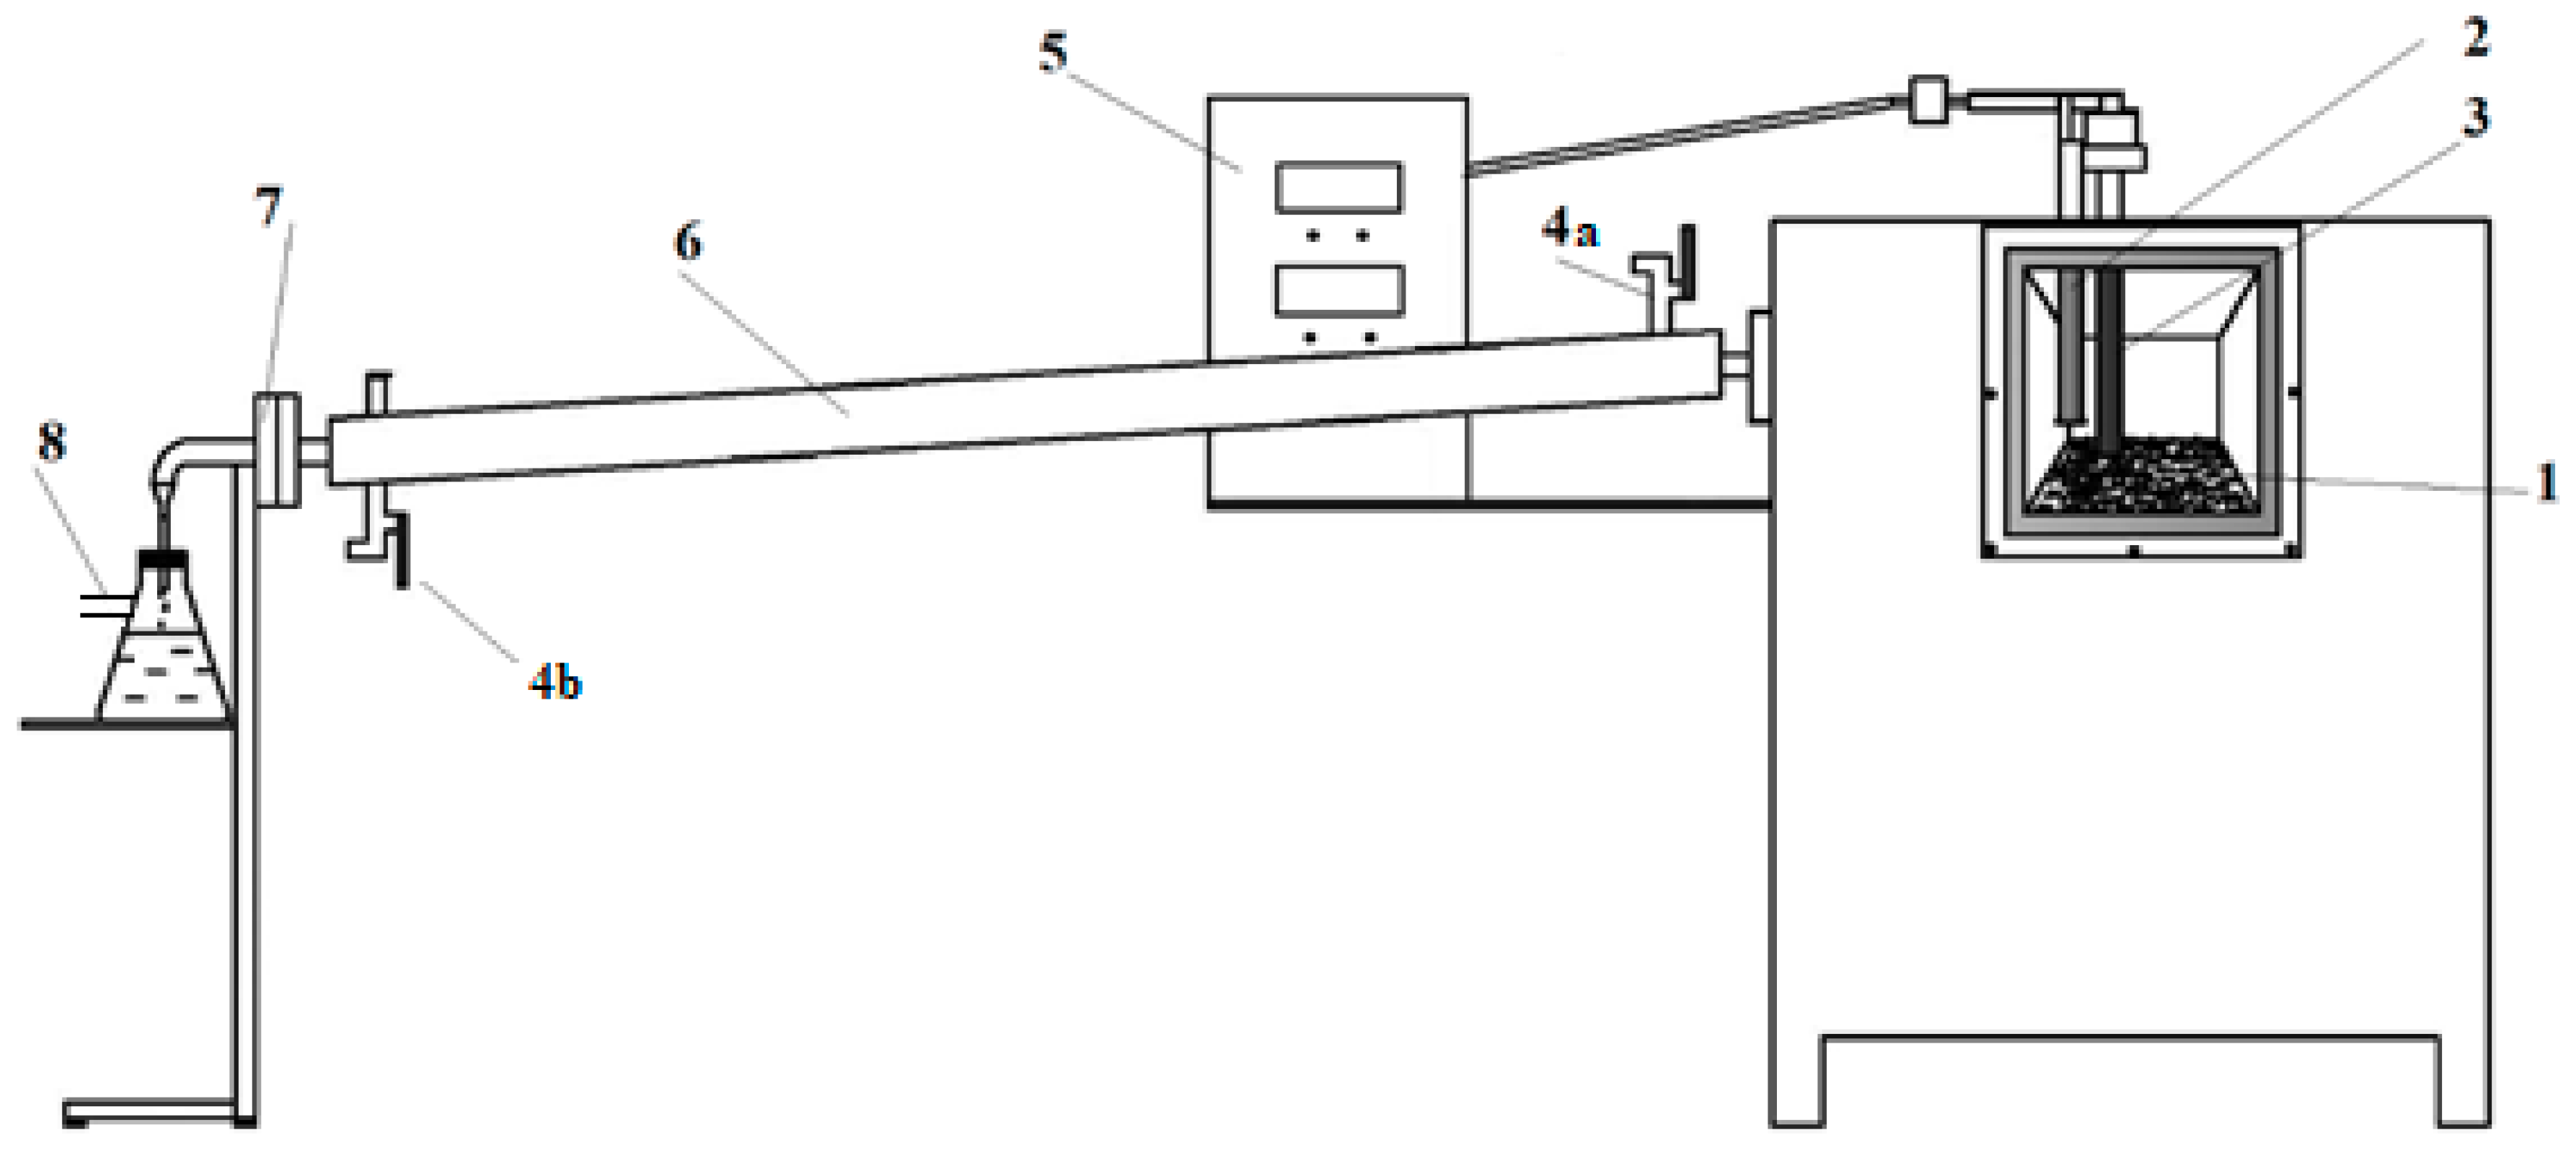
The materials were subjected to the pyrolysis process at three temperatures—400 °C, 425 °C, and 450 °C—in a laboratory-scale furnace. The thermocouple was located in the central part of the reaction chamber. The scheme of the reactor is presented in
Figure 2. During each test, the sample weight was precisely 150 g. The process temperature was controlled with two thermocouples—one thermocouple, located on the bottom of the reaction chamber, measured the temperature inside the sample, while a second thermocouple, located in the central part of the reaction chamber, measured the process temperature. The thermocouples were automatically calibrated each time the equipment was switched on.
During each test, three gas samples were collected in order to determine their composition. The gases were analyzed for the content of hydrocarbons (CH4, C2H6, C2H4, C3H8, C3H6, C4H10, C4H8, C4H4, C5+) and inorganic compounds (H2, O2, N2, CO, and CO2) in order to determine their potential to be used as a fuel (i.e., natural gas substitute). The gases were collected at the beginning of the process, in the middle of the process, and after the maximum temperature was reached, into 0.5 and 0.2 dm3 glass pipettes equipped with two cut-off valves. The gases were injected into the analyzers with the application of the hydrostatic pressure method, performed with a liquid (brine) introduced from the bottom of the container. The gases were injected into the analyzer from the second valve.
The gases were analyzed with the application of gas chromatography using two separate sections supplied with a carrier gas (high-purity argon). Hydrocarbons were analyzed on the Alumina packed column (l = 2 m; d = 1 mm) with FID (flame ionization detector). Inorganic ingredients were analyzed on the Carbosphere column (2 m; 3 mm) with a TCD (thermal conductivity detector). The gas composition was determined with the application of the external standard with the relative response rates. The relative uncertainty of the measurement was 2%.
3. Results
The tests were performed in two series. Series 1 refers to the preconsumer waste. Series 2 refers to the postconsumer waste. During each series, the tests were performed for three maximum process temperatures: 400 °C, 425 °C, and 450 °C. Also, three gas samples were collected during each test: at the beginning of the process, during the process, when the decomposition was the most rapid, and after the maximum temperature was reached. The moment of most rapid mass loss in the sample was determined based on the thermogravimetric study [
9].
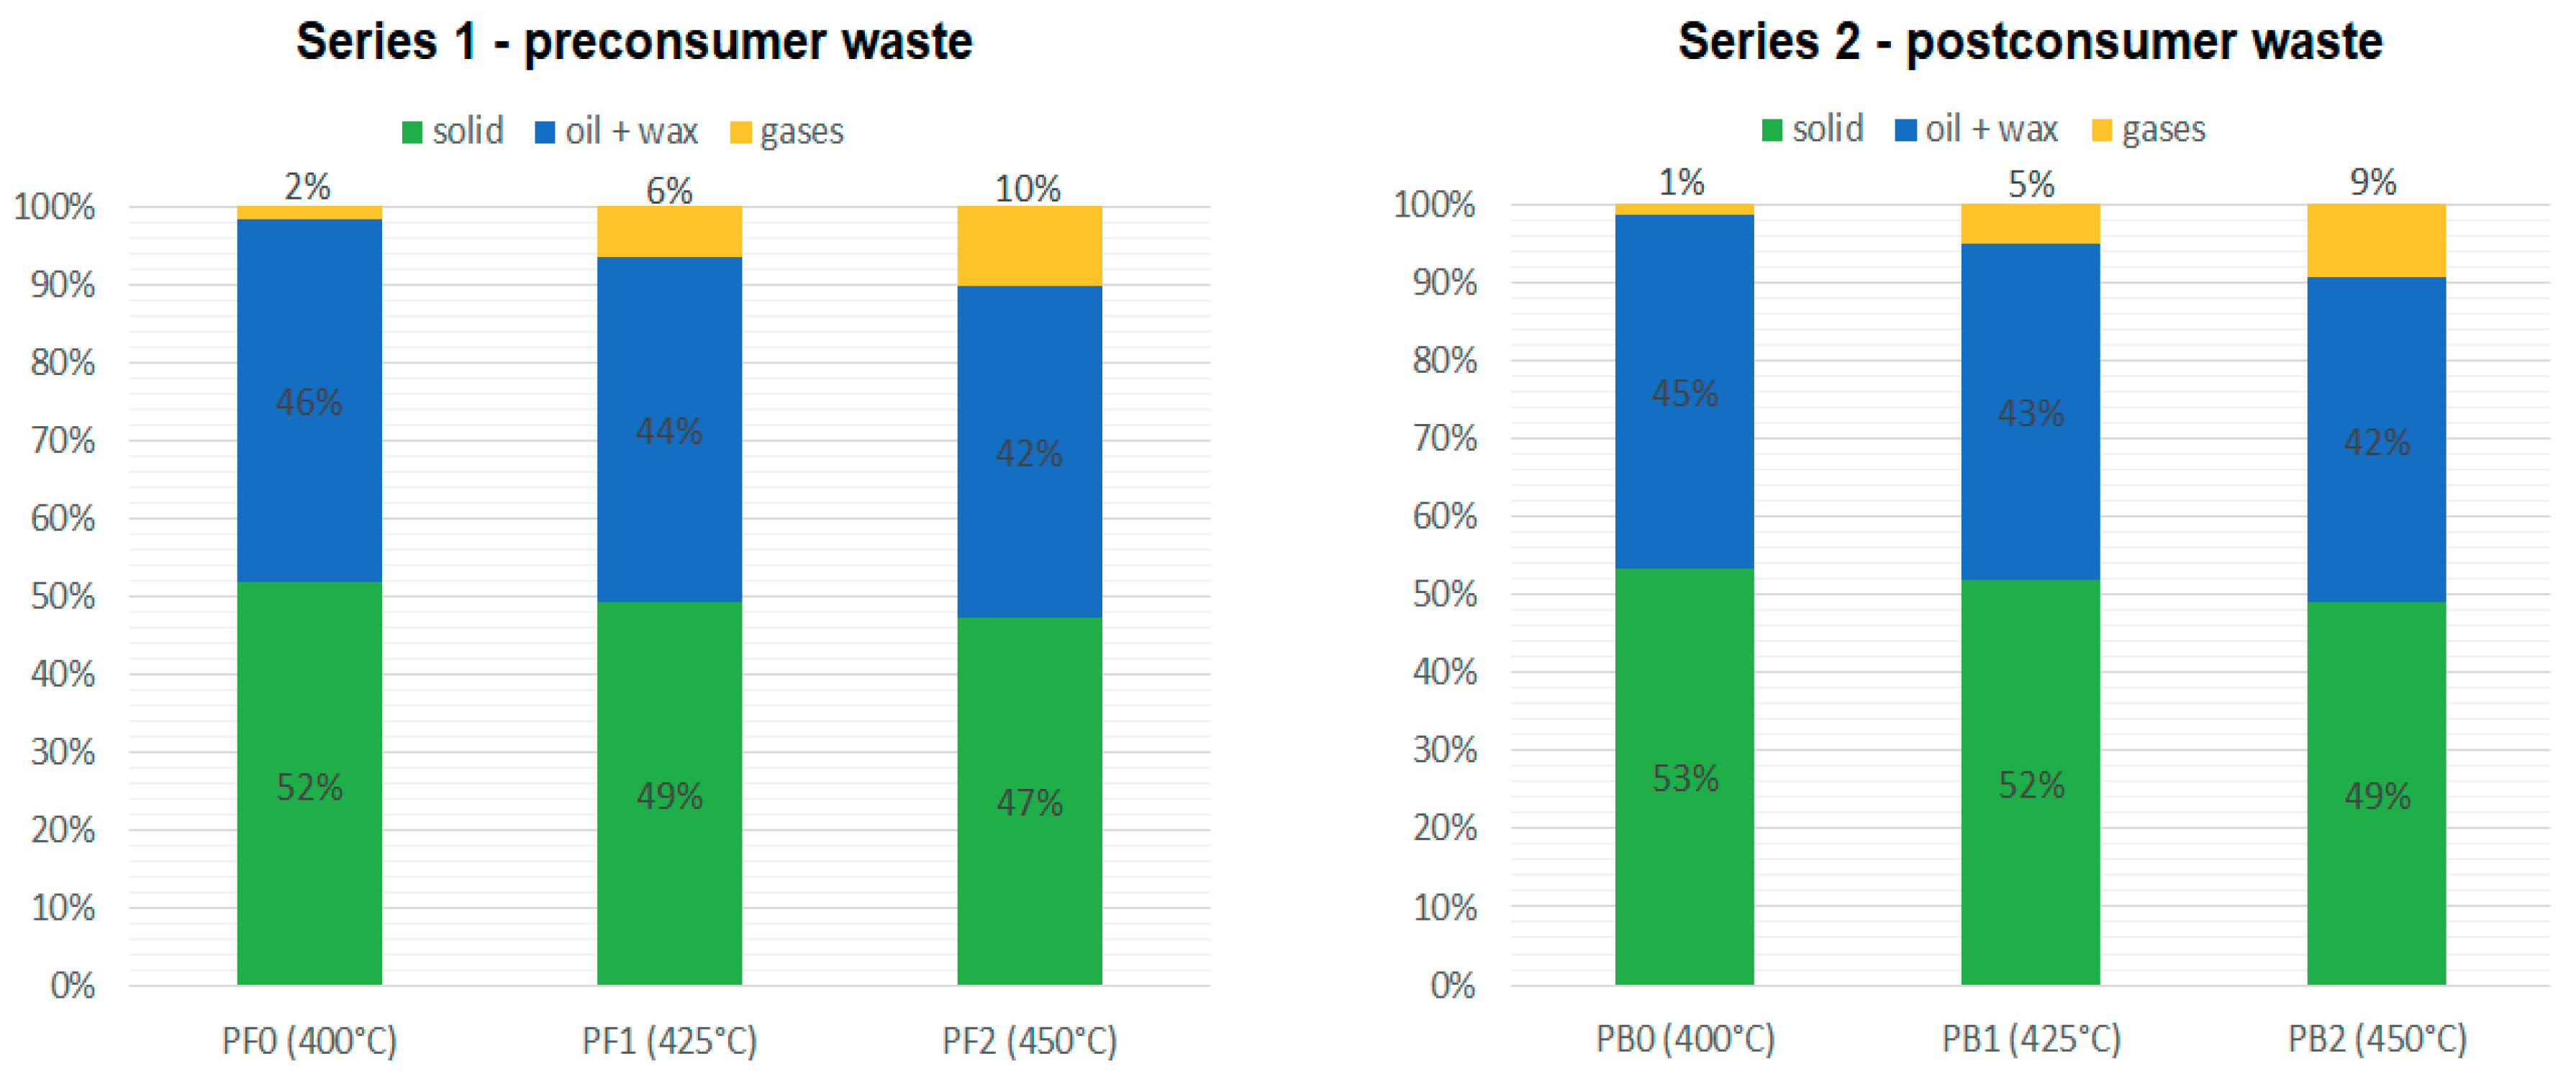
The solid and liquid products were weighed after the process, after the reactor was cooled to room temperature. The mass of the generated gases was calculated based on the measurements. The mass diagrams for the products obtained from series 1 and 2 are presented in
Figure 3.
The amount of generated gases increased with temperature both during series 1 and 2. At the lowest temperatures, the amount of generated gases was very small. The process performed at lower temperatures is most likely to generate more oil and solid products. This may also suggest that at lower temperatures, not all the material was decomposed. Higher temperatures generate more gases and less oil and solid products.
Slightly more gases and liquid fraction have been generated during the pyrolysis of the preconsumer waste, while the postconsumer waste generated more solid products (aluminum and char). However, those differences were almost negligible. Therefore, there was almost no difference between the yields and the quality of the products generated during the pyrolysis of pre- and postconsumer waste. It seems that the trace amounts of pharmaceutical products left on the used blisters did not affect the process and the quality of the products.
For series 1 (preconsumer waste), the concentration of hydrocarbons increased with the temperature. The total content of hydrocarbons at max. temperature 400 °C was 19.5%, 25.9% at 425°C, and 26.2% at 450°C. The oxygen content at the beginning of the process was neglectable. Nitrogen content in the gases decreases during the process. The amount of CO in the gases was higher at higher temperatures. Based on the results it can be concluded that the quality of the gas as a fuel increases with the process temperature.
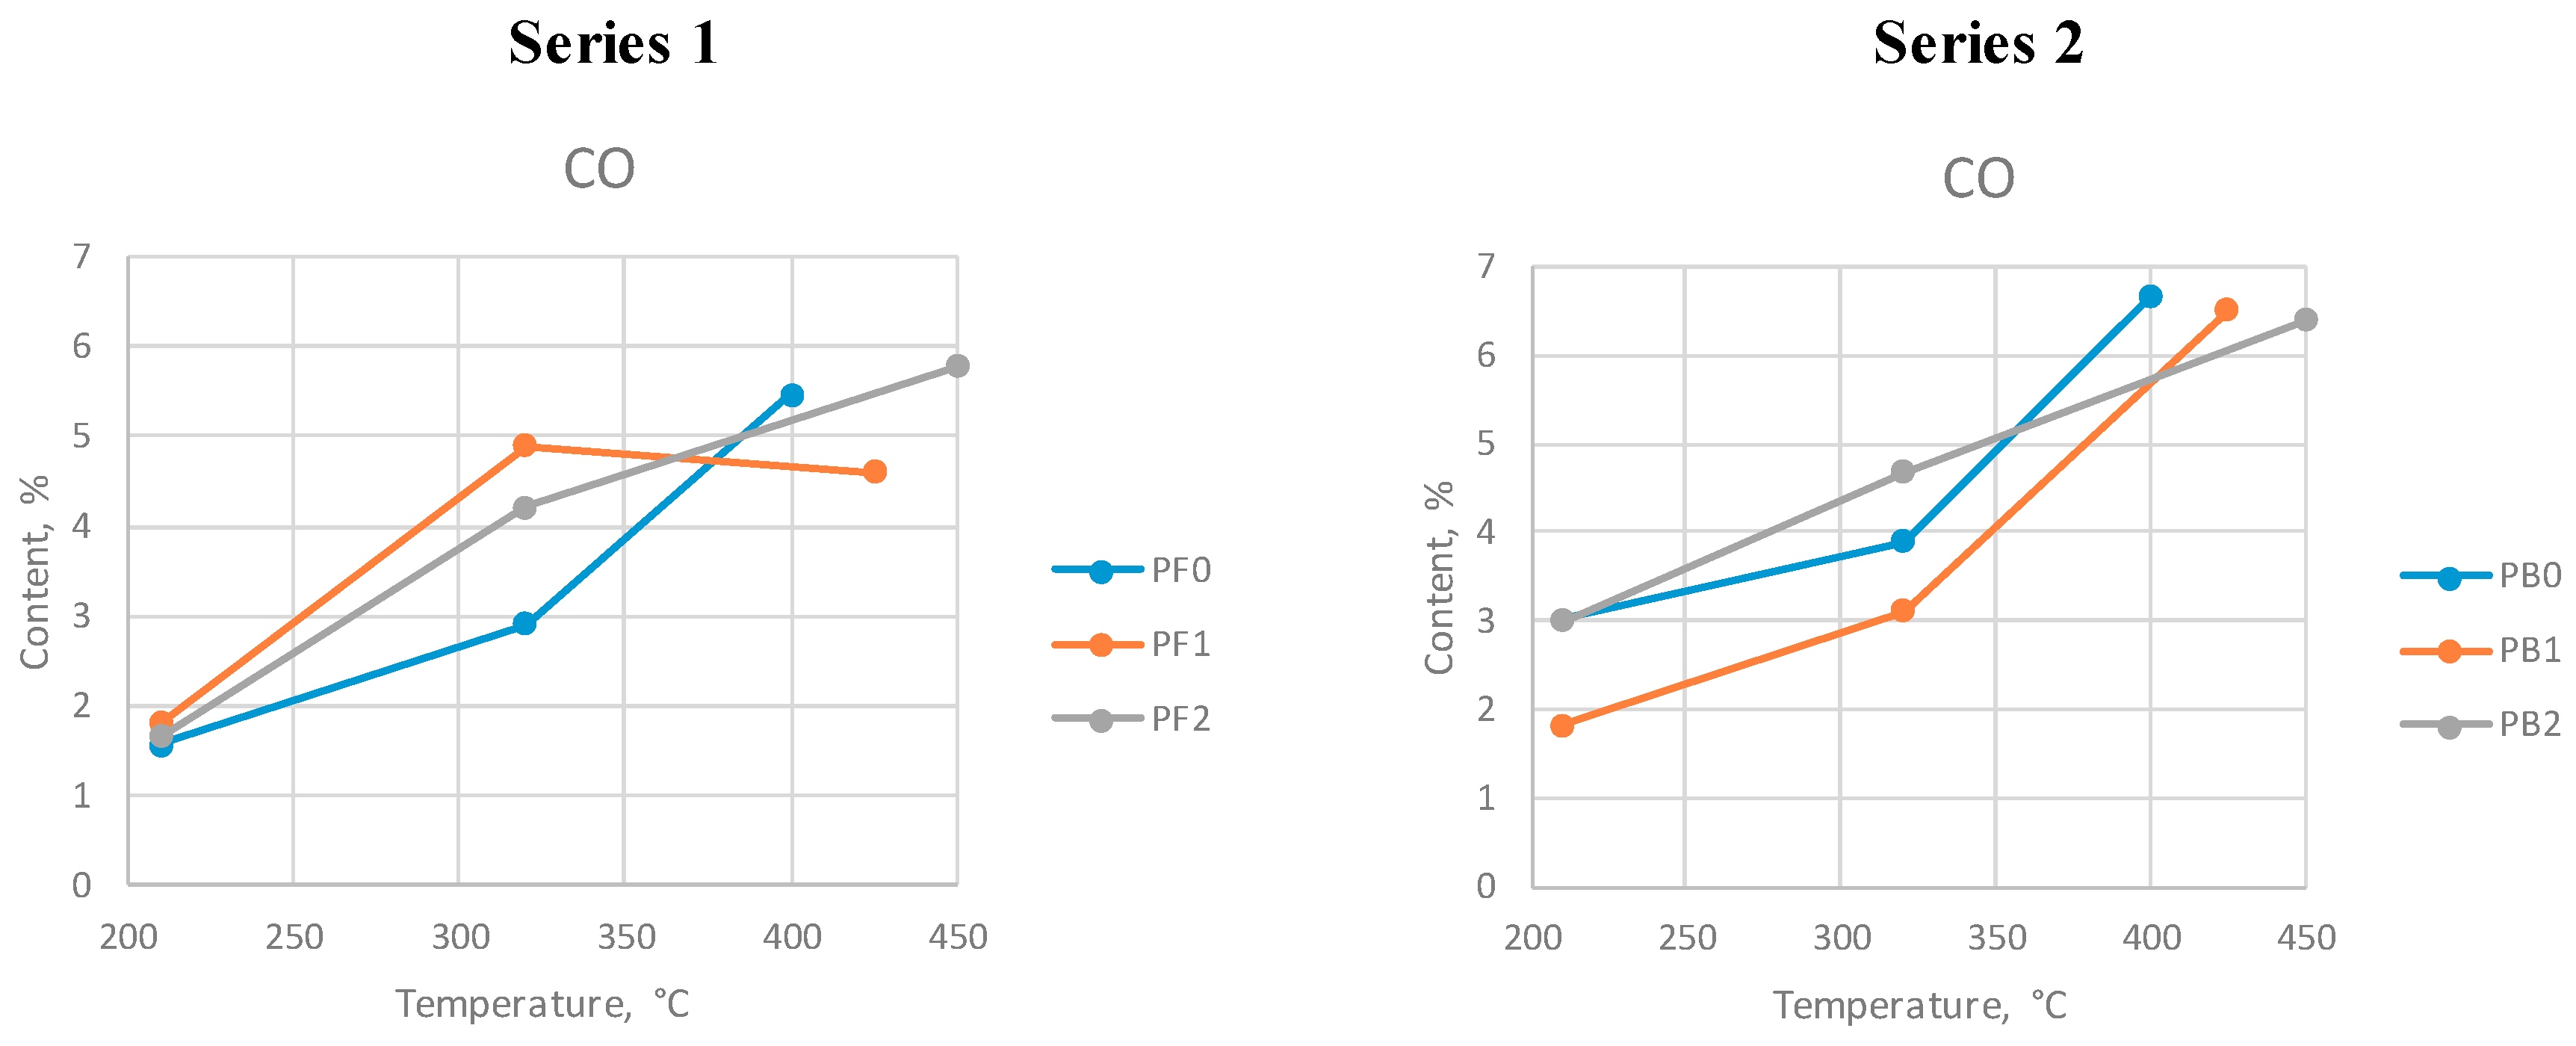
Similarly to what happened in series 1, in series 2 the content of hydrocarbons increased with the temperature. The concentration at max. temperature 400 °C was 16.4%, 23% at 425 °C, and 25.6% at 450 °C. The nitrogen content decreased during the process. For the mixed waste pharmaceutical blisters, the amount of generated CO at different max. temperatures was almost constant, while the CO2 content increased. This may have been caused by the fact that the material contained trace amounts of pharmaceutical products that may react more quickly than plastic. Another possible explanation is that some oxygen may have penetrated into the gas cooler and reacted with other gas components.
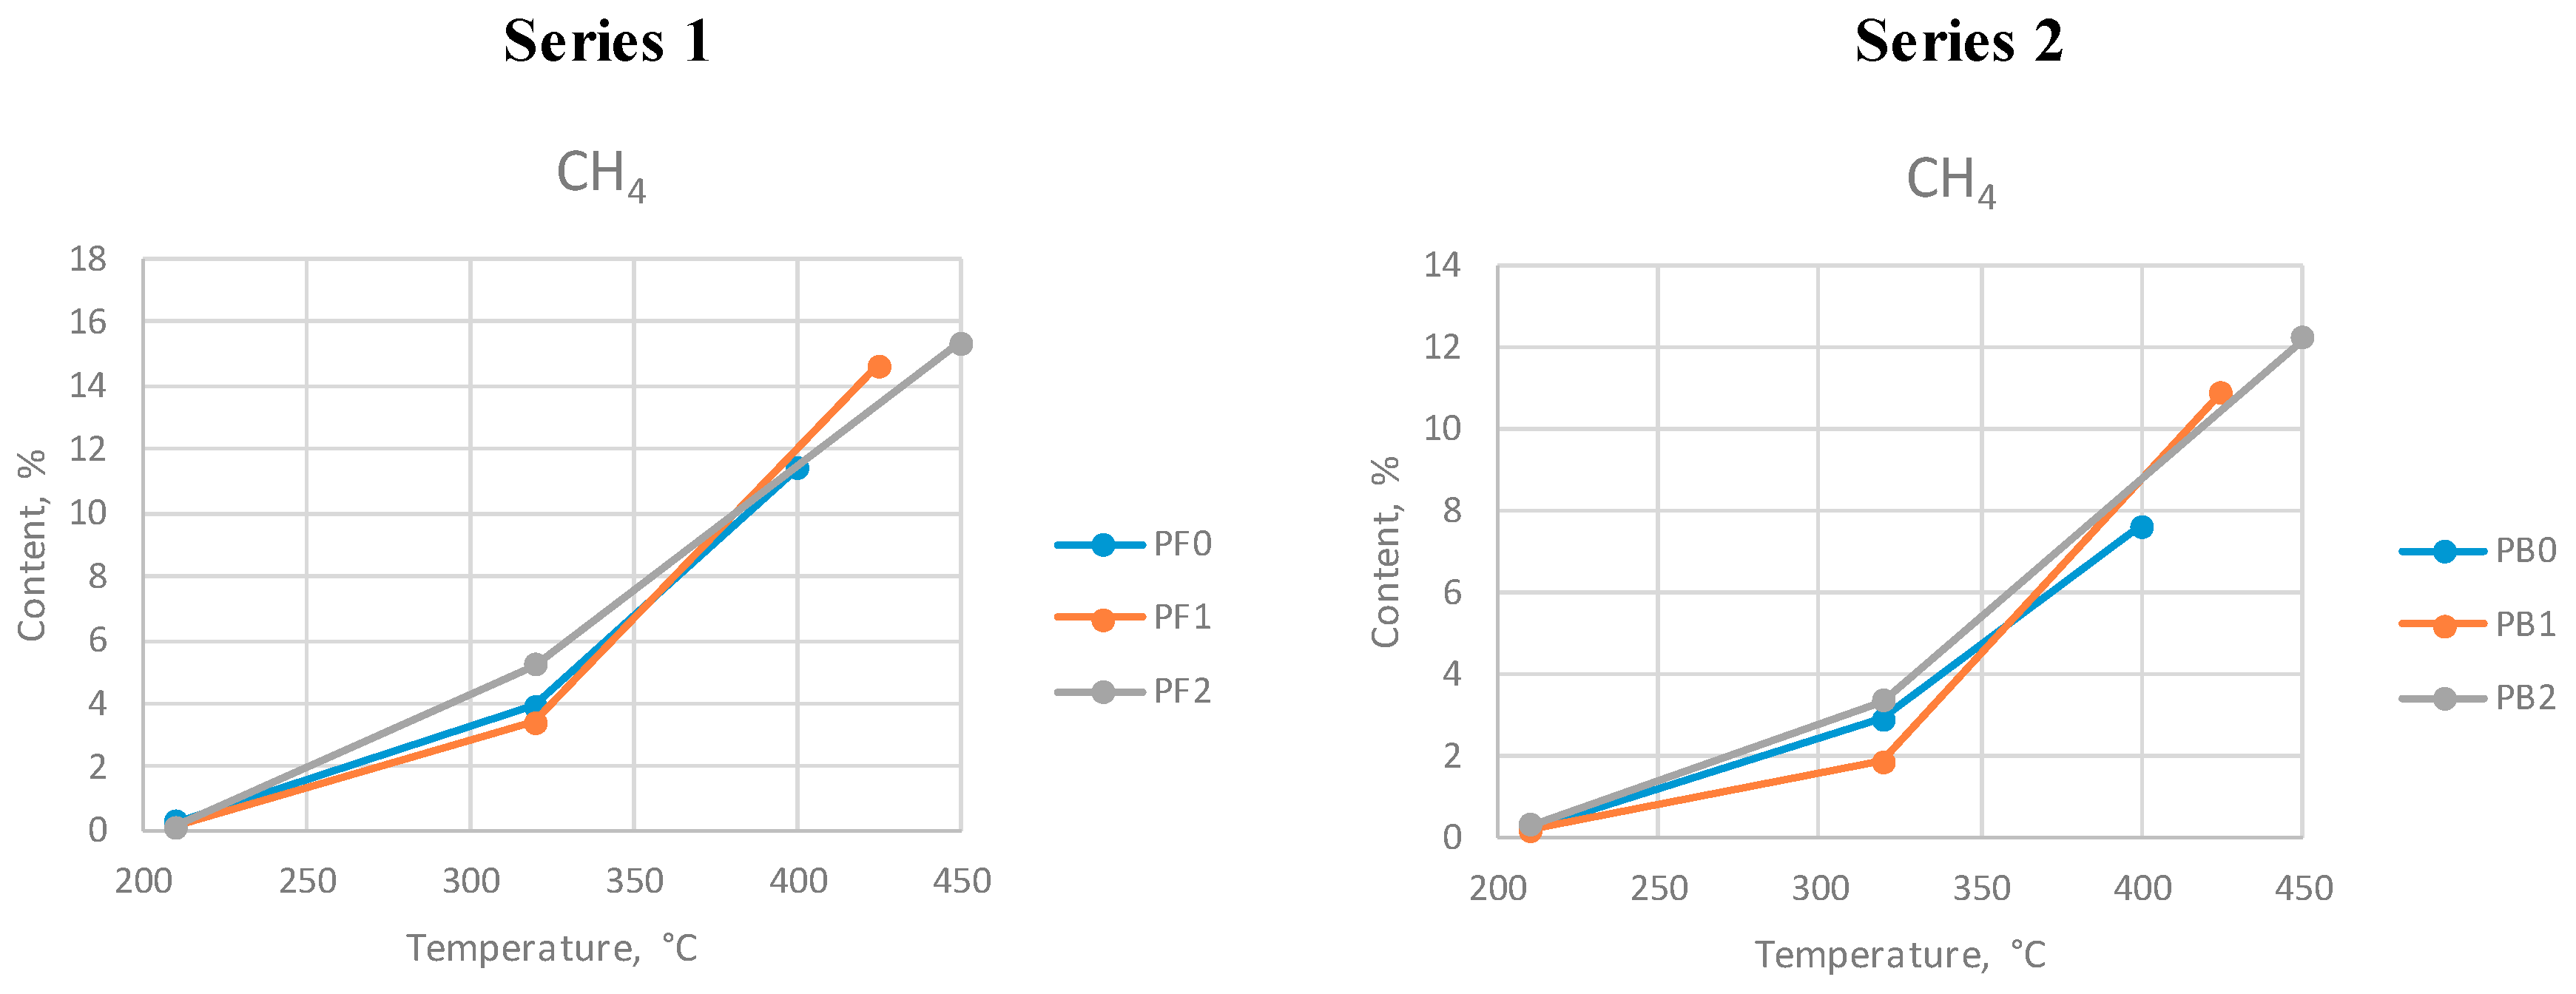
The diagrams showing the changes in the contents of the selected gas compounds are presented in
Figure 4,
Figure 5 and
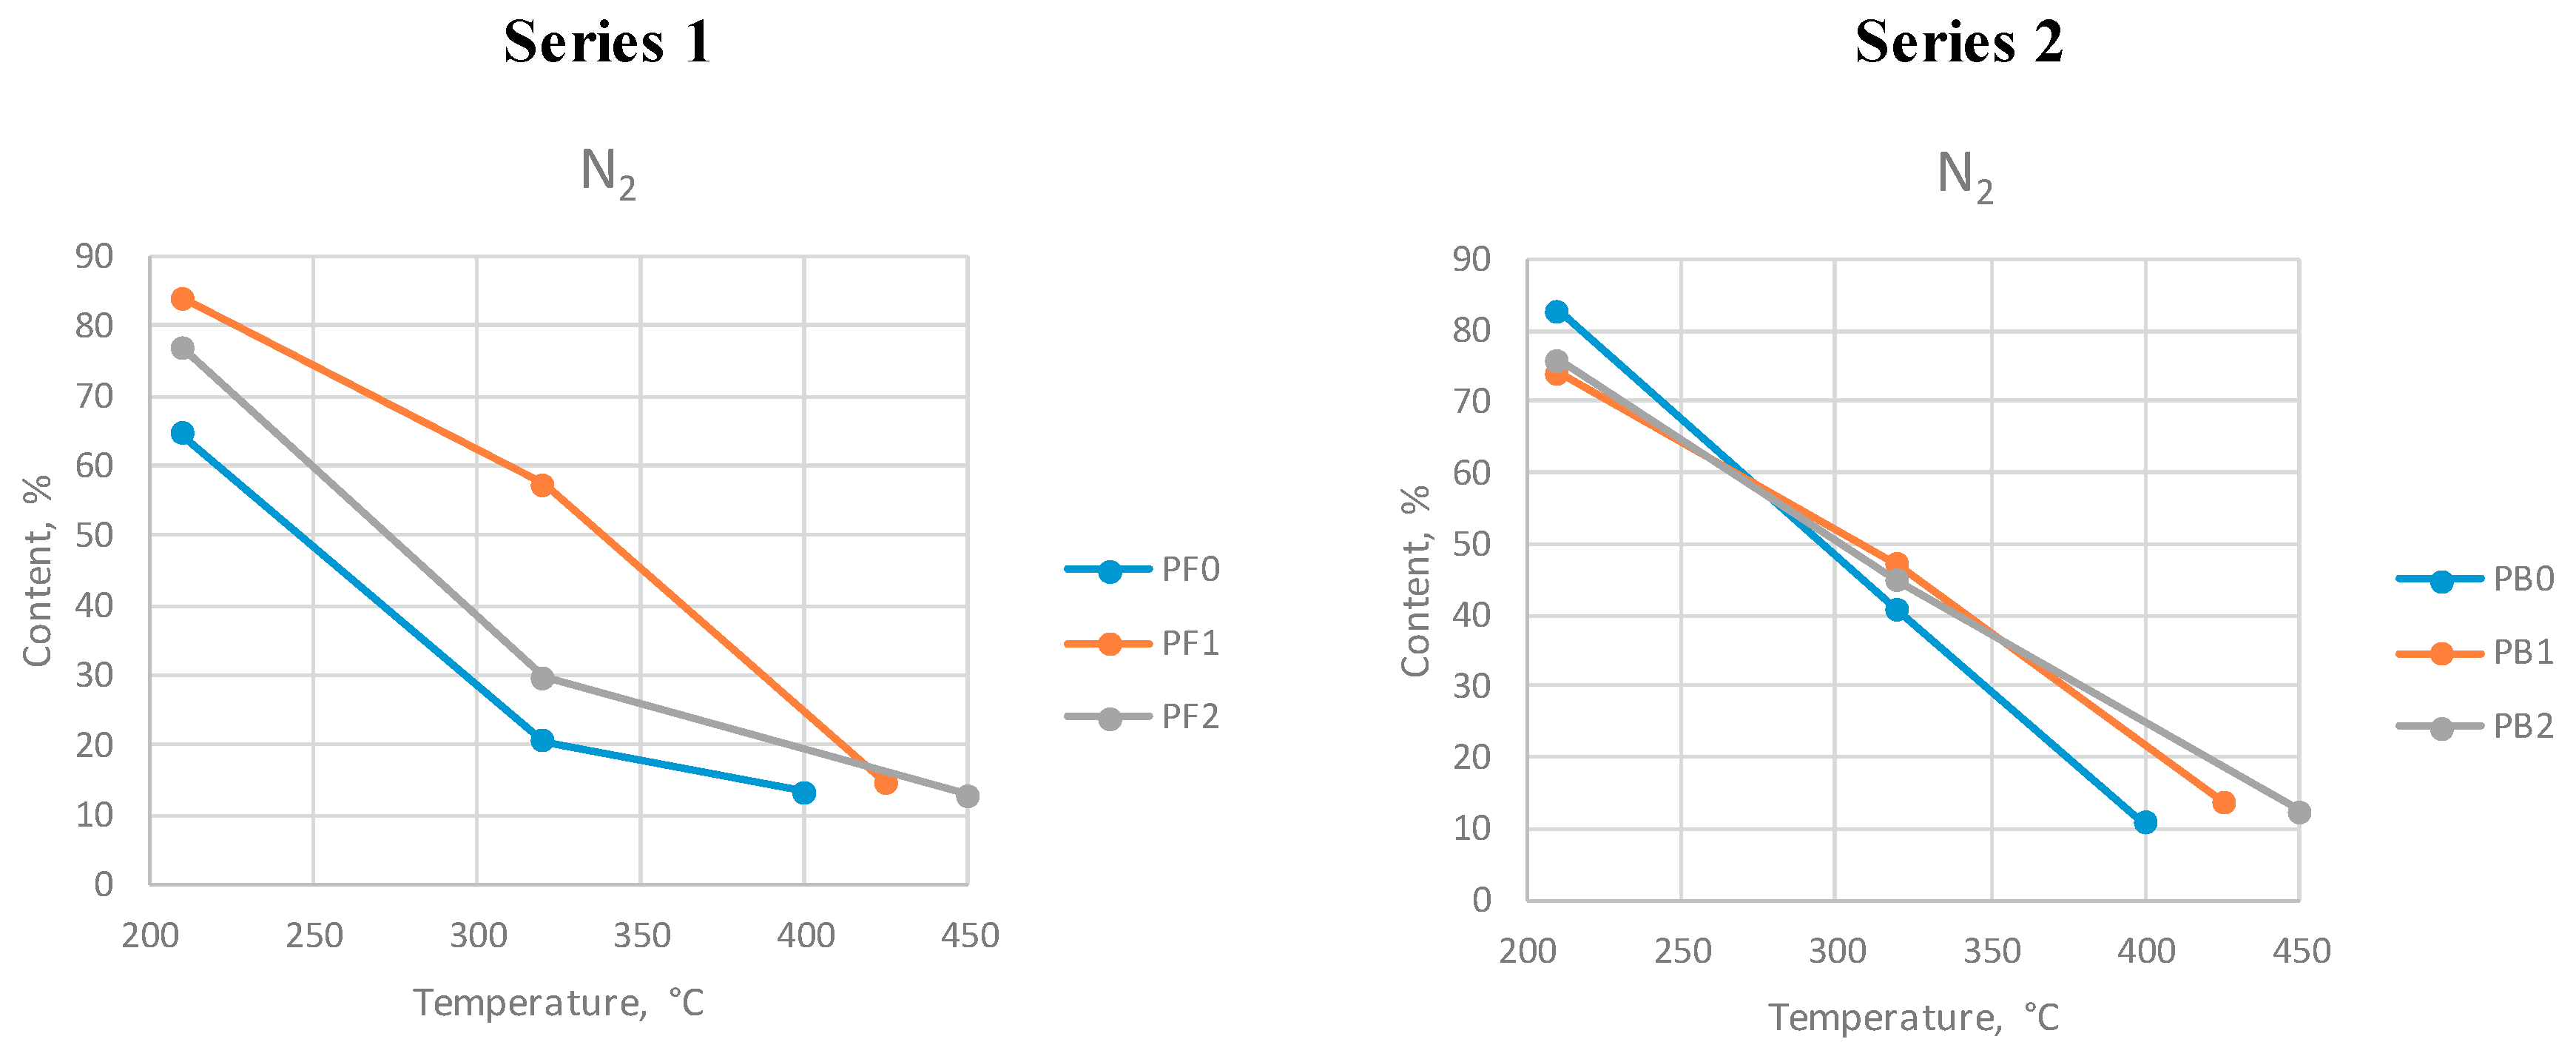
Figure 6. Tests PF0 and PB0 were performed at a maximum temperature of 400 °C. Tests PF1 and PB1 were performed at the max. temperature 425 °C, and tests PF2 and PB2 were performed at the max. temperature 450 °C.
Methane is the main hydrocarbon generated during the process. Preconsumer waste generated more methane than postconsumer WPBs. The highest amount of this gas was generated at the highest temperature for both series.
More carbon oxide was generated during series 2. The CO content increased at higher temperatures for all tests except in series 1 at 425 °C, where its concentration slightly decreased.
The nitrogen content decreased with temperature during both series. The minimum level (approx. 10%) has been reached by the end of each process. The level of nitrogen was high at the beginning of the process, which was caused by the presence of this gas in the atmospheric air. As the process proceeded and the gases were generated, nitrogen was removed from the reactor.
In order to confirm that the gas quality as a fuel increases with the max. process temperature, the calorific value was calculated according to the equation:
where:
CV—calorific value of the gas generated during pyrolysis,
M—mass fraction of the gas component,
CVi—calorific value of the gas component.
The calculated calorific values of the gases for series 1 and 2 at three temperatures—at the beginning of the process, during the process, and after reaching the maximum temperature—are presented in
Table 8 and
Table 9, respectively.
The calorific value of the gases increased with the duration of the process and the maximum process temperature. The highest calorific values for both series could be observed at the maximum process temperatures. The highest value was obtained during the pyrolysis of mixed postconsumer waste. The highest quality of the gaseous products was observed for the tests performed at the highest maximum temperature on the postconsumer waste. Such results suggest that, when considering a potential technology for WPB processing with the production of a gaseous fuel, the most favorable conditions for the production of gases would be at higher temperatures. However, it needs to be stressed that this maximum calorific value cannot be maintained during the whole process. The process needs to be continuous in order to provide the highest calorific value possible. This would require a constant batching of the input material and a simultaneous removal of the solid products.
4. Conclusions
Due to the depleting sources of raw materials and fossil fuels, the recovery of material resources as well as energy is of high importance for the circular economy. Providing a high efficiency of material recovery as well as energy efficiency can help maintain the natural environment. The fractions present in multimaterial waste, due to their composition and production methods, cannot be easily separated only with the application of simple mechanical methods. Therefore, it is highly important to develop a technology for their processing. Pyrolysis is a thermal process that can be used to separate plastic from the metal fraction of waste pharmaceutical blisters in order to recover aluminum and generate gaseous fuel. Within the presented research, two types of waste pharmaceutical blisters were pyrolyzed at three maximum temperatures: 400 °C, 425 °C, and 450 °C. The gases used for the analysis were collected at the beginning and during the process and after the maximum process temperature was reached. The analysis of the chemical composition of the gases was performed with the application of chromatography.
A higher temperature favors the production of larger amounts of process gas rather than oil and wax. In addition, the calorific value of the gas at the maximum temperature 450 °C is higher (21.96 MJ/m3) for the mixed postconsumer waste than for the clean preconsumer material (20.14 MJ/m3).
One of the goals of the study was to determine whether the presence of trace amounts of medical products as well as the more complex character of the postconsumer material influence the process products. No significant differences in the process performed on the clean preconsumer waste and postconsumer waste contaminated with the trace amounts of pharmaceutical products have been observed. The results suggest that there is no necessity to wash the blisters before thermal process, since the impurities do not affect the quality of the gas. In order to provide the optimal conditions for the production of gaseous fuel, the process should be carried out at 450 °C.
Most EU-level documents show that there is a need for multisectoral research in value chains, going beyond waste management, the environment, and active building of consumer awareness toward the acceptance of a circular economy. Each element, which is part of the concept of qualitative recycling, directed at waste that is difficult to manage, will be an indispensable element in building a full circular economy [
16,
17,
18,
19,
20]. The presented research results have the potential to be implemented and are part of the circular economy.
Author Contributions
Conceptualization, K.P., K.K., and W.Ś.; methodology, W.Ś.; validation, K.S.; investigation, K.K. and K.S.; resources, K.K. and K.P.; data curation, K.K., K.S., and M.B.; writing and original draft preparation, K.K.; writing, review, and editing, W.Ś. and M.B.; supervision, K.P. and W.Ś. All authors have read and agreed to the published version of the manuscript.
Funding
The study was funded by the Ministry of Science and Higher Education under the project “Charakterystyka produktów termicznego rozkładu wielomateriałowych odpadów opakowań po produktach farmaceutycznych (Characterization of the products of thermal decomposition of multimaterial pharmaceutical packaging waste)” and research-funded by subsidies granted for the year 2019 to the Department of Technology and Installations for Waste Management, Silesian University of Technology.
Conflicts of Interest
The authors declare no conflicts of interest.
References
- Klejnowska, K.; Lewandowski, D. Aluminum Recovery From Multimaterial Tetra-Pak Waste Pyrolysis. Civ. Env. Eng. Rep. 2019, 29, 39–52. [Google Scholar] [CrossRef]
- Wzorek, M.; Koziol, M.; Ścierski, W. Emission characteristics of granulated fuel produced from sewage sludge and coal slime. J. Air. Waste Manag. Assoc. 2010. [Google Scholar] [CrossRef] [PubMed]
- Rosik-Dulewska, C. Podstawy Gospodarki Odpadami; Wydawnictwo Naukowe PWN: Warszawa, Poland, 2007. [Google Scholar]
- Landrat, M. Termiczne właściwości odpadowych tworzyw sztucznych. Przem. Chem. 2018, 97, 1496–1498. [Google Scholar] [CrossRef]
- Wang, C.; Wang, H.; Liu, Y. Separation of aluminum and plastic by metallurgy method for recycling waste pharmaceutical blisters. J. Clean. Prod. 2015, 102, 378–383. [Google Scholar] [CrossRef]
- Czop, M. Select polymer wastes as possible sources of solid recovered fuels. Pol. J. Environ. Stud. 2014, 23, 1369–1372. [Google Scholar]
- Pilchik, R. Pharmaceutical Blister Packaging, Part I and II. Pharm. Technol. 2000, 24, 56–60. [Google Scholar]
- Dobrucka, R. Recent trends in packaging systems for pharmaceutical products. Sci. J. Logist. 2014, 10, 393–398. [Google Scholar]
- Klejnowska, K.; Pikoń, K.; Ścierski, W.; Zajączkowski, A. Termiczny rozkład wielomateriałowych odpadowych opakowań po produktach farmaceutycznych. Przem. Chem. 2019, 98, 1414–1416. [Google Scholar] [CrossRef]
- Czop, M.; Pikoń, K.; Bogacka, M. Optimization of polyethylene waste utilization methods from disposable packaging. Przem. Chem. 2015, 94, 1503–1505. [Google Scholar]
- Landrat, M. Possibilities of polyphenol floral foam waste utilization. Przem. Chem. 2017, 96, 1704–1706. [Google Scholar]
- Piontek, W.; Jarzębowski, S. Analiza Warunków Przetwarzania Odpadów Opakowaniowych Po Środkach Niebezpiecznych Oraz Odpadów Po Opakowaniach Wielomateriałowych w Polsce; National Fund for Environmental Protection and Water Management: Warszawa, Poland, 2015. [Google Scholar]
- Nawrocki, T. Blistry—Najpopularniejsze opakowania leków. Aptekarz Pol. 2014, 2, 30–32. [Google Scholar]
- Yin, S.; Rajarao, R.; Gong, B.; Wang, Y.; Kong, C.; Sahajwalla, V. Thermo-delamination of metallised composite plastic: An innovative approach to generate Aluminium from packaging plastic waste. J. Clean Prod. 2019, 211, 321–329. [Google Scholar] [CrossRef]
- Plis, A.; Lasek, J.; Skawińska, A.; Zuwała, J. Thermochemical and kinetic analysis of the pyrolysis process in Cladophora glomerata algae. J. Anal. Appl. Pyrolysis. 2015. [Google Scholar] [CrossRef]
- WRAP. Economic Growth Potential of More Circular Economies. 2015. Available online: https://www.researchgate.net/profile/Peter_Mitchell21/publication/284187253_ECONOMIC_GROWTH_POTENTIAL_OF_MORE_CIRCULAR_ECONOMIES/links/564f40fb08ae1ef9296e83f3.pdf (accessed on 1 December 2019).
- IAI. Global Aluminium Recycling: A Cornerstone of Sustainable Development; International Aluminium Institute: London, UK, 2009. [Google Scholar]
- EEA. Intensified Global Competition for Resources (GMT 7); The European Environment Agency: Luxembourg, 2017. [Google Scholar]
- EEA. Report No 6/2017. In Circular by Design. Products in the Circular Economy; European Environment Agnecy: Luxembourg, 2017. [Google Scholar]
- EEA. Report No 2/2016, Directive 2008/98/EC of the European, Parliament and of the Council of 19 November 2008, on waste and repealing certain Directives. In Circular Economy in Europe Developing the Knowledge Base EU; European Environment Agnecy: Luxembourg, 2008; pp. 3–30. [Google Scholar]
Figure 1.
Analyzed materials; (a) preconsumer waste, (b) postconsumer waste.
Figure 1.
Analyzed materials; (a) preconsumer waste, (b) postconsumer waste.
Figure 2.
Scheme of the reactor used to pyrolyze WPBs; 1—bed, 2—thermocouples, 3—safety valve, 4—cooling water (a) inlet and (b) outlet, 5—control device, 6—gas cooler, 7—output used to collect process gases, 8—liquid fraction vessel.
Figure 2.
Scheme of the reactor used to pyrolyze WPBs; 1—bed, 2—thermocouples, 3—safety valve, 4—cooling water (a) inlet and (b) outlet, 5—control device, 6—gas cooler, 7—output used to collect process gases, 8—liquid fraction vessel.
Figure 3.
Masses of the products obtained during series 1 and 2.
Figure 3.
Masses of the products obtained during series 1 and 2.
Figure 4.
Methane content at different max. temperatures during series 1 and 2.
Figure 4.
Methane content at different max. temperatures during series 1 and 2.
Figure 5.
Carbon oxide content at different max. temperatures during series 1 and 2.
Figure 5.
Carbon oxide content at different max. temperatures during series 1 and 2.
Figure 6.
Nitrogen content at different max. temperatures during series 1 and 2.
Figure 6.
Nitrogen content at different max. temperatures during series 1 and 2.
Table 1.
Chemical analysis of the pre- and postconsumer waste.
Table 1.
Chemical analysis of the pre- and postconsumer waste.
| Sample | Content (%) |
|---|
| C | H | Cl | N | S |
|---|
| Preconsumer | 45.46 | 4.47 | 43.66 | 0.60 | 10.83 |
| Postconsumer | 44.27 | 3.37 | 35.03 | 0.35 | 11.33 |
Table 2.
Gas composition, preconsumer material, 400 °C.
Table 2.
Gas composition, preconsumer material, 400 °C.
| Temp. (°C) | Hydrocarbons (wt%) | Inorganic Compounds (wt%) | Σ % |
|---|
| CH4 | C2H6 | C2H4 | C3H8 | C3H6 | C4H10 | C4H8 | C4H6 | C5+ | H2 | O2 | N2 | CO | CO2 | Other |
|---|
| 210 | 0.26 | 0.11 | 0.23 | 0.05 | 0.07 | 0.04 | 0.33 | 0.06 | 0.19 | 19.60 | 0.00 | 64.60 | 1.56 | 7.72 | 5.18 | 100 |
| 320 | 3.94 | 1.43 | 0.87 | 0.57 | 0.53 | 0.27 | 1.17 | 0.03 | 0.40 | 47.50 | 0.00 | 20.50 | 2.90 | 6.02 | 13.87 | 100 |
| 400 | 11.37 | 2.76 | 1.18 | 1.04 | 0.85 | 0.45 | 1.16 | 0.06 | 0.68 | 49.34 | 0.11 | 13.30 | 5.47 | 4.85 | 7.38 | 100 |
Table 3.
Gas composition, preconsumer material, 425 °C.
Table 3.
Gas composition, preconsumer material, 425 °C.
| Temp. (°C) | Hydrocarbons (wt%) | Inorganic Compounds (wt%) | Σ % |
|---|
| CH4 | C2H6 | C2H4 | C3H8 | C3H6 | C4H10 | C4H8 | C4H6 | C5+ | H2 | O2 | N2 | CO | CO2 | Other |
|---|
| 210 | 0.10 | 0.04 | 0.13 | 0.03 | 0.04 | 0.02 | 0.01 | 0.00 | 0.01 | 1.97 | 1.48 | 83.90 | 1.80 | 7.45 | 3.02 | 100 |
| 320 | 3.38 | 1.23 | 1.01 | 0.44 | 0.39 | 0.16 | 0.40 | 0.00 | 0.03 | 18.00 | 0.94 | 57.30 | 4.90 | 9.90 | 1.92 | 100 |
| 425 | 14.60 | 4.73 | 1.58 | 1.75 | 1.80 | 0.42 | 0.86 | 0.02 | 0.18 | 42.10 | 0.00 | 14.50 | 4.60 | 6.98 | 5.88 | 100 |
Table 4.
Gas composition, preconsumer material, 450 °C.
Table 4.
Gas composition, preconsumer material, 450 °C.
| Temp. (°C) | Hydrocarbons (wt%) | Inorganic Compounds (wt%) | Σ % |
|---|
| CH4 | C2H6 | C2H4 | C3H8 | C3H6 | C4H10 | C4H8 | C4H6 | C5+ | H2 | O2 | N2 | CO | CO2 | Other |
|---|
| 210 | 0.10 | 0.04 | 0.13 | 0.02 | 0.04 | 0.01 | 0.12 | 0.00 | 0.35 | 7.91 | 0.88 | 77.00 | 1.65 | 8.77 | 2.98 | 100 |
| 320 | 5.20 | 2.09 | 1.42 | 0.83 | 0.71 | 0.42 | 1.48 | 0.12 | 1.87 | 34.80 | 0.00 | 29.80 | 4.21 | 9.70 | 7.35 | 100 |
| 450 | 15.36 | 3.49 | 1.38 | 1.33 | 1.69 | 0.39 | 0.98 | 0.20 | 1.34 | 38.57 | 0.00 | 12.76 | 5.78 | 9.31 | 7.42 | 100 |
Table 5.
Gas composition, postconsumer material, 400 °C.
Table 5.
Gas composition, postconsumer material, 400 °C.
| Temp. (°C) | Hydrocarbons (wt%) | Inorganic Compounds (wt%) | Σ % |
|---|
| CH4 | C2H6 | C2H4 | C3H8 | C3H6 | C4H10 | C4H8 | C4H6 | C5+ | H2 | O2 | N2 | CO | CO2 | Other |
|---|
| 210 | 0.23 | 0.12 | 0.14 | 0.05 | 0.07 | 0.02 | 0.00 | 0.13 | 0.00 | 5.73 | 0.96 | 82.80 | 3.02 | 3.26 | 3.47 | 100 |
| 320 | 2.89 | 1.05 | 0.63 | 0.43 | 0.48 | 0.20 | 0.72 | 0.21 | 0.19 | 32.60 | 0.00 | 40.60 | 3.90 | 11.20 | 4.90 | 100 |
| 400 | 7.61 | 2.43 | 1.27 | 0.99 | 1.08 | 0.41 | 2.18 | 0.34 | 0.11 | 46.60 | 0.00 | 10.70 | 6.66 | 12.50 | 7.12 | 100 |
Table 6.
Gas composition, postconsumer material, 425 °C.
Table 6.
Gas composition, postconsumer material, 425 °C.
| Temp. (°C) | Hydrocarbons (wt%) | Inorganic Compounds (wt%) | Σ % |
|---|
| CH4 | C2H6 | C2H4 | C3H8 | C3H6 | C4H10 | C4H8 | C4H6 | C5+ | H2 | O2 | N2 | CO | CO2 | Other |
|---|
| 210 | 0.19 | 0.09 | 0.13 | 0.04 | 0.04 | 0.03 | 0.19 | 0.01 | 0.05 | 10.00 | 0.20 | 74.10 | 1.82 | 9.71 | 3.40 | 100 |
| 320 | 1.86 | 0.66 | 0.47 | 0.27 | 0.27 | 0.14 | 0.68 | 0.08 | 0.32 | 29.90 | 0.40 | 47.00 | 3.11 | 9.98 | 4.86 | 100 |
| 425 | 10.91 | 3.57 | 1.40 | 1.33 | 1.41 | 0.52 | 1.96 | 0.28 | 1.58 | 41.85 | 0.05 | 13.70 | 6.51 | 11.14 | 3.79 | 100 |
Table 7.
Gas composition, postconsumer material, 450°C.
Table 7.
Gas composition, postconsumer material, 450°C.
| Temp. (°C) | Hydrocarbons (wt%) | Inorganic Compounds (wt%) | Σ % |
|---|
| CH4 | C2H6 | C2H4 | C3H8 | C3H6 | C4H10 | C4H8 | C4H6 | C5+ | H2 | O2 | N2 | CO | CO2 | Other |
|---|
| 210 | 0.28 | 0.13 | 0.20 | 0.06 | 0.06 | 0.04 | 0.26 | 0.01 | 0.30 | 7.30 | 0.99 | 75.90 | 2.99 | 6.92 | 4.56 | 100 |
| 320 | 3.32 | 1.08 | 0.69 | 0.45 | 0.37 | 0.25 | 0.87 | 0.03 | 0.87 | 29.00 | 0.00 | 44.70 | 4.68 | 9.14 | 4.55 | 100 |
| 450 | 12.20 | 4.10 | 1.52 | 1.67 | 1.74 | 0.63 | 1.53 | 0.05 | 2.12 | 39.10 | 0.00 | 12.50 | 6.40 | 9.78 | 6.66 | 100 |
Table 8.
Calorific value of the process gases at different temperatures, series 1.
Table 8.
Calorific value of the process gases at different temperatures, series 1.
| Series 1 |
|---|
| Calorific Value (MJ/m3) |
|---|
| | Tmax = 400 °C | Tmax = 425 °C | Tmax = 450 °C |
| tstart | 3.52 | 0.69 | 1.95 |
| tmid | 11.70 | 6.63 | 15.04 |
| tmax | 17.33 | 19.39 | 20.14 |
Table 9.
Calorific value of the process gases at different temperatures, series 2.
Table 9.
Calorific value of the process gases at different temperatures, series 2.
| Series 2 |
|---|
| Calorific Value (MJ/m3) |
|---|
| | Tmax = 400 °C | Tmax = 425 °C | Tmax = 450 °C |
| tstart | 1.52 | 1.93 | 2.41 |
| tmid | 8.55 | 7.04 | 9.48 |
| tmax | 16.42 | 20.58 | 21.96 |
© 2020 by the authors. Licensee MDPI, Basel, Switzerland. This article is an open access article distributed under the terms and conditions of the Creative Commons Attribution (CC BY) license (http://creativecommons.org/licenses/by/4.0/).

 ,
, 


