Article

Sorghum Flour: A Valuable Ingredient for Bakery Industry?

1
National Research & Development Institute for Food Bioresources—IBA Bucharest, 6 Dinu Vintila Street, 0211202 Bucharest, Romania
2
Faculty of Food and Tourism, Transilvania University of Brasov, 148 Castelului Street, 500014 Brasov, Romania
3
CSCBAS &CE-MONT Centre/INCE—Romanian Academy, Casa Academiei Române, Calea 13 Septembrie no. 13, 050711 Bucharest, Romania
4
Academy of Romanian Scientists, Ilfov Street, no. 3, 050711 Bucharest, Romania
5
Faculty of Biotechnology, University of Agronomic Sciences and Veterinary Medicine of Bucharest, 011464 Bucharest, Romania
*
Authors to whom correspondence should be addressed.
Appl. Sci. 2020, 10(23), 8597; https://doi.org/10.3390/app10238597
Submission received: 27 October 2020 / Revised: 26 November 2020 / Accepted: 27 November 2020 / Published: 30 November 2020

Abstract

:
The information from this study may provide opportunities for industrial application of sorghum seed flour as a useful bakery ingredient and a suitable alternative source of functional compounds to whole wheat flour. The chemical composition of sorghum was evaluated compared to that of wheat whole flour, showing high contents of mineral and fibers. Next were evaluated the dough rheological properties of flour mixtures using Mixolab equipment, “Chopin+” protocol. Finally, six bread samples were obtained from wheat flour with addition of sorghum seed flour in various percentages, in which three samples were fortified with Lactobacillus plantarum compared to the other three bread samples without the addition of any lactic acid bacteria. All six bread sample were compared to a control bread sample with wheat flour type 550. The results show the fat and raw fiber were higher in sorghum compared to whole wheat flour. Also, the content of magnesium, potassium, and iron were much higher than in whole wheat flour. A significant improvement of the sensorial characteristics was observed in bread samples in which lactic acid bacteria was used.

1. Introduction

Sorghum bicolor (L.), originated in Africa, commonly called sorghum is a specie cultivated for its grain, which is used for human food, animal feed, and ethanol production. Sorghum is the world’s fifth-most important cereal crop after rice, wheat, maize, and barley. Sorghum bicolor is typically an annual, but some cultivars are perennial. Sweet sorghums are sorghum cultivars that are primarily grown for forage, syrup production, and ethanol.
Sorghum plays a decisive role in food security in developing countries. It is used in many types of food recipes such as breads, porridges, pastes, and griddlecake [1]. Due to the content of phenolic compounds, diet fibers and antioxidant activity, Sorghum bicolor has various applications in African traditional medicine and many of its uses have been mentioned in literature [1,2].
In India, a decoction of sorghum seeds is used as a demulcent and diuretic for treating kidney and urinary tract complaints. Numerous studies have shown that the biocompounds responsible for the red color of sorghum also have antimicrobial, antifungal, and anti-anemic properties [3].
Lately, in occidental countries, the use of sorghum in human consumption has increased due to its antioxidant potential with a role in reducing the risk of developing chronic diseases (obesity, cardiovascular diseases, hypertension, diabetes, and cancer) [4,5].
Thus, S. Ben Slima et al. extracted a soluble polysaccharide from Sorghum bicolor (L.) seeds and evaluated in vitro hemolytic and antioxidant activities as well as its in vivo wound healing ability to treat burns induced by fractional CO2 laser. The obtained results have shown that this polysaccharide was efficient on wound closure and that it might be useful as a wound healing agent in modern medicine. Also, sorghum is a cereal recommended as a safe food for celiac patients because it is gluten-free [6]. Sorghum is a major source of energy, serving as a staple food to many of the world’s poorest and least privileged population [7]. Some of the challenges associated with the use of sorghum, in the production of bread are associated to reduced volume, hard texture, and poor sensory attributes. These shortcomings of unconventional flours have been enhanced with sourdough fermentation, providing nutritive food with attractive flavor and texture [8,9,10].
One of the main trends in the market is the use of sourdough especially for bread because it has been shown that it has a positive influence on bakery products both in terms of sensory, nutritional texture, and shelf life [11,12]. Overall, the fermentation with sourdough showed new ways to improve the quality and acceptability of bread with the addition of gluten-free matrices. During fermentation with sourdough, acid appears, which improves the swelling of polysaccharides that could partially replace gluten and improve the structure of gluten-free bread [13]. According to Coda et al. [14], lactic acid bacteria are very important because this ferments gluten-free flours. The result is the production of functional bread enriched with bioactive compounds. L. plantarum was selected to synthesize γ-aminobutyric acid (GABA) by fermenting wheat sourdough, sorghum, rye, spelled, oats, buckwheat, rice, amaranth, millet, chickpeas, and soybeans.
The objective of the present study was to compare the nutritional composition of Sorghum bicolor (alimentary hybrid) seeds flour with whole wheat flour, on the future prospect of using this cereal in the bakery industry. In order to highlight the valuable chemical composition of sorghum vis-à-vis wheat, whole meal sorghum flour and whole wheat flour were studied comparatively (potassium, magnesium, zinc, iron, etc. contents).
To evaluate the ability to integrate sorghum flour into classical bread making technology, the rheology of sorghum flour mixtures with white wheat flour was studied, compared to a control sample of 100% type 550 wheat flour. Finally, sensorial analysis of breads was performed.

2. Materials and Methods

2.1. Raw Materials

Sorghum bicolor (Alimentary hybrid) seeds flour was supplied by Agricultural Research and Development Station Secuieni, Neamţ county (Romania).
Whole wheat flour used in the study was provided by Hofigal Export—Import SA (Bucharest, Romania). Sorghum flour was compared with whole wheat flour (provided by Hofigal Export) to demonstrate the special value of sorghum. Subsequently, rheological analyzes were performed comparatively between mixtures of sorghum and type 550 wheat flour (provided by Titan S.A.), respectively compared to the control sample of 100% white wheat flour type 550.

2.2. Preparation of Flour Mixtures

Raw materials: Wheat flour type 550 (ash = 0.55%) used to prepare bread samples was provided by Titan S.A. (Bucharest, Romania), Sorghum bicolor (Alimentary hybrid) seeds flour—by Agricultural Research and Development Station Secuieni (Romania), L. plantarum (Aurum Plantarum Millbo srl—Via Bellaria s.n.—Novara/Italy), dried yeast, iodized salt for food use.
In Table 1 are presented the six samples of mixtures from wheat flour and different proportions of sorghum seed flour.

2.3. Chemical Analysis

Moisture content was determined according to ICC Standard No. 110/1 [15]. The ash content was determined by incineration at 525 ± 25 °C (ICC no. 104/1) [16]. Total nitrogen (N) and crude protein content (N·6.25, conversion factor) was determined by the Macro Kjeldahl Method (SR EN ISO 20483:2007). Total fat content was determined by extracting with petroleum ether at 40–65 °C, to the Romanian standard SR 91/2007 [17]. The subject to chemical analysis was sorghum flour and whole wheat flours.

2.4. Crude Fiber Content Analysis

Using FIBRETHERM–Gerhardt apparatus the content of crude fiber (cellulose, hemicellulose, and lignin) was determined for the above listed samples. The method for determining the crude fiber begins with treating the sample with an acid detergent solution (20 g N-cetyl-N,N,N-trimethylammonium bromide dissolved in 1 L sulfuric acid 0.5 M). In this solution, cellulose hemicellulose and lignin from the analysed material are insoluble, unlike all other components. Using special fiber bags, the dilution and filtration steps are simplified. The most important aspects of this method of fiber analysis are adherence to strict boiling times and to weighing procedures.
After treatment with the acid detergent solution, the insoluble residue is dried, weighed, and then calcinated. The acid detergent fiber (ADF) content represents the insoluble part of the sample that is left after boiling in acid detergent solution from which the ash obtained upon calcination is subtracted
% A D F = ( ( χ α ) ( δ ξ ) ) × 100 β
B l a n k   v a l u e   ( ξ ) = γ ψ
where:
α = mass of fiber bBag (g)
β = sample mass (g)
χ = mass of crucible and dried fiber bag, after digestion (g)
δ = mass of crucible and and ash (g)
ζ = blank value of empty fiber bag (g)
γ = mass of crucible and ash of the empty fiber bag (g)
Ψ = mass of crucible (g)

2.5. Mineral Content Analysis

Mineral content was determined using an atomic absorption spectrophotometer (ContrAA 700; Analitykjena). Total ash was determined by incineration at 550 °C, in an oven. Analysis was performed using an external standard (Merck, multi element standard solution) and calibration curves for all minerals were obtained using six different concentrations. Dried samples were digested in concentrated HCl.

2.6. Amino Acid Content Analysis

For the analysis of amino acid content, samples were hydrolyzed at 100–120 °C in 6 N hydrochloric acid for 22–24 h under vacuum.
After evaporation to dryness of hydrochloric acid, the dry residue was diluted using 4 mM stock solution of Norleucine. For the separation of amino acids by gradient anion exchange with pulsed electrochemical detection (PED) was used an ICS300 (Dionex, sSunnyvale, CA, USA) equipment with the following eluents: deionized water, 0.250 M NaOH and 1 M CH3COONa. Amino acids were expressed as g amino acid/100 g protein.
The chemical score of samples was calculated according to FAO/WHO (1985) [18] as
Chemical Score = mg/g of essential amino acid in test protein mg/g of essential amino acid reference protein × 100

2.7. In Vitro Protein Digestibility Method

The in vitro protein digestibility of sorghum and wheat flour was achieved according to the previous methods [19,20] with small changes using the enzyme Trypsin from the porcine pancreas—type IX-S.
An aliquot of 50 mL of aqueous protein suspension (6.25 mg protein/mL) in double distilled water is placed in a water bath with the temperature set to 37 °C and to an adjusted pH of 8.0 with 0.1 N HCl. The enzyme solution (containing 1.6 mg trypsin/mL) was maintained in an ice bath and 5 mL of the solution was then added to the protein suspension.
The pH drop was automatically recorded after a 10 min period of time, using a WTW InoLab 7110 (Weilheim, Germany). The protein digestibility percentage of each protein sample was calculated using the regression equation predicted by Hsu et al. (1977) [19] as
% Protein digestibility (Y) = 210.46 − 18.1X
where X is the final pH value of each sample after a 10 min digestion.

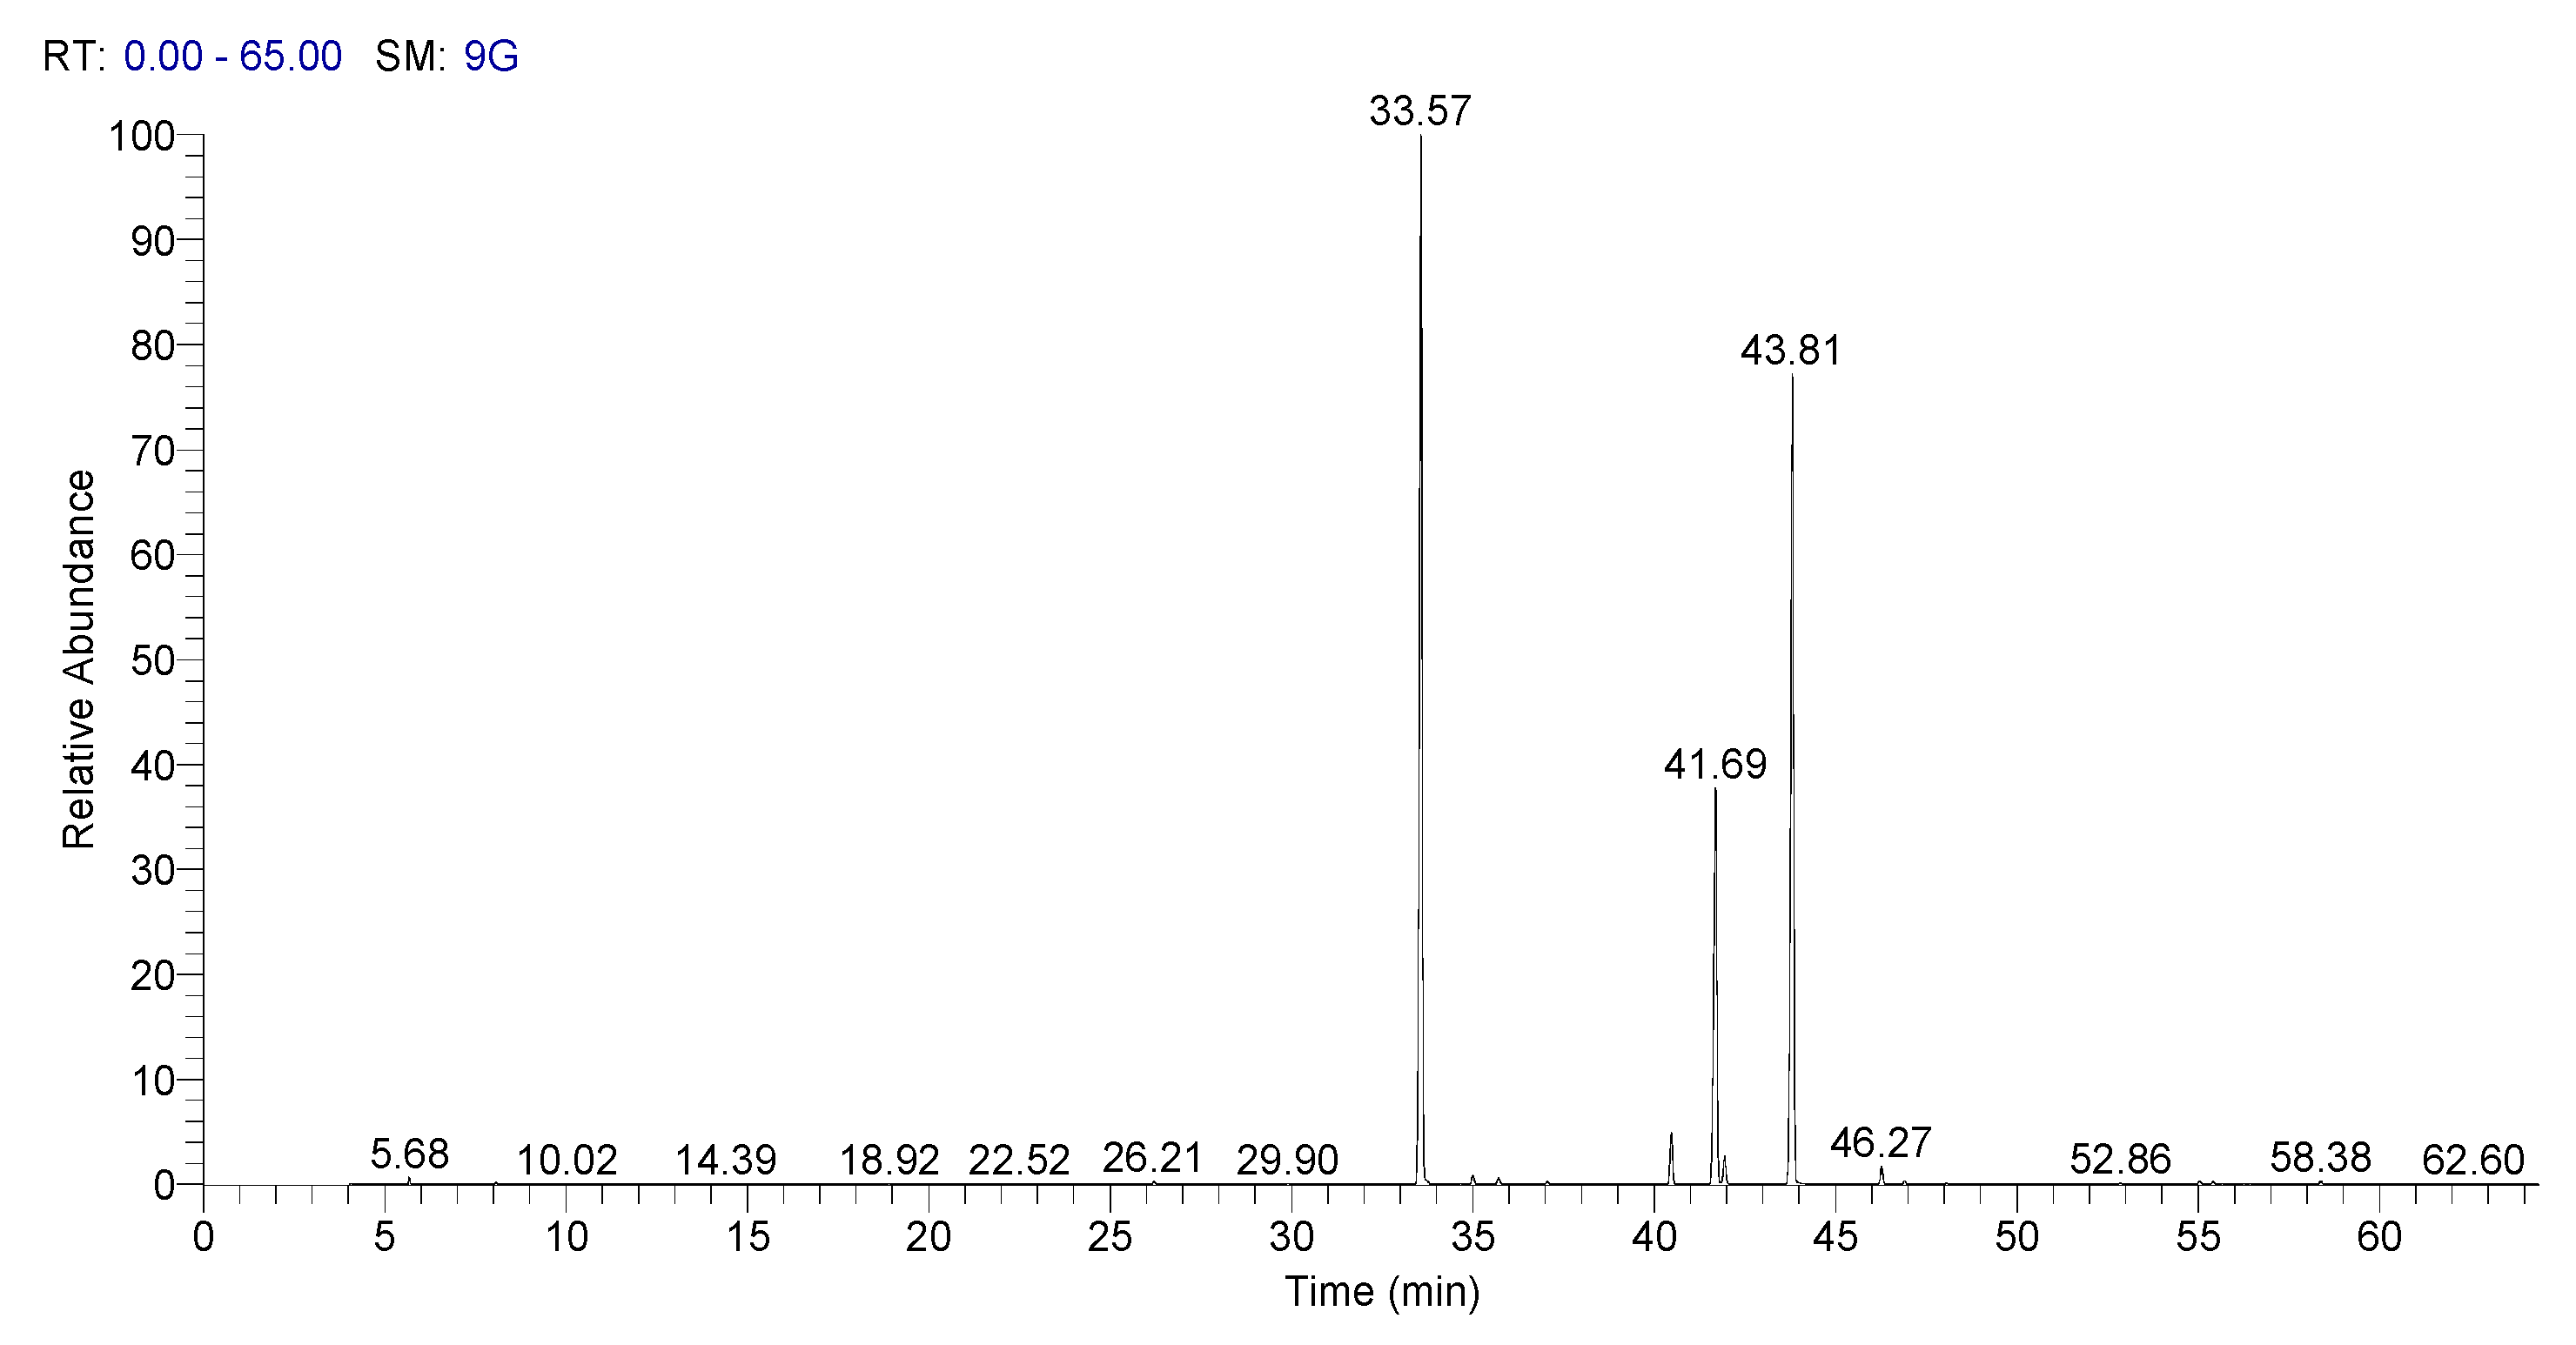
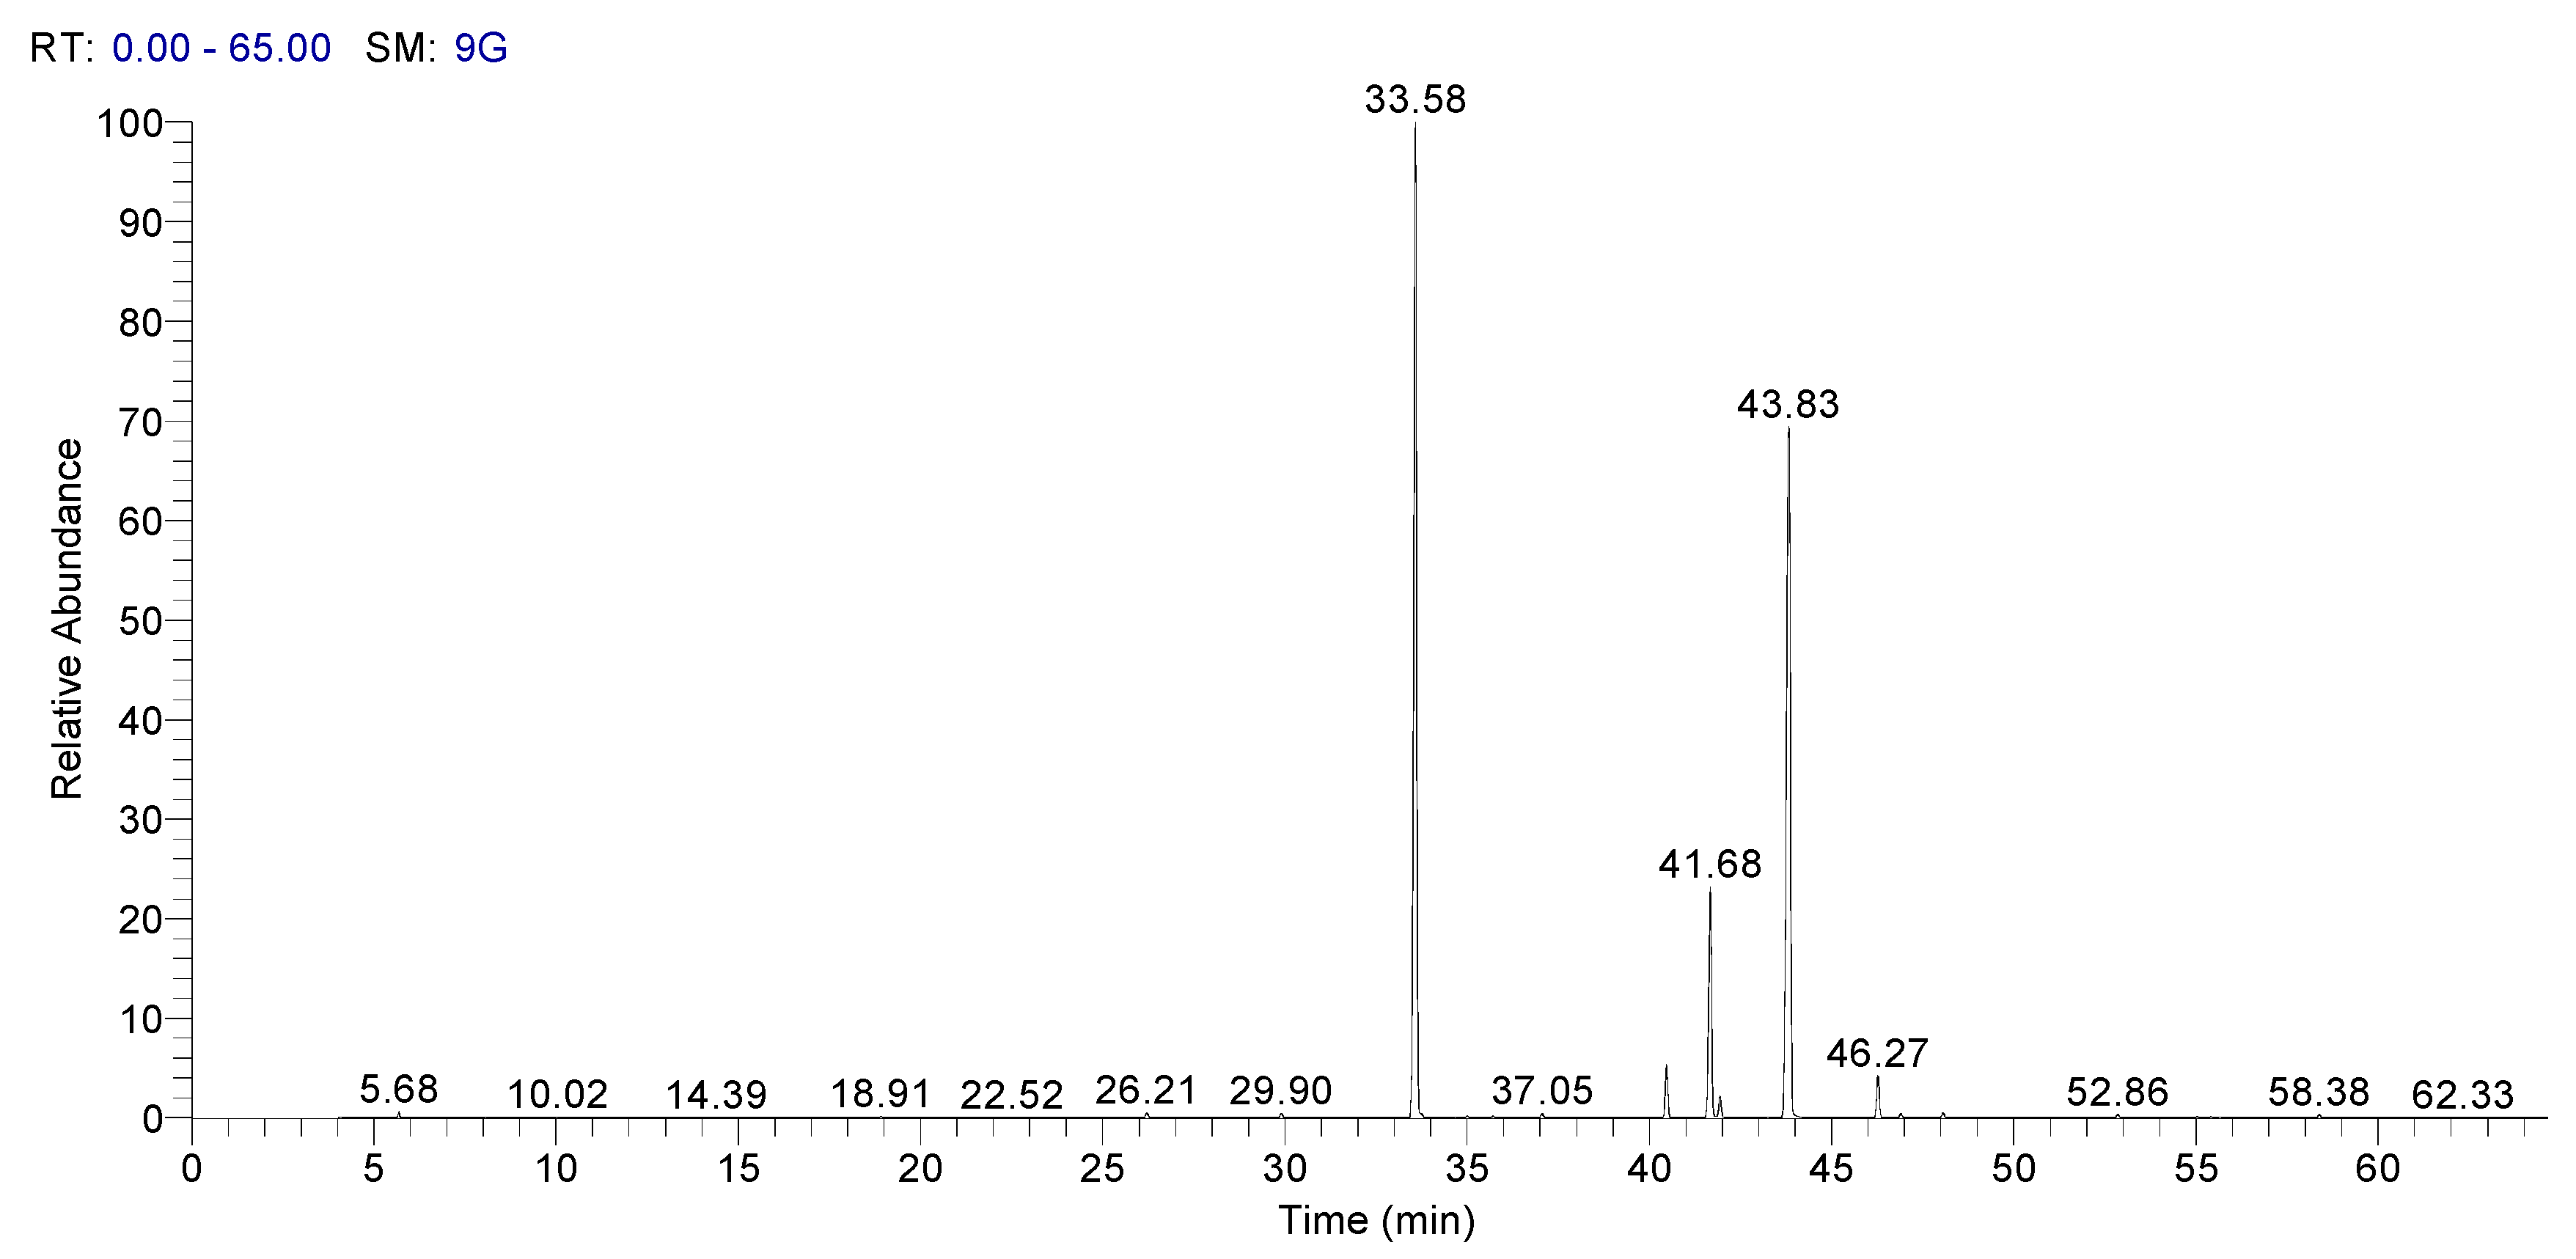
2.8. Fatty Acid Content by Gas Chromatography Method

The oil content was analyzed using AOAC method, 920.85 [21] with Soxhlet apparatus. The lipid extracts from the sorghum and wheat flours were mixed with boron trifluoride (BF3)–methanol reagent (20%) and fatty acids were converted into the methyl ester derivatives [22].
Chromatographic analysis was performed on a Trace GC Ultra/TSQ Quantum XLS system (Thermo Fisher Scientific, Waltham, MA, USA), a gas chromatograph coupled with a mass spectrometer (MS) TSQ Quantum XLS, autosampler, TriPlus AS. FAMEs/FAs separation was realized on a high polarity capillary column, TR-FAME (60 m × 0.25 mm × 0.25 μm film thickness) of 70% cyanopropyl and 30% polysilphenyl-siloxane. Analysis of calibration solutions and the acquired extract samples were performed in the positive electron impact ionization (EI+) mode, selected ion monitoring (SIM) mode, using 24 segments. The ion source temperature was 250 °C, the oven temperature was programmed at 100 °C for 0.2 min, increased to 240 °C with 2 °C/min and hold for 15 min. The mobile phase was He of a 99.9995% (5.0) purity at a constant flow rate of 1 mL/min. A volume of 0.5 μL extract was injected at 240 °C in split mode with a 1:50 split ratio and a 50 mL/min splitting rate. Instrument control, data acquisition, and processing were performed using the Xcalibur Program. The total run time of a GC-MS chromatogram was 85.20 min.
Components identification was done by comparison of their recognition and their retention times and mass spectra with corresponding data from reference compounds.

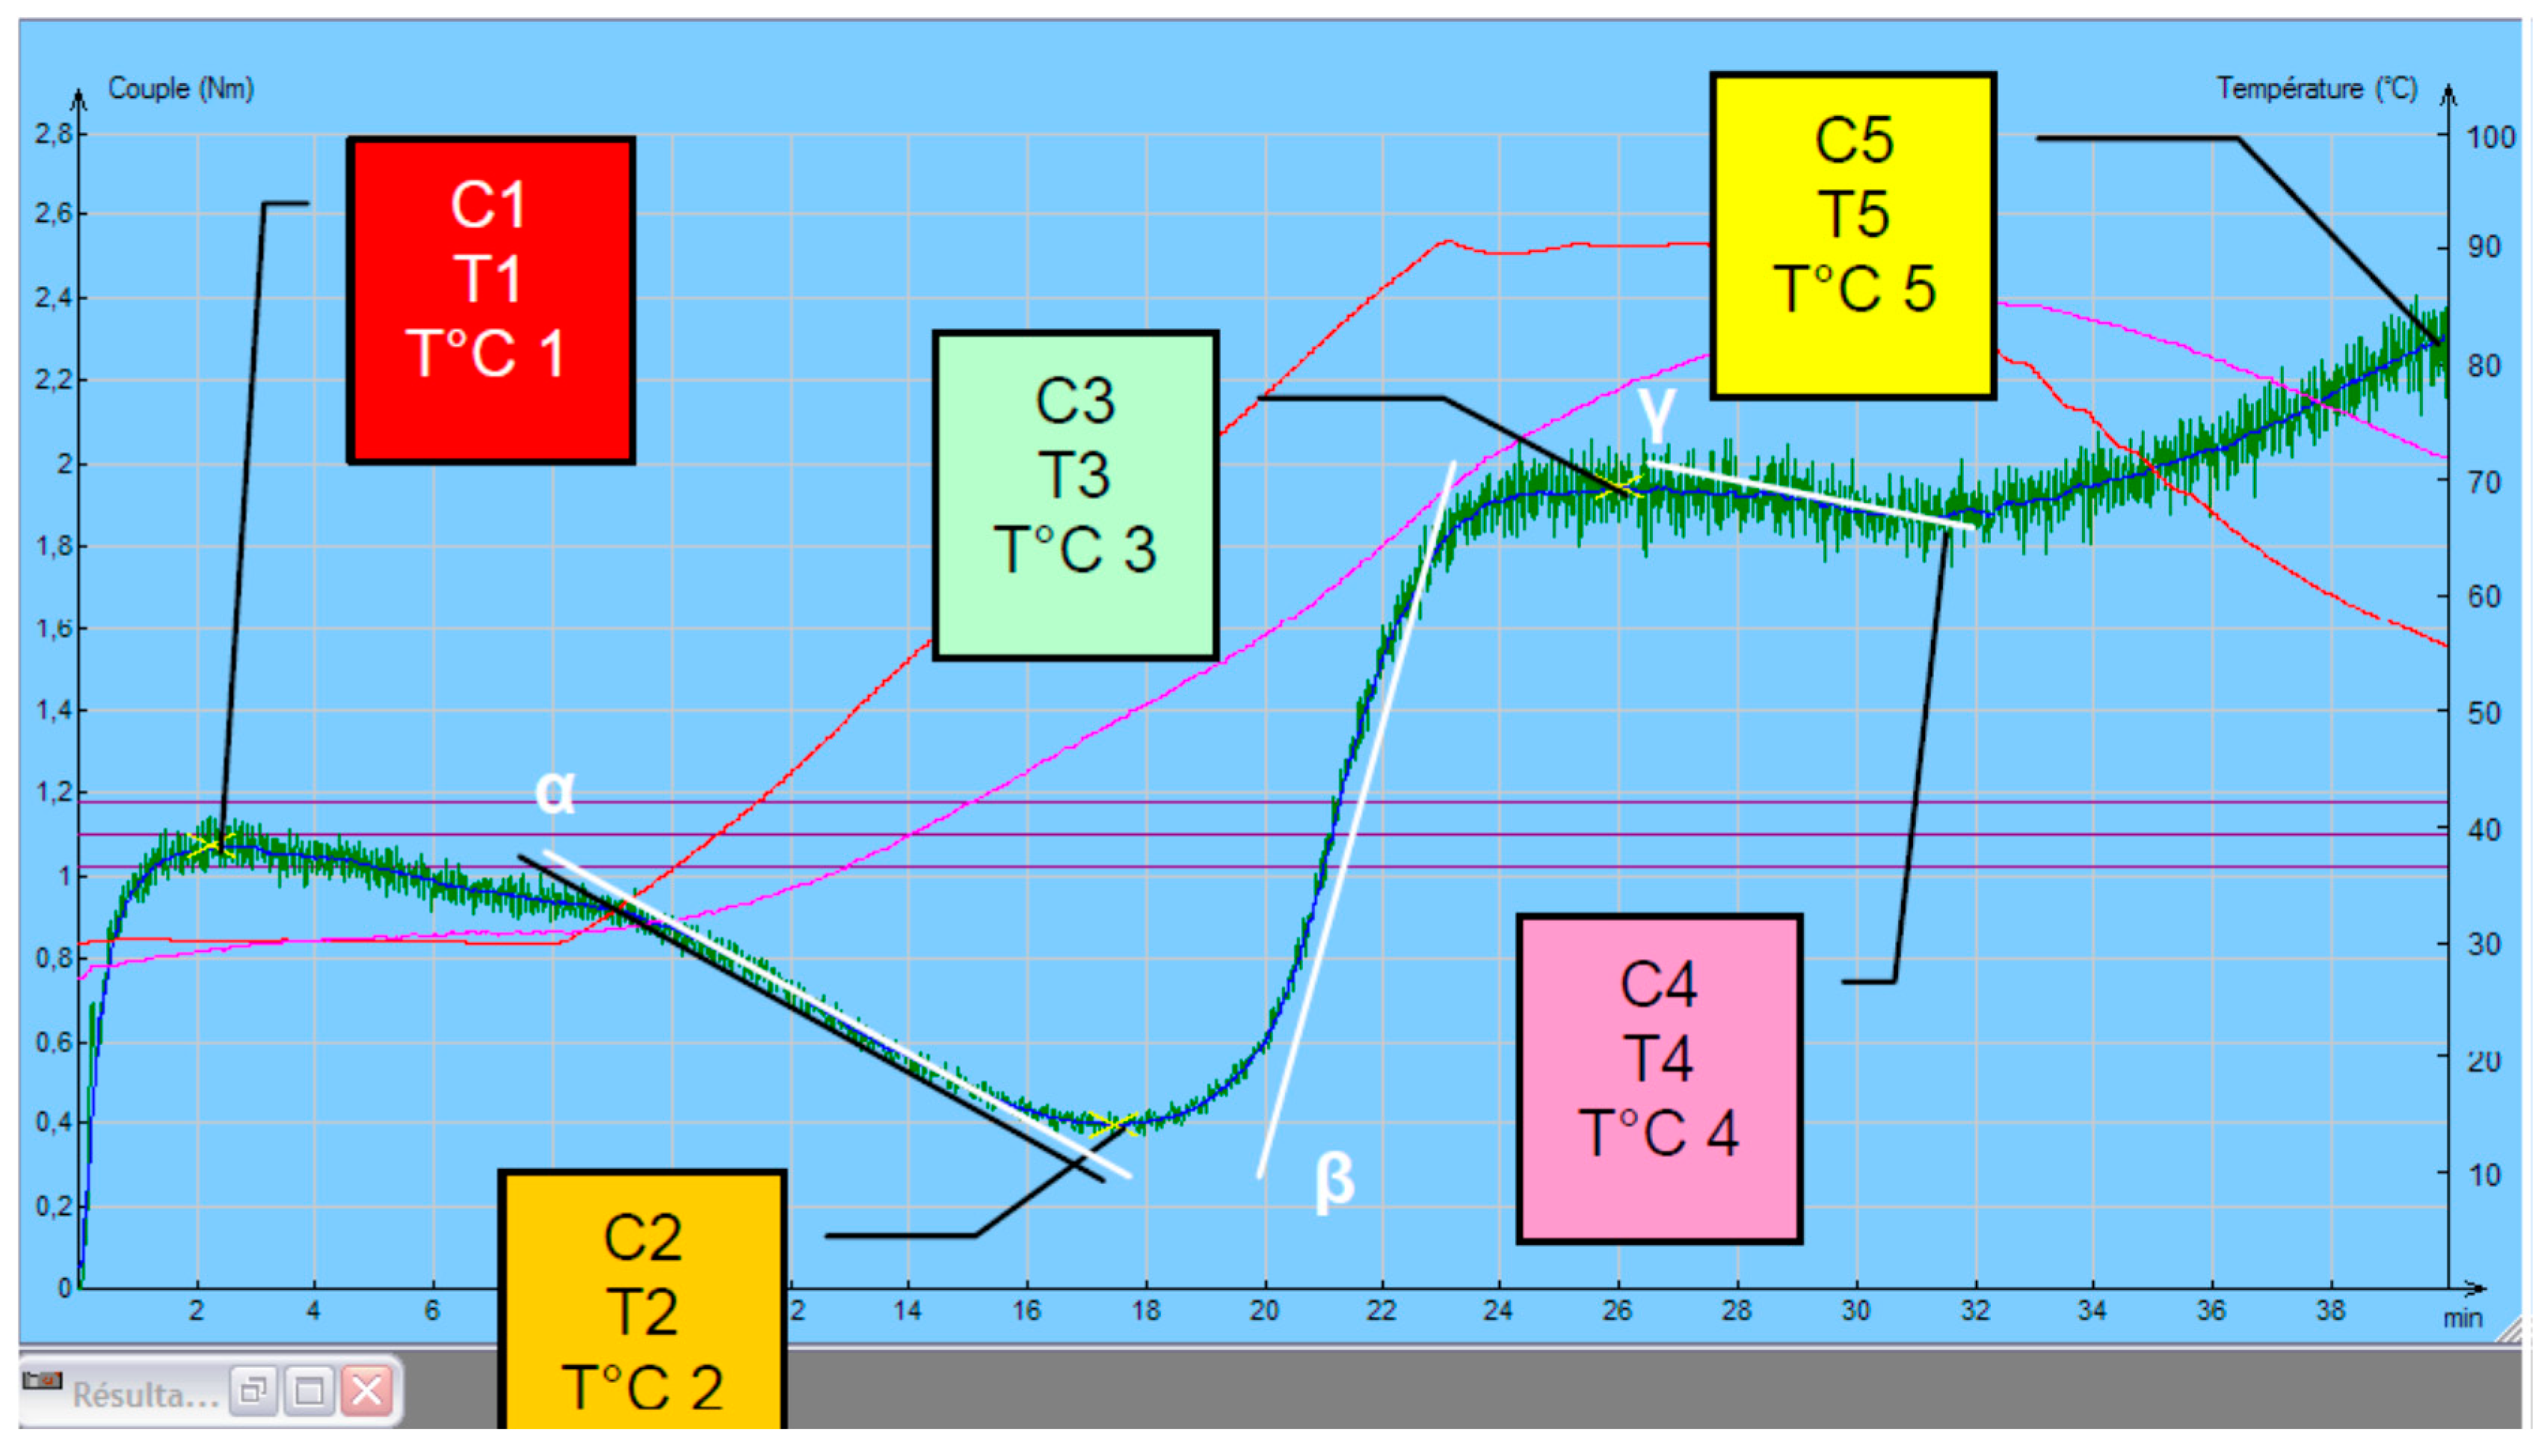
2.9. Rheological Properties Testing

Dough rheological behavior was determined using the predefined “Chopin+” protocol on Mixolab, according to ICC no. 173 [23], a protocol for complete characterization of flours (water absorption, protein quality, amylase activity, and starch quality), and a simplified graphic interpretation of the results was performed (Mixolab device—Chopin, Tripette et Renaud, Paris, France) [24].
The rheological behavior analysis of the Mixolab procedure parameters were the following: tank temperature 30 °C, mixing speed 80 min−1, heating rate 2 °C/min, total analysis time 45 min. Mixolab curves recorded are basically characterized by torque in five defined points (“C1”–“C5”, N·m), temperatures and processing times corresponding to them (Figure 1).
Relation of these features to physical state of tested dough during mixing and heating [24,25,26,27] are:
  • C1 represents maximum torque during mixing (used to determine water absorption);
  • C2 represents the weakening of the protein based on the mechanical work and the increasing temperature;
  • C3 expresses the rate of starch gelatinization;
  • C4 measures the stability of the hot-formed gel;
  • C5 represents starch retrogradation during the cooling period;
  • C1–C2 show the protein network strength under increasing heating;
  • C3–C4 denotes to starch gelatinization rate;
  • C4–C5 relate to the anti-staling effects (starch retrogradation at cooling phase), represents the shelf life of the end products.
The correlation between parameters (Table 2) is tested during dough mixing and heating processes by Mixolab.

2.10. Bread Making

The recipe consists of the following raw materials: wheat + sorghum flour (1 kg), dried yeast (3.0 g/kg flour), sodium chloride (1.5 g/kg flour), and water according to the Mixolab water absorption parameter (52.7%...54.7%). Samples were coded according to Table 1. All ingredients were added into a mixer (Diosna, Osnabrück, Germany). The program starts with a 10 min kneading process, followed by a 5 min resting time before the rounding and fermentation procedures that take 60 min at a temperature of 28–30 °C.
The 600 g obtained dough parts were subjected to remodelling process, after which were placed in special bread baking form and fermented at a 30 °C temperature and 90% humidity for 60 min, followed by baking at 200 ± 5 °C in a baking oven (Mondial Forni, Verona, Italy). To make the measurements, the bread was left to cool at room temperature.
The procedure for preparing the dough with addition of L. plantarum was the following: one third of the flour mixtures was mixed with a part of water and bacterial freeze–dried powder (Aurum Plantarum, Millbo) (0.3 g/100 g flour). There were made two batches of two breads for each sample.
This dough was kept for 12 h at a temperature of 25 °C, stirring slowly from time to time. During kneading, the dough was added over the amount of flour remaining in the sample.

2.11. Physicochemical Characteristics of the Experimental Bread

The bread specific volume was determined, by the rape seed displacement method according to SR 91:2007, AACC 2000 [17,21]. The ratio of the obtained data was the average of three measurements of the fresh made bread loaf, expressing it in cm3/g.
For porosity measurement, knowing the mass and density, the porosity was expressed % by measuring the total scale of holes, in a known crumb volume.
Elasticity content measurement consists in pressing a piece of bread crumb of a certain shape, a given time and measuring the return to the initial position/shape after removing the pressing force. Crumb elasticity is expressed in percent meaning the ratio between the height expressed in % by pressing and return, and the initial height of the cylinder crumb bread.
Moisture content measurement consists in drying approximately 5 g of bread crumb at 103 °C (±2 °C) to constant weight; reported data consists in mean of three measurements, each time performed on a freshly new bread loaf.
Acidity measurement, expressed in degrees (SR 91/2007) [17,21], was determined by titration of a fluid extract of bread with 0.1 N NaOH solution, in the presence of phenolphthalein as indicator.

2.12. Proximate Analysis

Proximate analysis of the sorghum and whole wheat flour samples were carried out on dry matter basis. Ash, crude protein, fat, and fiber contents were determined as described by ICC standard no. 173 [24].

2.13. Sensory Analysis

A group of 10 specially trained panelist, with ages between 25 and 61, evaluated the bread samples, giving grades from 1 (lowest intensity) to 5 (highest intensity), for the following sensory attributions: crust color (degree of perceived brown color characterizing the crust), crumb color (degree of color darkness in the crumb ranging from white to dark brown), crumb pore uniformity (size of pores on the surface; (small/big)), crumb softness (minimum force necessary to compress the sample), bitter taste (perceived by the back of the tongue and characterized by solutions of quinine, caffeine, and other alkaloids; usually caused by over-roasting), salty taste (fundamental taste sensation elicited by sodium chloride), sour taste (fundamental taste sensation evoked by acids, e.g., tartaric acid), specific aroma (aroma of fresh baked bread and odor associated with aromatic exchange from yeast fermentation), after-taste (flavor staying after tasting). Also, there has been made a consumer overall acceptability determination in a 9-point hedonic scale (from 9 = like extremely to 1 = dislike extremely) [10,29,30]. For the hedonic test, 35 untrained panelists with ages between 22 and 60 (70% females and 30% males) have tasted the samples that were coded with 3 random letters. Water was served to panelists for mouth cleaning between the sample’s evaluation. The results are expressed as mean standard deviation; n = 10 (descriptive test) and n = 35 (hedonic). Differences were considered as significantly different at a value of p < 0.05.

2.14. Statistical Analysis

All analyses were executed in triplicate and the mean values with the standard deviations were related. For statistical analysis was used Microsoft Excel Program, with the level of significance set at 95%. Analysis of variance (ANOVA) and Tukey’s test was used to estimated statistical differences between samples. Differences were considered significant for a value at p < 0.05.

3. Results and Discussion

3.1. Chemical Composition

The chemical characterization of sorghum and whole wheat flours used in this study are presented in Table 3. As it can be seen, the nutritional composition of Sorgum bicolor is like that of whole wheat flour. Moreover, sorghum has a higher fat and raw fiber content than whole wheat flour. It is easy to notice that, apart from the smaller protein and calcium levels, the potassium, magnesium, and iron contents of sorghum flour are higher than of whole wheat flour.
The results of the analyzes performed show that sorghum seed flour contains a high amount of minerals. 100 g of sorghum assures 21% of the daily reference intake for K, 81% of the daily reference intake for Fe and 91% of the daily reference intake for Mg, according to recommendation of the FDA [31]. The content of potassium from sorghum seed flour is almost double than that of whole wheat flour. The magnesium content level is almost 4 times higher for sorghum seed flour, and, the iron content is almost 3 times higher in sorghum seed flour than is wheat flour. For zinc and starch content level, statistical analyzes show no significant differences.

3.2. Amino Acid Composition

As the world’s population rises quickly, and the stress of limited water and food resources is more and more oppressive, it is more important than ever to provide high quality protein, that meet the human nutritional needs. The amino acid composition of sorghum and whole wheat flour are presented in Table 4.
The results show that sorghum protein has a content of essential amino acids, approximately similar to that of wheat protein. Moreso, the leucine content of sorghum protein is 12.84% compared to content of wheat protein (6.69%). Leucine is known on having excellent effect in bone, skin, and tissue wound healing, and stimulates hormone synthesis.
Regarding the nonessential amino acids content, sorghum protein has a lower content of glutamic acid, glycine, cysteine, and proline than wheat protein. However, sorghum protein has a higher content of alanine aspartic acid and tyrosine than wheat protein. Whitaker and Tannenbaum [32] have evaluated the capability of a protein source to meet human amino acid requirements, by developing a chemical score procedure. The procedure consists in calculating the percentage that each amino acid in the protein tested represents from the respective amount of amino acid in the standard protein, where the egg protein was established as a standard for the evaluation of food proteins.
Figure 2 represents chemical scores of amino acids from the sorghum seed flour vs. chemical scores of amino acids from whole wheat flour.
An appreciable correlation was reported between the chemical scores determined in this way and the values obtained by biological tests for protein quality [33]. It can be seen in Figure 2 that both sorghum and wheat protein are a rich source of isoleucine, leucine, and valine. The most limited amino acid is lysine, followed by phenylalanine, threonine, and methionine.

3.3. In Vitro Protein Digestibility (IPD)

Trypsin from the porcine pancreas—type IX-S was used to simulate the gastrointestinal enzymatic process that took place in the normal human digestion of food proteins [20,34]. During protein digestion, hydrolysis of the peptide bond releases H+, which lowers the pH; rapid decreases mean higher digestion rates and can be used as an index of protein digestibility.
The sorghum flour pH value decreased from 7.90 to 7.72 about 60 s after the trypsin addition; compared to wheat flour values, that were each at a pH level of 7.90, respectively 7.64. After the first 60 s, the digestion of sorghum flour experienced a slow but continuous pH, decreasing up to 600 s for a final pH value of 7.53. The digestion of wheat flour experienced a slow, continuous pH decreases to 600 s for a final pH value of 7.43. The IPD from sorghum and wheat flour was calculated according to the formula defined in Section 2.6.
The values of Y (% Protein digestibility) obtained for the two samples were statistically different as
Ywhole wheat flour = 75.98
YSorghum = 74.17
Note: standard deviation within in vitro meassurement = ±0.70; regression equation: Y = 210.46 − 16.10X, where X = pH at 10 min.
The IPD value obtained for whole wheat flour in this study is higher than the 74.17 reported for sorghum. The slightly lower digestibility of sorghum protein is due to the higher fiber content of sorghum. Fiber has been reported to have a negative effect on IPD because of nonspecific interactions between proteins and polysaccharide constituents in food [35].
The 1985 FAO/WHO [18] recommended that the amino acid score method corrected by protein digestibility to be the most appropriate approach for the routine assessment of the overall quality of proteins for humans and recommended that this method to be adopted as an official method internationally.

3.4. Fatty Acid Composition

In Table 5 is given fatty acid composition of seed oil of whole wheat and sorghum seed.
The total oil content in sorghum seeds was 3.70% (w/w), in favor of whole wheat which had a value of 2.35% (w/w). The results revealed that, unlike whole wheat, sorghum seeds had a higher oleic acid content (35.06% respectively 16.55%). It was observed that monounsaturated fatty acids (MUFA) content of sorghum was double that of whole wheat, and the polyunsaturated fatty acids (PUFA) content of sorghum was slightly lower. Besides, the (MUFA + PUFA) content of sorghum was higher than that of whole wheat.
In Figure 3, it is presented Spectra of GC–MS of fatty acid methyl esters of sorghum, and in Figure 4 it is presented the spectra of GC–MS for fatty acid methyl esters of whole wheat.
These results recommend that Sorghum bicolor seed oils can be used as a potential dietary source of MUFA and PUFA [36].

3.5. Rheological Properties of Flour Mixtures
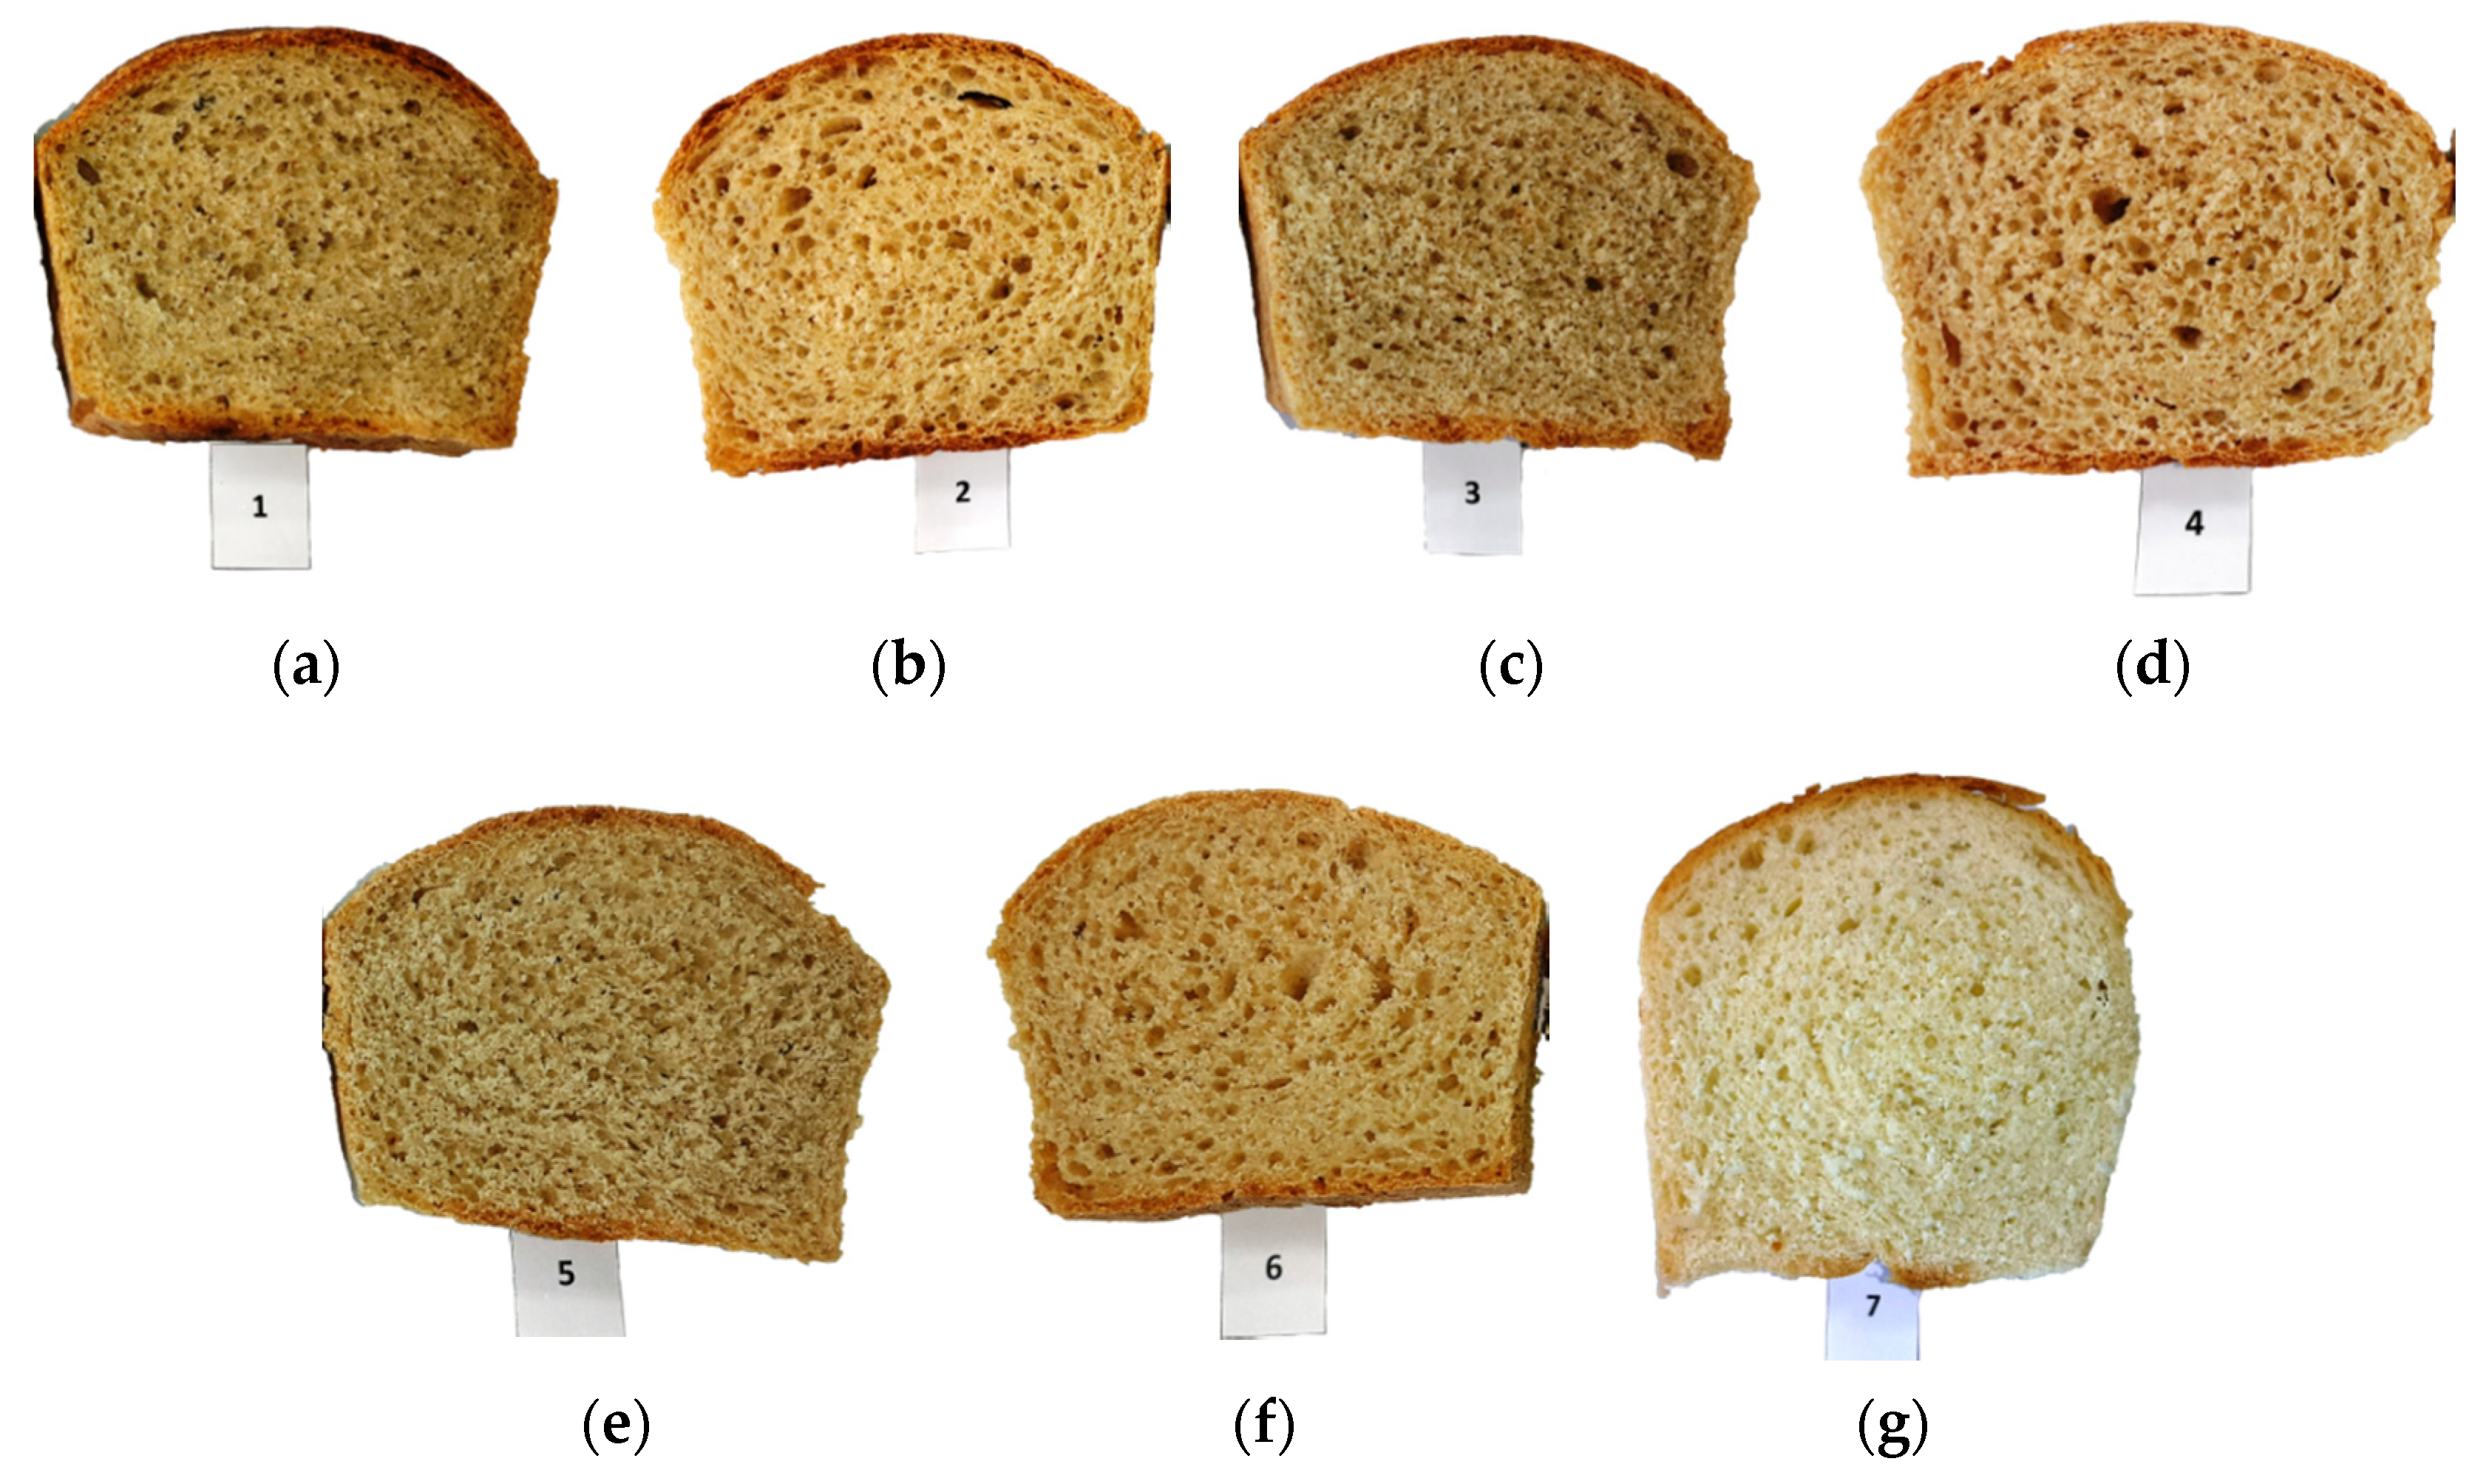
Table 6 presents the rheological properties of wheat and sorghum flour mixtures, versus the trial simple wheat flour.
Mixolab C1–C5 values of wheat dough were 1.098 N∙m, 0.462 N∙m, 1.924 N∙m, 1.809 N∙m and 3.049 N∙m, respectively (Table 6). Similar Mixolab behavior was mentioned in other studies [27] for three wheat varieties with small differences.
From our results, it can be seen that as the amount of added sorghum seed flour increases, the water absorption capacity decreases from 58.2% (wheat) to 54.7% (30% sorghum), 53.4% (35% sorghum), and 52.7% (40% sorghum), respectively. For wheat flour for baking, normal CH values are between 55–62% [37].
It can be noticed that the addition of sorghum seed flour did not have a significant influence on the wheat flour dough’s stability (Table 6).
As the percentage of sorghum flour increased, the amplitude the width of the curve during dough formation increase, which suggests a higher elasticity of the dough, due to higher content of fat. This increase in fat content is due to sorghum seeds, with a positive influence on the dough.
The increase of consistency (C2—the behavior of the gluten when heating the dough) reveal a higher resistance of dough as an effect of temperature. The increase in sorghum addition did not lead to changes in this parameter.
In phase 3, the starch gel formation (at temperature 50–55 °C) the lowest C3 was observed for wheat flour. The difference in C3 results between wheat flour and mixture of wheat + 40% sorghum was 0.124 N∙m, so the influence on dough preparation recipe was low.
The C4 parameter corresponds to the stability of the hot-formed gel. The lowest C4 was found for wheat flour (Table 6). The difference for C4 results between wheat flour and wheat flour + 40% sorghum was only 0.281 N∙m.
The retrogradation stage of starch (C5) for the tested wheat flour and wheat–sorghum flour mixtures demonstrated similar differences as for C4 parameter.
From those presented above, it can be determined that, with regard to their baking quality, the flour mixtures studied can be categorized as flours adequate for bakery products.
The mixolab curves of the wheat control sample and of all three mixtures of wheat and sorghum flour are shown in Figure 5.

3.6. Bread Quality

The six bread samples obtained from the mixtures of wheat and sorghum flowers with and without L. plantarum and were analyzed compared to the control/trial sample of bread obtained only from wheat flour type 550 (ash = 0.55%), (Figure 6). The coding of the experimental bread samples was presented in Table 1. As it can be seen in Table 7, the porosity values of the bread samples obtained from the variants of mixtures are within limits of SR 878/1996 [38] (minimum 66%). The acidity of the bread samples does not exceed 1.6 degrees of acidity which is a value within the normal limits for wheat bread (max. 3.3%, SR 878-1996) [38]. The elasticity of the bread samples obtained from the flour mixtures was close, but significantly lower than that of the control sample [38].
It can be seen in Table 7 that the porosity decreases with increasing degree of sorghum replacement (porosity values for P1 (75.7 ± 0.45), P3 (71.8 ± 0.35), P5 (68.6 ± 0.55)). On the other hand, there is a negative influence of the addition of L. plantarum on the porosity, decreasing from P1 (75.7%) to P2 (71.3%), respectively P3 (71.8%) to P4 (66.7%), or from 68.6% (P5) to 64% (P6). In all cases of addition of sorghum, respectively L. plantarum, the porosity value was lower than that of the control sample (P7—77.8%). The same effects of adding sorghum can be seen on the elasticity since the value obtained in the case of the P7 control sample was considerably higher than all samples, with a value of 97%. The acidity was significantly influenced by the presence of L. plantarum, the values determined in samples P2 (1.2), P4 (1.2), and P6 (1.6) being significantly higher than the acidity of samples P1 (0.6), P3 (0.4), P5 (0.8), and P7 (1), respectively. The acidity of bread samples with the addition of L. plantarum was much higher than that of samples without L. plantarum, however within normal limits according to the Romanian standards in force (SR 878:1996). Taking into account these elements, we can conclude that the P4 sample ensures a balance between the benefits brought by a high intake of sorghum and L. plantarum, respectively the reduction of the organoleptic characteristics of the samples.

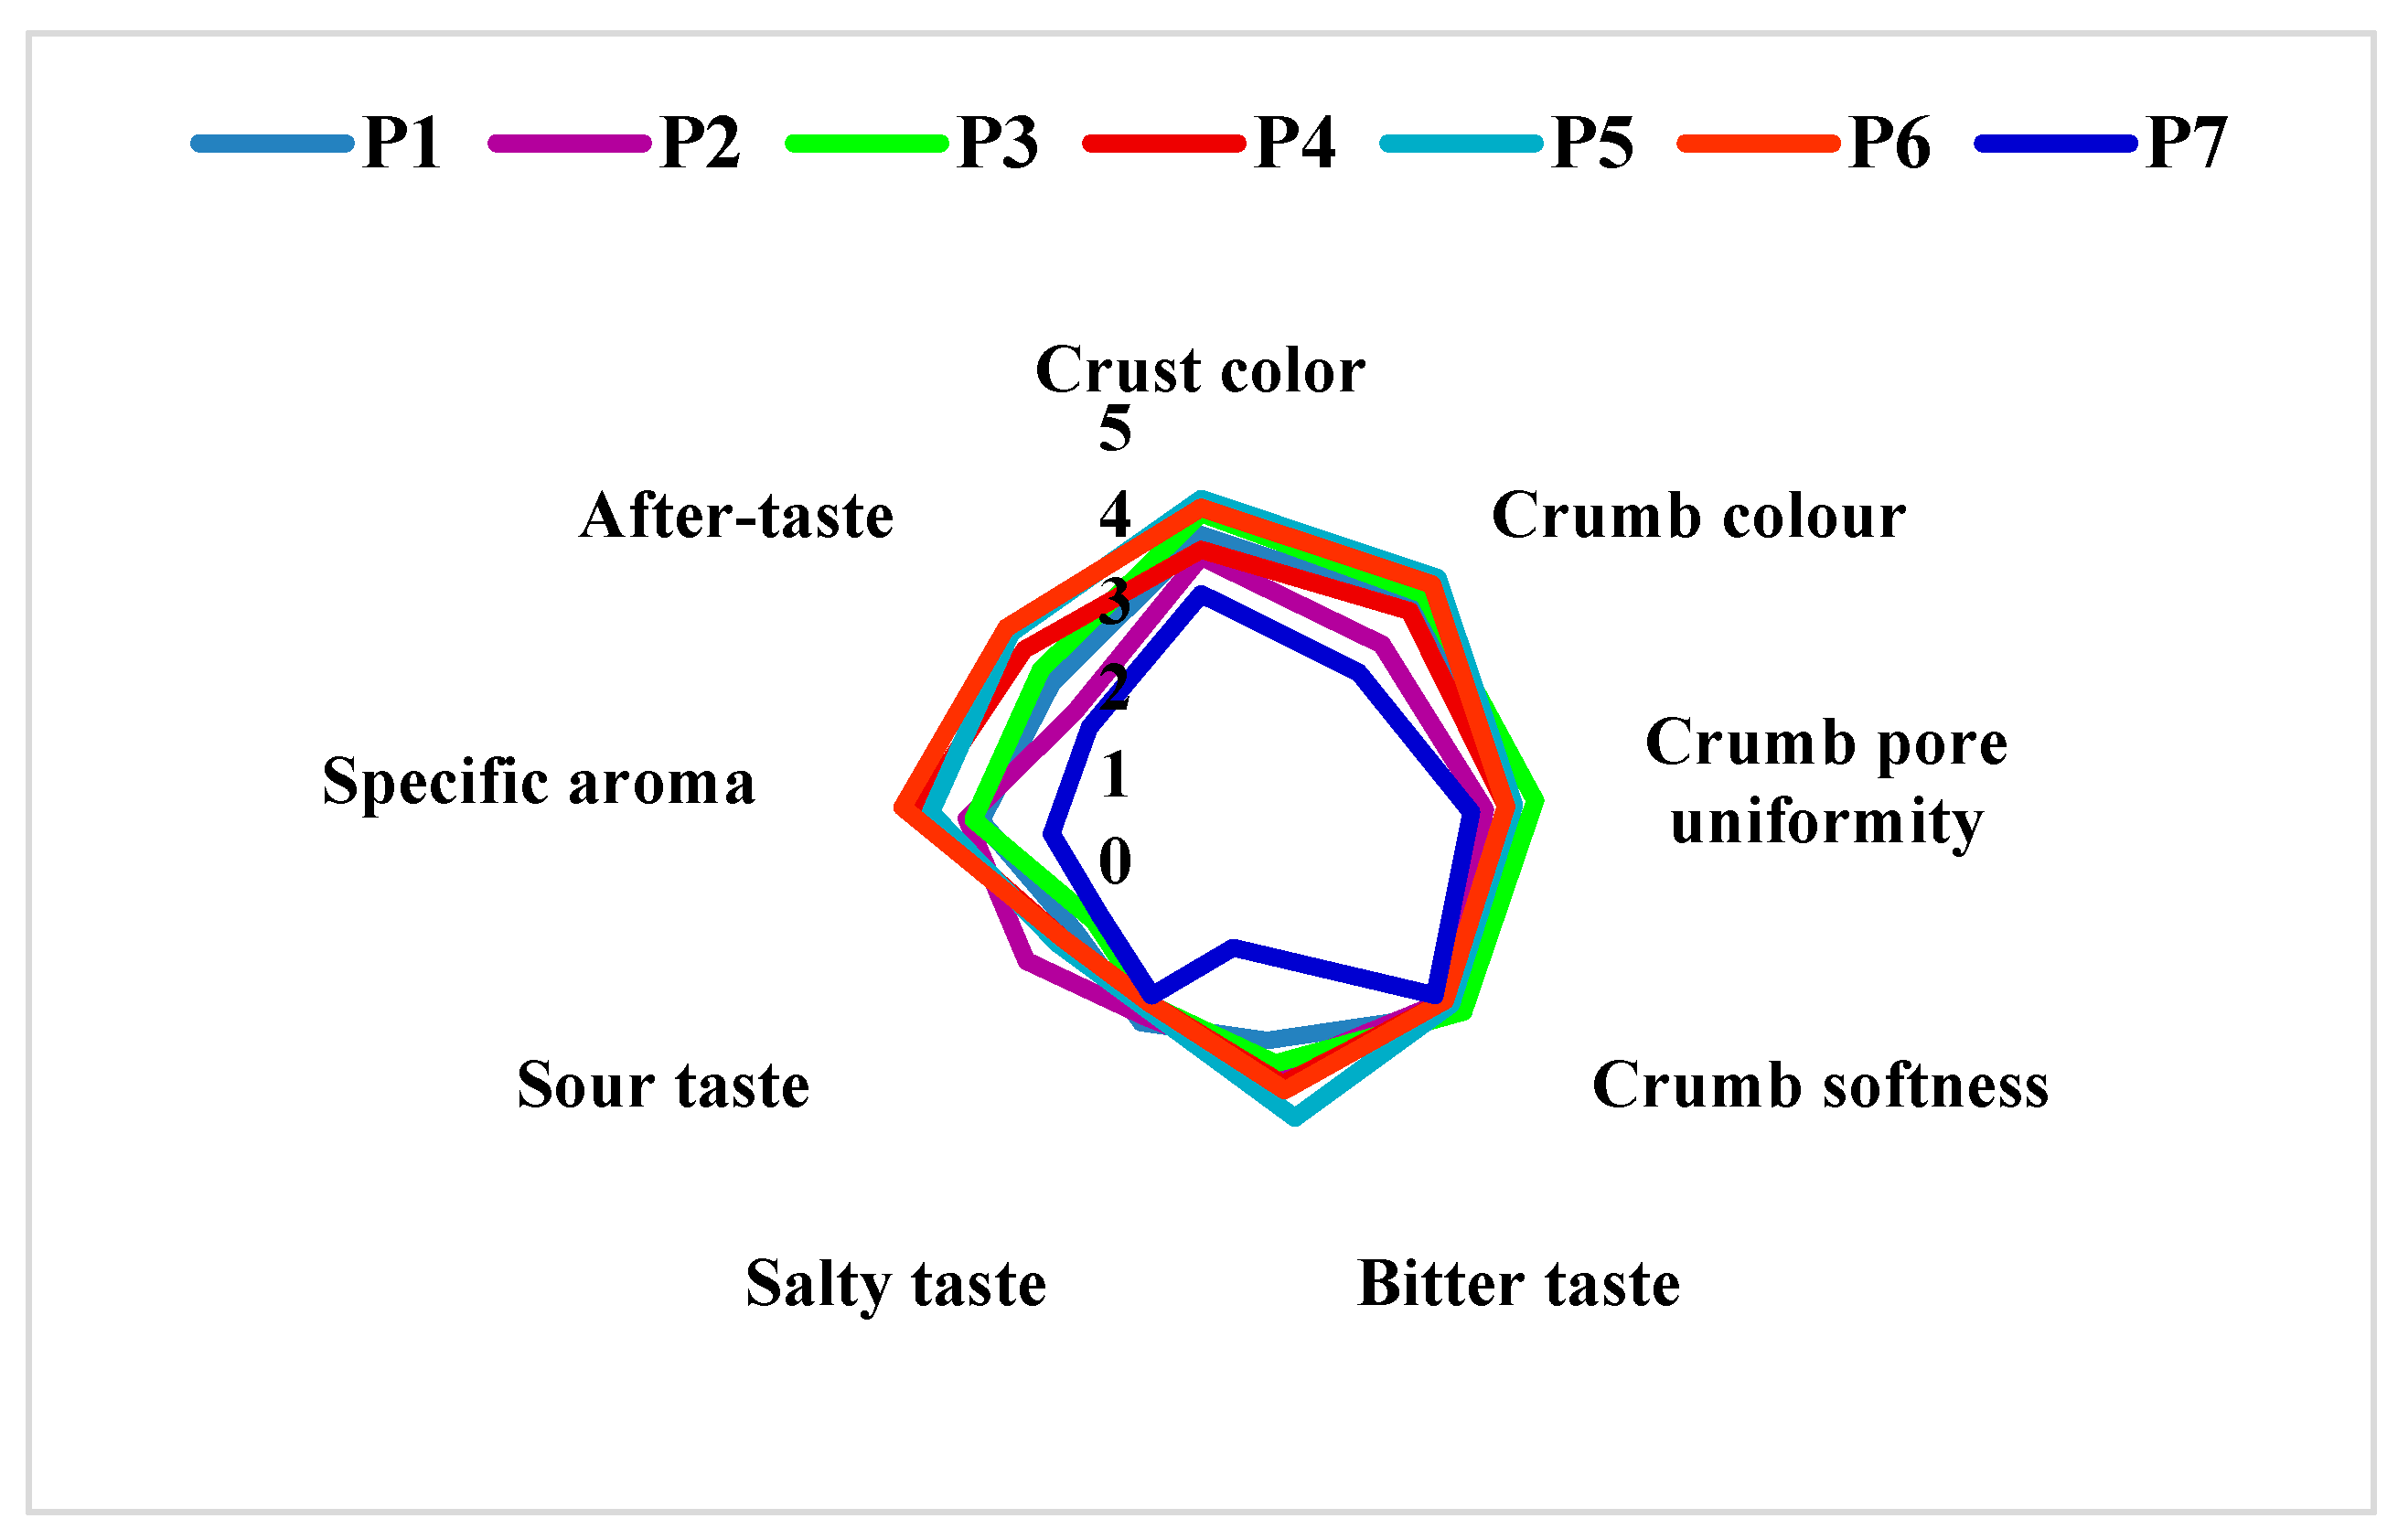
3.7. Sensory Evaluation

The sensory evaluation (Figure 7) of the bread samples was performed 24 h after baking. The bread samples received out of 9 points for overall acceptability the following scores: P1 = 7.17; P2 = 7.58; P3 = 7.03; P4 = 7.34; P5 = 6.95; P6 = 7.29 and control sample (P7) = 7.61. As it can be seen, all the tests got a score of 7 and 8, meaning between “I like it very much” and “I like it moderately”. However, all the samples with the same percentage of sorghum flour, but which used L. plantarum in the preparation obtained a higher score than the samples without L. plantarum (P1 vs. P2; P3 vs. P4 and P5 vs. P6). In the case of sensory analysis, we can highlight the P4 sample with a score of 7.34, as a variant that combines the positive effects of the addition of sorghum (35%) and L. plantarum.

4. Conclusions

The research presented in the paper demonstrates that sorghum flour is a cereal with a nutritional composition similar to that of whole wheat flour. Moreover, sorghum has a higher content of fat and crude fiber than whole wheat flour, and the content of monounsaturated fatty acids + polyunsaturated fatty acids (MUFA + PUFA,%) is higher than that of whole wheat.
Sorghum seeds have an important mineral content, 100 g of sorghum providing 21% of the daily reference intake for K, 81% of the daily reference intake for Fe and 91% of the daily reference intake for Mg, according to recommendation of the FDA. However, the in vitro protein digestibility (IPD) is lower than that of whole wheat flour.
The results of the rheological analyzes performed with the help of the Mixolab device showed that the addition of sorghum had a significant effect on water absorption, as well as small negative significant qualitative changes in protein composition and dough stability. There are no significant changes in starch degradation. From rheological point of view, it can be determined that, with regard to their baking quality, the flour mixtures studied can be categorized as flours adequate for bakery products.
Taking into consideration the physicochemical results and the sensorial ones, it can be concluded that the addition of 35% sorghum seeds and L. plantarum (0.3 g/100 g flour) is a variant that combines the benefits of high amounts of minerals (K, Mg, Fe) and is preferred by consumers.
The final conclusion of this study is that sorghum can be used to partially substitute wheat flour in the production of bakery products with acceptable physical and chemical characteristics.

Author Contributions

Conceptualization, L.A. and N.B.; Methodology, L.A., N.B. and O.B.O.; Software, L.G. and O.B.O.; Validation, L.A., N.B. and M.E.P.; Formal analysis, L.A., O.B.O. and L.G.; Writing—original draft preparation, L.A. and O.B.O.; Writing—review and editing, N.B. and L.G.; Supervision, M.E.P.; Project administration, L.A. and M.E.P.; Funding acquisition, L.G. and O.B.O. All authors have read and agreed to the published version of the manuscript.

Funding

This work was supported by a grant of the Romanian Ministry of Research and Innovation CCDI—UEFISCDI, “Complex system of integral capitalization of agricultural species with energy and food potential”, project number PN-III-P1-1.2-PCCDI-2017-0566, contract no. 9PCCDI/2018, within PNCDI III.

Acknowledgments

Authors wish to acknowledge the support of the Transilvania University of Brasov, Romania.

Conflicts of Interest

The authors declare no conflict of interest.

References

  1. Coulibaly, W.H.; Bouatenin, K.M.J.-P.; Boli, Z.B.I.A.; Alfred, K.K.; Bi, Y.C.T.; N’Sa, K.M.C.; Cot, M.; Djameh, C.; Djè, K.M. Influence of yeasts on bioactive compounds content of traditional sorghum beer (tchapalo) produced in Côte d’Ivoire. Curr. Res. Food Sci. 2020, 3, 195–200. [Google Scholar] [CrossRef] [PubMed]
  2. Devi, S.P.; Saravanakumar, M.; Mohandas, S. Identification of 3-deoxyanthocyanins from red sorghum (Sorghum bicolor) bran and its biological properties. Afr. J. Pure Appl. Chem. 2011, 5, 181–193. [Google Scholar] [CrossRef]
  3. Lim, T.K. Edible Medicinal and Non-Medicinal Plants; Springer: Dordrecht, The Netherlands, 2013; Volume 5, pp. 379–380. [Google Scholar] [CrossRef]
  4. Slima, S.B.; Trabelsi, I.; Ktari, N.; Bardaa, S.; Elkaroui, K.; Bouaziz, M.; Abdeslam, A.; Salah, R.B. Novel Sorghum bicolor (L.) seed olysaccharide structure, hemolytic and antioxidant activities, and laser burn wound healing effect. Int. J. Biol. Macromol. 2019, 132, 87–96. [Google Scholar] [CrossRef]
  5. Poquette, N.M.; Gu, X.; Lee, S.-O. Grain sorghum muffin reduces glucose and insulin responses in men. Food Funct. 2014, 5, 894–899. [Google Scholar] [CrossRef] [PubMed] [Green Version]
  6. Kasarda, D.D. Grains in relation to celiac disease. Cereal Foods World 2001, 46, 209–210. [Google Scholar]
  7. Chinedu, S.M.; Yusuf, S.O.; Maxwell, I.E. Fermentation of sorghum using yeast n(Saccharomyces cerevisiae) as a starter culture for burukutu production. Cont. J. Biol. Sci. 2010, 3, 63–74. [Google Scholar]
  8. Montemurro, M.; Coda, R.; Rizzello, C.G. Recent Advances in the Use of Sourdough Biotechnology in Pasta Making. Foods 2019, 8, 129. [Google Scholar] [CrossRef] [Green Version]
  9. Nionelli, L.; Montemurro, M.; Pontonio, E.; Verni, M.; Gobbetti, M.; Rizzello, C.G. Pro-technological and functional characterization of lactic acid bacteria to be used as starters for hemp (Cannabis sativa L.) sourdough fermentation and wheat bread fortification. Int. J. Food Microbiol. 2018, 279, 14–25. [Google Scholar] [CrossRef]
  10. Ogunsakin, A.; Sanni, A.; Banwo, K. Effect of legume addition on the physiochemical and sensorial attributes of sorghum-based sourdough bread. LWT 2020, 118, 108769. [Google Scholar] [CrossRef]
  11. De Vuyst, L.; Vrancken, G.; Ravyts, F.; Rimaux, T.; Weckx, S. Biodiversity, ecological determinants, and metabolic exploitation of sourdough microbiota. Food Microbiol. 2009, 26, 666–675. [Google Scholar] [CrossRef]
  12. Gobbetti, M.; Rizzello, C.G.; Di Cagno, R.; De Angelis, M. How the sourdough may affect the functional features of leavened baked goods. Food Microbiol. 2014, 37, 30–40. [Google Scholar] [CrossRef]
  13. Moroni, A.V.; Bello, F.D.; Arendt, E.K. Sourdough in gluten-free bread-making: An ancient technology to solve a novel issue? Food Microbiol. 2009, 26, 676–684. [Google Scholar] [CrossRef] [PubMed]
  14. Coda, R.; Rizzello, C.G.; Gobbetti, M. Use of sourdough fermentation and pseudo-cereals and leguminous flours for the making of a functional bread enriched of γ-aminobutyric acid (GABA). Int. J. Food Microbiol. 2010, 137, 236–245. [Google Scholar] [CrossRef]
  15. ICC Standard Method No.110/1, Determination of Moisture Content of Cereals and Cereal Products (Practical Method); International Association for Cereal Science and Technology: Vienna, Austria, 1976.
  16. ICC Standard Method No.104/1, Determination of Ash in Cereals and Cereal Products; International Association for Cereal Science and Technology: Vienna, Austria, 1990.
  17. SR 91:2007. Pâine şi Produse Proaspete de Patiserie. Metode de Analiză; ASRO Publisher House: Bucharest, Romania, 2007.
  18. Food and Agriculture Organization of the United Nations; World Health Organization; United Nations University. Energy and Protein Requirements. 1985. Available online: http://www.fao:3/aa040e/aa040e00.htm#TOC (accessed on 22 August 2020).
  19. Hsu, H.W.; Vavak, D.L.; Satterlee, D.L.; Mill, G.A. A multienzyme technique for estimating protein digestibility. J. Food Sci. 1977, 42, 1269–1273. [Google Scholar] [CrossRef]
  20. Malomo, S.A.; Aluko, R.E. Conversion of a low protein hemp seed meal into a functional protein concentrate through enzymatic digestion of fibre coupled with membrane ultrafiltration. Innov. Food Sci. Emerg. Technol. 2015, 31, 151–159. [Google Scholar] [CrossRef]
  21. AACC International. Approved Methods of the American Association of Cereal Chemists, 10th ed.; AACC International: St. Paul, MN, USA, 2000. [Google Scholar]
  22. AOAC. Methods of the Association of Official Analytical Chemists, 15th ed.; AOAC: Arlington, VA, USA, 1990; Volume II, p. 780. [Google Scholar]
  23. Morrison, W.R.; Smith, L.M. Preparation of fatty acid methyl esters and dimethylacetals from lipids with boron fluoride—Methanol. J. Lipid Res. 1964, 5, 600–608. [Google Scholar] [PubMed]
  24. ICC Standard No.173, Determination of Rheological Behaviour as a Fuction of Mixing and Temperature Increase; International Association for Cereal Sciences and Technology: Vienna, Austria, 2010.
  25. Chopin Technologies. Available online: https://chopin.fr/ (accessed on 7 September 2020).
  26. Dubat, A. A new AACC international approved method to measure rheological properties of a dough sample. Cereal Food World 2010, 55, 150–153. [Google Scholar] [CrossRef]
  27. Papoušková, L.; Capouchova, I.; Kostelanska, M.; Skeríkova, A.; Prokinova, E.; Hajslova, J. Changes in baking quality of winter wheat with different intensity of fusarium spp. contamination detected by means of new rheological system Mixolab. Czech J. Food Sci. 2011, 29, 420–429. [Google Scholar] [CrossRef] [Green Version]
  28. Mixolab Applications Handbook. Available online: http://concereal.net/wp-content/uploads/2017/03/2012-CHOPIN-Mixolab-Applications-Handbook-EN-SPAIN-3.pdf (accessed on 8 September 2020).
  29. Lawless, H.T.; Heymann, H. Sensory Evaluation of Food. Principles and Practices, 2nd ed.; Springer: New York, NY, USA, 2010. [Google Scholar] [CrossRef]
  30. Ogunsakin, O.A.; Banwo, K.; Ogunremi, O.R.; Sanni, A.I. Microbiological and physicochemical properties of sourdough bread from sorghum flour. Int. Food Res. J. 2015, 22, 2610–2618. [Google Scholar]
  31. Food and Drug Administration (FDA). Available online: https://www.fda.gov/drugs/science-and-research-drugs/regulatory-science-action (accessed on 13 September 2020).
  32. Whitaker, J.R.; Tannenbaum, S.R. Food Proteins; AVI: Westport, CT, USA, 1977; ISBN 0870052309. [Google Scholar] [CrossRef]
  33. Hegsted, D.M. ‘Assessment of protein quality’, in Improvement of protein nutriture. Natl. Acad. Sci. 1974, 64–88. [Google Scholar]
  34. Pihlanto, A.; Mäkinen, S. Antihypertensive Properties of Plant Protein Derived Peptides; Hernandez-Ledesma, B., Hsieh, C., Eds.; INTECH: Rijeka, Croatia, 2013. [Google Scholar]
  35. Marambe, H.K.; Shand, P.J.; Wanasundara, J.P.D. In vitro digestibility of flaxseed (Linum sitatissimum L.) protein: Effect of seed mucilage, oil and thermal processing. Int. J. Food Sci. Technol. 2013, 48, 628–635. [Google Scholar] [CrossRef]
  36. Mehmood, S.; Orhan, I.; Ahsan, Z.; Aslan, S.; Gulfraz, M. Fatty acid composition of seed oil of different Sorghum bicolor varieties. Food Chem. 2008, 109, 855–859. [Google Scholar] [CrossRef] [PubMed]
  37. Bordei, D. Tehnologia Modernă a Panificaţiei; Agir: Bucuresti, Romania, 2004; pp. 80–81. [Google Scholar]
  38. SR 878:1996. Pâine de Făină de Grâu; ASRO Publisher House: Bucharest, Romania, 1996.
Figure 1. Mixolab parameters.
Applsci 10 08597 g001
Figure 2. Chemical scores of amino acids of sorghum and whole wheat seeds. Note: *, **, *** Correlations significant at p < 0.05, p < 0.01, and p < 0.001, respectively.
Applsci 10 08597 g002
Figure 3. Spectra of GC–MS of fatty acid methyl esters of sorghum.
Applsci 10 08597 g003
Figure 4. Spectra of GC–MS for fatty acid methyl esters of whole wheat.
Applsci 10 08597 g004
Figure 5. The influence of substitution level of sorghum flour on the Mixolab curves.
Applsci 10 08597 g005
Figure 6. Bread samples ((a) P1 = 70% wheat + 30% sorghum without L. plantarum; (b) P2 = 70% wheat + 30% sorghum with L. plantarum; (c) 65% wheat + 35% sorghum without L. plantarum; (d) P4 = 65% wheat + 35% sorghum with L. plantarum; (e) P5 = 65% wheat + 35% sorghum without L. plantarum; (f) P6 = 65% wheat + 35% sorghum with L. plantarum; (g) P7 = 100% wheat flour (type 550)–control sample).
Applsci 10 08597 g006
Figure 7. Sensorial properties of bread samples. P1 = 70% wheat + 30% sorghum without L. plantarum; P2 = 70% wheat + 30% sorghum with L. plantarum; P3 = 65% wheat + 35% sorghum without L. plantarum; P4 = 65% wheat + 35% sorghum with L. plantarum; P5 = 65% wheat + 35% sorghum without L. plantarum; P6 = 65% wheat + 35% sorghum with L. plantarum; P7 = 100% wheat flour (type 550).
Applsci 10 08597 g007
Table 1. Types of flours used in the experiments.
P170% wheat flour (type 550) + 30% sorghum flour without L. plantarum
P270% wheat flour (type 550) + 30% sorghum flour with L. plantarum
P365% wheat flour (type 550) + 35% sorghum flour without L. plantarum
P465% wheat flour (type 550) + 35% sorghum flour with L. plantarum
P560% wheat flour (type 550) + 40% sorghum flour without L. plantarum
P660% wheat flour (type 550) + 40% sorghum flour with L. plantarum
P7100% wheat flour (type 550)
Note: The used amount of L. plantarum was 0.3 g/100 g flour mixture.
Table 2. Mixolab parameters correlation and significance.
ParameterCalculation MethodSignificance
Water Absorption (%)Quantity of water required to obtain C1 = 1.1 Nm +/− 0.05Amount of water taken up by flour to achieve the desired consistency and create a quality end-product.
Time for C1 (min)Time required to obtain C1Dough formation time: the stronger the flour, the longer it takes.
Stability (min)Time during which torque is > C1–11% (constant T° phase)Dough resistance to kneading: The longer it takes the ‘strengthen’ the dough.
Amplitude (Nm)Curve width at C1Dough elasticity: The higher the value, the greater the dough elasticity.
Sourse: MIXOLAB APPLICATIONS HANDBOOK—May 2012 edition [28].
Table 3. Chemical composition of sorghum and whole wheat flours.
ParameterSorghum Seed FlourWhole Wheat Flourp-Value (t-Test)
Moisture content (g/100 g)11.40 ± 0.10 a11.51 ± 0.09 a0.256
Ash (g/100 g)1.80 ± 0.01 a1.90 ± 0.02 b0.0015
Protein (g/100 g)11.80 ± 0.07 a12.80 ± 0.07 b<0.0001
Fat (g/100 g)3.70 ± 0.02 a2.35 ± 0.03 b<0.0001
Raw fiber (g/100 g)3.07 ± 0.08 a2.07 ± 0.06 b<0.0001
Starch (g/100 g)64.74 ± 0.15 a64.00 ± 0.44 a0.052
Potassium (mg/100 g d.m.)575 ± 1.73 a305.70 ± 1.14 b<0.0001
Magnesium (mg/100 g d.m.)296 ± 2.37 a78.70 ± 0.81 b<0.0001
Calcium (mg/100 g d.m.)3.50 ± 0.31 a41.20 ± 0.61 b<0.0001
Iron (mg/100 g d.m.)13.90 ± 0.09 a4.71 ± 0.10 b<0.0001
Zinc (mg/100 g d.m.)2.17 ± 0.03 a2.14 ± 0.03 a0.214
Manganese (mg/100 g d.m.)1.95 ± 0.04 a2.45 ± 0.07 b0.0003
Note: a,b Values are the means of triplicate determinations. The results are presented as mean values ± standard deviation. Different letters in the same row indicate significant diferences (p < 0.05).
Table 4. Amino acids composition of sorghum and whole wheat flours (g amino acid/100 g protein).
TypeAmino AcidsSorghum Seed FlourWhole Wheat Seed Flourp-Value (t-Test)
Essential amino acidsArginine3.65 ± 0.18 a4.30 ± 0.54 a0.123
Leucine12.84 ± 0.66 a6.69 ± 0.65 b<0.0001
Valine4.76 ± 0.24 a4.46 ± 0.43 a0.347
Lysine2.1 ± 0.40 a2.56 ± 0.73 a0.391
Phenylalanine4.65 ± 0.18 a4.63 ± 0.16 a0.909
Isoleucine3.65 ± 0.14 a3.14 ± 0.23 b0.029
Threonine2.77 ± 0.20 a2.73 ± 0.42 a0.888
Histidine1.88 ± 0.54 a2.40 ± 0.47 a0.272
Dispensable amino acidsGlutamic ac.19.93 ± 0.50 a26.20 ± 0.46 b<0.0001
Glycine3.1 ± 0.19 a4.21 ± 0.27 b0.004
Serine4.1 ± 0.43 a4.63 ± 0.55 a0.260
Proline8.41 ± 0.41 a10.50 ± 0.43 b0.003
Aspartic ac.5.54 ± 0.50 a3.31 ± 0.31 b0.002
Alanine8.41 ± 0.44 a3.31 ± 0.37 b<0.0001
Tyrosine2.99 ± 0.17 a1.57 ± 0.30 b0.0019
Methionine1.88 ± 0.14 a1.65 ± 0.12 a0.009
Cysteine1.33 ± 0.04 a2.31 ± 0.07 b<0.0001
Note: a,b The results are expressed as mean ± standard deviation. Different letters in the same row indicate significant diferences (t-Test, p < 0.05).
Table 5. Fatty acid composition of seed oil of whole wheat and sorghum seed.
Fatty AcidsRt (Min.)SorghumWhole Wheat
C14:0Tetradecanoic/Miristic26.210.04 ± 0.000.10 ± 0.01
C16:0Hexadecanoic/Palmitic33.5817.28 ± 0.9221.23 ± 0.15
C16:1n7Cis-9-hexadecenoic/Palmitoleic35.000.67 ± 0.080.16 ± 0.02
C18:0Octadecanoic/Stearic40.471.83 ± 0.231.22 ± 0.15
C18:1n9Cis-9-octadecenoic/Oleic41.6834.38 ± 0.7416.55 ± 0.14
C18:1n11Cis-11-octadecenoic/Cis-vaccenic41.942.28 ± 0.081.34 ± 0.13
C18:2n6Cis-9,12-octadecadienoic/Linoleic43.8342.29 ± 0.7155.25 ± 0.67
C18:3n3Cis-9,12,15-octadecatrienoic/α-linolenic46.270.76 ± 0.083.03 ± 0.01
C20:0Eicosanoic/Arahidic46.90.14 ± 0.020.11 ± 0.01
C20:1n9Cis-11-eicosenoic/Gondoic48.060.17 ± 0.020.72 ± 0.05
C22:0Docosanoic/Behenic52.860.06 ± 0.010.12 ± 0.01
C24:0Tetracosanoic/Lignoceric58.380.10 ± 0.010.18 ± 0.01
SFA, %19.4522.96
MUFA, %37.5018.77
PUFA, %43.0558.28
MUFA + PUFA, %80.5577.04
omega-3, %0.763.03
omega-6, %42.2955.25
omega-9, %34.5517.27
Table 6. Rheological characteristics of flour mixtures and wheat flour.
100% Wheat
Flour
70% Wheat Flour +
30% Sorghum Flour
65% Wheat Flour +
35% Sorghum Flour
60% Wheat Flour +
40% Sorghum Flour
Water Absorption (%)58.2 ± 0.06 a54.7 ± 0.06 b53.4 ± 0.1 c52.7 ± 0.1 c
Stability (min)9.15 ± 0.01 a8.69 ± 0.01 c8.82 ± 0.01 b8.51 ± 0.01 d
Amplitude (Nm)0.097 ± 0.001 c0.107 ± 0.001 b0.109 ± 0.001 b0.124 ± 0.002 a
C11.098 ± 0.01 a1.093 ± 0.01 a1.097 ± 0.01 a1.097 ± 0.01 a
C20.462 ± 0.01 a0.469 ± 0.01 a0.474 ± 0.01 a0.483 ± 0.01 a
C31.924 ± 0.01 c1.995 ± 0.01 b2.040 ± 0.01 a2.048 ± 0.02 a
C41.809 ± 0.01 d1.939 ± 0.01 c1.998 ± 0.02 b2.090 ± 0.03 a
C53.049 ± 0.01 c3.139 ± 0.01 b3.138 ± 0.02 b3.233 ± 0.02 a
Note: a,b The results are expressed as mean ± standard deviation. Different letters in the same row indicate significant diferences (p < 0.05).
Table 7. Physico-chemical results for the experimental bread samples.
SampleMass (g)Volume (cm3)Porosity (%)Elasticity (%)Diameter (mm)Humidity (%)Acidity (Degree)
P1620 ± 0.01 e290 ± 2.87 b75.7 ± 0.45 b92 ± 0.94 b15.75 ± 0.09 a44.40 ± 0.10 b0.6 ± 0.09 e
P2620 ± 0.01 e242 ± 2.63 c71.3 ± 0.55 c90 ± 0.82 b15.50 ± 0.10 a43.57 ± 0.10 c,d1.2 ± 0.10 b
P3624 ± 0.02 d236 ± 2.68 d71.8 ± 0.35 c76 ± 0.45 c15.75 ± 0.10 a44.41 ± 0.10 b0.4 ± 0.06 f
P4625 ± 0.01 c218 ± 2.68 f66.7 ± 0.50 e75 ± 0.82 c,d15.40 ± 0.10 b43.66 ± 0.16 c1.2 ± 0.10 b
P5626 ± 0.02 b225 ± 2.69 e68.6 ± 0.55 d74 ± 0.47 c,d15.65 ± 0.08 a45.09 ± 0.12 a0.8 ± 0.09 d
P6624 ± 0.02 d218 ± 2.67 f64 ± 0.63 f72 ± 0.82 e15.55 ± 0.08 a43.84 ± 0.11 c1.6 ± 0.10 a
P7628 ± 0.02 a299 ± 2.89 a77.8 ± 0.60 a97 ± 0.94 a15.85 ± 0.09 a43.42 ± 0.12 c1.0 ± 0.10 c
Note: a,b,c,d,e Each value represents a mean of three replicates. The results are expressed as mean ± standard deviation. Values followed by different letters in the same column are significantly different (p < 0.05).
Publisher’s Note: MDPI stays neutral with regard to jurisdictional claims in published maps and institutional affiliations.

